ENERGY STAR Power and Performance Data Sheet - Nec
ENERGY STAR Power and Performance Data Sheet - Nec
ENERGY STAR Power and Performance Data Sheet - Nec

You also want an ePaper? Increase the reach of your titles
YUMPU automatically turns print PDFs into web optimized ePapers that Google loves.
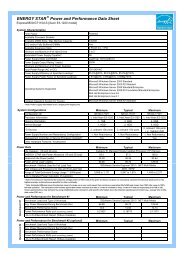
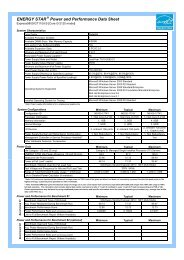
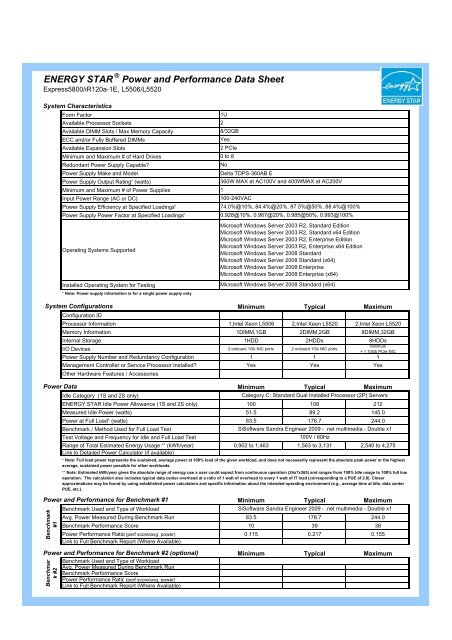
<strong>ENERGY</strong> <strong>STAR</strong> ® <strong>Power</strong> <strong>and</strong> <strong>Performance</strong> <strong>Data</strong> <strong>Sheet</strong>Express5800/iR120a-1E, L5506/L5520System CharacteristicsForm FactorAvailable Processor SocketsAvailable DIMM Slots / Max Memory CapacityECC <strong>and</strong>/or Fully Buffered DIMMsAvailable Expansion SlotsMinimum <strong>and</strong> Maximum # of Hard DrivesRedundant <strong>Power</strong> Supply Capable?<strong>Power</strong> Supply Make <strong>and</strong> Model<strong>Power</strong> Supply Output Rating* (watts)Minimum <strong>and</strong> Maximum # of <strong>Power</strong> SuppliesInput <strong>Power</strong> Range (AC or DC)<strong>Power</strong> Supply Efficiency at Specified Loadings*<strong>Power</strong> Supply <strong>Power</strong> Factor at Specified Loadings*Operating Systems SupportedInstalled Operating System for Testing* Note: <strong>Power</strong> supply information is for a single power supply only1U28/32GBYes2 PCIe0 to 8NoDelta TDPS-360AB E360W MAX at AC100V <strong>and</strong> 400WMAX at AC200V1100-240VAC74.0%@10%, 84.4%@20%, 87.5%@50%, 88.4%@100%0.928@10%, 0.967@20%, 0.985@50%, 0.993@100%Microsoft Windows Server 2003 R2, St<strong>and</strong>ard EditionMicrosoft Windows Server 2003 R2, St<strong>and</strong>ard x64 EditionMicrosoft Windows Server 2003 R2, Enterprise EditionMicrosoft Windows Server 2003 R2, Enterprise x64 EditionMicrosoft Windows Server 2008 St<strong>and</strong>ardMicrosoft Windows Server 2008 St<strong>and</strong>ard (x64)Microsoft Windows Server 2008 EnterpriseMicrosoft Windows Server 2008 Enterprise (x64)Microsoft Windows Server 2008 St<strong>and</strong>ard (x64)System ConfigurationsMinimum Typical MaximumConfiguration IDProcessor Information 1,Intel Xeon L5506 2,Intel Xeon L5520 2,Intel Xeon L5520Memory Information 1DIMM,1GB 2DIMM,2GB 8DIMM,32GBInternal Storage 1HDD 2HDDs 8HDDsI/O Devices 2 onboard 1Gb NIC ports 2 onboard 1Gb NIC portsminimum+ 1 10Gb PCIe NIC<strong>Power</strong> Supply Number <strong>and</strong> Redundancy Configuration 1 1 1Management Controller or Service Processor Installed? Yes Yes YesOther Hardware Features / Accessories<strong>Power</strong> <strong>Data</strong>Minimum Typical MaximumIdle Category (1S <strong>and</strong> 2S only)Category C: St<strong>and</strong>ard Dual Installed Processor (2P) Servers<strong>ENERGY</strong> <strong>STAR</strong> Idle <strong>Power</strong> Allowance (1S <strong>and</strong> 2S only) 100 108 212Measured Idle <strong>Power</strong> (watts) 51.5 89.2 145.0<strong>Power</strong> at Full Load* (watts) 83.5 178.7 244.0Benchmark / Method Used for Full Load TestTest Voltage <strong>and</strong> Frequency for Idle <strong>and</strong> Full Load TestSiSoftware S<strong>and</strong>ra Engineer 2009 - .net multimedia - Double x1100V / 60HzRange of Total Estimated Energy Usage ** (kWh/year) 0,902 to 1,463 1,563 to 3,131 2,540 to 4,275Link to Detailed <strong>Power</strong> Calculator (if available)<strong>Power</strong> <strong>and</strong> <strong>Performance</strong> for Benchmark #1Minimum Typical MaximumBenchmark Used <strong>and</strong> Type of WorkloadSiSoftware S<strong>and</strong>ra Engineer 2009 - .net multimedia - Double x1Avg. <strong>Power</strong> Measured During Benchmark Run 83.5 178.7 244.0Benchmark <strong>Performance</strong> Score 10 39 38<strong>Power</strong> <strong>Performance</strong> Ratio (perf score/avg. power) 0.115 0.217 0.155Link to Full Benchmark Report (Where Available)Benchmark#1Benchmark #2* Note: Full load power represents the sustained, average power at 100% load of the given workload, <strong>and</strong> does not necessarily represent the absolute peak power or the highestaverage, sustained power possible for other workloads.** Note: Estimated kWh/year gives the absolute range of energy use a user could expect from continuous operation (24x7x365) <strong>and</strong> ranges from 100% Idle usage to 100% full loadoperation. The calculation also includes typical data center overhead at a ratio of 1 watt of overhead to every 1 watt of IT load (corresponding to a PUE of 2.0). Closerapproximations may be found by using established power calculators <strong>and</strong> specific information about the intended operating environment (e.g., average time at Idle, data centerPUE, etc.).<strong>Power</strong> <strong>and</strong> <strong>Performance</strong> for Benchmark #2 (optional)Benchmark Used <strong>and</strong> Type of WorkloadAvg. <strong>Power</strong> Measured During Benchmark RunBenchmark <strong>Performance</strong> Score<strong>Power</strong> <strong>Performance</strong> Ratio (perf score/avg. power)Link to Full Benchmark Report (Where Available)Minimum Typical Maximum
<strong>ENERGY</strong> <strong>STAR</strong> <strong>Power</strong> <strong>and</strong> <strong>Performance</strong> <strong>Data</strong> <strong>Sheet</strong>Express5800/iR120a-1E, L5506/L5520Page 2 of 3<strong>Power</strong> Saving FeaturesProcessor Dynamic Voltage <strong>and</strong> Frequency ScalingProcessor or Core Reduced <strong>Power</strong> States<strong>Power</strong> CappingVariable Speed Fan Control Based on <strong>Power</strong> or Thermal ReadingsLow <strong>Power</strong> Memory StatesLow <strong>Power</strong> I/O StatesLiquid Cooling CapabilityOther1:Other2:Other3:Other4:Enabled onShipmentYesYesYesYesNoNoNoEnd-User EnablingRequiredNoNoYesNoNoNoNo<strong>Power</strong> <strong>and</strong> Temperature Measurement <strong>and</strong> ReportingInput <strong>Power</strong> Available & Accuracy?Input Air Temp Available & Accuracy?Processor Utilization Available?Other <strong>Data</strong> Measurements Available & Accuracy?Compatible Protocols for <strong>Data</strong> CollectionAveraging method <strong>and</strong> time periodYes, +/- 10% for 20%-100% of max PSU loadYes, +/- 2(゚c)YesIPMINon Averaging, 1 sec. interval sampling.Thermal Information *Minimum Typical MaximumTotal <strong>Power</strong> Dissipation (watts) 83.5 178.7 244.0Delta Temperature at Exhaust at Peak Temp. (˚C) 5.9 10.4 14.6Airflow at Maximum Fan Speed (CFM) at Peak Temp. 39.0 44.0 36.0Airflow at Nominal Fan Speed (CFM) at Nominal Temp. 21.0 26.5 21.0Notes* References: ASHRAE Extended Environmental Envelope Final August 1, 2008Thermal Guidelines for <strong>Data</strong> Processing Environments, ASHRAE, 2004, ISBN 1-931862-43-5Peak temperature is defined as 35 ˚C, Nominal Temperature is defined as 18 - 27 ˚C1. SPECpower_ssj2008 is a registered trademark of the St<strong>and</strong>ard <strong>Performance</strong> Evaluation Corporation (SPEC). Benchmark results stated above reflect results published on XX/XX/XX. Forthe latest SPECpower_ssj2008 benchmark results, visit http://www.spec.org/power_ssj2008.<strong>ENERGY</strong> <strong>STAR</strong> Qualified ConfigurationsInclude specific information on <strong>ENERGY</strong> <strong>STAR</strong> Qualified SKUs or configurationsQualified configuration ID: N8100-1576Y, N8100-1577Y, N8100-1579Y, N8100-1580Y
<strong>ENERGY</strong> <strong>STAR</strong> <strong>Power</strong> <strong>and</strong> <strong>Performance</strong> <strong>Data</strong> <strong>Sheet</strong>Express5800/iR120a-1E, L5506/L5520Page 3 of 3<strong>ENERGY</strong> <strong>STAR</strong> Qualified Configurations (Continued)Include specific information on <strong>ENERGY</strong> <strong>STAR</strong> Qualified SKUs or configurations