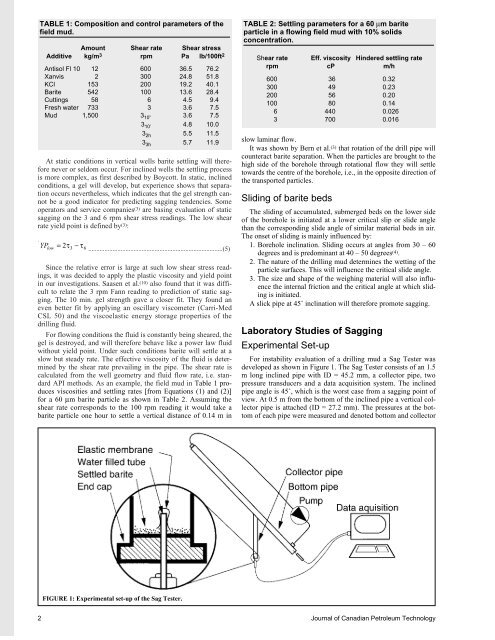
TABLE 1: Compositi<strong>on</strong> and c<strong>on</strong>trol parameters of thefield mud.Amount Shear rate Shear stressAdditive kg/m 3 rpm Pa lb/100ft 2Antisol Fl 10 12 600 36.5 76.2Xanvis 2 300 24.8 51.8KCl 153 200 19.2 40.1Barite 542 100 13.6 28.4Cuttings 58 6 4.5 9.4Fresh water 733 3 3.6 7.5Mud 1,500 3 10” 3.6 7.53 10’ 4.8 10.03 2h 5.5 11.53 3h 5.7 11.9At static c<strong>on</strong>diti<strong>on</strong>s in vertical wells barite settling will thereforenever or seldom occur. For inclined wells the settling processis more complex, as first described by Boycott. In static, inclinedc<strong>on</strong>diti<strong>on</strong>s, a gel will develop, but experience shows that separati<strong>on</strong>occurs nevertheless, which indicates that the gel strength cannotbe a good indicator for predicting sagging tendencies. Someoperators and service companies (3) are basing evaluati<strong>on</strong> of staticsagging <strong>on</strong> the 3 and 6 rpm shear stress readings. The low shearrate yield point is defined by (3) :YP low = 2τ3 −τ6 ...................................................................................(5)Since the relative error is large at such low shear stress readings,it was decided to apply the plastic viscosity and yield pointin our investigati<strong>on</strong>s. Saasen et al. (10) also found that it was difficultto relate the 3 rpm Fann reading to predicti<strong>on</strong> of static sagging.The 10 min. gel strength gave a closer fit. They found aneven better fit by applying an oscillary viscometer (Carri-MedCSL 50) and the viscoelastic energy storage properties of thedrilling fluid.For flowing c<strong>on</strong>diti<strong>on</strong>s the fluid is c<strong>on</strong>stantly being sheared, thegel is destroyed, and will therefore behave like a power law fluidwithout yield point. Under such c<strong>on</strong>diti<strong>on</strong>s barite will settle at aslow but steady rate. The effective viscosity of the fluid is determinedby the shear rate prevailing in the pipe. The shear rate iscalculated from the well geometry and fluid flow rate, i.e. standardAPI methods. As an example, the field mud in Table 1 producesviscosities and settling rates [from Equati<strong>on</strong>s (1) and (2)]for a 60 µm barite particle as shown in Table 2. Assuming theshear rate corresp<strong>on</strong>ds to the 100 rpm reading it would take abarite particle <strong>on</strong>e hour to settle a vertical distance of 0.14 m inTABLE 2: Settling parameters for a 60 µm bariteparticle in a flowing field mud with 10% solidsc<strong>on</strong>centrati<strong>on</strong>.Shear rate Eff. viscosity Hindered settling raterpm cP m/h600 36 0.32300 49 0.23200 56 0.20100 80 0.146 440 0.0263 700 0.016slow laminar flow.It was shown by Bern et al. (3) that rotati<strong>on</strong> of the drill pipe willcounteract barite separati<strong>on</strong>. When the particles are brought to thehigh side of the borehole through rotati<strong>on</strong>al flow they will settletowards the centre of the borehole, i.e., in the opposite directi<strong>on</strong> ofthe transported particles.Sliding of barite bedsThe sliding of accumulated, submerged beds <strong>on</strong> the lower sideof the borehole is initiated at a lower critical slip or slide anglethan the corresp<strong>on</strong>ding slide angle of similar material beds in air.The <strong>on</strong>set of sliding is mainly influenced by:1. Borehole inclinati<strong>on</strong>. Sliding occurs at angles from 30 – 60degrees and is predominant at 40 – 50 degrees (4) .2. The nature of the drilling mud determines the wetting of theparticle surfaces. This will influence the critical slide angle.3. The size and shape of the weighing material will also influencethe internal fricti<strong>on</strong> and the critical angle at which slidingis initiated.A slick pipe at 45˚ inclinati<strong>on</strong> will therefore promote sagging.Laboratory Studies of <strong>Sag</strong>gingExperimental Set-upFor instability evaluati<strong>on</strong> of a drilling mud a <strong>Sag</strong> Tester wasdeveloped as shown in Figure 1. The <strong>Sag</strong> Tester c<strong>on</strong>sists of an 1.5m l<strong>on</strong>g inclined pipe with ID = 45.2 mm, a collector pipe, twopressure transducers and a data acquisiti<strong>on</strong> system. The inclinedpipe angle is 45˚, which is the worst case from a sagging point ofview. At 0.5 m from the bottom of the inclined pipe a vertical collectorpipe is attached (ID = 27.2 mm). The pressures at the bottomof each pipe were measured and denoted bottom and collectorFIGURE 1: Experimental set-up of the <strong>Sag</strong> Tester.2 Journal of Canadian Petroleum Technology
FIGURE 2: Pressure changes for a stable mud (mud A) understatic test c<strong>on</strong>diti<strong>on</strong>s. The pressures in both pipes are identical.pressures, respectively. The pressure range of the high precisi<strong>on</strong>transducers (H<strong>on</strong>eywell ST 3000) was 25 kPa with an accuracy of± 0.1%. Filled with a 1,500 kg/m 3 mud the hydrostatic pressurewas 15.5 kPa, meaning that the accuracy for the <strong>Sag</strong> Tester wasapproximately 0.2% when filled with this mud. Data measuredfrom all sensors were taken at time intervals from <strong>on</strong>e to 10 minutes,for periods up to 15 hours.The experimental set-up is based <strong>on</strong> the idea that changes in thedrilling mud density as a result of segregati<strong>on</strong> will cause pressurechanges in the mud column. If the mud is stable, the hydrostaticpressure will remain c<strong>on</strong>stant, and there will be little or no differencebetween the collector and the bottom pressure.In the case of an unstable drilling mud, even though it had gelstrength higher than the minimum to avoid settling, a barite bedwill form <strong>on</strong> the lower side of the inclined pipe. This process willcause a reducti<strong>on</strong> of the drilling mud density, and a corresp<strong>on</strong>dingreducti<strong>on</strong> in bottom and collector pressures. The pressures measuredat the bottom of the two pipes will decrease in a similar wayand will be nearly equal for both. If the solid particles accumulated<strong>on</strong> the lower side start to slide, they will fall into the collectorpipe due to gravity and stay in suspensi<strong>on</strong> for up to several hoursbecause the settling distance is large. The increase of the weighingmaterial c<strong>on</strong>centrati<strong>on</strong> in the collector pipe will increase the muddensity and thus the hydrostatic collector pressure. The pressure inthe collector pipe will differ from that in the inclined pipe; it willdecrease less than the bottom pressure or it will remain c<strong>on</strong>stantor even increase if the mud is very unstable. A difference betweenthe collector and bottom pressures will indicate an unstable mud.The stability behaviour in the sag tester will then be:• Stable mud: collector and bottom pressures are almost c<strong>on</strong>stantand close to each other. Stable, static mud behaviour isplotted in Figure 2 and 3.• Unstable mud: collector pressure is higher than bottom pressuresand both are decreasing with time. Typical pressurebehaviour of an unstable drilling mud under static c<strong>on</strong>diti<strong>on</strong>sis shown in Figure 4.As seen from the two plots the stable mud shows no changes inthe measured collector and bottom pressure, while the unstabledrilling mud shows a pressure difference around 2% after threehours, and a collector pressure that is nearly c<strong>on</strong>stant.As a quality c<strong>on</strong>trol, the sag tester was initially calibrated withwater which, as expected, showed c<strong>on</strong>stant pressures.Laboratory test proceduresFor most of the tests a commercial mud, supplied by <strong>Sag</strong>aPetroleum was used. Its data are shown in Table 1. This mud wastreated with water, prehydrated bent<strong>on</strong>ite, Na 2 CO 3 and barite indifferent porti<strong>on</strong>s to vary rheology and thus stability. Prior to teststhe treated mud was aged for 24 hours. Static tests were run for upto 12 hours while the flow tests were run for 2 hours, which wasFIGURE 3: Pressure changes for a slightly less stable mud (mudB) under static test c<strong>on</strong>diti<strong>on</strong>s.FIGURE 4: Pressure changes for an unstable mud (mud C) understatic test c<strong>on</strong>diti<strong>on</strong>s.found to be sufficient to characterise the mud. The rheology andgel strength parameters were measured with a Fann rheometer (11) ,and the density with an API mud balance (11) .Four different tests were run; static, pressure pulsing, pist<strong>on</strong>agitati<strong>on</strong> and pumping of mud. In the static tests, the mud waspoured into the sag tester and then left undisturbed. To simulatethe effect of pressure surges which in the wellbore are caused byan accelerating and decelerating drill string, a pressure pulse of0.1 MPa was applied to the top of the tester. Sharp pulses wereapplied every 2.5 min during the time frame from 1.5 to twohours. To simulate tripping operati<strong>on</strong>s and the effect of drill pipe,tool joints, stabiliser and bit movement al<strong>on</strong>g the wellbore, ametal rod with a pist<strong>on</strong> (OD = 30 mm) in fr<strong>on</strong>t was moved outand in of the inclined pipe every 2.5 min. starting 1.5 hours aftermud was poured into the <strong>Sag</strong> Tester and lasting for 0.5 hour. Thepurpose of pulse testing was to investigate if barite sag would beaccelerated by small disturbances in the mud. During the flowtests the mud was circulated from the bottom of the inclined pipeusing a centrifugal pump at a c<strong>on</strong>stant flow rate giving a speed ofabout 0.15 m/sec. In all flow tests the Reynolds number rangedbetween 500 – 1,500.ResultsIn all, more than 200 tests were carried out and the pressureplots presented here are typical behaviour of stable and unstablemuds. All data from the experiments with the <strong>Sag</strong> Tester are plottedas per cent pressure change from the initial pressure versustime. Fluid properties for the test results presented in the graphsSpecial Volume I 3