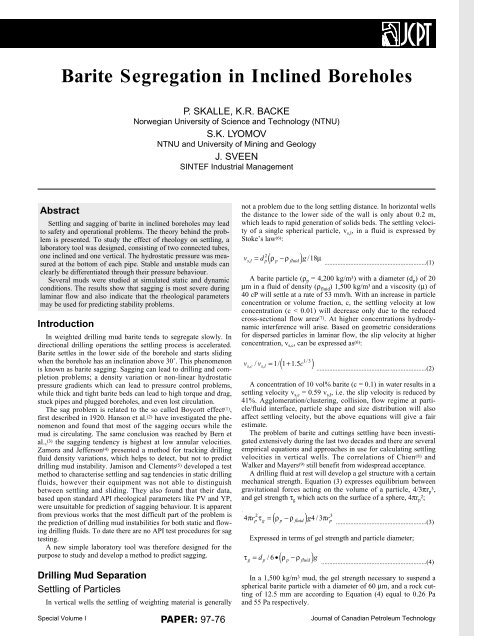
JCPT-paper-on-Sag - Drilling Engineering Association
JCPT-paper-on-Sag - Drilling Engineering Association
JCPT-paper-on-Sag - Drilling Engineering Association
Create successful ePaper yourself
Turn your PDF publications into a flip-book with our unique Google optimized e-Paper software.
TABLE 1: Compositi<strong>on</strong> and c<strong>on</strong>trol parameters of thefield mud.Amount Shear rate Shear stressAdditive kg/m 3 rpm Pa lb/100ft 2Antisol Fl 10 12 600 36.5 76.2Xanvis 2 300 24.8 51.8KCl 153 200 19.2 40.1Barite 542 100 13.6 28.4Cuttings 58 6 4.5 9.4Fresh water 733 3 3.6 7.5Mud 1,500 3 10” 3.6 7.53 10’ 4.8 10.03 2h 5.5 11.53 3h 5.7 11.9At static c<strong>on</strong>diti<strong>on</strong>s in vertical wells barite settling will thereforenever or seldom occur. For inclined wells the settling processis more complex, as first described by Boycott. In static, inclinedc<strong>on</strong>diti<strong>on</strong>s, a gel will develop, but experience shows that separati<strong>on</strong>occurs nevertheless, which indicates that the gel strength cannotbe a good indicator for predicting sagging tendencies. Someoperators and service companies (3) are basing evaluati<strong>on</strong> of staticsagging <strong>on</strong> the 3 and 6 rpm shear stress readings. The low shearrate yield point is defined by (3) :YP low = 2τ3 −τ6 ...................................................................................(5)Since the relative error is large at such low shear stress readings,it was decided to apply the plastic viscosity and yield pointin our investigati<strong>on</strong>s. Saasen et al. (10) also found that it was difficultto relate the 3 rpm Fann reading to predicti<strong>on</strong> of static sagging.The 10 min. gel strength gave a closer fit. They found aneven better fit by applying an oscillary viscometer (Carri-MedCSL 50) and the viscoelastic energy storage properties of thedrilling fluid.For flowing c<strong>on</strong>diti<strong>on</strong>s the fluid is c<strong>on</strong>stantly being sheared, thegel is destroyed, and will therefore behave like a power law fluidwithout yield point. Under such c<strong>on</strong>diti<strong>on</strong>s barite will settle at aslow but steady rate. The effective viscosity of the fluid is determinedby the shear rate prevailing in the pipe. The shear rate iscalculated from the well geometry and fluid flow rate, i.e. standardAPI methods. As an example, the field mud in Table 1 producesviscosities and settling rates [from Equati<strong>on</strong>s (1) and (2)]for a 60 µm barite particle as shown in Table 2. Assuming theshear rate corresp<strong>on</strong>ds to the 100 rpm reading it would take abarite particle <strong>on</strong>e hour to settle a vertical distance of 0.14 m inTABLE 2: Settling parameters for a 60 µm bariteparticle in a flowing field mud with 10% solidsc<strong>on</strong>centrati<strong>on</strong>.Shear rate Eff. viscosity Hindered settling raterpm cP m/h600 36 0.32300 49 0.23200 56 0.20100 80 0.146 440 0.0263 700 0.016slow laminar flow.It was shown by Bern et al. (3) that rotati<strong>on</strong> of the drill pipe willcounteract barite separati<strong>on</strong>. When the particles are brought to thehigh side of the borehole through rotati<strong>on</strong>al flow they will settletowards the centre of the borehole, i.e., in the opposite directi<strong>on</strong> ofthe transported particles.Sliding of barite bedsThe sliding of accumulated, submerged beds <strong>on</strong> the lower sideof the borehole is initiated at a lower critical slip or slide anglethan the corresp<strong>on</strong>ding slide angle of similar material beds in air.The <strong>on</strong>set of sliding is mainly influenced by:1. Borehole inclinati<strong>on</strong>. Sliding occurs at angles from 30 – 60degrees and is predominant at 40 – 50 degrees (4) .2. The nature of the drilling mud determines the wetting of theparticle surfaces. This will influence the critical slide angle.3. The size and shape of the weighing material will also influencethe internal fricti<strong>on</strong> and the critical angle at which slidingis initiated.A slick pipe at 45˚ inclinati<strong>on</strong> will therefore promote sagging.Laboratory Studies of <strong>Sag</strong>gingExperimental Set-upFor instability evaluati<strong>on</strong> of a drilling mud a <strong>Sag</strong> Tester wasdeveloped as shown in Figure 1. The <strong>Sag</strong> Tester c<strong>on</strong>sists of an 1.5m l<strong>on</strong>g inclined pipe with ID = 45.2 mm, a collector pipe, twopressure transducers and a data acquisiti<strong>on</strong> system. The inclinedpipe angle is 45˚, which is the worst case from a sagging point ofview. At 0.5 m from the bottom of the inclined pipe a vertical collectorpipe is attached (ID = 27.2 mm). The pressures at the bottomof each pipe were measured and denoted bottom and collectorFIGURE 1: Experimental set-up of the <strong>Sag</strong> Tester.2 Journal of Canadian Petroleum Technology
FIGURE 2: Pressure changes for a stable mud (mud A) understatic test c<strong>on</strong>diti<strong>on</strong>s. The pressures in both pipes are identical.pressures, respectively. The pressure range of the high precisi<strong>on</strong>transducers (H<strong>on</strong>eywell ST 3000) was 25 kPa with an accuracy of± 0.1%. Filled with a 1,500 kg/m 3 mud the hydrostatic pressurewas 15.5 kPa, meaning that the accuracy for the <strong>Sag</strong> Tester wasapproximately 0.2% when filled with this mud. Data measuredfrom all sensors were taken at time intervals from <strong>on</strong>e to 10 minutes,for periods up to 15 hours.The experimental set-up is based <strong>on</strong> the idea that changes in thedrilling mud density as a result of segregati<strong>on</strong> will cause pressurechanges in the mud column. If the mud is stable, the hydrostaticpressure will remain c<strong>on</strong>stant, and there will be little or no differencebetween the collector and the bottom pressure.In the case of an unstable drilling mud, even though it had gelstrength higher than the minimum to avoid settling, a barite bedwill form <strong>on</strong> the lower side of the inclined pipe. This process willcause a reducti<strong>on</strong> of the drilling mud density, and a corresp<strong>on</strong>dingreducti<strong>on</strong> in bottom and collector pressures. The pressures measuredat the bottom of the two pipes will decrease in a similar wayand will be nearly equal for both. If the solid particles accumulated<strong>on</strong> the lower side start to slide, they will fall into the collectorpipe due to gravity and stay in suspensi<strong>on</strong> for up to several hoursbecause the settling distance is large. The increase of the weighingmaterial c<strong>on</strong>centrati<strong>on</strong> in the collector pipe will increase the muddensity and thus the hydrostatic collector pressure. The pressure inthe collector pipe will differ from that in the inclined pipe; it willdecrease less than the bottom pressure or it will remain c<strong>on</strong>stantor even increase if the mud is very unstable. A difference betweenthe collector and bottom pressures will indicate an unstable mud.The stability behaviour in the sag tester will then be:• Stable mud: collector and bottom pressures are almost c<strong>on</strong>stantand close to each other. Stable, static mud behaviour isplotted in Figure 2 and 3.• Unstable mud: collector pressure is higher than bottom pressuresand both are decreasing with time. Typical pressurebehaviour of an unstable drilling mud under static c<strong>on</strong>diti<strong>on</strong>sis shown in Figure 4.As seen from the two plots the stable mud shows no changes inthe measured collector and bottom pressure, while the unstabledrilling mud shows a pressure difference around 2% after threehours, and a collector pressure that is nearly c<strong>on</strong>stant.As a quality c<strong>on</strong>trol, the sag tester was initially calibrated withwater which, as expected, showed c<strong>on</strong>stant pressures.Laboratory test proceduresFor most of the tests a commercial mud, supplied by <strong>Sag</strong>aPetroleum was used. Its data are shown in Table 1. This mud wastreated with water, prehydrated bent<strong>on</strong>ite, Na 2 CO 3 and barite indifferent porti<strong>on</strong>s to vary rheology and thus stability. Prior to teststhe treated mud was aged for 24 hours. Static tests were run for upto 12 hours while the flow tests were run for 2 hours, which wasFIGURE 3: Pressure changes for a slightly less stable mud (mudB) under static test c<strong>on</strong>diti<strong>on</strong>s.FIGURE 4: Pressure changes for an unstable mud (mud C) understatic test c<strong>on</strong>diti<strong>on</strong>s.found to be sufficient to characterise the mud. The rheology andgel strength parameters were measured with a Fann rheometer (11) ,and the density with an API mud balance (11) .Four different tests were run; static, pressure pulsing, pist<strong>on</strong>agitati<strong>on</strong> and pumping of mud. In the static tests, the mud waspoured into the sag tester and then left undisturbed. To simulatethe effect of pressure surges which in the wellbore are caused byan accelerating and decelerating drill string, a pressure pulse of0.1 MPa was applied to the top of the tester. Sharp pulses wereapplied every 2.5 min during the time frame from 1.5 to twohours. To simulate tripping operati<strong>on</strong>s and the effect of drill pipe,tool joints, stabiliser and bit movement al<strong>on</strong>g the wellbore, ametal rod with a pist<strong>on</strong> (OD = 30 mm) in fr<strong>on</strong>t was moved outand in of the inclined pipe every 2.5 min. starting 1.5 hours aftermud was poured into the <strong>Sag</strong> Tester and lasting for 0.5 hour. Thepurpose of pulse testing was to investigate if barite sag would beaccelerated by small disturbances in the mud. During the flowtests the mud was circulated from the bottom of the inclined pipeusing a centrifugal pump at a c<strong>on</strong>stant flow rate giving a speed ofabout 0.15 m/sec. In all flow tests the Reynolds number rangedbetween 500 – 1,500.ResultsIn all, more than 200 tests were carried out and the pressureplots presented here are typical behaviour of stable and unstablemuds. All data from the experiments with the <strong>Sag</strong> Tester are plottedas per cent pressure change from the initial pressure versustime. Fluid properties for the test results presented in the graphsSpecial Volume I 3
TABLE 3: C<strong>on</strong>trol data for the treated field fluids. Compositi<strong>on</strong> of the muds are similar to the field mud in Table 1;to mud A mainly barite is added, to mud C mainly water is added.Fluid Characterisati<strong>on</strong> Density PV τ 3,10’# at static c<strong>on</strong>diti<strong>on</strong>s kg/m 3 cP YP lb/100ft 2 τ 3,10A Stable 1,600 51 35 8.2 11.1B Semistable 1,500 29 16 2.0 2.7C Unstable 1,400 11 10 1.8 2.4are shown in Table 3.Static TestsTypical examples of static tests are those given in Figures 2, 3and 4. Based <strong>on</strong> all tests, it was c<strong>on</strong>cluded that after three hours inthe <strong>Sag</strong> Tester a stable mud should exhibit less than 0.2% pressureloss in the collector tube and less than about 0.7% in the bottomtube. Thus, muds A and B are stable while mud C is unstable.Although the 10 min. gel supposedly is high enough to carry thebarite particles, the dynamic “Boycott” process causes saggingeven at much higher levels of gel.Flow TestsThe flow tests were performed to study sagging during circulati<strong>on</strong>.Both the settling rate and sliding increased significantly comparedto static c<strong>on</strong>diti<strong>on</strong>s, and settling and sliding was observed inmuds that were stable at static c<strong>on</strong>diti<strong>on</strong>s. The same c<strong>on</strong>clusi<strong>on</strong>was reached by Hans<strong>on</strong> et al. (2) and Bern et al. (3) This is borne outin Figures 5 and 6. The reas<strong>on</strong> behind the increased settling rate isthat under circulati<strong>on</strong> the drilling mud is c<strong>on</strong>tinuously sheared andthere is no time for gel development.All flow test results are gathered and presented in Figures 7 and8, where the pressure data are plotted as a functi<strong>on</strong> of the two rheologicalparameters PV and YP. Note that settling is decreasingwith increasing rheological parameters, however, settling willnever quite cease when drilling fluid is flowing in laminar flowregime.Dynamic TestsThe muds were also tested under dynamic c<strong>on</strong>diti<strong>on</strong>s. Neitherpressure pulses, Figure 9, nor pist<strong>on</strong> agitati<strong>on</strong>, Figure 10, didinfluence the results significantly, <strong>on</strong>ly minor pressure changeswere noted during the tests. Disturbances like the <strong>on</strong>es simulatedwere not sufficient to alter the stability of the muds in questi<strong>on</strong>.This is clearly seen in Figures 11 and 12.FIGURE 5: Pressure changes for laminar flow c<strong>on</strong>diti<strong>on</strong>s of astable mud (mud A).FIGURE 7: Pressure changes after two hours under laminar flowc<strong>on</strong>diti<strong>on</strong>s as a functi<strong>on</strong> of plastic viscosity. ”Collector - bottom” isthe pressure difference between the collector and bottom pipes.FIGURE 6: Pressure changes for laminar flow c<strong>on</strong>diti<strong>on</strong>s of anunstable mud (mud C).FIGURE 8: Pressure changes after two hours under laminar flowc<strong>on</strong>diti<strong>on</strong>s as a functi<strong>on</strong> of yield point.4 Journal of Canadian Petroleum Technology
FIGURE 9: Pressure changes for an unstable mud (mud C) whena pressure pulse was applied every 2.5 min between 1.5 and twohours.FIGURE 11: Pressure changes after three hours for the static,pressure pulses and pist<strong>on</strong> tests as a functi<strong>on</strong> of plastic viscosity.FIGURE 10: Pressure changes for a stable mud (mud A) when apist<strong>on</strong> was run up and down <strong>on</strong>ce every 2.5 min between 1.5 andtwo hours.Discussi<strong>on</strong>All the static tests are plotted in Figure 11 and 12. By varyingthe rheology and keeping the density within 1,400 to 1,600 kg/m 3 ,it is seen that this particular field mud will exhibit static stability,i.e., no settling in inclined pipes when the plastic viscosity is higherthan 20 cP and/or when the yield point is higher than 20lb/100ft 2 . The rheological parameters can thus be applied for predictingstability problems.When flow and static tests are plotted together as in Figure 13,it is seen that settling and sliding will occur at higher YP and PVin flowing muds than muds at rest.FIGURE 12: Pressure changes after three hours for the static,pressure pulses and pist<strong>on</strong> tests as a functi<strong>on</strong> of yield point.The following c<strong>on</strong>clusi<strong>on</strong>s may be drawn from this work:1. A laboratory apparatus was developed to investigate drillingmud instability leading to barite sag in inclined holes. It differentiatesbetween settling and sliding and between staticand flowing c<strong>on</strong>diti<strong>on</strong>s, and can be applied to determinewhen sagging will be initiated at static c<strong>on</strong>diti<strong>on</strong>s.2. Settling in static and flowing fluids is different. In flowingfluids the settling process will be exacerbated during laminarflow c<strong>on</strong>diti<strong>on</strong>s. Since the fluid has no gel strength whensheared it will behave like a power law fluid without yieldpoint, and as such produce a high effective viscosity at lowshear rates. At high viscosity, settling can be slowed downbut never fully avoided. Comm<strong>on</strong> API rheological parametersare necessary and suitable to estimate rheology for particlesettling.3. It has been shown that pressure pulses and pist<strong>on</strong> agitati<strong>on</strong>,simulating tripping, did not significantly influence theprocess of barite sagging.4. The 3 and 6 rpm Fann readings are unreliable because of theviscometer’s high relative error at those low speeds. PV andC<strong>on</strong>clusi<strong>on</strong>sFIGURE 13: Pressure changes at two or three hours as a functi<strong>on</strong>of PV for all tests.Special Volume I 5
YP however, have in this study proven to give reproducibleinformati<strong>on</strong> <strong>on</strong> barite sagging.5. A highly viscous fluid (PV and/or YP above 20) will slowdown the settling rate but will at the same time cause highfricti<strong>on</strong> and suppress turbulence in the annulus. High fricti<strong>on</strong>is in c<strong>on</strong>flict with ECD while suppressed turbulence willpromote settling. A qualified suggesti<strong>on</strong> of how to handlethe sag problem is therefore:a. Avoid static settling by designing a mud with minimumnecessary rheology; for this specific field mud a PVand/or YP of 20 is required.b. During laminar circulati<strong>on</strong> hindered settling is a veryslow process. Segregating particles in the annulus can beredistributed through creating short lasting (sec<strong>on</strong>ds) turbulentflow at regular intervals. Intermittent turbulentflow in the annulus will homogenise the suspensi<strong>on</strong> andthus counteract the segregati<strong>on</strong> effect. The necessaryinterval must be determined through laboratory or fieldtests.9. WALKER, R.E., and MAYERS, T. M., Design of Mud for CarryingCapacity; Journal of Petroleum Technology, pp. 893-900, July 1975.10. SAASEN, A., LUI, D., and MARKEN, C.D., Predicti<strong>on</strong> of Barite<strong>Sag</strong> Potential of <strong>Drilling</strong> Fluids from Rheological Measurements;SPE <str<strong>on</strong>g>paper</str<strong>on</strong>g> 29410, presented at the SPE/IADC <strong>Drilling</strong> C<strong>on</strong>ference,Amsterdam, pp. 663-671, Febuary 28 – March 2, 1995.11. American Petroleum Institute, Standard Procedure for Field Testingof Water Based Fluids; first editi<strong>on</strong>, API RP 13B-1, Washingt<strong>on</strong> DC,July 1990.Metric C<strong>on</strong>versi<strong>on</strong> Factorscp × 1.0*ft × 0.3048*lb × 4.535 924lb/100ft 2 × 4.788 026*C<strong>on</strong>versi<strong>on</strong> factor is exact.E–03 = Pa◊s= mE–01 = kgE–01 = PaAcknowledgementsThe authors wish to thank the management of <strong>Sag</strong>a PetroleumAS for supporting this project and allowing this <str<strong>on</strong>g>paper</str<strong>on</strong>g> to be published.We give special acknowledgements to Ivar Spilling from<strong>Sag</strong>a Petroleum AS for his c<strong>on</strong>structive co-operati<strong>on</strong> and toHarald Elvebakk for performing most of the tests.NOMENCLATUREc = particle volume c<strong>on</strong>centrati<strong>on</strong>, fracti<strong>on</strong>d p = particle diameter, mg = gravitati<strong>on</strong>al accelerati<strong>on</strong>, m/s 2PV = plastic viscosity, Pa◊s (cP)r p = particle radius, mv s,l = particle settling velocity, m/sv s,c = particle slip velocity, m/sYP = yield point, Pa (lb/100ft 2 )YP low = low shear rate yield point, Pa (lb/100ft 2 )ρ fluid = fluid density, kg/m 3ρ p = particle density, kg/m 3τ = shear stress, Pa (lb/100ft 2 )τ 3 = Fann reading at 3 rpm, Pa (lb/100ft 2 )τ 6 = Fann reading at 6 rpm, Pa (lb/100ft 2 )τ g = gel necessary to suspend particle, Pa (lb/100ft 2 )µ = viscosity, Pa◊s (cP)REFERENCES1. BOYCOTT, A.E., Sedimentati<strong>on</strong> of Blood Corpuscles; Nature, Vol.104, p. 532, 1920.2. HANSON, P.M., TRIGG JR., T.K., RACHAL, G., and ZAMORA,M., Investigati<strong>on</strong> of Barite “<strong>Sag</strong>” in Weighted <strong>Drilling</strong> Fluids inHighly Deviated Wells; SPE <str<strong>on</strong>g>paper</str<strong>on</strong>g> 20423, presented at the 65 thAnnual Technical C<strong>on</strong>ference and Exhibiti<strong>on</strong>, New Orleans,September 23 – 26, 1990.3. BERN, P.A., ZAMORA, M., SLATER, K.S., and HEARN, P.J., TheInfluence of <strong>Drilling</strong> Variables <strong>on</strong> Barite <strong>Sag</strong>; SPE <str<strong>on</strong>g>paper</str<strong>on</strong>g> 36670,presented at the SPE Annual Technical C<strong>on</strong>ference and Exhibibiti<strong>on</strong>,Denver, CO, October 6 – 9, 1996.4. ZAMORA, M., and JEFFERSON, D., C<strong>on</strong>trolling Barite <strong>Sag</strong> CanReduce <strong>Drilling</strong> Problems; Oil & Gas Journal, pp. 47-52, February14, 1994.5. JAMISON, D.E., and CLEMENTS, W.R., A New Test Method toCharacterise Settling/<strong>Sag</strong> Tendencies of <strong>Drilling</strong> Fluids Used inExtended Reach <strong>Drilling</strong>; Drlg Tech Symp, Amer. Soc. of Mech.Engr. PD-Vol. 27, pp. 109-113, 1990.6. GOVIER, G.W., and AZIZ, K., The Flow of Complex Mixture inPipes; R.E. Krieger Publishing Co., Malabar, FL, 1972.7. DAVIS, R.H., and GECOL, H., Classificati<strong>on</strong> of C<strong>on</strong>centratedSuspensi<strong>on</strong>s Using Inclined Settlers; Internati<strong>on</strong>al Journal ofMultiphase Flow, Vol. 22, No. 3, pp. 563-574, 1996.8. CHIEN, S.F., Annular Velocity for Rotary <strong>Drilling</strong> Operati<strong>on</strong>s;Proceedings, SPE Fifth C<strong>on</strong>ference <strong>on</strong> <strong>Drilling</strong> and RockMechanics, Austin, TX, pp. 5-16, January 5 – 6, 1971.Authors’ BiographiesPål Skalle is currently associate professorin drilling at the Norwegian University ofScience and Technology (NTNU), departmentof petroleum engineering and appliedgeophysics in Tr<strong>on</strong>dheim, Norway. Hismain focus is drilling fluid technology andditto hydraulics. He received a M.Sc. in1974 from University of Leoben, Austriaand in 1983 a Ph.D. in petroleum engineeringfrom NTNU. Mr. Skalle is a member ofNPF and SPE.Shteryo Lyomov is a research scientist atNTNU since 1992 and an associate professorin drilling at University of Mining andGeology (MGU) in Sofia, Bulgaria. He hasparticipated in research projects and developmentwork in drilling fluids, wellcementing, as well as formati<strong>on</strong> damage.His interests are all aspects related todrilling. He holds a M.Sc. and a Ph.D.degree in drilling from MGU. Lyomov is amember of SPE.Knut Backe is currently a research scientistat NTNU. His main areas of interest arecement, drilling fluids, and electrical geophysicalmethods. He received a M.Sc. inpetroleum engineering from NTNU in1987.Jostein Sveen is a senior research engineerat the Foundati<strong>on</strong> of Scientific andIndustrial Research (SINTEF), IndustrialManagement, Safety and Reliability inTr<strong>on</strong>dheim, Norway. Sveen is managingmultidisciplinary team-groups in SIN-TEF/NTNU dealing with petroleum relatedprojects. He received a M.Sc. degree inpetroleum technology, 1979 and a Ph.D. indrilling, 1987 from NTNU.6 Journal of Canadian Petroleum Technology


