JCPT-paper-on-Sag - Drilling Engineering Association
JCPT-paper-on-Sag - Drilling Engineering Association
JCPT-paper-on-Sag - Drilling Engineering Association

You also want an ePaper? Increase the reach of your titles
YUMPU automatically turns print PDFs into web optimized ePapers that Google loves.
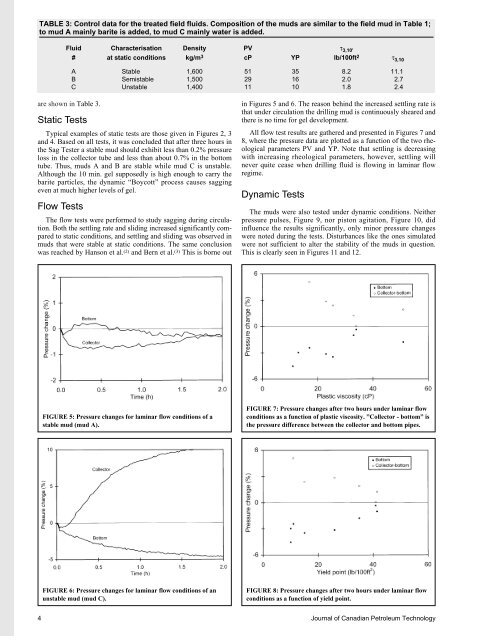
TABLE 3: C<strong>on</strong>trol data for the treated field fluids. Compositi<strong>on</strong> of the muds are similar to the field mud in Table 1;to mud A mainly barite is added, to mud C mainly water is added.Fluid Characterisati<strong>on</strong> Density PV τ 3,10’# at static c<strong>on</strong>diti<strong>on</strong>s kg/m 3 cP YP lb/100ft 2 τ 3,10A Stable 1,600 51 35 8.2 11.1B Semistable 1,500 29 16 2.0 2.7C Unstable 1,400 11 10 1.8 2.4are shown in Table 3.Static TestsTypical examples of static tests are those given in Figures 2, 3and 4. Based <strong>on</strong> all tests, it was c<strong>on</strong>cluded that after three hours inthe <strong>Sag</strong> Tester a stable mud should exhibit less than 0.2% pressureloss in the collector tube and less than about 0.7% in the bottomtube. Thus, muds A and B are stable while mud C is unstable.Although the 10 min. gel supposedly is high enough to carry thebarite particles, the dynamic “Boycott” process causes saggingeven at much higher levels of gel.Flow TestsThe flow tests were performed to study sagging during circulati<strong>on</strong>.Both the settling rate and sliding increased significantly comparedto static c<strong>on</strong>diti<strong>on</strong>s, and settling and sliding was observed inmuds that were stable at static c<strong>on</strong>diti<strong>on</strong>s. The same c<strong>on</strong>clusi<strong>on</strong>was reached by Hans<strong>on</strong> et al. (2) and Bern et al. (3) This is borne outin Figures 5 and 6. The reas<strong>on</strong> behind the increased settling rate isthat under circulati<strong>on</strong> the drilling mud is c<strong>on</strong>tinuously sheared andthere is no time for gel development.All flow test results are gathered and presented in Figures 7 and8, where the pressure data are plotted as a functi<strong>on</strong> of the two rheologicalparameters PV and YP. Note that settling is decreasingwith increasing rheological parameters, however, settling willnever quite cease when drilling fluid is flowing in laminar flowregime.Dynamic TestsThe muds were also tested under dynamic c<strong>on</strong>diti<strong>on</strong>s. Neitherpressure pulses, Figure 9, nor pist<strong>on</strong> agitati<strong>on</strong>, Figure 10, didinfluence the results significantly, <strong>on</strong>ly minor pressure changeswere noted during the tests. Disturbances like the <strong>on</strong>es simulatedwere not sufficient to alter the stability of the muds in questi<strong>on</strong>.This is clearly seen in Figures 11 and 12.FIGURE 5: Pressure changes for laminar flow c<strong>on</strong>diti<strong>on</strong>s of astable mud (mud A).FIGURE 7: Pressure changes after two hours under laminar flowc<strong>on</strong>diti<strong>on</strong>s as a functi<strong>on</strong> of plastic viscosity. ”Collector - bottom” isthe pressure difference between the collector and bottom pipes.FIGURE 6: Pressure changes for laminar flow c<strong>on</strong>diti<strong>on</strong>s of anunstable mud (mud C).FIGURE 8: Pressure changes after two hours under laminar flowc<strong>on</strong>diti<strong>on</strong>s as a functi<strong>on</strong> of yield point.4 Journal of Canadian Petroleum Technology