Dropout study 21 states - Sarva Shiksha Abhiyan
Dropout study 21 states - Sarva Shiksha Abhiyan
Dropout study 21 states - Sarva Shiksha Abhiyan
- No tags were found...

Create successful ePaper yourself
Turn your PDF publications into a flip-book with our unique Google optimized e-Paper software.
Survey for Assessment of <strong>Dropout</strong> Rates at Elementary Level in<strong>21</strong> StateseTEHAPTER - 11.0 PrologueThe phenomenon of students discontinuing studies and repeating grades before completingelementary level of education is a major impediment in achieving Universalization ofElementary Education (UEE). In order to assess its impact on achievement of UEE, it isnecessary to estimate dropout and repetition rates at primary and upper primary stages aswell as transition rate from primary to upper primary. At present there are two mainsources of information on dropout rates (1) official statistics published annually by MHRD inSelected Educational Statistics (SES) now renamed Statistics of School Education (SSE) and(2) District Information System of Education (DISE), initially developed for District PrimaryEducation Programme by NIEPA (now NUEPA) and later expanded to cover all recognizedschools of the country offering primary/upper primary education under <strong>Sarva</strong> <strong>Shiksha</strong><strong>Abhiyan</strong> (SSA). Databases for both of them are the educational statistics supplied by allrecognized schools of the country. In the case of DISE the schools are supposed to fill upspecially designed forms and the school report card become available on to NUEPA on line.The SSE reports dropout rates for grades 1 to 5 and 1 to 8, which are actually crudeestimates of the percentage of children who drop out from school between grade 1 andgrade 5 and between grade 1 and grade 8. The first is based on the ratio of the current yearenrolment of grade 5 to grade 1 enrolment of 4 years back. This indicator does not takerepeaters and lateral entry cases into consideration.FINAL REPORTDISE uses the data on enrolment and number of repeaters of two consecutive years tocompute the percentage of students Submitted who dropout To: from primary stage of education in ayear. Since some schools that supply data in one year do not supply data in the followingyear, the average dropout is computed on the basis of the data of common schools, that is,those which supplied data in both the years. The annual dropout rates so derived areSubmitted By:published in DISE reports. The dropout rate thus computed does not take lateral entry casesinto consideration.TNS India Private Limited8th Floor, Block 4 – B DLF Corporate Park,DLF City, Phase - III M G RoadGurgaon 122 002,In view of the stated limitations d +91 124 of both 448 8800, the sources, f +91 124 an 448 attempt 8878 was made to modify theprocedure of identification of dropouts www.tnsglobal.comwhen on behalf of Ministry of Human ResourceDevelopment (MHRD), EdCIL commissioned Development & Research Services (DRS) toconduct a sample survey in <strong>21</strong> major <strong>states</strong> of the country in 2008-09 to assess the dropoutrates at primary and upper primary levels of education. The modified procedure used in thesurvey is as follows;January 2013
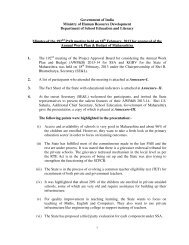
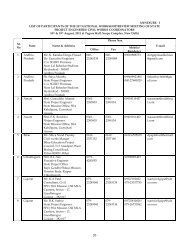
2008-092009-102008-092009-102008-092009-102008-092009-10D. Stage wise average Repetition and <strong>Dropout</strong> RatePrimary stageUpper primary stageSr.NoStateRepetitionRate<strong>Dropout</strong>RateRepetitionRate<strong>Dropout</strong>Rate1 Andhra Pradesh 3.4 3.6 3.0 2.9 1.4 1.6 3.4 2.42 Assam 11.2 8.0 3.2 2.6 9.4 6.7 4.6 3.33 Bihar 14.0 13.3 3.4 3.0 4.8 3.7 1.1 1.24 Chhattisgarh 6.8 5.8 3.0 4.4 5.4 3.0 1.5 3.45 Delhi 1.8 2.1 2.7 4.3 1.8 0.9 0.3 0.36 Gujarat 7.6 8.2 1.0 1.0 6.2 5.7 3.5 3.07 Haryana 4.9 3.0 2.1 1.8 6.8 3.1 0.4 0.28 Himachal Pradesh 2.2 0.6 1.4 1.4 5.8 1.8 1.4 0.99 Jammu & Kashmir 4.9 4.4 1.3 1.3 6.3 3.1 0.7 0.510 Jharkhand 15.7 14.7 3.5 3.0 10.1 7.3 2.1 2.811 Karnataka 1.1 0.5 1.6 1.5 0.4 0.4 6.8 5.712 Kerala 1.1 1.1 2.7 4.2 0.9 0.5 2.9 3.713 Madhya Pradesh 12.9 10.3 3.2 2.8 9.1 5.7 1.5 2.<strong>21</strong>4 Maharashtra 3.6 1.5 1.8 2.0 2.4 3.1 1.7 1.515 Orissa 7.2 4.7 2.7 1.3 6.3 2.5 4.1 5.016 Punjab 11.3 7.5 3.4 3.9 15.3 11.9 0.5 1.417 Rajasthan 14.9 13.4 3.2 3.1 14.2 10.8 2.7 2.<strong>21</strong>8 Tamil Nadu 1.5 1.2 2.6 1.7 1.8 2.2 1.3 1.919 Uttar Pradesh 3.3 3.3 2.4 4.6 1.6 1.6 1.5 1.520 Uttarakhand 1.9 1.0 2.6 1.7 1.8 0.3 1.2 0.8<strong>21</strong> West Bengal 15.8 14.0 3.9 2.5 12.2 10.6 0.4 0.3All States 7.5 6.6 2.7 3.1 5.4 4.0 2.1 2.25
List of Abbreviations UsedAIESAIEDRSDISEEGSEdCILMHRDSSASCSTUEEAll Educational SurveyAlternative and Innovative EducationDevelopment & Research Services Pvt. LtdDistrict Information System of EducationEducation Guarantee SchemeEducational Consultants LimitedMinistry of Human Resource Development<strong>Sarva</strong> <strong>Shiksha</strong> <strong>Abhiyan</strong>Scheduled CasteScheduled TribeUniversal Elementary Education6
Executive summaryIn this <strong>study</strong> 4,154 schools (2,401 primary and 1,753 upper primary) were covered from <strong>21</strong><strong>states</strong>. These <strong>states</strong> are Andhra Pradesh, Assam, Bihar, Chhattisgarh, Gujarat, Haryana,Himachal Pradesh, Jammu & Kashmir, Jharkhand, Karnataka, Kerala, Madhya Pradesh,Maharashtra, Orissa, Punjab, Rajasthan, Tamil Nadu, Uttar Pradesh, Uttarakhand and WestBengal. In addition the National Capital Territory (NCT) of Delhi was also included. The main objectives of the <strong>study</strong> were to recheck the data that was collected in 2009survey through the DS-4 schedule and to provide estimates of dropout, repetition andpromotion rates for the year 2008-09 and 2009-10. The data was collected onenrolment, promotees, repeaters, school leavers, dropout (for 2008-09 and 2009-10),and lateral entrants (for 2009-10) from grade 1 to grade 7/8 as per the school patternfrom all the sampled schools. A separate report has been submitted for rechecking thedata for the year 2007-08.Education is a state subject so each state follows a different grades pattern for primaryand upper primary stages therefore the state pattern has been used everywhere,wherever the indicators are calculated for primary and upper primary stage.2.0 Coverage of Schools and their status of Enrolment, Attendance Rates and House visitsof School LeaversThe schools selected for the survey were a sub sample of the survey carried out in 2009which were selected through stratified sampling. To select 4,200 schools for the presentsurvey from among the list of 8,016 schools of the previous survey, the simple circularsystematic procedure was used which implicitly maintained the same proportion in thesubsample as that of in the sampling frame.In the sample covered there were 2,401 primary schools, 1,008 upper primary schools withprimary grades, 392 schools with only upper primary grades and 353 upper primary schoolswith secondary grades. Almost a similar sample size was covered in each state and itranged between 170 schools (Delhi) and <strong>21</strong>8 schools (Uttar Pradesh).The total numbers of students enrolled have decreased in almost all the classes in 2009-10as compared to 2008-09. Some of the <strong>states</strong> with high enrolment at the primary stage areDelhi, Bihar, Uttar Pradesh, Jharkhand, West Bengal, Karnataka and Gujarat in both theassessment years.2.3 Students in Kerala (94.8%) and Maharashtra (91.5%) have attendance rates in excess of90% in primary stage. Grade 5 recorded the highest attendance rate at all <strong>states</strong> level forthe primary stage. Students in Maharashtra (92.1%) and Tamil Nadu (90.9%) have7
attendance rates in excess of 90% at the upper primary stage. Attendance rate for all the<strong>states</strong> combined together is around 75% for both primary and upper primary stages.2.4 During the years 2008-09 and 2009-10, houses of 48,462 students of primary grades and14,791 students of upper primary grades had left school respectively; their houses werevisited to ascertain their education status.2.5 A total of 48,913 houses of 2008-09 pass-outs and 49,611 houses of 2009-10 pass outsof primary schools were visited during the survey. In upper primary schools, <strong>21</strong>,004 and<strong>21</strong>,471 students were found to be passed out during 2008-09 and 2009-10 respectively andtheir houses were visited to ascertain the education status.3.0 School Leavers, Pass out, Transition Rate and Lateral EntrantsNot only the data was collected from the school registers but also visits were made to thehouses of the school leavers and the students of the terminal grades (class 7 or lower) tofind out from the parents whether the child had continued or discontinued the furtherstudies. In case the student was not admitted in any other school then the present activityof the child was also taken from the parents. For the dropouts the reason for dropping outof the school was also recorded.3.1 The status of the school leavers was ascertained by visiting the houses of school leavers.The parents were questioned whether their son/daughter had taken admission in someother school or dropped out of the school. In case of continuation the status wasascertained whether the students admitted as promotee or repeater in some other school.At the primary stage Kerala had the highest continuation rate among the school leavers in2008-09 (93%) and 2009-10 (94.5%). Discontinuation rate among the school leavers of closeto 50% was recorded in West Bengal in both the assessment years. At the upper primarystage, Kerala, Maharashtra and Gujarat recorded more than 80% continuation rate amongstthe school leavers’ in both 2008-09 and 2009-10.3.2 Punjab is the state where highest percentage (94.3%) of pass outs continued and Assamis the state where highest percentage (19.3%) of graduates discontinued in their education.3.3 Transition rate at the primary stage was 87.5% for the year 2008-09 and it decreasedmarginally to 87.2% in 2009-10. West Bengal recorded the lowest transition rate (80.9%) in2008-09.3.4 Data was also collected for the students who took admission in schools directly in grade2 or above from either other recognized schools, unrecognized schools/ home or privatetuitions and other Bridge/AIE/EGS course and it was noted that a total of 12.9% (28,949students) of the students took admission in the school as a lateral entrants at the primarystage and 9.5% students took admission as lateral entrants at the upper primary stage.8
4.0 Promotion Rate, Repetition Rate and <strong>Dropout</strong> Rate4.1 Promotion rate has increased between the year 2008-09 and 2009-10 and at all <strong>states</strong>level. The promotion rate was lowest for grade 1 in both the assessment years. Upperprimary grades fared better as far as promotion rate was concerned. At both primary andupper primary stage, there has been almost similar percentage increase in promotion ratebetween the two years for both boys and girls.4.2 The repetition rate for primary grades (grade 1-4/5) at all <strong>states</strong> level for the year 2008-09 is 7.5% and in 2009-10 the rate has declined to 6.6%. A higher repetition rate wasrecorded for boys as compared to the girls at both primary and upper primary stage. Therepetition rate decreased from 5.4% to 4% in 2009-10.4.3 At all <strong>states</strong> level the dropout rate at the primary stage was 2.7% in 2008-09 and itincreased to 3.1% in 2009-10. At the upper primary stage the dropout rate have remainedalmost same at 2.1% and 2.2% for the two years. At the primary stage there is a similardropout rate for boys and girls but at the upper primary stage there is a higher percentageof boys dropping out as compared to the girls.5.0 Reconstructed Cohort Analysis<strong>Dropout</strong>s in this <strong>study</strong> are those students who enroll themselves in schools and withdrawprematurely before they complete primary/elementary level .The cohort method is used toassess the dropout rate in this <strong>study</strong> wherein a particular batch of students joining grade Iduring a particular year are followed during the successive years in the next higher grades,till the end of that stage and in our case the students data is collected for two consecutiveyears that is 2008-09 and 2009-10.5.1 Cohort dropout rate is based on the inefficiencies (repetition and dropout rate) in theeducation system. For primary stage, the cohort dropout rate for 2008-09 was 14.2% andthe same had increased to 16.8% in 2009-10. For elementary level (1-7) the cohort dropoutrate for 2008-09 was 19.2% and it had increased to 20.5% in 2009-10. For elementary level(grade 1-8) cohort dropout rate for 2008-09 was found to be 19.6% and it had gone up to23.2% in 2009-10. The cohort dropout rate for elementary level was higher than the primarystage.5.2 At all <strong>states</strong> level the coefficient of internal efficiency at primary stage for 2008-09 was81.6% and the same had decreased to 80.8% in 2009-10. At elementary level (grade 1-7),the coefficient of internal efficiency for 2008-09 was 80.4 % and in 2009-10, it haddecreased marginally to 80.2%. For elementary level (grade 1-8) the Coefficient of efficiencyhad decreased from 81.6% in 2008-09 to 80.8% in 2009-10.9
6.0 Indicators for Different Social Groups (SC/ ST/ Muslims)6.1 20.7% of the students enrolled from grade 1-7/8 belonged to SC social group, 8.5% tothe ST and 13.8 % to the Muslims.6.2 4,990 SC students houses were visited 2009-10, 2,619 ST students houses and 2,956Muslim students houses were visited at the primary and upper primary stage to ascertaintheir continuation/discontinuation status.6.3 Nearly one-fourth of the total SC students who left the school in 2008-09, discontinuedtheir education and it increased to 34.9% in 2009-10. About 1/4 th of the total ST andMuslim school leavers in 2009-10, discontinued education after leaving the school inprimary grades.6.4 The school leavers’ rate for the year 2009-10 was highest amongst the ST students atthe primary and upper primary stage.6.5 Around 35% of the school leavers dropped out amongst the SC, ST and Muslims at theprimary stage and 37% at the upper primary stage.6.6 15.3 % of SC, 7.4% of ST and 15% of Muslims pass outs of the terminal grade of theschool whose houses were visited had discontinued their education at the primary stage.7.9% of SC, 7.8% of ST and 6.2% of the Muslims discontinued education before completingthe upper primary stage.6.7 Pass out rate of the SC, ST and Muslims is discussed in this section.6.8 Grade 1 and 5 recorded a lower promotion rate for SC, ST and Muslims as compared toother grades.6.9 At the all <strong>states</strong> level highest repetition rate for the year 2009-10 was recorded for STstudents at the primary and upper primary stage. A higher repetition rate was recorded atthe primary stage as compared to the upper primary stage, There were 4.1%SC, 5.1% STand 3.5% Muslims repeaters at the primary stage and 3.3% SC, 4.3%ST and 3.3% Muslimsrepeaters at the upper primary stage at the all <strong>states</strong> level in 2009-10.6.10 At all <strong>states</strong> level the highest dropout rates were found for SC at the primary stage andfor ST students (2.7%) at the upper primary stage. A higher dropout rate was recorded forthe upper primary stage. 3.3% of SC, 2.6% of ST and 2.6% of Muslims dropped out at theprimary stage and 1.8% of SC, 2.7% of ST and 1.8% of Muslims dropped out at the upperprimary stage.6.11 The cohort dropout rate for elementary level is higher as compared to the primarystage and SC’s recorded a high cohort dropout rate at the primary (17.8%) and elementarylevel (22.2%). Cohort dropout rate for STs at the primary stage 14.4% and 20.8% at theupper primary stage and Muslims recorded the lowest cohort dropout rate amongst thesocial group, 13.6% at the primary stage and 17.9% at the upper primary stage.7.0 Reasons for dropping out and their current activity7.1 The topmost reasons for dropping out are lack of interest in studies, economic conditionof the parents, migration of family and to help the family in domestic work.10
7.2 After dropping out the children were involved in helping their parents in householdwork, occupation work, working to earn money and a lot of students were also sitting idleand doing nothing. %). More or less the students after dropping out from upper primaryclasses were helping the parents in earning the money, either by getting them involved inthe agriculture and allied activities or directly by doing work to earn money.11
Table of ContentsCHAPTER I Prologue1.1 Objectives of Survey 191.2 Pattern of grades in different stages of school education in <strong>21</strong> <strong>states</strong> 201.3 Definitions of the terms used in the survey 201.4 Approach of the <strong>study</strong> <strong>21</strong>1.5 Methodology adopted for the <strong>study</strong> 231.6 Structure and Management of fieldwork 281.7 Statistical analysis of data 301.8 Organization of the report 34CHAPTER II Coverage of Schools and their status of Enrolment, Attendance Rates and House visits of2.1 Schools Leavers Coverage 362.2 Student enrolment in the sampled schools 382.3 Attendance rates on the day of school visit 392.4 Visits to the houses of school leavers 412.5 Visits to the houses of pass-outs of last grade 42CHAPTER III School Leavers, Pass outs, Transition Rate and Lateral Entrants3.1 School Leavers and Status 443.1.3 School leavers’ Rates 463.1.4 Discontinued students among school leavers 493.2 Pass out Rates 533.3 Transition Rate 563.4 Lateral Entrants 57CHAPTER IV Promotion Rate, Repetition Rate and <strong>Dropout</strong> Rate4.1 Promotion Rates 634.2 Repetition Rates 654.3 <strong>Dropout</strong> Rates 68CHAPTER V Reconstructed Cohort Analysis5.1 Cohort <strong>Dropout</strong> Rate 725.2 Coefficient of Internal Efficiency 745.3 Average duration of <strong>study</strong> 77CHAPTER VI Indicators for Different Social Groups (SC/ ST/ Muslims)6.1 Enrolment 786.2 Visits to the houses of school leavers 806.3 Status of the school leavers 816.4 School Leavers’ rate 836.5 <strong>Dropout</strong>s among School Leavers 856.6 Visits to the houses of pass-outs and their status 866.7 Pass out Rates 866.8 Promotion Rate 926.9 Repetition Rate 936.10 <strong>Dropout</strong> Rate 956.11 Cohort <strong>Dropout</strong> Rate 976.12 Coefficient of Internal efficiency 986.13 Average duration of <strong>study</strong> 99CHAPTER VII Reasons for dropping out and their current activity7.1 Reasons for Dropping out 1007.2 Current Activity of the <strong>Dropout</strong>s 102Annexure I: Tables 104-223Annexure II- Statistical Analysis 224-227Annexure III: Tools used for data collection 228-23712
List of Tables in AnnexureTable DescriptionChapter 2 : Coverage of Schools and their status of Enrolment, Attendance Rates andHouse visits of School LeaversTable 2.1.1 Number of schools covered, schools replaced and schools could not be covered 104Table 2.1.2 Number of school covered by area and school category 105Table 2.1.3 Primary and upper primary school by type of management 106Table 2.2.1Grade wise enrolments in the sampled primary schools by gender across <strong>study</strong> <strong>states</strong> ason 30th Sep 2009 107Table 2.2.2Grade wise enrolments in the sampled primary schools by gender across <strong>study</strong> <strong>states</strong> ason 30th Sep 2010 108Table 2.2.3Grade wise enrolments in the sampled upper primary schools by gender across <strong>study</strong><strong>states</strong> as on 30th Sep 2009 109Table 2.2.4Grade wise enrolments in the sampled upper primary schools by gender across <strong>study</strong><strong>states</strong> as on 30th Sep 2010 110Table 2.3.1Grade wise attendance rates on the day of visit in schools for primary schools by genderacross <strong>study</strong> <strong>states</strong> 111Table 2.3.2Grade wise attendance rates on the day of visit in schools for upper primary school bygender across <strong>study</strong> <strong>states</strong> 112Table 2.4.1Grade wise number of school leavers of primary stage whose houses were visited-2008-09 113Table 2.4.2Grade wise number of school leavers of primary stage whose houses were visited -2009-10 114Table 2.4.3Grade wise number of school leavers of upper primary stage whose houses werevisited-2008-09 115Table 2.4.4Grade wise number of school leavers of upper primary stage whose houses were visited2009-10 116Table 2.5.1Number of graduates and completers of highest grade by gender & stage, whosehouses were visited, 2008-09 & 2009-10 117Table 2.5.2 Number of graduates of terminal classes whose houses were visited 118Table 3.1.1Table 3.1.2Table 3.1.3Table 3.1.4Table 3.1.5Table 3.1.6Table 3.1.7Table 3.1.8Table 3.1.9Table 3.1.10Table 3.1.11Table 3.1.12Chapter 3: School Leavers, Pass outs, Transition Rate and Lateral EntrantsGrade wise status of primary school leavers (boys) whose house were visited for theyear 2008-09 119Grade wise status of primary school leavers (girls) whose house were visited for theyear 2008-09 120Grade wise status of primary school leavers (total) whose house were visited for theyear 2008-09 1<strong>21</strong>Grade wise status of primary school leavers (boys) whose house were visited for theyear 2009-10 122Grade wise status of primary school leavers (girls) whose house were visited for theyear 2009-10 123Grade wise status of primary school leavers (total) whose house were visited for theyear 2009-10 124Grade wise status of upper primary school leavers (boys) whose house were visited forthe year 2008-09 125Grade wise status of upper primary school leavers (girls) whose house were visited forthe year 2008-09 126Grade wise status of upper primary school leavers (total) whose house were visited forthe year 2008-09 127Grade wise status of upper primary school leavers (boys) whose house were visited forthe year 2009-10 128Grade wise status of upper primary school leavers (girls) whose house were visited forthe year 2009-10 129Grade wise status of upper primary school leavers (total) whose house were visited forthe year 2009-10 13013
Table 3.1.13Table 3.1.14Table 3.1.15Table 3.1.16Table 3.1.17Table 3.1.18Table 3.1.19Table 3.1.20Table DescriptionGrade wise school levers by gender in primary classes as on 30th Sep 2008 & 30th Sep2009 131Grade wise school levers by gender in primary classes as on 30th Sep 2009 & 30th Sep2010 132Grade wise school levers by gender in upper primary classes as on 30th Sep 2008 &30th Sep 2009 133Grade wise school leavers by gender in upper primary classes as on 30th Sep 2009 &30th Sep 2010 134Grade wise discontinued students among school leavers by gender in primary grades ason 30th Sep 2009 135Grade wise discontinued students among school leavers by gender in primary grades ason 30th Sep 2010 136Grade wise discontinued students among school leavers by gender in upper primarygrades as on 30th Sep 2009 137Grade wise discontinued students among school leavers by gender in upper primarygrades as on 30th Sep 2010 138Table 3.3 Transition rate of primary stage by years 139Table 3.4.1Grade wise number of lateral entrants from total enrolment by gender in primarygrades 2 and above 140Table 3.4.2Grade wise number of lateral entrants from total enrolment by gender in upper primarygrades 5 and above 141Table 3.4.3Grade wise percentage of students from EGS/AIE/Bridge course from total enrolmentby gender in primary grade 2 and above 142Table 3.4.4Grade wise percentage of students from EGS/AIE/Bridge course from total enrolmentby gender in upper primary grade 5 and above 143Table 3.4.5Grade wise percentage of students from home/private tuition/unrecognized schoolsfrom total enrolment by gender in primary grade 2 and above 144Table 3.4.6Grade wise percentage of students from home/private tuition/unrecognized schoolsfrom total enrolment by gender upper primary grade 5 and above 145Table 3.4.7Grade wise percentage of students transferred from recognized school from totalenrolment by gender in primary grade 2 and above 146Table 3.4.8Grade wise percentage of students transferred from recognized school from totalenrolment by gender upper primary grade 5 and above 147Table 3.4.9Grade wise percentage of promotees from lateral entrants by gender in primary grade 2and above 148Table 3.4.10Grade wise percentage of promotees from lateral entrants by gender in primary grade 2and above 149Table 3.4.11Grade wise percentage of repeaters from lateral entrants by gender in primary grade 2and above 150Table 3.4.12Grade wise percentage of repeaters from lateral entrants by gender in upper primarygrade 5 and above 151Chapter 4: Promotion Rate, Repetition Rate and <strong>Dropout</strong> RateTable 4.4.1 Grade wise promotion rate by gender in primary classes as on 30th sep 2009 153Table 4.4.2 Grade wise promotion rate by gender in primary classes as on 30th Sep 2010 154Table 4.4.3 Grade wise promotion rate by gender in upper primary classes as on 30th Sep 2009 155Table 4.4.4 Grade wise promotion rate by gender in upper primary classes as on 30th Sep 2010 156Table 4.4.5 Grade wise repetition rate by gender in primary classes as on 30th Sep 2009 157Table 4.4.6 Grade wise repetition rate by gender in primary classes as on 30th Sep 2010 158Table 4.4.7 Grade wise repetition rate by gender in upper primary classes as on 30th Sep 2009 159Table 4.4.8 Grade wise repetition rate by gender in upper primary classes as on 30th Sep 2010 160Table 4.4.9 Grade wise dropouts rate by gender in primary classes as on 30th Sep 2009 161Table 4.4.10 Grade wise dropouts rate by gender in primary classes as on 30th Sep 2010 16<strong>21</strong>4
Table DescriptionTable 4.4.11 Grade wise dropouts rate by gender in upper primary classes as on 30th Sept. 2009 163Table 4.4.12 Grade wise dropouts rate by gender in upper primary classes as on 30th Sept. 2010Chapter 5: Reconstructed Cohort AnalysisTable 5.1 Cohort dropout rate at completing primary and upper primary stage by gender and year 164Table 5.2 Coefficient of internal efficiency by stage and gender 165Table 5.3 Average duration of <strong>study</strong> by stage and gender 166Table 6.1.1Table 6.1.2Table 6.1.3Table 6.1.4Table 6.1.5Table 6.1.6Chapter 6: Indicators for Different Social Groups (SC/ ST/ Muslims)Year-wise and grade-wise enrolments in the sampled primary schools across <strong>study</strong><strong>states</strong> among SCs 167Year-wise and grade-wise enrolments in the sampled primary schools across <strong>study</strong><strong>states</strong> among STs 168Year-wise & grade-wise enrolments in the sampled primary schools across <strong>study</strong> <strong>states</strong>among Muslims 169Year-wise and grade-wise enrolments in the sampled upper primary schools across<strong>study</strong> <strong>states</strong> among SCs 170Year-wise and grade-wise enrolments in the sampled upper primary schools across<strong>study</strong> <strong>states</strong> among STs 171Year-wise and grade-wise enrolments in the sampled upper primary schools across<strong>study</strong> <strong>states</strong> among Muslims 172Table 6.1.7 Proportion of SC, ST and Muslim enrolment to the total enrolment 173Table 6.2.1Grade wise number of SC school leavers in primary stage whose houses were visited-2008-09 & 2009-10 174Table 6.2.2Grade wise number of ST school leavers in primary stage whose houses were visited-2008-09 & 2009-10 175Table 6.2.3Grade wise number of Muslim school leavers in primary stage whose houses werevisited-2008-09 & 2009-10 175Table 6.2.4Grade wise number of SC school leavers in upper primary stage whose houses werevisited-2008-09 & 2009-10 176Table 6.2.5Grade wise number of ST school leavers in upper primary stage whose houses werevisited – 2008-09 and 2009-10 177Table 6.2.6Grade wise number of Muslim school leavers in upper primary stage whose houseswere visited- 2008-09 and 2009-10 177Table 6.3.1 Grade wise status of primary school leavers whose houses were visited-SC, 2008-09 178Table 6.3.2 Grade wise status of primary school leavers whose houses were visited-SC, 2009-10 179Table 6.3.3 Grade wise status of primary school leavers whose houses were visited-ST, 2008-09 180Table 6.3.4 Grade wise status of primary school leavers whose houses were visited-ST, 2009-10 180Table 6.3.5Grade wise status of primary school leavers whose houses were visited-Muslims, 2008-09 181Table 6.3.6Grade wise status of primary school leavers whose houses were visited-Muslims, 2009-10 181Table 6.3.7 Grade wise status of primary school leavers whose houses were visited-SC, 2008-09 182Table 6.3.8Grade wise status of upper primary school leavers whose houses were visited-SC, 2009-10 183Table 6.3.9Grade wise status of upper primary school leavers whose houses were visited-ST, 2008-09 184Table 6.3.10Grade wise status of upper primary school leavers whose houses were visited-ST, 2009-10 184Table 6.3.11Grade wise status of primary school leavers whose houses were visited-Muslims, 2008-09 185Table 6.3.12Grade wise status of primary school leavers whose houses were visited-Muslims, 2009-10 185Table 6.4.1Grade wise school leavers’ rate for SCs in primary stage as on 30th Sep 2008 and 30thSep 2009 18615
Table 6.4.2Table 6.4.3Table 6.4.4Table 6.4.5Table 6.4.6Table 6.5.1Table 6.5.2Table 6.5.3Table 6.5.4Table 6.5.5Table 6.5.6Table DescriptionGrade wise school leavers’ rate for STs in primary stage as on 30th Sep 2008 and 30thSep 2009 187Grade wise school leavers’ rate for Muslims in primary stage as on 30th Sep 2008 and30th Sep 2009 187Grade wise school leavers’ rate for SCs in upper primary stage as on 30th Sep 2008 and30th Sep 2009 188Grade wise school leavers’ rate for STs in upper primary stage as on 30th Sep 2008 and30th Sep 2009 189Grade wise school leavers’ rate for Muslims in upper primary stage as on 30th Sep 2008and 30th Sep 2009 189Grade wise dropouts among school leavers for SCs in primary stage as on 30th Sep 2008and 30th Sep 2009 190Grade wise dropouts among school leavers for STs in primary stage as on 30th Sep 2008and 30th Sep 2009 191Grade wise dropouts among school leavers for Muslims in primary stage as on 30th Sep2008 and 30th Sep 2009 191Grade wise dropouts among school leavers for SCs in upper primary stage as on 30thSep 2008 and 30th Sep 2009 192Grade wise dropouts among school leavers for STs in upper primary stage as on 30thSep 2008 and 30th Sep 2009 193Grade wise dropouts among school leavers for Muslims in upper primary stage as on30th Sep 2008 and 30th Sep 2009 193Table 6.6 Number of SC, ST and Muslim graduates of terminal grades whose houses were visited 194Table 6.7.1Grade wise promotion rate for SCs in primary stage as on 30th Sep 2008 and 30th Sep2009 195Table 6.7.2Grade wise promotion rate for STs in primary stage as on 30th Sep 2008 and 30th Sep2009 196Table 6.7.3Grade wise promotion rate for Muslims in primary stage as on 30th Sep 2008 and 30thSep 2009 196Table 6.7.4Grade wise promotion rate for SCs in upper primary stage as on 30th Sep 2008 and 30thSep 2009 197Table 6.7.5Grade wise promotion rate for STs in upper primary stage as on 30th Sep 2008 and 30thSep 2009 198Table 6.7.6Grade wise promotion rate for Muslims in upper primary stage as on 30th Sep 2008 and30th Sep 2009 198Table 6.8.1Grade wise repetition rate for SCs in primary stage as on 30th Sep 2008 and 30th Sep2009 199Table 6.8.2Grade wise repetition rate for STs in primary stage as on 30th Sep 2008 and 30th Sep2009 200Table 6.8.3Grade wise repetition rate for Muslims in primary stage as on 30th Sep 2008 and 30thSep 2009 200Table 6.8.4Grade wise repetition rate for SCs in upper primary stage as on 30th Sep 2008 and 30thSep 2009 201Table 6.8.5Grade wise repetition rate for STs in upper primary stage as on 30th Sep 2008 and 30thSep 2009 202Table 6.8.6Grade wise repetition rate for Muslims in upper primary stage as on 30th Sep 2008 and30th Sep 2009 202Table 6.9.1Grade wise dropout rate for SCs in primary stage as on 30th Sep 2008 and 30th Sep2009 203Table 6.9.2Grade wise dropout rate for STs in primary stage as on 30th Sep 2008 and 30th Sep2009 204Table 6.9.3Grade wise dropout rate for Muslims in primary stage as on 30th Sep 2008 and 30thSep 2009 204Table 6.9.4Grade wise dropout rate for SCs in upper primary stage as on 30th Sep 2008 and 30thSep 2009 20516
Table 6.9.5Table 6.9.6Table DescriptionGrade wise dropout rate for STs in upper primary stage as on 30th Sep 2008 and 30thSep 2009 206Grade wise dropout rate for Muslims in upper primary stage as on 30th Sep 2008 and30th Sep 2009 206Table 6.10.1 Cohort dropout rate – SC 207Table 6.10.2 Cohort dropout rate – ST 208Table 6.10.3 Cohort dropout rate– Muslim 209Table 6.11.1 Coefficient of internal efficiency – SC <strong>21</strong>0Table 6.11.2 Coefficient of internal efficiency – ST <strong>21</strong>1Table 6.11.3 Coefficient of internal efficiency – Muslim <strong>21</strong>2Table 6.12.1 Average duration of <strong>study</strong> – SC <strong>21</strong>3Table 6.12.2 Average duration of <strong>study</strong> – ST <strong>21</strong>4Table 6.12.3 Average duration of <strong>study</strong> – Muslim <strong>21</strong>5Chapter 7: Reasons for dropping out and their current activityTable 7.1.1 Reasons for dropping out of school (primary stage - boys - 2008-09 & 2009-10) <strong>21</strong>6Table 7.1.2 Reasons for dropping out of school (primary classes - Girls - 2008-09 & 2009-10) <strong>21</strong>7Table 7.1.3 Reasons for dropping out of school (upper primary stage - boys - 2008-09 & 2009-10) <strong>21</strong>8Table 7.1.4 Reasons for Dropping out of school (upper primary stage - girls - 2008-09 & 2009-10) <strong>21</strong>9Table 7.2.1 Current activity of the dropouts (Primary stage- Boys - 2008-09 & 2009-10) 220Table 7.2.2 Current activity of the dropouts (Primary stage- girls - 2008-09 & 2009-10) 2<strong>21</strong>Table 7.2.3 Current activity of the dropouts (Upper Primary stage- Boys - 2008-09 & 2009-10) 222Table 7.2.4 Current activity of the dropouts (Upper primary stage- girls - 2008-09 & 2009-10) 22317
CHAPTER - 11.0 PrologueThe phenomenon of students discontinuing studies and repeating grades before completingelementary level of education is a major impediment in achieving Universalization ofElementary Education (UEE). In order to assess its impact on achievement of UEE, it isnecessary to estimate dropout and repetition rates at primary and upper primary stages aswell as transition rate from primary to upper primary. At present there are two mainsources of information on dropout rates (1) official statistics published annually by MHRD inSelected Educational Statistics (SES) now renamed Statistics of School Education (SSE) and(2) District Information System of Education (DISE), initially developed for District PrimaryEducation Programme by NIEPA (now NUEPA) and later expanded to cover all recognizedschools of the country offering primary/upper primary education under <strong>Sarva</strong> <strong>Shiksha</strong><strong>Abhiyan</strong> (SSA). Databases for both of them are the educational statistics supplied by allrecognized schools of the country. In the case of DISE the schools are supposed to fill upspecially designed forms and the school report card become available on to NUEPA on line.The SSE reports dropout rates for grades 1 to 5 and grade 1 to 8, which are actually crudeestimates of the percentage of children who drop out from school between grade 1 andgrade 5 and between grade 1 and grade 8. The first is based on the ratio of the current yearenrolment of grade 5 to grade 1 enrolment of 4 years back. This indicator does not takerepeaters and lateral entry cases into consideration.DISE uses the data on enrolment and number of repeaters of two consecutive years tocompute the percentage of students who dropout from primary stage of education in ayear. Since some schools that supply data in one year do not supply data in the followingyear, the average dropout is computed on the basis of the data of common schools, that is,those which supplied data in both the years. The annual dropout rates so derived arepublished in DISE reports. The dropout rate thus computed does not take lateral entry casesinto consideration.In view of the stated limitations of both the sources, an attempt was made to modify theprocedure of identification of dropouts when on behalf of Ministry of Human ResourceDevelopment (MHRD), EdCIL commissioned Development & Research Services (DRS) toconduct a sample survey in <strong>21</strong> major <strong>states</strong> of the country in 2008-09 to assess the dropoutrates at primary and upper primary stages of education. The modified procedure used in thesurvey is as follows.The methodology of this survey is based on the enrolment of two consecutive years; thefirst one is termed as base year and the later one as successive year. Each student enrolledin a grade of a school in the base year was tracked to identify the educational status in the18
succeeding year. For this purpose enrolment records of the same and the next higher gradeof the same school in the succeeding year and also details of students who left the schoolformed the basis. All the students who left school during an academic session were nottreated as dropouts as some joined other schools. Educational status of such students wasascertained by making visits to their houses. Due to difference in survey methodology,estimates of the dropout rates provided by the survey were quite different from those ofgiven by SSE and DISE. In a few <strong>states</strong> the dropout rates derived from the sample surveydata were substantially less than the dropout rates from other sources. MHRD appointed acommittee of experts to review dropouts among school leavers and dropout ratesestimated by DRS, this committee found the procedure followed for identification ofdropouts amongst school leavers and estimating dropout rates was logically sound andsatisfactory. It however, suggested that a repeat (follow-up) survey in a sub–sample ofschools covered by previous survey (DRS) should be conducted using the same approachand methodology to recheck the findings of previous survey. In addition to checking theresults of previous survey, responsibility of providing latest two years’ estimates of dropoutrates was also given (from primary to upper primary) to TNS India Pvt. Limited which wasselected to conduct the repeat survey or present survey. Transition rates which could not beobtained from the previous survey were also included in the scope of the present survey.1.1 Objectives of SurveyThe main objectives of the survey were:i. To find out discrepancies and extent of deviation in the school wise data collected onenrolment, school leavers, and repeaters for the academic year 2007 - 2008 using theschedules of 2008 - 09 survey.ii. To provide revised estimates of dropout rates for the year 2007-08.iii. To provide estimates of dropout, repetition and promotion rates based on the latestdata of 2008, 2009 and 2010.In addition to the third objective, the <strong>study</strong> also focuses on the following:Assessing attendance rates on the day of visit of the surveyAssessing pass out rate for the terminal grades of primary and upper primary stageTo provide information on other indicators such as rates of transfer betweenschools, mainstreaming of children from EGS schools/AIE centers/Bridge courses andfrom home/ private tuitions/unrecognized schools; promotion and repetition ratefor the lateral entrants.To find out important reasons of leaving the school/dropping out from school,present activity of those who are not in any school.With regards to the objective (i) & (ii), a separate report titled “Re-checking of the datacollected for the academic year 2007-08” has been prepared and submitted separatelywhereas the objective (iii) has been addressed in this report.19
1.2 Pattern of grades in different stages of school education in <strong>21</strong> <strong>states</strong>Variation in educational pattern among <strong>states</strong> is an important consideration for providingestimates of indicators. As far as primary stage is concerned there are only two patterns,viz., grades 1 to 4 and grades 1 to 5. But upper primary stage has four patterns, viz 5 th to 7 thgrade, 5 th to 8 th grade, 6 th to 7 th grade and 6 th to 8 th grade. Therefore the state-wise resultswill be presented according to the education pattern of respective state. The pattern ofeducation in the <strong>21</strong> <strong>study</strong> <strong>states</strong> is provided in the table below:Table 1.1: Classification of <strong>states</strong> based on the schooling patternSTAGES GRADES STATESAndhra Pradesh, Bihar, Chhattisgarh, Delhi, Haryana,Himachal Pradesh, Jammu & Kashmir, Jharkhand,I-VPrimaryKarnataka, Madhya Pradesh, Orissa, Punjab, Rajasthan,Tamil Nadu, Uttar Pradesh, UttarakhandI-IV Assam, Gujarat, Kerala, Maharashtra & West BengalBihar, Chhattisgarh, Delhi, Haryana, Himachal Pradesh, J &VI-VIII K, Jharkhand, Madhya Pradesh, Punjab, Rajasthan, TamilNadu, Uttar Pradesh, UttarakhandUpper PrimaryV-VII Assam, Gujarat, Kerala, MaharashtraV-VIII West BengalVI-VII Andhra Pradesh, Karnataka, Orissa1.3 Definition of the terms used in the surveyi. Enrolment: It is the number of students who were enrolled in a grade as on 30 thSeptember of the years 2008 or 2009. Information on the status was collected fromschool roster. Enrolment included new entrants and repeaters for grade I and newentrants, promotees and repeaters for grade II onwards.ii. Promotees / Pass – outs: Out of the total enrolment in a grade (say, grade III) as on30th September during the base year (say 2008), it is those students’ who werepromoted to the next higher grade (grade IV) and are on roll as on 30 th September ofthe following year (2009), are classified as promotees.Students of grade VIII i.e. who pass grade VII (pass-outs) are treated as promoteesof grade 7,whereas, in the case of the schools having highest grade VII or lower forthe base year 2008 and 2009, the students who were continuing education in gradeVIII in some other schools were considered as promotees.iii. Repeaters - Those students, who remain in the same grade of the same school on30 th September of the following year in which they were <strong>study</strong>ing in the precedingyear either because of failing or low attendance or some other reason, are repeaters.20
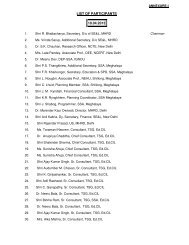
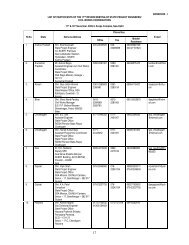
iv. School leaver: A student is termed as school leaver if she/he has left the school andher/his name is struck off from the school roster on or before 30 th September of thefollowing year (2009/2010). A school leaver either discontinues <strong>study</strong> or takesadmission in another school. In the case of schools in which the highest grade is gradeVII or below, students who leaves school after completing the highest grade is alsotreated as school leaver since such a child has to be tracked to find out whethershe/he is a dropout or is <strong>study</strong>ing in another school.v. <strong>Dropout</strong>: A school leaver or pass-out is a dropout if she/he does not pursue studies inanother school during the following academic session. Information about suchstudents has been collected by visiting child’s home or from other reliable sourcesuch as child’s neighbor or from another school in the area.vi. Lateral entrants: Lateral entrants in 2009-10 are those children, who have come fromi) EGS schools /AIE Centers/ Bridge Courses or ii) from another school with TC or iii)after <strong>study</strong>ing at home or through private tuition or from an unrecognized school andwho are directly admitted in grade II or a higher grade in this school during 2009-10.Information on such students has been collected from the available admissionregister of the school.vii. EGS Schools: Schools set up in un-served habitations under Education GuaranteeScheme. Generally such schools have only one teacher and all grades are taughttogether. Most of these schools have now been upgraded as regular schools.viii. AIE Centers: The centers were set up for some specific groups of out of schoolchildren for mainstreaming (that is, preparing them to enter a regular school in duecourse) under Alternative Innovative Education (AIE) programme. Such centerswere termed as Alternative & Innovative Education (AIE) Centers. Some of theexamples of AIE Centers are Seasonal Hostels for migrating children, CondensedCourses/ Residential or Non-residential Bridge Courses/ Back to School Camps. Suchcenters existed in 2007-08 but not after that.1.4 Approach of the <strong>study</strong>Approach adopted to arrive at the key indicators mentioned in the objectives has beendescribed below.1.4.1 The approach of arriving at the indicators for schools with grade 8 or lower asterminal grade:The data was recorded for the promotees, school leavers and repeaters from the schoolrecords. The houses of school leavers were visited to know the status of the students whohad left the schools, except if the terminal grade of the school is grade VIII. If the status of<strong>21</strong>
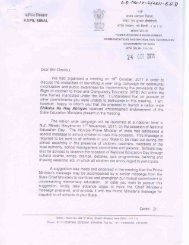
the student was found to be continuing education in some other recognized/unrecognizedschool in the same grade or in the next grade, it was added to the total figure of repeatersor promotees respectively. The status (dropout) of the school leavers who had not joinedany other school was also recorded and considered as dropout and the activity they wereinvolved in was also recorded.Figure 1.1: For Schools with Grade 8 as the Terminal GradeA similar process, as mentioned above, was followed to fill up the information for gradesother than terminal grade in these recognized schools.1.4.2 The approach of arriving at the indicators for terminal gradeIn the case of terminal grade of these recognized schools, student pass-out schedule (DS-3)was also filled wherein the houses of the pass outs of the highest grade (Grade VII or lower)were visited to ascertain the status whether the students were promoted (admitted to nextgrade) or repeated the same grade. This status was used so as to ascertain their continuityin education.22
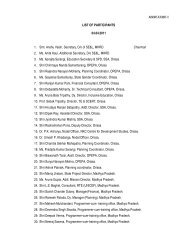
Figure 1.2: for schools with Grade 7 or lower as the Terminal Grade1.5 Methodology adopted for the <strong>study</strong>:As the geographical spread of the <strong>study</strong> covered <strong>21</strong> major <strong>states</strong> of the country includingNCT of Delhi, it was decided to have a Training of Trainers (TOT) in Delhi for a commonunderstanding of the research tools, sampling methodology and structure and managementof fieldwork. Research tools designed and used, sampling procedure followed and strategyadopted for the structure & management of fieldwork have been described below.1.5.1 Tools for data collection:In order to collect data from the school records as well as from the houses of the studentswho left the school during reference period, survey tools of the previous survey weremodified and used for present survey. These research tools are School Schedule (DS-1),School Leaver Schedule (DS-2), and Student Pass-out Schedule (DS-3). The informationcollected during survey from each of the schedule has been described below.1. School Schedule (DS-1)School schedule was prepared to collect information in the following areas separately for2008-09 and 2009-10 years from sampled schools:The profile of the school includes area (rural or urban), school category (school withprimary grades only and school with upper primary grades), type of management ofschool (Government, Local Body, Private Aided, Private Un-Aided), and grades taughtduring 2008-09 and 2009-10.23
Grade wise and gender wise enrolment and attendance on the day of visit to theschool for data collection.Grade wise, gender wise and social group (SC, ST, Muslims) wise enrolment as on 30 thSeptember 2008/2009 and out of this enrolment number of repeaters in the samegrade as on 30 th September 2009/2010, number of promotees in the next grade as on30 th September 2009/2010 and the remaining number of students who left theschool. Number of students directly admitted (lateral entrants) in grade II and above in theacademic year 2009-10 including all those who came on transfer with or without TCfrom another government or private recognized (EGS Schools, AIE Centers, BridgeCourses) schools, or after <strong>study</strong>ing at home or private tuition or unrecognizedschools, .To avoid any sort of human error in filling the information in the school schedule fromthe school records, a working sheet-1 was designed and investigators were asked to fillworking sheet before actually filling the main schedule especially for gender wise andsocial group wise promotees, repeaters and school leavers information.2. School Leaver Schedule (DS-2)School leaver schedule collected following information about those students who left theschool.1. Profile of the school from where students left2. Social status (SC,ST, Muslim, Others)3. Status of the child as on 30 th September 2009/2010 (which includes child has shiftedto another school as repeater or promote or the child has dropped out or the child islikely to continue elsewhere or child has expired).4. Reason for dropping out5. Present activity she/he is involved in after dropping out.Working sheet-1 was used to copy the information of school leaver into the school leaverschedule.3. Student Pass-out Schedule (DS-3)Student pass out schedule was canvassed to collect following information from thosestudents who pass-outs from the higher grade (VII or lower) in the school.1. Profile of the school from where students pass-outs2. Social status (SC,ST, Muslim, Others)3. Status of the student during next academic year whether child is continuing studies inanother school, or child discontinued studies. If status not known, likeliness ofcontinuing or discontinuing education in another school was also collected fromreliable sources.A copy of each tool described above is given in Annexure III24
1.5.2 Sampling procedureThe universe for the previous survey was all the recognized schools of <strong>21</strong> major <strong>states</strong> of thecountry including the NCT of Delhi having primary and/or upper primary grades, whereasthe same schools of the previous survey became the sampling frame for the present survey.Sampling procedure used by previous survey to select around 8,016 schools from a universeof all recognized schools, having primary and/or upper primary grades, in <strong>21</strong> major <strong>states</strong> ofthe country was multistage stratified sampling whereas present survey applied systematiccircular sampling methodology to the list of sampled schools of previous survey to selectrequired number of schools. Sampling procedures used by previous survey and presentsurvey have been separately described below.1.5.2.1 Sampling procedure used in the previous surveyThe target population considered for the previous survey was all the recognized schoolshaving primary and or upper primary grades in them, from <strong>21</strong> major <strong>states</strong> of the countryincluding the NCT of Delhi. The total sample size selected for the <strong>study</strong> was 8000 schools.Initially the sampling frame of 7th All School Education Survey (AISES) database was used bythem for the selection of schools. The basic reason for using AISES database was to have allsuch schools which are complete schools running all the grades so that the data for allgrades for all the three consecutive years are available. This list of schools was furtheraugmented with the help of District Information System of Education (DISE) database tomake it up- to-date.For sampling of schools in rural and urban areas of <strong>21</strong> major <strong>states</strong>, every state was dividedinto three strata, namely (i) Rural (ii) Urban Metro and (iii) Urban non-Metro and thesampling strategy adopted for each stratum was as under.Stratum I (Rural) –3 stage sampling i.e. District, Block and School.Stratum II (Urban Metro) – Single stage sampling i.e. school.Stratum III (Urban non-Metro) – 2 stage sampling i.e. District and School.Sampling of rural schools (Stratum I)In each state, for sampling of rural schools, a three-stage stratified sampling procedure wasadopted. The first stage sampling unit was district, the second stage sampling unit was Blockwithin a district and the third stage was school within the selected Block.In order to select districts, all the districts from <strong>21</strong> major <strong>states</strong> were segregated on thebasis of socio-cultural regions and a total of 203 districts were selected in proportion to thedistribution of the districts in the <strong>study</strong> <strong>states</strong> according to socio-cultural regions. However,Delhi as a special case was treated as a whole due to its special character and multipleeducational authorities.25
The criterion to select the number of Blocks in different selected district is given as under.The total number of Blocks covered in the sample is approximately 500.Sl. No. No. of blocks in the District No. of blocks selected1. 10 or less 22. 11 to 20 33. <strong>21</strong> to 30 44. 31 & above 5Further, for selection of Blocks from each selected district, all the Blocks in the district werefirst arranged in ascending order on the basis of total number of schools in each Block, andthen the required number of Blocks was selected by applying the method of circularsystematic sampling. For selection of ‘Schools with primary grades only’ within a Block, thelist of all such schools was first arranged in ascending order on the basis of total enrolment(grades 1-4/5). In case the total enrolment in a school was less than 10, it was excluded.With the help of this list, the required number of schools was selected by circular systematicsampling method. In the case of ‘Schools with upper primary grades’ the criteria forarranging them in ascending order was the enrolment of grade 6 (a common grade across<strong>states</strong>). If this figure was less than 5 students the school was excluded. In this case also,selection of schools had been made using circular systematic sampling method.Sampling of urban schools (Stratum II & III)For sampling of urban schools in a state, all the urban areas were stratified into two strata,namely (i) Urban-Metro (cities with population of 1 million or more) and (ii) Urban-non-Metro (all other cities/towns with population of less than 1 million). In case of Urban-Metroall the cities were clubbed together, while in case of Urban-non-Metro, the cities/towns ofthe selected districts were considered for sampling of schools.All the schools were than classified into two major categories, i) Schools with primary gradesonly and (ii) Schools with upper primary grades. “Schools with primary grades only” werethe independent primary schools with grades 1-4 or 1-5 as per state pattern whereas thesecond category included all schools having upper primary grades. These schools may ormay not have primary grades or may be a part of secondary/higher secondary schools. Thenumber of schools under each category was decided using proportionate allocation.Urban schools had been independently selected from Urban-Metro and Urban-non-Metrocategories. In Urban-Metro, one combined list of Schools with primary grades only andanother combined list of ‘Schools with upper primary grades’ of all the Metro cities in thestate was used as sampling frame. In case of Urban-non-Metro, within a selected district, acombined list of ‘Schools with primary grades only’ another combined list of ‘Schools withupper primary grades’ from all the cities/towns was used. With the help of these lists theschools were selected by applying the same procedure as mentioned above for ruralschools.26
Here it may be mentioned that certain districts which were badly affected by floods in theState of Assam and Bihar were excluded from the sample and they were replaced by otherdistricts keeping the other parameters intact. Also, in the state of Jammu & Kashmir thework of data collection could not begin in time due to assembly elections which wereconducted in phased manner. Immediately after the election the schools in Kashmir valleyand Leh regions were closed for a long period due to onslaught of winter. Hence, the datafrom required number of schools for the state was collected from Jammu region only.1.5.2.2 Sampling procedure of present surveyThe total sample size decided to be covered under the <strong>study</strong> was 4200 schools which isaround 52.5% of the schools covered in the previous survey. The sampling frame used forthis survey was the list of 8016 schools covered during the previous survey conducted in theyear 2008-2009. In order to select 4200 schools from among the list of 8016 schools, thesimple circular systematic procedure was used which implicitly maintained the sameproportion in the subsample as that of in the sampling frame. Table 1.2 shows sample sizeof previous survey and the proposed and achieved sample size of present survey. Nearly 50% of the total sample size of previous survey and 99 % of proposed sample size of presentsurvey is covered by this survey.Sr.NoTable 1.2: State wise sample size covered by previous and present surveyStateSample sizecovered byprevious surveyProposedsample size ofpresent surveySample sizeachieved inpresent surveyPercentage ofsample sizeachieved1 Andhra Pradesh 403 <strong>21</strong>1 208 98.62 Assam 363 190 190 100.03 Bihar 412 <strong>21</strong>6 <strong>21</strong>5 99.54 Chhattisgarh 374 196 193 98.55 Delhi 332 174 170 97.76 Gujarat 372 195 194 99.57 Haryana 370 194 193 99.58 Himachal Pradesh 372 195 195 100.09 Jammu & Kashmir 373 195 180 92.310 Jharkhand 376 197 195 99.011 Karnataka 401 <strong>21</strong>0 <strong>21</strong>0 100.012 Kerala 368 193 193 100.013 Madhya Pradesh 402 <strong>21</strong>1 207 98.114 Maharashtra 387 203 202 99.515 Orissa 377 197 197 100.016 Punjab 368 193 193 100.017 Rajasthan 400 <strong>21</strong>0 207 98.618 Tamil Nadu 368 193 193 100.019 Uttar Pradesh 426 223 <strong>21</strong>8 97.820 Uttarakhand 371 194 191 98.5<strong>21</strong> West Bengal 401 <strong>21</strong>0 <strong>21</strong>0 100.0Total 8,016 4,200 4,154 98.927
Changes made in the methodology of present survey and their reasonsIn present survey certain changes in the methodology of previous survey have been made.They are given as under:1. Change in the period of Cohort- The period of cohort for a grade was considered from30 th September of the base year to 30 th September of following year. In earlier survey itwas from beginning of a session to completion of session of that grade. This change wasmade to provide a comparative picture with other surveys providing dropout rates onthe similar cohort.2. Accordingly the number of children enrolled as on 30 th September of base year werefollowed in the following year as on 30 th September to identify number of promoteesand number of repeaters.3. This was attempted by preparing a separate three working sheets by listing all studentsfor a grade as on 30 th September for the base year and for the next grade and for thesame grade as on 30 th September in the following year. By matching the names given inthe first sheet with those given in other two working sheets enabled to identify thepromotees and repeaters respectively. The names which did not match and theirnames were struck off from school records were listed separately as school leavers.4. Through this process, it was possible to exclude the lateral entrant cases to follow atrue cohort approach for identifying the actual number of school leavers. And further,by tracking these school leavers through house visits the cohort number of studentswho actually discontinued the studies and also who joined other schools as promoteesor repeaters were identified, This was not possible in the earlier survey and suitableadjustment for lateral entrants was made in working out the dropout rate.1.6 Structure and management of the field work:In order to manage and complete the fieldwork in the stipulated time frame, all the <strong>21</strong><strong>states</strong> were divided into 4 zones for a better control and a zonal coordinator were fixed foreach of the zone to monitor the quality and progress of fieldwork of the <strong>states</strong> under itscontrol. These zonal coordinators reported to project manager - operation in Delhi who wasresponsible for the entire fieldwork of the country. Project Manager (PM) collected biweeklyreports about the progress of the fieldwork from zones and provided the same toProject Coordinator (PC). Under each zonal coordinator, there were Field Executives (FEs)who were directly involved in fieldwork with the deputed teams in respective <strong>states</strong>.Before commencement of fieldwork, a TOT (Training of Trainers) was organized in Delhiwhere all Zonal coordinators and Field Executives were provided training by ProjectCoordinator along with the EdCIL consultant. This training was conducted for 3 days and thefield practice was carried out in non sampled schools of Ghaziabad district of Uttar Pradesh.28
A complete plan of further training of field teams (supervisors and investigators) wasprepared for each of the state and Field Executives & Researchers who attended TOTimparted training to recruited teams in their respective <strong>states</strong>. This training plan was sharedwith RESU. In most of the trainings of field teams, either zonal coordinator or projectcoordinator/researcher was present to ensure the quality of training as well as the quality ofrecruited supervisors and investigators.The field personnel were intensively trained by deputed researchers and field executivesfrom our Delhi & state offices to record the same with greater accuracy. Examples to recordthe details were also provided to the field personnel as a ready-reckoner. A detailed trainingmanual and field briefing note were also provided to supervisors and field executives torefer it whenever required.The field work across the <strong>states</strong> was started in the third week of September 2011 and wascompleted in the second week of January in all the <strong>states</strong>. The data was collected from theschool registers by investigators but it was important to pick up the right data for calculatingtotal promotees, total repeaters and total school leavers from the registers, therefore aWorking Sheet -1 was also provided to copy the information from registers. From this sheet,information was compiled and transferred in the above mentioned schedules. Thisprocedure was adopted to avoid any sort of confusion among investigators to fill the mainschedule and to prevent data from any sort of human error.Problems faced during fieldworkIt is important to mention here that some schools of the original sampled list had to bereplaced during the course of the survey owing to such reasons as permanent closure of theschool, shifting of school to a different place, noncooperation from the school authoritiesespecially in case of privately managed recognized schools. In such cases, a suitablereplacement was taken from the same block. In Chhattisgarh, local police authorities inDantewada district advised our teams against carrying out field work in Kawardha,Bhopalpatnam and Sukma blocks. Hence, the samples from these blocks were replaced withsimilar samples from the neighboring districts of Korba, Kawardha and Koriya. 15 recognizedschools were dropped in the Jammu district of Jammu and Kashmir as there was a lot ofvariation in the blocks and districts and the schools could not be located. Most of the schoolauthorities could not provide the eleven digit DISE code of the schools.Checks on the quality of the field work:The data collected from the field passed through four rounds of manual scrutiny before itreached the data entry operators at the central level:‣ 100 % scrutiny was done by the field supervisors at the field level.‣ 20 % scrutiny was also done by the Field Executives during their visits to the team.‣ The state coordinator conducted a random check of 10 % of the filled-in questionnairesat the state level.29
‣ The Core research team conducted a 5 % scrutiny check before the filled-in scheduleswere transferred to the data entry team.It was ensured that all the four schedules related to a school were tagged together beforetransferring the same to the data lab.1.7 Statistical analysis of dataAs it has been mentioned in the section of tools for data collection above, a working sheet-1was developed to copy information from the school records about promotees, repeatersand school leavers. This information was then transferred on to the school schedule (DS-1).Supervisors and field executives ensured that the information transferred on to the schoolschedule is correct in all respect by randomly verifying filled school schedules (DS-1) withworking sheets-1. All the filled schedules from <strong>21</strong> <strong>states</strong> were dispatched to Delhi by theirrespective field offices for data entry after thorough scrutiny and completeness of schedulesin all respects.In order to carry out data entry operations smoothly, customized data entry software wasdeveloped with all inbuilt range and logical checks. Data entry of all the schedules was doneincluding working sheet – 1.Data entry provided 4 separate data sets viz. school schedule (DS-1), school leaver schedule(DS-2), students pass-out schedule (DS-3) and working sheet-1. These data sets werecleaned by applying a number of validation checks to improve its quality. Data set of DS-1was cross verified with the data set of working sheet-1 by generating and comparing genderwise and social group wise frequency tables for each school from both the data sets. Thisexercise ensured the number of promotees, repeaters and school leavers collected fromrecords of each school were correct.To workout dropout, repetition and promotion rates, state level estimates have beencalculated by following an estimation procedure i.e. by multiplying each cell value of schoollevel data on enrolment and other related items in DS-1 separately for each stratum namelyrural primary, rural upper primary, urban primary and urban upper primary by respectivemultipliers (for estimation procedure refer Annexure-II).. After multiplication, the resultantvalues are further simply aggregated for drawing state level values. Grade wise and stagewise attendance rate on the day of visit of school was also worked out by aggregating schoollevel data on attendance from DS-1 for rural and urban schools for each of the state. Toarrive at All <strong>states</strong> (all <strong>states</strong> combined figures) figures, a simple aggregation of values wasdone. For each indicator an average of the stage (primary and upper primary) is also givenand this average is the weighted average of all the grades in that stage according to thestate pattern.School leaver rate, pass out rate and transition rate have also been worked out for boys andgirls for each state for primary and upper primary stage separately. Detailed statistical30
analysis plan is given in Annexure II and the formulae used for calculation of various ratesmentioned above are provided in the same Annexure.The estimates are provided as per the following domains, strata and gender.Domains of the <strong>study</strong>1. Grades in a primary recognized school2. Grades in the recognized schools having upper primary stage.Strata1. Metro cities2. Other urban towns3. RuralGender1. Boys2. GirlsAll the rates (promotion, repetition, school leaver and dropout) are given as per the abovementioned domains of the <strong>study</strong> and by gender for the two separate years (2008-09 and2009-2010). Stratum wise (Rural/Urban) these rates have not been analyzed owing to theinsufficient sample size of urban areas.Reconstructed Cohort MethodOut of a given cohort of N children entering grade 1, some children will complete grade 5 inminimum 5 years, some will take more than five years due to repetition and some willdropout before completing grade 5. The various indicators depicting pupils’ experience aspromotees, repeaters and dropout are computed by using the reconstructed cohortmethod. It is a more pertinent and commonly used method which places less demand onthe availability of detailed data over time. To apply this method, data on enrolment bygrade for two consecutive years and on repeaters by grade from the first to second year willbe sufficient to enable the estimation of three main flow-rates: promotion, repetition anddropout. These rates are used in a reconstructed pupil-cohort flow (refer Figure 1.3) toderive other indicators such as cohort dropout rate, average duration of the <strong>study</strong> andcoefficient of internal efficiency. In the reconstructed cohort method it is assumed that thepromotion, repetition and dropout rates of the base year for a specific grade hold good forthe same grade in subsequent years. It is further assumed that a student is allowed torepeat a grade any number of times until she/he is promoted to next grade or discontinuestudies.31
Figure 1.3: Reconstructed cohort for primary stage of BiharCohort <strong>Dropout</strong> Rate:The children enrolled in grade 1 of primary stage (or entry grade 5/6 of upper primary stage)who would drop out before completing (graduating) the full cycle of primary (or upperprimary) education is the dropouts from the cohort of the corresponding level. The cohortdropout rate at primary/upper primary stage is calculated as the percentage of the studentsof entry grade of the stage (primary/upper primary) to the total number of students whodropout before completing the terminal grade of the stage. The figure 1.3 indicates that ofthe 1000 children enrolled in grade 1 during the base year, 34 students are dropout of grade1, 19 of grade 2, 33 of grade 3, 30 of grade 5 and 25 of grade 5. Thus, cohort dropout rate atprimary stage in this case is 14.1%.Coefficient of Internal Efficiency:It is the ideal (optimal) number of pupil-years required (i.e. in the absence of repetition anddrop-out) to produce a number of graduates from a given school-cohort for a cycle or levelof education expressed as a percentage of the actual number of pupil-years spent toproduce the same number of graduates. Input-Output ratio, which is the reciprocal of the32
coefficient of efficiency, is often used as an alternative. N.B. One school-year spent in agrade by a pupil is counted as one pupil-year.This is a synthetic indicator of the internal efficiency of an educational system. Itsummarises the consequences of repetition and drop-out on the efficiency of theeducational process in producing graduates.It is computed as the ratio of ideal number of pupil-years (y*g) required to produce thesame number of graduates(g) to actual number of pupil-years (f) spent to produce thegraduates for a cohort of say 1000 children entering grade 1. To get the value of Coefficientof Internal Efficiency, the ratio is multiplied by 100. The following formula uses thenotations indicated in the following figure.Coefficien tofy gInternal Efficiency 100fA Coefficient of Efficiency approaching 100% indicates a high overall level of internalefficiency and no wastage due to repetition and drop-out. Coefficient of Efficiency of lessthan 100% signals inefficiency due to grade repetition and drop-out. As the reciprocal, theoptimum input-output ratio is unity i.e. 1, and inefficiency arises from any point which isgreater than one.Average Duration of StudyIt provides the estimate of extra duration of completing the level of education. It is the ratioof actual pupil years for graduating (a) the level of education by the graduates(g).1.7.1 Important formulae used in deriving the estimatesAlthough, detailed analysis plan has been given in Annexure-II, however important formulaeused in deriving key indicators have been described below.Promotion rate: The percentage of pupils/students promoted to the next grade/year levelin the following school year out of the total enrolment. The promoted students details forgrade ‘g’ as on 30 th September of year ‘t’ were taken from the school register of grade g+1as on 30 th September of year t+1 or the students who continued studies in the same school.For the pass outs of the terminal grade and school leavers, the status on promotion wastaken from the parents by making a home visit.Number of students promoted to grade g + 1 on 30th Sept. of year t + 1Total number of students in grade ′g ′ ∗ 100on 30th Sept. of year ′t′Transition rate: It is the percentage of pupils who graduate from one level of education andmove on to the next higher level (from primary stage to upper primary stage, e.g. fromGrade IV to Grade V) In our <strong>study</strong> we have calculated transition rate for primary to upper33
primary stage and have also included the data on the school leavers, pass outs of theterminal grade (for grade 7 or lower) for the calculation of the transition rate.Number of students who passed are continuing in grade g + 1as on 30th Sept. of year t + 1∗ 100Total number of students in grade g on 30th Sept. of year tRepetition rate: The percentages of students who did not get promoted to next grade g+1but remained in the grade g on 30 th Sept. of year t+1Number of Repeaters in grade g on 30th Sept. of year t + 1Total Number of students in grade g on 30th Sept. of year t ∗ 100School leaver rate: Out of Total number of students enrolled in grade g on 30 th Septemberof year t, those who left the school before 30 th Sept. of year t+1 (due to any reason andwhose name is struck off the rolls) are school leavers. Their number divided by the totalenrolment in the grade g on 30 th Sept. of Year t gives school leaver rate.Number of students of grade of who left the schoolas on or before 30th Sept. of yearTotal Number of students in grade ′g ′ on 30th Sept. of year ′t′ ∗ 100<strong>Dropout</strong> rate: The percentage of school leavers or pass-outs out of total enrolment who donot pursue studies in the same or some other school during the following academic sessiongives the dropout rate. The grade-wise and stage wise dropout rates (primary, upperprimary) calculated in this <strong>study</strong>.Number of students of grade g as on 30th Sept. of year t droppingout from school before 30th Sept. of year t + 1Total Number of students enrolled in grade ′g ′ on 30th Sept. of year ′t′ ∗ 100For each indicator an average of the stage (primary and upper primary) is alsogiven and this average is calculated as the weighted average of all the grades inthat stage according to the state pattern.1.8 Organization of the reportIn continuation to Chapter-1, Chapter-2 talks about number of schools covered (primary &upper primary) during the survey, grade wise number of children enrolled and number ofthose who left the school on or before 30 th September 2009 and 2010 and number ofhouses of school leavers visited. It also gives an idea of the attendance rate (boys/girls) onthe day of visit to the school covered in the survey. Chapter-3 provides state wise indicatorslike school leaver rate, discontinued among school leavers, pass out rate, transition rate andlateral entrants separately for primary and upper schools with gender break-ups. Anotherfour important indicators like promotion rate, repetition rate and dropout rate have been34
described gender wise in detail in Chapter-4 separately for both the stages i.e. primary andupper Primary. Cohort dropout rate, coefficient of internal efficiency and average years of<strong>study</strong> have been analyzed and described for primary and upper primary stage in Chapter-5entitled as Reconstructed Cohort Analysis. Chapter-6 is devoted to all the key indicators ofsocial groups (SC, ST & Muslims) covering enrolment, school leaver rate, promotion rate,pass out rate, repetition rate, drop out among school leavers, dropout rate, cohort dropoutrate, coefficient of internal efficiency and average years of <strong>study</strong> for both the stages.Chapter-7 discusses the reasons of dropping out and the activities in which the dropoutswere engaged.35
CHAPTER 2Coverage of Schools and their status of Enrolment, Attendance Rates andHouse visits of School LeaversIt has already been mentioned in previous chapter that a sample size of 4200 schools wasfixed to carry out repeat survey. It was also decided to select these 4200 schools fromamong the schools covered in the previous survey which was conducted during 2008-09.The simple circular systematic sampling procedure was used for this purpose. A descriptionof the coverage of schools during repeat survey and their status of enrolment, attendancerates and house visits of school leavers and pass-outs of the highest grade of schools hasbeen included in this chapter for the reference years 2008-09 and 2009-10.2.1 Schools coverageTable 2.1 presents the state-wise school’s coverage. The <strong>study</strong> was conducted in <strong>21</strong> major<strong>states</strong> of and a sample ranging between 170 and <strong>21</strong>8 schools (primary and upper primary)was chosen from each of these <strong>21</strong> <strong>states</strong>. A total of 4,154 schools were surveyed. From thetotal 4,154 schools, 2,401 schools (58 %) had only primary grades and the rest 1753 schools(42 %) had upper primary grades. Out of 1,753 schools, 1,008 and 392 upper primaryschools were with and without primary grades respectively, whereas the rest 353 schoolswere secondary schools having upper primary grades (refer table 2.2.2 in Annexure-I forstate wise details). Among primary and upper primary schools covered during the survey,0.6 % primary and 3.3 % upper primary schools were found to be incomplete. Nearly 86 % ofthe total primary schools covered in the present survey were from rural areas. Of the totalupper primary schools covered, every fourth school was from an urban area.Figure 2.1 Proportion of primary and upper primary schools by type of management10080604020093.64.1 2.3Primary School78.810.8 10.4Upper Primary SchoolGovernment Private Aided Private Un-aided Figures in percent of schoolsFigure 2.1 shows a large proportion of the schools (93.6 % primary and 78.8 % upperprimary) covered during the survey were managed by government & local body. A little over10 % of the upper primary schools were private aided and un-aided schoolsTable 2.1: Number of schools covered by area and school category36
Total Schools with primary Schools with upper Number of incompleteschoolsgradesprimary gradesschools withSl.StatecoveredPrimary Upper primaryRural Urban Total Rural Urban Totalgrades grades1 Andhra Pradesh 208 125 13 138 50 20 70 3 12 Assam 190 137 7 144 42 4 46 0 13 Bihar <strong>21</strong>5 1<strong>21</strong> 9 130 75 10 85 1 164 Chhattisgarh 193 127 7 134 48 11 59 1 15 Delhi 170 8 82 90 6 74 80 3 46 Gujarat 194 18 7 25 138 31 169 1 197 Haryana 193 85 15 100 72 <strong>21</strong> 93 1 18 Himachal Pradesh 195 128 6 134 55 6 61 0 39 Jammu & Kashmir 180 80 8 88 75 17 92 0 1010 Jharkhand 195 107 15 122 61 12 73 5 2411 Karnataka <strong>21</strong>0 74 9 83 96 31 127 1 512 Kerala 193 67 <strong>21</strong> 88 81 24 105 0 1413 Madhya Pradesh 207 104 12 116 61 30 91 1 314 Maharashtra 202 88 12 100 76 26 102 2 1315 Orissa 197 129 8 137 53 7 60 1 116 Punjab 193 112 14 126 55 12 67 0 <strong>21</strong>7 Rajasthan 207 79 6 85 91 31 122 5 818 Tamil Nadu 193 92 27 119 48 26 74 0 <strong>21</strong>9 Uttar Pradesh <strong>21</strong>8 133 22 155 44 19 63 1 020 Uttarakhand 191 113 11 124 53 14 67 0 0<strong>21</strong> West Bengal <strong>21</strong>0 132 31 163 35 12 47 0 9All States 4,154 2,059 342 2,401 1315 438 1753 26 137% of total schools 100.0 49.6 8.2 57.8 31.7 10.5 42.2 0.6 3.3Out of the proposed 4,200 schools, <strong>21</strong>7 schools had to be replaced from original sampledlist during the course of the survey owing to the reasons such as permanent closure of theschools, shifting of school to a different place, non co-operation from the school authoritiesespecially in case of privately managed recognized schools. In such cases, the schools of thesame category in the same block were selected as replacement schools from the samplingframe (list of 8,016 schools) of previous survey. In Chhattisgarh, local police authorities inDantewada district advised our teams against carrying out field work in Kawardha,Bhopalpatnam and Sukma blocks. Hence, the samples from these blocks were replaced withsimilar samples in the neighboring districts of Korba, Kawardha and Koriya districts. A totalof 46 schools (1.1%) could not be covered and 15 recognized schools were dropped in theJammu district of Jammu and Kashmir alone as there was a lot of variation in the list ofschools of selected blocks and districts due to which the schools could not be located.37
2.2 Student enrolment in the sampled schoolsGrade wise enrolments (as on 30th Sept 2008 and 2009) were recorded from the schoolregisters along with the child’s gender (boys, girls) and social group status (SC, ST andMuslims) for primary and upper primary grades.A total of 4.58 lac students were found enrolled from grade-1 to grade-5 in the sampled2,401 primary schools by 30 th September 2008. Total enrolment by 30 th September 2009 inprimary grades was around 4.48 lacs. Figure 2.2 indicates that the gap between enrolmentof boys and girls in primary schools was around 9 thousand on 30 th September 2008 whichhas reduced to 7 thousand by 30 th September 2009. .Figure 2.2 Number of students enrolled in sampled primary schools during 2008-09 and 2009-102,50,0002,33,723 2,25,223 2,27,205 2,20,8272,00,0001,50,0001,00,00050,000-2008-09 2009-10Boys Girls Absolute FiguresGrade wise enrolment shows a decreasing trend from grade-1 to grade-5 in primary schoolsin both the reference years.In the sampled 1,753 upper primary schools, 1,04,960 boys and 99,076 girls were foundenrolled from grade-6 to grade-8 in 2008-09 academic year. This number reduced to1,04,479 among boys but among girls, it has increased to 99,927 during next year in thesame grades of upper primary schools. More boys were found enrolled than girls in both theyears but the gap between the enrolment of boys and girls has reduced from 5,227 in 2008-09 to 3,924 students in 2009-10. (Figure 2.3)38
Figure 2.3 Number of students enrolled in sampled upper primary schools during 2008-09 and2009-101,50,0001,25,0001,00,00075,00050,00025,000-1,04,960 1,04,47999,076 99,9272008-09 2009-10Boys Girls Absolute FiguresAndhra Pradesh, Madhya Pradesh, Tamil Nadu, Uttar Pradesh and West Bengal are the<strong>states</strong> where girls’ enrolment is more than the boys’ enrolment in each grade of upperprimary stage during 2008-09. These <strong>states</strong> and Jharkhand indicated the same trend in2009-10. (Table 2.2.3 & 2.2.4, Annexure-I)2.3 Attendance rates on the day of school visitGovernment has continuously been trying to enroll all children of age 6-14 in schools and toincrease retention rate at the elementary stage of education. It is not only important toenroll all the young children, but it is also necessary to ensure that they attend the schoolregularly. In this regard, information was collected on enrolment and attendance of childrenin each grade of the sampled schools on the day of visit. The information of enrolment wastaken from the attendance registers of respective grades and attendance was checked byactual head count of children in each grade.The figure 2.4 shows the grade-wise attendance rates in the sampled schools. At all <strong>states</strong>level, on an average the attendance rates of boys are more or less similar to girls in primaryas well as upper primary grades.Figure 2.4: Grade-wise attendance rates on the day of visit by gender1008074Primary GradesUpper Primary Grades74 75 75 75 76 7775 77 77 76 77 78 7873736040200Grade 1 Grade 2 Grade 3 Grade 4 Grade 5 Grade 6 Grade 7 Grade 8Boys Girls Figures in percent of students39
Table 2.2 shows, students in Kerala (94.8%) and Maharashtra (91.5%) have attendance ratesin excess of 90 % in primary stage. It is worth noting that, Maharashtra has recorded higherattendance rate (92.1%) in upper primary stage compared to the primary stage in the state.In Tamil Nadu also nearly 90 % in primary students were present in primary and upperprimary schools on the day of visit of survey. Attendance rate at primary stage was less than66% in the <strong>states</strong> of Bihar (60.1%), Jharkhand (58.1%), Madhya Pradesh (62.7%), UttarPradesh (65.6%) and West Bengal (63.8%) on the day of visit to school. The same level ofattendance at the upper primary stage was observed in the <strong>states</strong> of Bihar (53.7%),Jharkhand (52.8%), Madhya Pradesh (64.1%) and West Bengal (54.7%) Attendance rate forall the <strong>states</strong> combined together is around 75 % for both primary and upper primary stages.Among the primary and upper primary stage, highest variation in attendance rates betweenboys and girls was observed in the <strong>states</strong> of Karnataka and Kerala. In Karnataka 87.4 % girlswere present against 81.1% boys in primary schools. Similarly in upper primary grades,94.1% girls were % against 83.6% boys. The percentage of girls present was more by 5%points than boys at the upper primary stage in the <strong>states</strong> of Kerala (94.1%, 83.6%respectively) and Uttarakhand (78.4%, 71.9% respectively). Grades wise attendance ratesfor boys and girls for each of the state have been given separately for primary and upperprimary grades in table 2.3.1 & 2.3.2 respectively in Annexure-I.Table 2.2 Attendance rates on the day of visit in schools for primary and upper primary stageSr. noStatePrimary StageUpper Primary StageTotal Boys Girls Total Boys Girls1 Andhra Pradesh 82.5 82.1 82.9 85.4 84.9 85.82 Assam 69.4 67.3 71.4 67.9 66.1 69.83 Bihar 60.1 59.5 60.7 53.7 52.8 54.94 Chhattisgarh 66.7 66.7 66.8 75.9 72.3 79.45 Delhi 81.8 83.4 80.8 81.4 82.7 79.36 Gujarat 87.2 87.5 86.9 89.4 90.2 88.67 Haryana 85.3 85.6 85.0 84.1 82.2 86.18 Himachal Pradesh 88.3 89.0 87.7 84.5 84.2 84.99 Jammu & Kashmir 84.4 84.3 84.6 76.3 77.4 75.010 Jharkhand 58.1 57.1 59.1 52.8 50.2 54.911 Karnataka 84.0 81.1 87.4 87.7 87.1 88.412 Kerala 94.8 95.4 94.2 88.1 83.6 94.113 Madhya Pradesh 62.7 62.3 63.1 64.1 63.7 64.614 Maharashtra 91.5 91.0 92.1 92.1 92.3 91.815 Orissa 73.8 73.0 74.5 73.9 73.3 74.616 Punjab 83.3 82.2 84.6 85.3 84.1 86.917 Rajasthan 73.8 74.7 72.8 76.6 78.5 74.<strong>21</strong>8 Tamil Nadu 89.7 89.3 90.2 90.9 89.7 91.940
Sr. noStatePrimary StageUpper Primary StageTotal Boys Girls Total Boys Girls19 Uttar Pradesh 65.6 65.4 65.9 68.3 68.9 67.820 Uttarakhand 74.6 75.0 74.2 74.5 71.0 78.4<strong>21</strong> West Bengal 63.8 62.3 65.4 54.7 56.8 53.6All States 75.5 75.3 75.6 75.9 75.8 76.02.4 Visits to the houses of school leaversIn order to know the status of the students who left the school in any grade, that is, whetherthey are continuing or have discontinued their education, house visits were made. Visitswere also made to the houses of those children who had passed out of the highest grade ofthe school, if the highest grade of school was grade 7 or lower. In the case of grade 8, it wasnot deemed necessary to find out whether graduate had gone to a secondary school or notafter passing grade 8. During the years 2008-09 and 2009-10 houses of 48,462 students ofprimary grades and 14,791 students of upper primary grades had left school; their houseswere visited to ascertain their education status.Figure 2.5 Year wise number of school leavers of primary and upper primary stages by gender,whose houses were visited20.015.010.0Primary Stage15.412.<strong>21</strong>1.39.5Upper Primary Stage5.04.73.93.42.70.0Boys Girls Boys Girls2008-09 2009-10 Figures in thousandsFigure 2.5 reveals that in both the stages, there is considerable reduction in the number ofschool leavers during the assessment years. At primary stage, school leavers had reducedfrom 27.6 thousand in 2008-09 to 20.8 thousand in 2009-10. Similarly a decline of around1.4 thousand school leavers had been observed at upper primary stage between thereference years. Considerable decline is mainly due to decrease in number of studentsenrolled as well as decrease in the number of school leavers.In all the grades of primary and upper primary stages, number of boys who left the schoolwas more than the number of girls in both the years i.e. 2008-09 and 2009-10. In all <strong>states</strong>level, there were 6,967, 6,112, 5,898, 5,152 and 3,498 school leavers in grade-1, 2, 3, 4 and41
5 respectively in 2008-09 among primary schools. The data indicates that the number ofschool leavers reduces with the increase in grades. Similar trend was observed in 2009-10 inprimary schools and in both the assessment years of upper primary schools. (Refer Table2.4.1 to 2.4.4, Annexure-I)2.5 Visits to the houses of pass-outs of last gradeIn addition to the visits to the houses of school leavers, the houses of pass-outs of theterminal grade were also visited to find out whether they had taken admission in anotherschool or not. Houses of pass-outs of the following types of students were visited:Students who passed out from terminal grade (grade-4/5) of primary stageStudents who passed out from terminal grade of upper primary stage whereterminal grade of upper primary stage is VII or lowerStudents who passed out from the highest grade of incomplete schoolsA total of 48,913 houses of 2008-09 pass-outs and 49,611 houses of 2009-10 pass outs ofprimary schools were visited during the survey. In upper primary schools, <strong>21</strong>,004 and <strong>21</strong>,471students were found to be graduated during 2008-09 and 2009-10 respectively and theirhouses were visited to ascertain the education status. This is represented in figure 2.6Figure 2.6 Year wise number of graduates/completers of highest grade of primary and upperprimary stages by gender whose houses were visited302024.1Primary Stage24.4 24.8 25.3Upper Primary Stage1010.8 10.810.<strong>21</strong>0.70Boys Girls Boys Girls2008-09 2009-10 Figures in thousandsFor 2008-09 and 2009-10 highest numbers of visits to the houses of graduates of highestgrade of primary schools (Grade V or lower) was made in Delhi, West Bengal and UttarPradesh and combined these <strong>states</strong> accounted for around 30 % of all such visits made. Delhihad the highest number (5,982 & 6,0<strong>21</strong>) of graduates in both the assessment years (i.e.2008-09 & 2009-10) respectively among primary schools. Among upper primary schools,Gujarat, Kerala and Karnataka are the <strong>states</strong> where 60% of the total number of houses ofgraduates/completers of <strong>21</strong> <strong>study</strong> <strong>states</strong> was visited in both the reference years. Lowestnumber of visits to the houses of graduates was found in the state of Jammu & Kashmir in42
oth reference years. State wise number of houses of graduates/ completers visited hasbeen given in table 2.1.14, Annexure-I.43
CHAPTER 3School Leavers, Pass outs, Transition Rate and Lateral Entrants3.1 School LeaversSchool leaver, as identified in DS1 schedule, is a student who has left the school and hisname is struck off from the school roster any time during 30 th September of two consecutiveeducation sessions. As discussed in the earlier chapters, School Leavers (DS-2) schedule wasadministered on these students of all the grades to assess the child’s education status interms of discontinued education, continued education as repeater in the same grade andcontinued education in the next grade as a promotee. This section attempted to providepercentage of each of these out of total school leavers.3.1.1 Status of school leavers of primary grades whose houses were visitedOut of the school leavers who continued their education in some other recognized orunrecognized schools, it was assessed from their house visit whether they are <strong>study</strong>ing inthe same grade in which they left the earlier school or they are <strong>study</strong>ing in the next grade.Those who were <strong>study</strong>ing in the same grade in some other school after leaving the schoolwere termed as continued repeater and those who took admission in the next grade insome other schools were termed as continued promotees. The remaining students whodiscontinued education were termed as discontinued.Figure 3.1 Status of school leavers of primary stage whose houses were visited, 2008-09 & 2009-105040302010032.1 32.4 31.7Continuing asRepeater2008-09 2009-1044.545.543.4Continuing asPromotee23.422.124.9Figure 3.1 presents the status of school leavers of primary stage whose houses were visitedto ascertain their status of education after leaving the school. 76.6% school leaverscontinued in some other school as a promotee/ repeater in 2008-09 and 73% continued in2009-10 at the primary stage. Among the students who continued their education, 32.1%continued as repeater and 44.5% continued as promotees in 2008-09 and in 2009-10 thestudents continuing as promotees had decreased to 30.2 % and as repeaters increased to42.845.340.7Discontinued Continuing asRepeaterTotal Boys Girls30.231.1 29.2Continuing asPromotee26.928.125.5Discontinuedin percent44
42.8 %. The continuation and discontinuation behaviour amongst the school leavers wassimilar for both boys and girls.The continuation rate of >=80% at the primary stage was prevalent in 9 out of <strong>21</strong> <strong>states</strong> in2008-09 and in 4 <strong>states</strong> in 2009-10. Kerala had the highest continuation rate in 2008-09(93%) and in 2009-10 (94.5%).Andhra Pradesh, Gujarat, Jammu and Kashmir and Keralarecorded more than 80% continuation rate amongst the school leavers’ in both 2008-09 and2009-10 for primary stage.In grade 1, discontinuation rate among the school leavers of close to 50 % was recorded inWest Bengal in 2008-09 and 2009-10. Assam (51.6 %), West Bengal (68.7 %) recorded a veryhigh discontinuation rate among the school leavers in the last grade (Grade 4) of theprimary stage in 2008-09. Grade wise and gender wise status(repeater/promotee/discontinued) of school leavers is given for each state in table 3.1.1 to3.1.6 in Annexure-1 for both the years.Overall grade 5 has a very low continuation rate (around 50 %) amongst the schoolleavers’ in both 2008-09 and 2009-10.3.1.2 Status of school leavers of upper primary grades whose houses were visitedFigure 3.2: Status of school leavers of upper primary stage whose houses were visited, 2008-09 &2009-10602008-09 2009-1050403031.431.032.144.544.644.324.124.423.637.2 36.538.226.525.827.636.337.634.220100Continuing asRepeaterContinuing asPromoteeDiscontinuedContinuing asRepeaterTotal Boys GirlsContinuing asPromoteeDiscontinuedin percentFigure 3.2 provides status of the school leavers of upper primary grades which wasascertained after visiting their houses. It was found that nearly 76 % of the school leaverscontinued their education in some other schools during 2008-09 which has come down to63.7 % during 2009-10. Proportion of students continued as repeaters had increased by 6percentage points in 2009-10. Proportion of school leavers of upper primary grades who45
continued as promotees has considerably reduced (18 percentage points) from 2008-09 to2009-10. Percentage of school leavers who discontinued has gone up by around 11percentage points in 2009-10. Not much variation is observed between boys and girls in theproportion of school leavers who continued as repeater or promotees or who discontinuedduring 2008-09 and 2009-10. Grade wise and gender wise status of school leavers can beseen for each state in table 3.1.7 to 3.1.12 in Annexure-1 for both the years.Among the students who continued their education, 31.4% continued as repeater and44.5% continued as promotee in 2008-09 and in 2009-10 the students continuing aspromotees had decreased to 26.5 % and as repeaters increased to 37.2 %. The continuationand discontinuation behaviour amongst the school leavers was similar for both boys andgirls. The continuation rate of >=80% was prevalent in Andhra Pradesh, Delhi, Gujarat,Haryana, Kerala, Maharashtra and Punjab ,in 2009-10 it was there in Gujarat, Kerala, andMaharashtra.Kerala, Maharashtra and Gujarat recorded more than 80% continuation rate amongstthe school leavers’ in both 2008-09 and 2009-10 for upper primary stage.3.1.3 School leavers’ ratesThe chart below gives us the school leaver rates (school leavers as a proportion ofenrolment as on 30 th Sept. of the base year) by gender for the two assessment years. It canbe seen that the school leavers’ rates for both primary and upper primary grades has gonedown.Figure 3.3: School Leavers’ rates by stage and gender in 2008-09 and 2009-10108646.77.3Primary gradessUpper primary grades6.05.8 6.05.2 5.24.7 4.44.74.03.2202008-09 2009-10 2008-09 2009-10Total Boys Girlsin percentAs suggested by Figure 3.3, out of those primary grades children who were on roll on 30 thSept 2008, around 7 % of primary grades’ children have left the school any time before 30thSept 2009. The school leavers’ rate at primary stage has come down to 5.2 % in thesucceeding year 2009-10. Around 1.5 percentage point decrease in school leaver’s rate hasbeen observed among boys and 1.3 percentage points among girls in the succeeding year2009-10 in the primary classes. Table 3.1.13 and 3.1.14 in annexure indicates that the46
Grade 1Grade 2Grade 3Grade 4Grade 5PrimaryStageGrade 1Grade 2Grade 3Grade 4Grade 5PrimaryStagegender divide among school leaver’s of primary classes was low in both the <strong>study</strong> periodsbut in each state there were a high number of boys leaving the school as compared to thegirls.It is observed that school leaver’s rate decrease with the increase in grades among primarygrades in most of the <strong>states</strong> hence grade-1 showing highest school leaver’s rate (7.8%) andgrade-5 recorded lowest (5.3%) in year 2008-09 and the same pattern is observed in theyear 2009-10.In 2008-09, grade 1, high school leavers’ rate was recorded in Andhra Pradesh (12.9%),Jharkhand (12.7%), Jammu and Kashmir (11.8%), Rajasthan (16.8 %), Uttar Pradesh (8.9 %)and Chhattisgarh (7.6%). In the subsequent grades the school leavers’ rate has decreased inboth the reference years.Andhra Pradesh, Jharkhand and Rajasthan have recorded double digit school leavers’ rate in 2008-09Rajasthan (14.2%), Jharkhand (11.3%) and Andhra Pradesh (10.2%) are the <strong>states</strong> wherehighest number of students left the school among all the <strong>study</strong> <strong>states</strong>. The lowest schoolleavers’ rate for primary was recorded in Kerala (except grade 5) and Delhi where around1.2 % of children have reported to have left the school before completion of the grade inboth the <strong>study</strong> periods. In 2009-10 the school leaver’s rate has decreased for all the gradesand in all the <strong>states</strong>.Table 3.1.1: School leavers’ rates in primary grades by state2008-09 2009-10Sr.No State1 Andhra Pradesh 12.9 11.4 10.9 12.3 3.1 10.2 11.5 10.3 8.5 8.4 4.8 8.72 Assam 4.7 5.0 4.5 2.2 - 4.1 4.2 3.3 1.9 1.5 - 2.83 Bihar 7.9 8.4 8.5 7.7 6.5 7.8 7.9 7.2 8.2 7.4 6.3 7.44 Chhattisgarh 7.6 6.4 6.0 5.5 3.1 6.0 7.3 4.9 7.5 6.8 1.4 5.65 Delhi 1.5 1.6 0.9 1.0 0.9 1.2 1.6 1.4 1.4 1.0 1.0 1.36 Gujarat 6.0 5.1 5.0 5.1 - 5.3 4.5 4.0 4.2 4.3 - 4.27 Haryana 4.2 5.9 7.1 4.1 2.6 4.8 4.2 3.8 4.2 3.3 1.6 3.48 Himachal Pradesh 4.4 4.4 3.7 3.5 2.1 3.6 2.3 2.4 2.3 1.7 1.5 2.09 Jammu & Kashmir 11.8 5.7 4.6 7.5 2.9 6.6 13.6 5.8 3.9 2.2 1.1 5.710 Jharkhand 12.7 12.5 11.7 12.5 7.1 11.3 9.7 8.6 10.1 9.1 8.7 9.<strong>21</strong>1 Karnataka 6.1 5.7 5.1 5.5 4.6 5.4 4.3 3.4 3.5 3.7 3.4 3.712 Kerala 2.7 2.8 2.4 2.0 - 2.5 2.5 2.5 2.4 1.7 - 2.<strong>21</strong>3 Madhya Pradesh 8.9 9.0 8.2 6.8 5.5 7.8 6.9 8.0 5.7 6.4 2.4 5.914 Maharashtra 6.3 6.1 5.6 6.7 - 6.1 4.7 4.2 2.4 2.6 - 3.547
Grade 1Grade 2Grade 3Grade 4Grade 5PrimaryStageGrade 1Grade 2Grade 3Grade 4Grade 5PrimaryStageTable 3.1.1: School leavers’ rates in primary grades by state2008-09 2009-10Sr.No State15 Orissa 4.9 4.0 4.8 3.8 4.5 4.4 2.8 2.9 2.4 2.8 2.0 2.616 Punjab 7.5 7.7 8.1 7.2 4.4 7.1 7.4 5.9 5.6 5.0 4.1 5.617 Rajasthan 16.8 14.7 15.8 11.5 10.8 14.2 15.1 14.2 13.0 12.0 6.6 12.418 Tamil Nadu 5.2 4.3 3.7 2.8 2.7 3.7 3.2 2.2 1.9 1.2 2.0 2.119 Uttar Pradesh 8.9 6.1 7.8 5.8 6.5 7.0 6.7 6.5 5.9 5.3 1.1 5.220 Uttarakhand 4.4 4.1 3.2 3.3 0.7 3.2 2.0 2.0 1.7 2.0 0.8 1.7<strong>21</strong> West Bengal 4.0 3.8 3.7 2.7 - 3.6 2.7 2.7 2.3 1.9 - 2.4All States 7.8 6.8 7.0 6.0 5.3 6.7 6.3 5.9 5.4 5.0 3.3 5.2Table 3.1.2 represents the school leaver’s rate for upper primary stage in the <strong>states</strong>. Forupper primary stage, the school leavers’ rate was at 5.2 % in 2008-09 which have droppedto 4% in the year 2009-10. Slightly higher gap were found with regards to gender and it isworth noting the incidence of school leaving among girls is around 1.6 percentage pointsless than that of boys in 2008-09. Table 3.1.15-16 in annexure represents the gender wiseschool leaver’s rate. It is seen that in the year 2009-10, the incidence of school leavingamong upper primary students had decreased.If we look at the school leaving incidences among the upper primary students in 2008-09,the <strong>states</strong> of Rajasthan (11.1%), Chhattisgarh (6.1 %) and Jharkhand (8%) had high % ofenrolled students leaving the school before the completion of academic year in 2008-09.Although the rate had decreased in 2009-10 but still it was high for these <strong>states</strong>.In 2008-09, grade 6 and 7 had a school leavers’ rate of 6.3 % and it declined to 1.8 % forgrade 8 so it is seen that grade wise school leavers’ rate show a similar trend among upperprimary schools as it was observed among primary schools (decreasing from lowest tohighest grade) in both the assessment years. Grade wise and gender wise school leaver’srate for primary and upper primary grades is given in tables 3.1.1 to 3.1.12 in Annexure -1The all <strong>states</strong> picture depicts that grade 8 had school leaver’s rate less than 3 % in both2008-09 and 2009-10 and it was the lowest among all the grades. Table 3.1.2 represents thegrade wise school leavers’ rate for individual <strong>states</strong>.48
Grade 5Grade 6Grade 7Grade 8UpperPrimaryStage*Grade 5Grade 6Grade 7Grade 8UpperPrimaryStage*Table 3.1.2: School leavers’ rates in upper primary grades by state2008-09 2009-10Sr.No State1 Andhra Pradesh - 6.3 2.9 - 4.5 - 5.4 3.0 - 4.22 Assam 5.4 7.5 3.1 - 5.4 7.3 3.4 2.8 - 4.63 Bihar - 5.2 7.4 1.2 4.7 - 6.0 4.9 1.3 4.24 Chhattisgarh - 6.7 7.3 4.2 6.1 - 9.5 5.1 2.1 5.65 Delhi - 1.3 1.2 0.1 0.9 - 1.3 1.3 0.3 0.96 Gujarat 5.5 6.4 2.5 - 4.8 4.1 4.0 2.3 - 3.47 Haryana - 2.5 2.3 1.8 2.2 - 1.0 1.4 0.7 1.08 Himachal Pradesh - 3.6 3.1 1.4 2.7 - 3.6 1.4 0.4 1.89 Jammu & Kashmir - 3.1 3.6 2.0 2.9 - 2.4 1.7 1.0 1.710 Jharkhand - 8.8 10.4 3.8 8.0 - 8.3 7.6 4.8 7.111 Karnataka - 4.8 1.0 - 2.9 - 3.1 1.4 - 2.312 Kerala 4.3 0.6 0.3 - 1.6 0.3 1.6 1.3 - 1.113 Madhya Pradesh - 7.8 5.8 1.3 5.4 - 4.1 3.0 3.8 3.714 Maharashtra 6.8 5.2 3.0 - 4.8 5.5 4.9 1.8 - 4.015 Orissa - 4.8 5.4 - 5.1 - 3.4 6.1 - 4.816 Punjab - 5.2 5.4 4.4 4.9 - 4.9 4.7 5.0 4.917 Rajasthan - 14.5 14.5 4.3 11.1 - 11.9 7.8 5.9 8.518 Tamil Nadu - 6.3 5.6 2.6 4.8 - 4.9 4.0 4.0 4.319 Uttar Pradesh - 6.4 9.2 0.6 5.5 - 2.9 4.4 2.6 3.320 Uttarakhand - 3.5 3.6 0.8 2.6 - 2.1 2.7 1.1 1.9<strong>21</strong> West Bengal 1.0 1.3 1.5 1.3 1.3 0.5 2.0 1.7 0.4 1.2All States - 6.3 6.3 1.8 5.2 - 4.8 4.0 2.8 4.0*The upper primary stage depicts the average (weighted) figure of all the grades in that stage.3.1.4 Discontinued students among school leaversThe houses of the students who left the schools were visited to ascertain their statuswhether they had discontinued from the education system or continued their education insome other school. Those students who discontinued education among the school leavershave been discussed in this section.Figure 3.4 depicts that at all <strong>states</strong> level, the discontinued students among the schoolleavers at the primary stage was 23.4 % in 2008-09 and it had increased to 24.1 % in 2009-10. For boys it had increased by 6 percentage points while for girls it had increased by 0.6percentage points from 2008-09 to 2009-10.49
Figure 3.4: Discontinued students among school leavers’ by stage and gender in 2008-09 & 2009-10403020100Primary stageUpper primary stage37.636.334.228.123.422.126.9 24.424.9 25.5 24.1 23.62008-09 2009-10 2008-09 2009-10Total Boys Girlsin percentDiscontinuation rate among the school leavers at the upper primary stage for all the <strong>states</strong>combined together was estimated to be at 24.1 % in 2008-09 and it had increased to 36.3 %in 2009-10. For boys and girls, the proportion of discontinued students among schoolleavers had increased by 13.2 and 10.6 percentage points in 2008-09 and 2009-10respectively.Figure 3.5 shows that the discontinuation rate among school leavers in grade 1 to 4 variedbetween 19 to 22.7 in 2008-09 and 23.5 to 24.5 in 2009-10 but in grade-5, it has increasedby 24.8 percentage points in 2008-09 and 26 percentage points in 2009-10 when comparedto the immediate previous grade i.e. grade-4. It indicates that discontinuation rate atprimary stage among school leavers is quite high in grade-5. At all <strong>states</strong> level in upperprimary grades (grade 6 to 8) discontinuation rate among school leavers was found to bearound 23.7-24.4 % in 2008-09 and 33 to 46.8 % in 2009-10.Figure 3.5: Discontinuation rate among school leavers’ by stage and grade in 2008-09 and 2009-106050Primary stage47.549.5Upper primary stage46.840302024.5 23.9 24.5 22.7 23.519.0 19.8 18.133.035.424.4 23.8 23.7100Grade-1 Grade-2 Grade-3 Grade-4 Grade-5 Grade-6 Grade-7 Grade-82008-09 2009-10 in percentFor primary stage, <strong>states</strong> with a high discontinuation rate among school leavers in the year2009-10 were Uttarakhand (53.4%), Punjab (48.2%), West Bengal (47.8 %), Assam (45%) and50
Grade 1Grade 2Grade 3Grade 4Grade 5PrimaryStageGrade 1Grade 2Grade 3Grade 4Grade 5PrimaryStageChhattisgarh (37.4%). Lower discontinuation rates among school leavers were observed inthe <strong>states</strong> of Kerala (5.5%), Jammu & Kashmir (10.2%), Gujarat (18%) and Andhra Pradesh(18.2%)There is a considerable difference in the discontinuation rate among school leavers for boysand girls for some of the <strong>states</strong>, a difference of 15.5% in Gujarat, 12.3 % in Uttar Pradeshand 8.5 % in Madhya Pradesh, 4.9 % in Uttarakhand. These <strong>states</strong> have a higherdiscontinuation rate among school leavers for the boys except in Gujarat where it is higherfor the girls. For the rest of the <strong>states</strong> there is not a high gender divide. Table 3.2.1 gives usstate-wise proportions of discontinued students among school leavers at primary stage.Grade wise and gender wise discontinued students among school leavers can be seen intables 3.1.17, 3.1.18 in Annexure – I for primary grades.Table 3.2.1: Discontinued students among school leavers’ by stage, gender and state in 2008-09 &2009-102008-09 2009-10Sr.No State1 Andhra Pradesh 14.4 11.6 12.4 10.0 55.1 14.6 11.3 13.2 23.1 10.5 51.2 18.22 Assam 28.1 30.8 33.5 51.6 - 33.2 39.1 33.9 63.4 68.3 - 45.03 Bihar 36.4 29.2 27.7 32.0 58.1 35.1 29.6 31.5 32.7 25.7 55.2 33.84 Chhattisgarh 11.6 23.8 29.6 26.3 48.5 22.9 37.5 32.7 36.3 35.3 76.8 37.45 Delhi 57.2 59.0 46.0 46.0 61.2 54.8 <strong>21</strong>.1 <strong>21</strong>.9 25.2 16.0 47.6 25.26 Gujarat 5.5 5.1 9.0 43.0 - 15.5 9.7 11.1 8.2 42.9 - 18.07 Haryana 3.9 10.6 13.3 14.4 45.8 14.4 19.8 15.6 18.8 19.6 52.0 <strong>21</strong>.48 Himachal Pradesh 5.4 7.6 4.8 2.4 37.3 9.1 14.7 16.4 16.3 31.2 43.7 22.89 Jammu & Kashmir 5.9 7.6 18.0 15.4 40.6 13.1 5.3 14.0 10.4 10.4 59.9 10.<strong>21</strong>0 Jharkhand 27.3 22.0 24.0 19.7 51.4 26.8 26.0 24.9 20.3 20.2 59.4 29.411 Karnataka 20.7 16.6 13.7 22.6 49.5 23.7 23.7 34.7 <strong>21</strong>.8 30.4 64.4 34.712 Kerala 7.6 0.9 3.6 18.0 - 7.0 4.4 0.6 0.0 20.5 - 5.513 Madhya Pradesh 16.0 18.0 22.8 17.2 47.7 22.0 33.8 19.3 27.0 14.8 69.3 27.114 Maharashtra 9.9 6.5 4.7 44.9 - 17.0 36.5 15.4 18.4 48.6 - 29.415 Orissa 23.7 26.7 24.7 17.9 52.7 29.2 17.5 13.3 19.3 16.6 62.7 23.516 Punjab 39.5 31.9 40.7 26.1 54.0 37.2 43.4 38.6 47.0 52.8 66.8 48.<strong>21</strong>7 Rajasthan 11.3 15.1 13.7 14.1 52.3 18.0 17.3 15.4 15.9 19.2 52.6 20.118 Tamil Nadu 11.9 13.8 15.0 25.5 54.8 <strong>21</strong>.9 17.6 19.5 33.8 37.4 50.4 30.419 Uttar Pradesh 11.0 16.3 10.7 11.7 50.0 18.3 22.8 29.8 24.5 18.0 59.1 25.420 Uttarakhand 40.6 37.2 41.6 36.9 66.4 40.3 47.8 57.9 52.3 50.4 64.4 53.4<strong>21</strong> West Bengal 49.0 47.2 48.8 68.7 - 51.6 54.9 40.0 36.2 59.9 - 47.8All States 19.0 19.8 18.1 22.7 47.5 23.4 24.5 23.9 24.5 23.5 49.5 26.951
Grade 5Grade 6Grade 7Grade 8UpperPrimaryStage*Grade 5Grade 6Grade 7Grade 8UpperPrimaryStage*At the all <strong>states</strong> level there has been an increase in the discontinuation rate in the year2009-10 as compared to 2008-09. The <strong>states</strong> with high proportions of discontinued studentsamong school leavers of upper primary grades in the year 2008-09 are Himachal Pradesh(51.1%), Uttarakhand (44.9%), Assam (34.4%), West Bengal (29.6%) and Madhya Pradesh(28%). In 2009-10 were recorded for Chhattisgarh (61.5 %), Madhya Pradesh (58.8 %),Himachal Pradesh (50.7%), Karnataka (49.9%) and Orissa (49.4 %).The <strong>states</strong> that recorded a recorded discontinuation rate
2008-09 2009-10Sr. StateNo. B G T B G T15 Orissa 12.1 13.2 12.6 8.0 7.1 7.516 Punjab 5.4 6.2 5.8 8.9 8.2 8.617 Rajasthan 13.0 13.8 13.3 13.1 12.4 12.718 Tamil Nadu 11.1 9.9 10.5 8.2 4.7 6.519 Uttar Pradesh 9.1 10.9 10.0 27.0 32.4 29.820 Uttarakhand 9.2 12.2 10.5 7.0 5.3 6.1<strong>21</strong> West Bengal 11.2 11.2 11.2 6.5 5.9 6.2All States 10.2 11.4 10.8 11.7 12.7 12.2Table 3.3 reveals Kerala is the state where highest percentage (17.0 %) of pass outsdiscontinued their education in succeeding stage in 2008-09 followed by Bihar (14.3%). In2009-10, Kerala had the highest percentage of pass outs those discontinued their educationafter passing out from primary stage among boys as well as girls when compared with other<strong>study</strong> <strong>states</strong> in 2009-10.3.2.2 Status of pass out students of terminal grade of upper primary stage whose houseswere visitedStatus of upper primary stage pass out students was collected only from those <strong>states</strong> whereterminal grade of upper primary stage was grade VII. Table 3.4 shows that among these<strong>states</strong>, 9.4 % pass out students continued education in the next stage during 2008-09. In2009-10, the percentage of students discontinued their education in the next stagedecreased to 9.2%. The difference in the discontinuation rate among the pass outs washighest in Andhra Pradesh (3.7%) and Karnataka (2.9%) in 2008-09. In 2009-10 Maharashtrahad a higher number of boys pass outs who discontinued education as compared to thegirls.Table 3.4 Percentage of pass out students of terminal grade of upper primary stage whodiscontinued education after completing upper primary stage2008-09 2009-10State B G T B G TAndhra Pradesh 12.4 16.0 14.2 5.3 8.4 6.8Assam 9.5 9.7 9.6 8.1 6.8 7.4Gujarat 9.9 8.3 9.1 8.4 7.1 7.8Karnataka 11.9 14.8 13.3 11.3 9.3 10.4Kerala 8.7 7.5 8.2 12.1 13.1 12.6Maharashtra 6.3 8.6 7.3 9.6 5.5 7.7Orissa 6.2 6.7 6.4 8.6 6.3 7.4All States 9.1 9.8 9.4 9.8 8.6 9.254
3.2.2 Pass out rates of terminal grades of primary and upper primary stagesFigure 3.6 shows that at all <strong>states</strong> level the pass out rate for primary stage in 2008-09 was at92.2 % and it had increased to 94.6 % in 2009-10. For upper primary stage the pass out ratehas decreased from 95.6 % in 2008-09 to 95 % in 2009-10. Overall an increase in pass outrate is seen from 2008-09 to 2009-10.Figure 3.6: Pass out rates of terminal grades of primary and upper primary stages by year120100Primary StageUpper Primary Stage92.2 92.4 92.0 94.6 93.7 95.6 95.6 94.5 95.5 95.0 93.8 96.38060402002008-09 2009-10 2008-09 2009-10Total Boys Girlsin percentIn Table 3.5, gender wise overall picture of the pass out rate shows that girls recorded abetter pass out rates than boys in primary as well as upper primary stages in both theassessment years. During 2009-10, large variations have not been observed between thegenders.States with pass out rate of less than 90 % for primary stage in 2008-09 are Bihar,Jharkhand, Madhya Pradesh, Rajasthan and West Bengal. Uttarakhand, Delhi and UttarPradesh are the <strong>states</strong> where pass out rates are 98 % or more at the primary stage. In 2009-10, all the <strong>states</strong> have recorded a pass out rate in excess of 90 % except Jharkhand andRajasthan.Sr.NoTable 3.5: Percentage of students who pass-outs in the terminal grade of primary & upper primarygradesStatePass outs of terminal grade of primarystagePass outs of terminal grade of upperprimary stage2008-2009 2009-2010 2008-2009 2009-2010Boys Girls Total Boys Girls Total Boys Girls Total Boys Girls Total1 Andhra Pradesh 95.6 97.2 96.4 94.9 95.4 95.2 96.9 97.3 97.1 94.4 98.3 96.42 Assam 91.5 94.7 93.1 93.1 93.4 93.2 91.2 93.7 92.3 92.2 95.1 93.63 Bihar 86.7 88.9 87.7 89.0 90.8 89.8 95.8 97.7 96.6 96.5 97.8 97.04 Chhattisgarh 94.8 96.2 95.5 97.7 98.1 97.9 93.4 94.5 93.9 95.1 97.7 96.555
Sr.NoStatePass outs of terminal grade of primarystagePass outs of terminal grade of upperprimary stage2008-2009 2009-2010 2008-2009 2009-2010Boys Girls Total Boys Girls Total Boys Girls Total Boys Girls Total5 Delhi 98.8 98.7 98.8 99.2 98.3 98.7 96.3 97.7 96.9 99.0 99.4 99.26 Gujarat 89.1 91.0 90.0 88.7 91.3 89.9 94.2 95.0 94.6 96.0 94.5 95.47 Haryana 95.8 95.4 95.6 97.2 97.7 97.4 94.9 93.1 94.0 98.4 98.2 98.38 Himachal Pradesh 97.0 97.2 97.1 97.7 99.1 98.3 90.0 88.3 89.3 93.5 96.5 94.89 Jammu & Kashmir 95.9 96.8 96.3 97.2 95.8 96.6 87.6 91.1 89.1 93.4 92.6 93.010 Jharkhand 85.0 88.6 86.8 86.3 88.0 87.1 91.6 94.4 92.8 87.7 94.8 90.911 Karnataka 94.3 96.1 95.2 96.2 97.0 96.6 99.1 99.0 99.0 98.8 98.3 98.612 Kerala 97.2 97.9 97.5 97.6 97.6 97.6 99.4 98.9 99.1 98.1 99.0 98.513 Madhya Pradesh 89.1 89.0 89.1 92.5 90.9 91.7 93.4 94.9 94.3 90.3 96.8 94.114 Maharashtra 92.3 92.3 92.3 96.7 97.8 97.2 95.8 96.3 96.1 98.0 98.1 98.115 Orissa 92.9 93.8 93.3 96.2 96.6 96.4 85.5 86.7 86.1 88.9 93.5 91.<strong>21</strong>6 Punjab 89.5 90.7 90.1 93.5 92.7 93.2 70.4 79.7 74.2 76.6 83.6 79.717 Rajasthan 83.6 84.7 84.1 90.0 88.9 89.5 81.9 86.8 83.9 84.9 87.1 85.818 Tamil Nadu 96.4 97.5 96.9 97.2 98.3 97.7 95.6 96.7 96.2 95.6 95.9 95.719 Uttar Pradesh 97.6 89.7 93.4 98.5 99.0 98.8 99.3 99.4 99.4 95.5 98.0 96.820 Uttarakhand 98.5 99.4 98.9 98.8 99.3 99.0 98.6 99.6 99.1 98.1 99.6 98.9<strong>21</strong> West Bengal 89.8 89.2 89.5 92.5 93.8 93.2 89.3 92.8 91.4 90.7 95.8 93.7All States 92.4 92.0 92.2 94.5 95.5 95.0 93.7 95.6 94.6 93.8 96.3 95.0All the <strong>states</strong> were having pass out rate 90 % or more for upper primary stage in 2008-09and 2009-10 except Punjab and Rajasthan for 2009-10.3.3 Transition RateOne of the additional objectives of the <strong>study</strong> was to give transition rate for primary stageonly. Transition rate is the proportion of students who pass outs from terminal grade ofprimary stage (grade 4 or 5) and continued their education in the next grade (5 or 6 as the case may be) of upper primary stage.3.3.1 Transition rate of primary stageTransition rate was estimated by aggregating data on promotees from DS1 and DS2 of thoseschools which have primary as well as upper primary stages and DS2 and DS3 of schoolshaving terminal grade of primary stage.Figure 3.7 presents overall scenario of transition rate of primary stage among <strong>21</strong> <strong>study</strong><strong>states</strong> for both the assessment years. In 2008-09 and 2009-10 transition rate was 87.5% and87.2 % respectively. Transition rate in both the years was found higher among boys andslightly lower for girls.56
Figure 3.7 Transition rate of primary stage by year10080604020087.5 88.3 86.6 87.2 87.5 86.92008-09 2009-10Total Boys Girls in percentWest Bengal’s transition rate was found to be lowest (80.9 %) as compared to all <strong>study</strong><strong>states</strong> in 2008-09 and <strong>states</strong> like Jammu & Kashmir (95.7 %), Karnataka (95.3 %), HimachalPradesh (93.1%) , Maharashtra (92.6 %), Uttarakhand (92.1 %) and Gujarat (91.3%) werehaving transition rate over 90 % during 2008-09 assessment year. Next year, four more<strong>states</strong> had also achieved over 90 % transition rate status of primary stage and they wereAndhra Pradesh (90.1%), Haryana (91.9 %), Tamil Nadu (93.4 %) and Orissa (93.3 %). Notmuch variation observed between the transitions rates of boys and girls across <strong>states</strong>. (ReferTable 3.3, Annexure-I)3.4 Lateral EntrantsThe data was also collected for the students who were the lateral entrants for the year2009-10. These are the students who were directly admitted in grade 2 and above either asa transfer case from other recognized schools with or without TC, EGS/AIE/Bridge courses orfrom home/private tuitions/unrecognized school.3.4.1 Lateral entrants of primary stageIn all, a total of 28,949 students have entered the primary grades (2 to 4/5) as lateralentrants in 2009-10 in all the <strong>states</strong>. More than half (15,705 or 54%) of the total lateralentrants were boys. Among 2 to 5 grades, highest number of students took admission ingrade-2. Of the total lateral entrants in primary grades, proportion of lateral entrants to thetotal enrolment varies from 1.4 % to 7.9 % among all <strong>study</strong> <strong>states</strong> except Bihar where it is16.2 % of the total lateral entrants recorded in all <strong>states</strong>. (Refer table 3.4.1, Annexure-I)3.4.2 Lateral entrants of upper primary stageAt upper primary stage, a total of 19,318 students have entered in upper primary grades (6to 7/8) as lateral entrants in 2009-10. Of the total lateral entrants, there were 10,6<strong>21</strong> boysand 8,697 girls. In grade-6, 11,583 entered school followed by 5,000 in grade-7 and 2,735 ingrade-8. In upper primary grades, more boys as compared to girls were directly admitted to57
grade-6. In most of the <strong>states</strong>, the proportion of lateral entrants to the total lateral entrantsof upper primary grades varies from 1.1 % to 7.3 % except in Bihar, Haryana and Rajasthanwhere it was 12.5 %, 11.1 % and 9.0 % respectively. (Refer table 3.4.2, Annexure-I)3.4.3 Sources of lateral entrants for primary stageIt has already been mentioned above that sources of students who directly admitted ingrade-2 and above were either transferred from any recognized (with or without TC),EGS/AIE/Bridge Courses or from home/private tuitions/unrecognized schools. Figure 3.8below depicts percentage distribution of lateral entrants by source. Out of the total lateralentrants, more than 2/3 rd (72 %) were those cases that transferred from any recognizedschools. Students admitted directly in grade-2 and above after completing their initialeducation through home/private tuitions/unrecognized schools or from EGS/AIE/Bridgecourses were 22 % and 6 % of the total lateral entrants respectively.Figure 3.8: Percentage distribution of lateral entrants of primary stage by sourceEGS/AIE/Bridge Course6%RecognisedSchools72%Home/PrivateTuition/unrecognisedschools22%n=28,949 lateral entrantsAcross all <strong>states</strong> at primary stage, Andhra Pradesh, recorded highest overall percentage ofstudents who took admission after taking their initial education at home (1.8% of the totalenrolment). Bihar (8.5% of the total enrolment) recorded highest overall percentage ofstudents who took admission after taking their initial education at EGS/AIE/Bridge Coursesand Rajasthan (12.9% of the total enrolment) recorded highest overall percentage ofstudents who took admission after getting transferred from recognized schools.Among all grades at primary stage, highest percentage of lateral entrants took admission ingrade-2 and at upper primary stage the highest number of lateral entrants came in grade 658
Figure 3.9 Grade wise number of lateral entrants at Primary Stage10,0008,0006,0004,0002,0008,6597,201 6,7876,3020Grade 2 Grade 3 Grade 4 Grade 5in numberStatus of the Lateral Entrants- Promotee/RepeaterTable3.6: Percentage of promotees and repeaters among lateral entrants of primary stageSL StatePromoteesRepeatersB G T B G T1 Andhra Pradesh 81.9 87.6 84.5 0.9 0.8 0.82 Assam 62.9 55.5 58.9 6.2 5.3 5.73 Bihar 82.8 81.8 82.3 7.6 6.1 6.94 Chhattisgarh 81.2 80.2 80.7 7.7 5.0 6.55 Delhi 84.6 93.7 89.6 6.6 4.8 5.66 Gujarat 40.6 69.1 49.0 1.2 1.2 1.27 Haryana 89.4 93.5 91.3 2.1 3.5 2.78 Himachal Pradesh 96.5 98.4 97.4 0.3 0.0 0.29 Jammu & Kashmir 83.5 80.2 82.1 0.4 3.3 1.710 Jharkhand 88.7 90.0 89.4 3.5 2.5 3.011 Karnataka 88.2 93.6 90.5 0.0 0.2 0.112 Kerala 94.7 91.5 93.1 1.1 2.2 1.613 Madhya Pradesh 91.5 93.1 92.2 4.7 5.9 5.314 Maharashtra 83.2 85.4 84.4 0.0 0.3 0.115 Orissa 83.9 92.6 87.6 5.3 3.0 4.316 Punjab 91.4 93.4 92.3 3.1 2.1 2.717 Rajasthan 83.5 83.0 83.3 11.0 12.0 11.418 Tamil Nadu 82.9 76.4 79.9 2.3 1.8 2.119 Uttar Pradesh 69.5 89.1 76.5 16.7 0.6 11.020 Uttarakhand 66.3 55.8 60.7 1.1 0.4 0.7<strong>21</strong> West Bengal 75.7 76.0 75.9 5.2 4.2 4.7All States 79.3 84.4 81.6 5.2 3.8 4.6Table 3.6 shows the percentage of promotees and repeaters among the lateral entrants.81.6 % of lateral entrants were promotees and highest promotion rate among these lateralentrants was found in Himachal Pradesh (97.4 %). Gujarat’s lateral entrants have recordedthe least promotion rate that is 49 %. Assam, Chhattisgarh, Gujarat, Tamil Nadu, UttarPradesh, Uttarakhand and West Bengal are the <strong>states</strong> where promotion rate among lateralentrants is less than all <strong>states</strong> average.59
Repeaters among the lateral entrants were estimated to be at 4.6 %. This proportion ishighest for those in Rajasthan and Uttar Pradesh which recorded over one in ten repeatingthe grade. Seven out of <strong>21</strong> <strong>study</strong> <strong>states</strong> having higher repeaters rate than all <strong>states</strong> averageamong lateral entrants. Promotion rate among boys is less than girls and repetition rate ishigher among boys in comparison to girls. (Refer tables 3.4.9 & 3.4.12 in Annexure-I).3.4.4 Sources of lateral entrants for upper primary stageA large proportion (90 %) of the total lateral entrants of upper primary school comes fromrecognized schools. 7% students took admission directly into upper primary school aftercompleting their initial education at home/private tuition/ unrecognized schools and only 3% transferred from EGS/AIE or Bridge Courses.Figure 3.10: Percentage distribution of lateral entrants of upper primary stage by sourceRecognisedSchools90%EGS/AIE/Bridge Course3%Home /PrivateTutions/unrecognisedschools7%n=19,318 lateral entrantsAcross all <strong>states</strong> at upper primary stage, Uttarakhand, recorded highest overall percentageof students who took admission after taking their initial education at home (0.9% of thetotal enrolment). Bihar (4.7 % of the total enrolment) recorded highest overall percentageof students who took admission after taking their initial education at EGS/AIE/BridgeCourses and Jammu and Kashmir (17.3% of the total enrolment) recorded highest overallpercentage of students who took admission after getting transferred from recognizedschools. Among all grades at upper primary stage, highest percentage of lateral entrantstook admission in grade-6, 13.3% (Refer Tables from 3.4.3 to 3.4.8 Annexure-I). In grade 6,large number of lateral entrants had taken admission from other recognized schools, 31.5 %in Andhra Pradesh, 39.1% in Haryana, 38.1 % in Himachal Pradesh, 36.6 in Jammu andKashmir and 25.8 % in Rajasthan60
Figure 3.11 Grade wise number of lateral entrants at upper primary stage12,50010,0007,5005,0002,500011,5835,0002,735Grade 6 Grade 7 Grade 8in numberTable3.7 Percentage of promotees and repeaters among lateral entrants of upper primary stagePromoteesRepeatersSL StateBoys Girls Total Boys Girls Total1 Andhra Pradesh 98.4 56.0 77.9 0.5 0.4 0.52 Assam 81.6 52.5 67.2 6.7 4.9 5.83 Bihar 96.1 94.0 95.1 5.6 5.2 5.44 Chhattisgarh 90.2 23.2 51.4 6.6 4.1 5.45 Delhi 90.9 82.8 88.0 8.0 3.8 6.16 Gujarat 67.1 66.7 66.9 1.6 1.3 1.57 Haryana 88.2 92.7 90.5 4.8 5.6 5.28 Himachal Pradesh 97.6 97.0 97.3 0.9 0.4 0.79 Jammu & Kashmir 85.3 74.3 81.6 2.7 7.3 4.410 Jharkhand 93.7 92.4 93.0 4.2 4.0 4.111 Karnataka 96.7 96.8 96.8 0.0 0.2 0.112 Kerala 94.5 95.0 94.7 0.8 1.4 1.113 Madhya Pradesh 89.9 96.1 91.8 5.3 4.4 4.914 Maharashtra 86.8 87.9 87.2 0.4 0.1 0.315 Orissa 91.9 98.1 95.4 4.5 1.6 3.016 Punjab 83.1 82.7 83.0 4.4 2.4 3.617 Rajasthan 85.6 90.3 87.5 11.8 11.1 11.518 Tamil Nadu 72.4 84.3 77.7 5.3 2.1 3.819 Uttar Pradesh 82.8 85.8 84.3 14.0 0.4 8.820 Uttarakhand 39.0 53.7 44.8 0.7 0.3 0.5<strong>21</strong> West Bengal 90.8 94.4 92.8 7.0 4.9 5.9All States 87.8 85.6 86.8 4.9 3.7 4.4Table 3.7 shows percentage of promotees and repeaters among lateral entrants of upperprimary stage. There were 86.8 % promotees and 4.1 % repeaters among lateral entrants.Himachal Pradesh, Bihar, Karnataka and Orissa recorded a promotion rate of >95% amonglateral entrants. Very low promotion rate was seen in the case of Uttarakhand (44.8%),Chhattisgarh (51.4%), Assam (67.2%) and Gujarat (66.9%) amongst the lateral entrants.61
Rajasthan experienced the highest repetition rate (11.5%) and other <strong>states</strong> whichexperienced a high repetition rate are Uttar Pradesh (8.8%) and Delhi (6.1%). At all <strong>states</strong>level promotion as well as repetition rate of lateral entrants is higher among boys incomparison to girls. Grade wise promotion and repetition rate among lateral entrants ofprimary and upper primary stages is given in tables 3.4.9 & 3.4.12 in Annexure-I.62
Grade 1Grade 2Grade 3Grade 4Grade 5PrimaryStageGrade 1Grade 2Grade 3Grade 4Grade 5PrimaryStageThe promotion rate has increased from grade 1 to grade 4 and then decreased in grade 5 inboth the <strong>study</strong> periods. The promotion rate was lowest for grade 1 students (85.5 %) andhighest for grade 8 students (95.4 %) in the year 2008-09, the trend has remained similar forthe year 2009-10 with the increase in the promotion rate in grade 1 by 1.7 percentagepoints. Jharkhand, Bihar, Rajasthan and West Bengal have recorded promotion rate lessthan 80 % in grade 1 in 2008-09 and 2009-10Table 4.1.1: Promotion rate in primary stage by state2008-09 2009-10Sr.No State1 Andhra Pradesh 93.3 95.0 95.5 94.4 89.3 93.6 94.0 93.7 94.7 94.9 90.1 93.52 Assam 82.0 85.8 89.6 85.8 - 85.6 86.1 91.6 92.8 87.4 - 89.33 Bihar 71.1 83.1 87.1 88.5 85.3 82.5 72.8 82.4 86.5 90.0 89.0 83.74 Chhattisgarh 88.3 92.0 91.2 94.3 85.6 90.2 88.8 91.8 90.0 92.3 85.4 89.85 Delhi 96.9 96.3 97.2 98.2 88.5 95.6 96.7 97.2 96.7 98.2 77.8 93.66 Gujarat 89.9 92.5 91.6 91.3 - 91.3 90.1 91.3 90.8 91.0 - 90.87 Haryana 94.7 94.4 92.9 93.8 88.8 93.0 95.6 96.1 95.8 96.2 91.9 95.28 Himachal Pradesh 96.1 97.5 97.4 97.8 93.1 96.3 98.6 98.6 99.3 98.9 94.7 98.09 Jammu & Kashmir 89.0 94.0 96.4 95.0 95.7 93.9 91.2 94.3 95.7 97.9 93.1 94.310 Jharkhand 66.7 81.8 83.5 87.2 86.1 80.9 72.6 82.2 84.3 86.4 86.7 82.411 Karnataka 96.9 97.4 98.4 98.0 95.3 97.2 98.1 98.4 98.9 98.2 96.1 97.912 Kerala 98.6 98.7 98.8 89.8 - 96.3 98.9 98.8 99.0 83.4 - 94.713 Madhya Pradesh 81.8 84.4 86.1 85.5 81.5 83.9 83.6 87.3 88.7 89.1 86.0 86.914 Maharashtra 93.6 95.6 96.5 92.6 - 94.6 96.1 97.3 98.4 94.5 - 96.615 Orissa 83.5 92.0 92.8 95.3 87.7 90.1 88.5 95.6 96.7 96.5 93.3 94.016 Punjab 85.8 85.4 84.2 84.9 86.3 85.3 85.0 89.4 89.8 90.9 87.6 88.617 Rajasthan 75.6 81.8 82.3 88.4 84.0 81.9 78.1 80.7 85.3 87.5 87.9 83.518 Tamil Nadu 94.6 98.5 98.7 98.8 89.9 96.0 97.0 97.7 98.6 98.9 93.4 97.019 Uttar Pradesh 94.8 96.3 94.8 96.7 87.5 94.3 93.9 94.1 94.7 95.4 81.5 92.120 Uttarakhand 95.6 96.3 96.7 96.4 92.1 95.5 96.6 97.7 98.4 98.6 95.2 97.3<strong>21</strong> West Bengal 68.9 86.6 89.3 80.9 - 80.3 73.0 86.6 89.9 88.0 - 83.6All States 85.5 91.3 92.0 92.4 87.9 89.8 87.2 91.2 92.8 93.1 87.0 90.3Promotion rate across <strong>states</strong> show that Assam, Bihar, Chhattisgarh, Jharkhand, MadhyaPradesh, Punjab, Rajasthan and West Bengal are the <strong>states</strong> where promotion rate is lessthan all <strong>states</strong> average (90.3%) during 2009-10. Similarly, at upper primary stage 9 out of <strong>21</strong><strong>states</strong> recorded less promotion rate than all <strong>states</strong> average (93.9%) in 2009-10. These <strong>states</strong>are Assam, Chhattisgarh, Gujarat, Jharkhand, Madhya Pradesh, Orissa, Punjab, Rajasthanand West Bengal.64
Grade 5Grade 6Grade 7Grade 8UpperPrimaryStageGrade 5Grade 6Grade 7Grade 8#Upper*PrimaryStageAt primary stage Haryana, Himachal Pradesh, Karnataka, Maharashtra, Tamil Nadu andUttarakhand <strong>states</strong> have recorded promotion rate greater than equal to 95 % in the year2009-10.Table 4.1.2: Promotion rate in upper primary stage by state2008-09 2009-10Sr.No State1 Andhra Pradesh - 96.9 93.8 - 95.2 - 96.9 95.1 - 96.02 Assam 89.9 84.1 83.5 - 86.0 88.4 93.0 88.5 - 89.93 Bihar - 93.2 92.2 97.0 94.0 - 93.6 94.7 97.5 95.24 Chhattisgarh - 92.0 93.1 94.3 93.1 - 90.0 94.1 96.8 93.65 Delhi - 98.8 97.9 96.9 97.9 - 98.9 98.4 99.2 98.86 Gujarat 92.1 91.7 87.0 - 90.3 91.9 93.4 88.9 - 91.47 Haryana - 91.5 92.2 94.6 92.7 - 96.1 95.4 98.5 96.78 Himachal Pradesh - 94.2 95.1 89.5 92.9 - 97.3 99.6 95.0 97.39 Jammu & Kashmir - 93.1 95.5 90.5 93.0 - 97.5 98.1 93.4 96.410 Jharkhand - 84.6 86.7 94.2 87.8 - 88.8 89.5 91.8 89.811 Karnataka - 98.4 87.0 - 92.8 - 97.8 90.2 - 93.912 Kerala 98.4 99.5 91.2 - 96.2 99.3 99.5 89.2 - 95.913 Madhya Pradesh - 83.4 92.7 94.5 89.4 - 89.0 93.2 94.8 92.114 Maharashtra 95.7 97.0 94.8 - 95.9 94.8 95.5 95.7 - 95.415 Orissa - 95.5 83.3 - 89.6 - 97.1 88.3 - 92.516 Punjab - 88.6 90.9 75.2 84.2 - 89.2 90.4 81.3 86.717 Rajasthan - 80.5 82.7 86.2 83.1 - 84.6 89.4 87.0 87.018 Tamil Nadu - 96.9 96.7 96.9 96.8 - 95.2 96.2 96.2 95.919 Uttar Pradesh - 96.0 95.2 99.7 96.9 - 97.3 96.1 97.5 97.020 Uttarakhand - 95.5 96.1 99.4 97.0 - 98.7 98.6 99.4 99.0<strong>21</strong> West Bengal 81.6 88.6 89.2 92.1 87.4 87.0 86.4 90.5 93.8 89.1All States - 92.0 91.2 95.4 92.5 - 93.7 93.1 95.3 93.9*The primary and upper primary stages depict the average (weighted) of all the grades in that stage.# For grade it is the pass out rate and not the promotion rate as house visit was not made to ascertain thewhether the student continued in the next grade4.2 Repetition RateA student is classified as repeater if she/he repeats the same grade in the next academicsession in the same school/or any other school. Information on the status of the student iscollected from the school roster of the next year for the same grade and in case of schoolleavers who took admission in other schools; the information was taken from the parents ofthe students by visiting their homes.65
Grade 1Grade 2Grade 3Grade 4Grade 5PrimaryStageGrade 1Grade 2Grade 3Grade 4Grade 5PrimaryStageFigure 4.2 Repetition rates in primary and upper primary grades in 2008-09 and 2009-1010Primary gradesUpper primary grades8647.57.9 7.07.06.66.35.46.04.64.04.53.3202008-09 2009-10 2008-09 2009-10Total Boys Girlsin percentThe highest repetition rate was recorded in grade 1 in both the reference years. A decliningpattern is seen in repetition rate across the grades. In 2008-09, repetition rate, greater than20 % was recorded for Bihar (26%), Jharkhand (29.8%), Rajasthan (22.5 %) and West Bengal(29.2%) in grade 1. Punjab state recorded a high (>15%) repetition rate in grade 8 in boththe yearsAs see in table 4.2.1, the <strong>states</strong> combined together; there is a decline in repetition ratesfrom 2008-09 to 2009-10. It is evident that the repetition rates of primary are higher thanthose of upper primary. The repetition rates for boys were relatively higher than girls.Table 4.2.1 shows the state-wise repetition rates for boys and girls. The repetition rate atprimary stage in 2008-09 was 7.5 % however it got reduced by 0.9 percentage points in thefollowing year. In 2008-09, the <strong>states</strong> with high repetition rates were Jharkhand (15.7 %),Rajasthan (14.9 %), Bihar (14%), West Bengal (15.8 %), Punjab (11.3 %) and Madhya Pradesh(12.9 %). In the <strong>states</strong> of Assam and Punjab the repetition rates have gone down by around3 percentage points in the succeeding year.Sr.NoTable 4.2.1: Repetition rates in primary grades by stateState 2008-09 2009-101 Andhra Pradesh 4.9 3.6 3.1 4.4 1.1 3.4 4.7 4.9 3.3 4.2 0.9 3.62 Assam 16.6 12.6 8.9 5.4 - 11.2 12.3 7.3 6.1 5.6 - 8.03 Bihar 26.0 14.4 10.5 9.0 6.9 14.0 24.8 15.3 10.8 8.1 4.8 13.34 Chhattisgarh 10.8 6.4 7.0 4.2 2.5 6.8 8.5 6.6 7.2 5.2 0.9 5.866
Grade 5Grade 6Grade 7Grade 8UpperprimaryStageGrade 5Grade 6Grade 7Grade 8UpperprimaryStageSr.NoState 2008-09 2009-105 Delhi 2.3 2.3 2.4 1.3 0.4 1.8 3.0 2.5 2.6 1.6 0.6 2.16 Gujarat 9.8 7.2 7.8 5.8 - 7.6 9.5 8.3 8.3 6.7 - 8.27 Haryana 5.1 5.0 6.2 5.6 2.5 4.9 3.6 3.3 3.4 3.1 1.5 3.08 Himachal Pradesh 3.6 2.2 2.4 2.1 0.8 2.2 1.0 1.0 0.4 0.6 0.3 0.69 Jammu & Kashmir 10.3 5.5 2.7 3.8 1.2 4.9 8.1 4.9 3.9 1.9 2.4 4.410 Jharkhand 29.8 15.4 13.7 10.2 8.1 15.7 24.9 15.6 13.6 11.8 6.8 14.711 Karnataka 1.8 1.6 0.9 0.8 0.6 1.1 0.8 0.4 0.3 0.6 0.4 0.512 Kerala 1.1 1.3 1.1 0.7 - 1.1 1.0 1.2 1.0 1.0 - 1.113 Madhya Pradesh 16.8 14.0 11.9 13.3 7.6 12.9 14.1 11.2 9.8 9.9 6.1 10.314 Maharashtra 5.7 4.0 3.2 1.4 - 3.6 2.2 2.1 1.1 0.5 - 1.515 Orissa 15.4 6.9 5.9 4.0 2.6 7.2 11.0 4.0 2.8 3.0 1.7 4.716 Punjab 11.2 12.1 12.5 13.2 6.8 11.3 11.8 8.3 7.5 6.5 3.4 7.517 Rajasthan 22.5 16.0 15.5 9.7 6.8 14.9 19.3 17.1 12.7 10.1 5.5 13.418 Tamil Nadu 4.8 0.9 0.7 0.5 0.6 1.5 2.4 1.9 0.8 0.7 0.5 1.<strong>21</strong>9 Uttar Pradesh 4.2 2.7 4.4 2.7 2.8 3.3 4.5 3.9 3.8 3.6 0.4 3.320 Uttarakhand 2.6 2.2 2.0 2.4 0.4 1.9 2.4 1.1 0.7 0.4 0.3 1.0<strong>21</strong> West Bengal 29.2 11.5 8.9 7.9 - 15.8 25.5 12.3 9.3 5.1 - 14.0All States 13.0 7.3 6.7 5.1 4.2 7.5 11.2 7.4 5.9 4.8 3.0 6.6*The primary and upper primary stages depict the average (weighted) of all the grades in that stage.Similarly for upper primary schools (Table 4.2.2), the <strong>states</strong> of Punjab, Rajasthan and WestBengal had over 10 % of repetition rates in the year of 2008-09 and 2009-10 whereasJharkhand had a repetition rate >10 % only in 2008-09. Grade wise and gender wiserepetition rates for primary and upper primary stages have been given in tables 4.4.5, 4.4.6,4.4.7 and 4.4.8 in Annexure – I.Table 4.2.2: Repetition rates in upper primary grades by state2008-09 2009-10Sr.NoState1 Andhra Pradesh - 1.9 0.9 - 1.4 - 1.5 1.7 - 1.62 Assam 8.6 12.9 6.6 - 9.4 9.2 5.2 5.6 - 6.73 Bihar - 5.6 5.9 2.7 4.8 - 4.9 4.0 2.0 3.74 Chhattisgarh - 6.1 5.2 4.8 5.4 - 3.9 3.5 1.4 3.05 Delhi - 1.2 1.2 3.0 1.8 - 0.9 1.1 0.6 0.96 Gujarat 7.2 7.5 3.9 - 6.2 7.6 6.2 3.3 - 5.77 Haryana - 8.0 7.4 5.1 6.8 - 3.6 4.5 1.2 3.18 Himachal Pradesh - 4.0 3.3 9.8 5.8 - 0.4 0.1 4.8 1.89 Jammu & Kashmir - 5.8 3.8 9.2 6.3 - 1.7 1.4 6.3 3.110 Jharkhand - 13.8 9.6 5.2 10.1 - 8.5 7.5 5.5 7.367
Grade 5Grade 6Grade 7Grade 8UpperprimaryStageGrade 5Grade 6Grade 7Grade 8UpperprimaryStage2008-09 2009-10Sr.NoState11 Karnataka - 0.6 0.3 - 0.4 - 0.5 0.2 - 0.412 Kerala 1.5 0.5 0.7 - 0.9 0.7 0.4 0.3 - 0.513 Madhya Pradesh - 14.4 5.9 4.9 9.1 - 8.8 5.1 2.7 5.714 Maharashtra 3.3 2.4 1.8 - 2.4 5.0 4.2 0.4 - 3.115 Orissa - 2.4 10.5 - 6.3 - 1.4 3.4 - 2.516 Punjab - 10.8 8.6 24.3 15.3 - 9.0 7.3 18.2 11.917 Rajasthan - 16.2 13.3 13.1 14.2 - 13.0 8.4 11.1 10.818 Tamil Nadu - 1.4 2.0 2.2 1.8 - 2.5 2.3 1.9 2.<strong>21</strong>9 Uttar Pradesh - 1.7 2.8 0.1 1.6 - 1.2 2.2 1.3 1.620 Uttarakhand - 2.8 2.4 0.3 1.8 - 0.2 0.4 0.2 0.3<strong>21</strong> West Bengal 17.7 11.2 10.4 7.6 12.2 12.9 13.1 9.1 6.1 10.6All States - 6.4 5.0 4.2 5.4 - 4.7 3.6 3.4 4.0*The primary and upper primary stages depict the average (weighted) of all the grades in that stage.4.3 <strong>Dropout</strong>s Rate4.3.1 Overall <strong>Dropout</strong> RateThe percentage of school leaver or pass-outs out of total enrolment who do not pursuestudies in same or the other school during the following academic session is termed as thedropout rate. The dropout rate is different from dropout among school leavers in the sensethat it is the dropout rate amongst the total enrolment and not just the school leavers.For primary stage, the dropout rate for all the <strong>study</strong> <strong>states</strong> was at 2.7 % in 2008-09 and ithas increased to 3.1 % in 2009-10. In 2008-09, dropout rate among boys and girls ofprimary grades was 2.7 % which has increased to 3.2% among boys and 3% among girls inthe year 2009-10.Figure 4.3: <strong>Dropout</strong>s rates by stage and gender in 2008-09 and 2009-1054322.72.72.7Primary grades3.13.23.0Upper primary grades2.12.32.<strong>21</strong>.92.61.7102008-09 2009-10 2008-09 2009-10Total Boys Girlsin percent68
Grade 1Grade 2Grade 3Grade 4Grade 5PrimaryStageGrade 1Grade 2Grade 3Grade 4Grade 5PrimaryStageAt all <strong>states</strong> level the dropout rate at the upper primary stage was estimated at 2.1 % and2.2 % for 2008-09 and 2009-10 respectively. Marginal increase in dropout rates observedamong boys and decrease in girls during the reference years.In 2008-09, West Bengal experienced highest (3.9%) overall dropout rate among all <strong>states</strong>under <strong>study</strong> whereas Jharkhand, Punjab, Bihar, Rajasthan, Assam, Madhya Pradesh andChhattisgarh had dropout rate between > 3% in primary grades. For the year 2009-10dropout rates was highest in Uttar Pradesh (4.6%) Other <strong>states</strong> with high dropout areChhattisgarh (4.4 %), Delhi (4.3%), Kerala (4.2%) and Punjab (3.9 %)Table 4.3.1: <strong>Dropout</strong>s rates by stage, gender and state in 2008-09 and 2009-10Sr. No State 2008-09 2009-101 Andhra Pradesh 1.9 1.3 1.4 1.2 9.7 3.0 1.3 1.4 2.0 0.9 9.0 2.92 Assam 1.3 1.5 1.5 8.8 - 3.2 1.7 1.1 1.2 7.0 - 2.63 Bihar 2.9 2.4 2.3 2.4 7.8 3.4 2.3 2.3 2.7 1.9 6.2 3.04 Chhattisgarh 0.9 1.5 1.8 1.5 11.9 3.0 2.8 1.6 2.7 2.5 13.7 4.45 Delhi 0.9 1.3 0.4 0.5 11.1 2.7 0.3 0.3 0.7 0.2 <strong>21</strong>.6 4.36 Gujarat 0.3 0.3 0.6 2.9 - 1.0 0.4 0.4 0.8 2.3 - 1.07 Haryana 0.2 0.6 0.9 0.6 8.7 2.1 0.8 0.6 0.8 0.7 6.5 1.88 Himachal Pradesh 0.2 0.3 0.2 0.1 6.1 1.4 0.3 0.4 0.4 0.5 5.0 1.49 Jammu & Kashmir 0.7 0.4 0.8 1.2 3.1 1.3 0.7 0.8 0.4 0.2 4.5 1.310 Jharkhand 3.5 2.8 2.8 2.6 5.8 3.5 2.5 2.1 2.1 1.8 6.5 3.011 Karnataka 1.3 1.0 0.7 1.2 4.2 1.6 1.0 1.2 0.8 1.1 3.5 1.512 Kerala 0.2 0.0 0.1 9.5 - 2.7 0.1 0.0 0.0 15.5 - 4.<strong>21</strong>3 Madhya Pradesh 1.4 1.6 2.0 1.2 10.9 3.2 2.3 1.5 1.5 0.9 7.9 2.814 Maharashtra 0.6 0.4 0.3 6.1 - 1.8 1.7 0.7 0.4 4.9 - 2.015 Orissa 1.2 1.1 1.2 0.7 9.7 2.7 0.5 0.4 0.5 0.5 5.0 1.316 Punjab 3.0 2.5 3.3 1.9 6.9 3.4 3.2 2.3 2.6 2.6 9.0 3.917 Rajasthan 1.9 2.2 2.2 1.9 9.2 3.2 2.6 2.2 2.1 2.5 6.6 3.118 Tamil Nadu 0.6 0.6 0.6 0.7 9.5 2.6 0.6 0.4 0.6 0.4 6.0 1.719 Uttar Pradesh 1.0 1.0 0.8 0.7 9.7 2.4 1.5 1.9 1.5 1.0 18.1 4.620 Uttarakhand 1.8 1.5 1.3 1.2 7.5 2.6 1.0 1.1 0.9 1.0 4.5 1.7<strong>21</strong> West Bengal 2.0 1.8 1.8 11.2 - 3.9 1.5 1.1 0.8 6.9 - 2.5All States 1.5 1.4 1.3 2.4 7.9 2.7 1.6 1.4 1.4 2.1 10.1 3.1*The primary and upper primary stages depict the average (weighted) of all the grades in that stage.Table 4.4.9-4.4.10 in annexure depicts the gender wise dropout rate at the primary stage,not much difference is seen in the dropout rate in the year 2008-09 but in the year 2009-10Delhi, Punjab, Tamil Nadu, Uttar Pradesh and Uttarakhand <strong>states</strong> there is a difference ofclose to 1 % between the dropout rate for boys and girls. Other than these no significantgender-wise differences were recorded.69
Grade wise overall dropout rates for primary stage shown in the table 4.3.1, it indicates thatthere is a increase of 2 percentage point in dropout rate in grade-5 while in the rest of theprimary grades the dropout rate have remained almost similar in both the years.Table 4.3.1 represents the dropout rates of primary and upper primary stages for <strong>21</strong> <strong>study</strong><strong>states</strong> in both the assessment years 2008-09 and 2009-10. Grade wise and gender wisedropout rates for both the assessment years for primary and upper primary grades havebeen given in table numbers 4.4.9 to 4.4.12 in Annexure – I.Figure 4.4: Overall dropout rates by stage and grade in 2008-09 and 2009-1012.010.08.0Primary grades7.910.1Upper primary grades6.04.02.00.03.73.32.4 2.11.51.61.4 1.31.61.4 1.41.61.30.4Grade-1 Grade-2 Grade-3 Grade-4 Grade-5 Grade-6 Grade-7 Grade-82008-09 2009-10 in percentIn case of upper primary grades, a decline in dropout rates observed in grade 7 from 3.7%in2008-09 to 3.3% in 2009-10 whereas in grade 8, dropout rate has increase by 0.9 percentagepoints.The <strong>states</strong> with higher dropout rates for upper primary stage in 2008-09 are Karnataka (6.8%), Assam (4.6%), Orissa (4.1 %) and Gujarat (3.5%). Similarly in 2009-10, the higher dropoutrates at upper primary stage were observed in the <strong>states</strong> of Karnataka (5.7%), Orissa (5%),and (3.4 %) and Assam (3.3%).70
Grade 5Grade 6Grade 7Grade 8UpperPrimaryStageGrade 5Grade 6Grade 7Grade 8UpperPrimaryStageTable 4.3.2: <strong>Dropout</strong>s rates by stage, gender and state in 2008-09 and 2009-102008-09 2009-10Sr.NoState1 Andhra Pradesh - 1.2 5.3 - 3.4 - 1.6 3.2 - 2.42 Assam 1.6 2.9 9.9 - 4.6 2.4 1.8 5.9 - 3.33 Bihar - 1.1 1.9 0.3 1.1 - 1.6 1.3 0.5 1.24 Chhattisgarh - 1.9 1.7 0.9 1.5 - 6.1 2.4 1.7 3.45 Delhi - 0.0 0.9 0.0 0.3 - 0.2 0.5 0.2 0.36 Gujarat 0.6 0.8 9.1 - 3.5 0.5 0.3 7.8 - 3.07 Haryana - 0.5 0.4 0.3 0.4 - 0.3 0.1 0.2 0.28 Himachal Pradesh - 1.8 1.7 0.7 1.4 - 2.2 0.3 0.2 0.99 Jammu & Kashmir - 1.2 0.7 0.3 0.7 - 0.8 0.4 0.3 0.510 Jharkhand - 1.6 3.8 0.6 2.1 - 2.7 3.0 2.7 2.811 Karnataka - 1.0 12.7 - 6.8 - 1.7 9.6 - 5.712 Kerala 0.1 0.1 8.1 - 2.9 0.1 0.1 10.5 - 3.713 Madhya Pradesh - 2.2 1.4 0.6 1.5 - 2.2 1.7 2.5 2.<strong>21</strong>4 Maharashtra 1.0 0.6 3.4 - 1.7 0.2 0.2 3.9 - 1.515 Orissa - 2.1 6.2 - 4.1 - 1.5 8.3 - 5.016 Punjab - 0.6 0.5 0.5 0.5 - 1.7 2.2 0.5 1.417 Rajasthan - 3.3 4.1 0.7 2.7 - 2.5 2.2 2.0 2.<strong>21</strong>8 Tamil Nadu - 1.7 1.4 1.0 1.3 - 2.3 1.6 1.8 1.919 Uttar Pradesh - 2.3 2.0 0.2 1.5 - 1.5 1.7 1.2 1.520 Uttarakhand - 1.7 1.4 0.3 1.2 - 1.0 1.0 0.4 0.8<strong>21</strong> West Bengal 0.7 0.2 0.3 0.2 0.4 0.1 0.4 0.4 0.2 0.3All States - 1.6 3.7 0.4 2.1 - 1.6 3.3 1.3 2.271
CHAPTER 5Reconstructed Cohort AnalysisThe indicators like cohort dropout rate, coefficient of internal efficiency of the stage andaverage duration of <strong>study</strong> have been worked out separately for primary (grades 1-4/5) andelementary stage (grades 1-7/8). The indicators were calculated for each state as per statepattern of education. Important findings of the results are discussed separately for primary andelementary stages as under.The reconstructed cohort method was used to calculate the cohort dropout rate using thegrade wise promotion rates, repetition rates and the dropout rates. In a state with 5 year cyclefor primary education, a student should take five years to complete his primary education butsome students take more than 5 years due to repetition of one or more grades. Some studentswill also become dropouts and move out of the education system. To apply this method, dataon grade wise enrolment of two consecutive years and on repeaters by grade from the first tosecond year will be sufficient to estimate the three main flow rates promotion, repetition anddropout rates.Promotion rate, repetition rate and the dropout rate are used in a reconstructed pupil-cohortanalysis to derive other indicators such as cohort dropout rate, average duration of the <strong>study</strong>and coefficient of internal efficiency. In the reconstructed cohort method it is assumed that thepromotion, repetition and dropout rates of the base year for a specific grade hold good for thesame grade in subsequent years. It is further assumed that a student is allowed to repeat aclass any number of times until she/he is promoted to next grade or discontinues the studiesaltogether.5.1 Cohort dropout rateIn order to calculate cohort dropout rates, the state-wise education pattern has been followedfor each state. Two types of cohort dropout rates have been calculated. First, for those grade-1students who discontinued studies anytime before reaching the terminal grade (grade 4 or 5).The rate is termed as cohort dropout rate before reaching last grade of primary/upper primarystage. Second is the cohort dropout rate for the grade 1 students who discontinued theireducation any time before passing the last grade of primary/upper primary stage. Thecoefficient of internal efficiency has also been calculated using the formulae provided byEd.CIL. The definitions of these indicators have already been given in Chapter 1. In this chapterwe have discussed the cohort dropout before passing the last grade of primary/ upper primarystage and it would be referred as cohort dropout rate in the chapter.5.1.1 Cohort dropout rate at primary stageCohort dropout rate gives the percentage of dropouts for a group of student who dropoutbefore completing the last grade. The Figure 5.1 gives us the cohort dropout rates for72
completing primary stage. Figure 5.1 depicts that there is an increase in overall cohort dropoutrate at the primary stage which was 14.2% in 2008-09 and it increased to 16.8% in 2009-10. It isalso seen that the cohort dropout rate for boys is slightly higher than the cohort dropout ratesfor girls.Figure 5.1: Cohort dropout rates for primary stage by year & gender201514.<strong>21</strong>4.814.516.816.016.310502008-09 2009-10Total Boys Girls in percentThe <strong>states</strong> with very high cohort dropout rates in respect of completing primary stage in 2008-09 are Jharkhand (19.9 %), Bihar (19.3 %), Rajasthan (18.6%), Punjab (18.2 %), Madhya Pradesh(18 %) and Chhattisgarh (17.5 %). In 2009-10 all these <strong>states</strong> saw a decline in the cohortdropout rate except Chhattisgarh and Punjab. In 2009-10 the <strong>states</strong> that recorded a high cohortdropout rate are Uttar Pradesh (22.9%), Chhattisgarh (22.3 %), Punjab (19.5 %), Rajasthan(17%), Jharkhand (16.8%), Bihar (16.5 %) and Madhya Pradesh (14.8 %).The <strong>states</strong> that recorded a low cohort dropout rate at the primary stage are Gujarat, HimachalPradesh and Jammu and Kashmir.5.1.2 Cohort dropout rates at the elementary stageCohort dropout at the elementary stage is shown in figure 5.2 with two set of <strong>states</strong> (1) thathave elementary level cycle of grade 1-7 (2) that have elementary education cycle of grade 1-8.States with elementary stage consisting of grades 1-7 are Andhra Pradesh, Assam,Gujarat, Karnataka, Kerala, Orissa and MaharashtraStates with elementary stage 1-8 are Bihar, Chhattisgarh, Delhi, Haryana, HimachalPradesh, Jammu and Kashmir, Jharkhand, Madhya Pradesh, Punjab, Rajasthan, TamilNadu, Uttar Pradesh, Uttarakhand and West Bengal.Figure 5.2 presents cohort dropout rates at the elementary stage which is depicted separatelyfor grade 1 to 7 and grade 1 to 8. For the year 2008-09 the cohort dropout was similar for the<strong>states</strong> following grade 1-7 pattern but in the year 2009-10 the <strong>states</strong> that followed grade 1-8pattern recorded a higher dropout rate of around 2.7 percentage points.73
Figure 5.2: Cohort dropout rates at completing elementary stage by year & genderElementary stage (1 to 7) Elementary stage (1 to 8)252019.<strong>21</strong>9.323.2<strong>21</strong>.820.519.1 19.5 19.6 19.4 19.520.1<strong>21</strong>.61510502008-09 2009-10 2008-09 2009-10Total Boys Girlsin percentAt overall level the elementary stage with grade 1-7, cohort dropout rate at completing stagefor 2008-09 is 19.2 % and the same has increased to 20.5 % in 2009-10. Figure 5.2 reveals thatthe cohort dropout rates have remained almost same in the two assessment years whereas forboys the dropout rate has increased by more than 2 percentage points between the two years.The <strong>states</strong> with very high cohort dropout rate at elementary stage (grade 1-7) in 2008-09 wereAssam (27 %) and Orissa (<strong>21</strong>.7%), in 2009-10 both these <strong>states</strong> recorded a decrease in thecohort dropout rate. Lowest cohort dropout rate was recorded for Gujarat in both theassessment years.At an overall level, the cohort dropout rate at completing elementary stage with grades 1-8 inthe year 2008-09 was 19.6% and it increased to 23.25% in 2009-10. Cohort dropout rate hasremained almost same for both the years in the two assessment years but for girls there hasbeen an increase of almost 1.5 percentage points.The <strong>states</strong> with very high cohort dropout rate at the elementary stage (1-8) in 2008-09 wereJharkhand (24.6%) and Rajasthan (27.1%) both these <strong>states</strong> recorded a decline in the year2009-10. In 2009-10 Chhattisgarh (30%) and Uttar Pradesh (26.3%) recorded a high cohortdropout rate. Lowest cohort dropout was recorded for Himachal Pradesh, Jammu and Kashmirand Haryana. The table 5.1 in Annexure-I gives us the state-wise cohort dropout rates primarystage and elementary stage (separately for grade 1-7 and grade 1-8 based on the stateeducational pattern).5.2 Coefficient of internal efficiencyThe coefficient of internal efficiency of the system is the ratio of ideal number of pupil-yearsrequired to produce the same number of graduates to actual number of pupil-years spent to74
produce graduates for a cohort. The more number of years taken to pass out less is the internalefficiency. It summarises the consequences of repetition and dropout on the efficiency of theeducational process in producing graduate.It is calculated by taking the ratio of the ideal no. of pupil years required for a student tograduate and average number of pupil years that are invested on a graduate.So the formula for Coefficient of Internal Efficiency is:Ideal number of pupil years for graduationAverage no. of pupil years invested per graduate ∗ 100The ideal value of the coefficient is 100 % where all pupils progress and complete the schoolcycle, neither repeating nor dropping out such that each pupil takes the ideal number of yearsin completing the education. A coefficient of efficiency approaching 100 % indicates a highoverall level of internal efficiency and no wastage due to repetition and drop-out. Coefficient ofefficiency of less than 100 % signals inefficiency due to grade repetition and drop-out.5.2.1 Coefficient of internal efficiency at primary stageAs presented in Figure 5.3, overall level, the coefficient of internal efficiency for 2008-09 wasestimated at 81.6 % and the same has decreased to 80.8 % in 2009-10. Coefficient of internalefficiency is similar for girls and boys in both the assessment years.Figure 5.3: Coefficient of internal efficiency for primary stage1008081.6 81.8 81.5 80.8 80.4 80.960402002008-09 2009-10Total Boys Girlsin %The <strong>states</strong> with high coefficients of internal efficiency at the primary stage in 2009-10 wereKarnataka (93.9%), Himachal Pradesh (93.5%), Uttarakhand (92.6 %), Maharashtra (92.5 %) andTamil Nadu (91.8%) and the state with lower coefficients of internal efficiency at the primarystage in 2009- 10 are Bihar(76.5%), Rajasthan (76.1%) ,Uttar Pradesh (76.7%) and Jharkhand(74.9 %).75
5.2.2 Coefficient of internal efficiency at the elementary stageCoefficients of internal efficiency have been calculated separately for those <strong>states</strong> havingelementary stage till grade 7 and till grade 8.Figure 5.4: Coefficient of internal efficiency for elementary stage (1-7)10080604020080.4 79.8 80.7 80.2 79.4 81.32008-09 2009-10Total Boys Girls in percentAt overall level, the coefficient of internal efficiency for 2008-09 was estimated at 80.4 % andthe same has decreased to 80.2 % when calculated for year 2009-10. Girls recorded a slightlyhigher coefficient of internal efficiency than boys in both the assessment years.The <strong>states</strong> with high coefficients of internal efficiency at the elementary stage (grade1-7) in2009-10 were Maharashtra (90.2%), Gujarat (83%) and Andhra Pradesh (84.4 %) and Assamrecorded lowest (79 %) coefficient of efficiency in 2009-10 among all <strong>study</strong> <strong>states</strong>.Figure 5.5: Coefficient of internal efficiency for Elementary Stage (1-8)1008081.6 81.2 82.2 80.8 79.6 82.360402002008-09 2009-10Total Boys Girls in percentAt an overall level, the coefficient of internal efficiency for <strong>states</strong> with 1-8 grades in 2008-09was estimated at 81.6 % which has marginally decreased to 80.8 % in 2009-10. Girls recorded ahigher coefficient of internal efficiency than boys at all <strong>states</strong> level during the reference years.76
The <strong>states</strong> with the higher coefficients of internal efficiency at elementary stage (grade 1-8) in2009-10 were Chhattisgarh (30%), Uttar Pradesh (26Jharkhand (24.6%), Punjab (23.5%) andRajasthan (23.6%)The table 5.3 in Annexure-I gives us the state-wise coefficient of internal efficiency for primaryand elementary stage (separately for 1-7 and 1-8 based on the state educational pattern).5.3 Average duration of <strong>study</strong>The average duration of <strong>study</strong> has also been calculated separately for primary and elementarystages for both the assessment years i.e. 2008-09 and 2009-10.5.3.1 Average duration of <strong>study</strong> at primary stageThe average duration of <strong>study</strong> at primary stage in 2008-09 and 2009-10 for all <strong>states</strong> combinedtogether was 5.4 and 5.3 years respectively. Highest average duration of <strong>study</strong> in the <strong>states</strong>following grade 1-5 pattern, was found in Jharkhand as 5.9 years and 5.8 years in Bihar. Inthose <strong>states</strong> where primary stage is till grade-4, highest average duration (4.6 years) of <strong>study</strong>was found in West Bengal in the year 2009-10.5.3.2 Average duration of <strong>study</strong> at upper primary stageAverage duration of <strong>study</strong> at upper primary stage for all the <strong>states</strong> was recorded 7.5 and 8.6years for upper primary stage 1-7 and 1-8 respectively in 2008-09. Corresponding figures forthe year 2009-10 was 7.4 and 8.5 years. Among the <strong>states</strong> with elementary stage of grade1-7,the maximum time taken by students to complete the elementary stage was in the state ofAssam 7.6 years whereas in Karnataka it was 7 years (the optimum) for the year 2009-10.In those <strong>states</strong> where elementary stage is from grade 1-8, average duration of time taken bystudents to complete grade 1-8 was 9.1 years in Jharkhand and Rajasthan, 9 years in WestBengal, 8.8 years in Punjab and 8.7 years in Madhya Pradesh.(Refer table 5.3, Annexure-I)77
CHAPTER 6Education status and <strong>Dropout</strong>s among Scheduled Castes, Schedule Tribes andMuslims6.1 Enrolment for SC, ST and Muslims6.1.1 Enrolment of SC studentsA total of 93,989 SC students were found enrolled in primary grades (1 to 5) in the total of allthe <strong>states</strong> (Table 6.1.1, Annexure-I). Number of enrolled SC students declined by 0.5 % (declineof 471 students) next year in the same grades. The percentage of SC students to the enrolmentat the primary stage was 20.7% in 2009-10. In 2009-10 the maximum contribution to the SCstudents’ is found in Bihar (10,707 students), Delhi (9,257 students) and Punjab (8,306students).6.1.2 Enrolment of ST studentsIn all the <strong>states</strong> a total of 42,652 ST students were found enrolled in grade 1-5 in the schoolscovered in 2008-09. There was a decline of around 3.4 % in ST student’s enrolment in thesucceeding year. The percentage of ST students to the enrolment at the primary stage was9.2% in the year 2009-10.In 2009-10, the <strong>states</strong> with high number of ST enrolment (Table 6.1.2, Annexure-I) at theprimary stage are Jharkhand (6,694 students), Madhya Pradesh (4,757 students), Orissa (4,676students, Gujarat (4,526 students) and Chhattisgarh (4,335 students). States with very low STenrolment in 2009-10 are Punjab, Uttar Pradesh, Jammu & Kashmir and Haryana.6.1.3 Enrolment of Muslim studentsMuslims’ enrolment was 65,100 in primary grades (1 to 5) in 2008-09 in the sampled primaryschools. Same schools reported a decrease in enrolment rate of Muslim students by 1.7 % inthe next academic year. Overall in primary grades, grade 1, 2 and 3 reported a decline inenrolment whereas grade-4 and 5 recorded an increase in Muslim student’s enrolment from2008-09 to 2009-10. (Table 6.1.3, Annexure-I) The percentage of Muslim students to theenrolment at the primary stage was 14.3% in 2009-10.In 2009-10 West Bengal had the highest Muslims enrolment of 10,998 students, other <strong>states</strong>with high Muslim enrolment are Delhi (6,058 students), Bihar (5,740 students), Uttar Pradesh(4,627 students), Jharkhand (4,110 students) and Assam (4,078 students)Enrolment in upper primary stage6.1.4 Enrolment of SC studentsIn total 1,753 upper primary schools, 40, 986 SC students were enrolled at upper primary stage(grade 6-8) across all the <strong>states</strong>. The number of SC students enrolment increased by 1.2 % (50478
students) in the academic year, 2009-10. Overall, only in grade 6 a decline in SC enrolment wasobserved, whereas in grade 7 and grade 8 an increase in SC enrolment was recorded.In 2009-10 (Table 6.1.4, Annexure-I) the <strong>states</strong> with high SC students in upper primary gradesare Delhi (6,489 students), West Bengal (5,175 students), Haryana (4,153 students) and Punjab(3,795 students).6.1.5 Enrolment of ST studentsIn 2008-09, 13,947 ST students were found enrolled in upper primary grades across all <strong>study</strong><strong>states</strong>. In the subsequent year the number of ST enrolled students increased up to 14,375students in the same schools, an increase of 3 %. Except grade 8, other two grades observed anincrease in ST enrolment.In 2009-10, (Table 6.1.5, Annexure-I), <strong>states</strong> with high ST enrolment are Gujarat (3,117students), Jharkhand (2,130 students), Madhya Pradesh (2,114 students), Orissa (1,767students) and Rajasthan (1,648 students)6.1.6 Enrolment of Muslim students25,360 Muslim students were enrolled in upper primary grades in all <strong>21</strong> <strong>states</strong>. In the next year,nearly 2.2 % more students were enrolled in the same schools. The Muslims enrolment hasincreased in grade 7 and grade 8 and declined in grade 6.In 2009-10 (Table 6.1.6, Annexure), <strong>states</strong> with high Muslim enrolment are West Bengal(13,064 students), Assam (2,988 students), Kerala (2,449 students), Gujarat (2,161 students)and Bihar (1,733 students)Figure 6.1: Proportion of SC, ST and Muslims in the total enrolment by stage in the year 2009-102520.7 20.9 20.3201513.8 14.312.7108.5 9.27.050SC ST MuslimsTotal Primary Level Upper Primary LevelCriteria selection of <strong>states</strong> for SCs, STs and Muslims dataThe number of children enrolled from Scheduled Castes (SC), Scheduled Tribes and Muslimsvaried widely from state to state. Therefore, indicators for SC, ST and Muslims have beenpresented for those <strong>states</strong> where there was considerable proportion of SC, ST and Muslim79
students among total enrolled students. Hence, the <strong>states</strong> for assessing dropout etc SC, ST andMuslims were identified on the basis of the percentage of total enrollment as given in the table6.1 below.Table 6.1: Criteria for selection of States for reporting of dropout rates for SC, ST and MuslimsGroupCriteria - % oftotal enrolmentNo. of<strong>states</strong>Name of StatesSC > 15percent 16ST>5percent 12Andhra Pradesh, Bihar, Delhi, Haryana, Himachal Pradesh, Jammuand Kashmir, Karnataka, Madhya Pradesh, Maharashtra, Orissa,Punjab, Rajasthan, Tamil Nadu, Uttar Pradesh, Uttarakhand andWest BengalAndhra Pradesh, Assam, Chhattisgarh, Gujarat, Himachal Pradesh,Jharkhand, Karnataka, Madhya Pradesh, Maharashtra, Orissa,Rajasthan, UttarakhandMuslims>10percent 10Assam, Bihar, Gujarat, Jammu and Kashmir, Jharkhand, Karnataka,Kerala, Uttar Pradesh Uttarakhand and West BengalThe <strong>states</strong> identified above form the basis for <strong>study</strong>ing the different indicators likeSchool Leaver Rate, Promotion Rate, Repetition Rate and Overall <strong>Dropout</strong> Rate for theconcerned social groups (SC and ST) and Muslims respectively. (Refer table 6.1.7, Annexure-I)6.2 Number of school leavers at primary and upper primary stage whose houses werevisited and their status6.2.1 Number of SC, ST and Muslim students who left school in primary gradesFor SC, ST and Muslim students who left the schools before completing primary stageinformation on their education status was collected by visiting their houses. Houses of 5,561 SCschool leavers in 2008-09 and 3,490 in 2009-10 were visited during the survey. In the <strong>states</strong> ofBihar, Punjab, Rajasthan and Uttar Pradesh, more than 10 % of the total SC students had leftthe school from primary grades in 2008-09.Among ST students of primary stage, 3,397 students during 2008-09 and 2,119 students during2009-10 academic sessions had left school. Number of school leavers decreases with increasein grades in both the assessment years with few exceptions. Nearly 1/3rd of the total STstudents who had left the school in both the years were from the state of Jharkhand. Share ofRajasthan and Orissa among the total school leavers was more than 25 %.In the year 2008-09, 3,688 Muslim students left the school during 2008-09. Next year, lessMuslim students (only about 2,400) left the school. Bihar, Jharkhand and West Bengal are the80
three <strong>states</strong> showing considerable number of school leavers among Muslims from primarystage in both the assessment years. It has been observed that the phenomenon of leaving theschool is more common in initial grades and it reduces considerably in higher grades of primarystage. (Refer table 6.2.1 to 6.2.3)6.2.2 Number of SC, ST and Muslim students who left school in upper primary gradesIn 2008-09, around 1,500 SC students left school before completing upper primary stage and inthe next year, this number came down to nearly 800 students. Highest number of SC studentswho left school across all <strong>study</strong> <strong>states</strong> was in Punjab and Bihar in 2009-10.Among ST students of upper primary grades, houses of about 1,000 and 500 school leaverswere visited during 2008-09 and 2009-10 respectively to know the status of their education.Jharkhand in 2008-09 and Orissa in 2009-10 had the highest number of ST students who hadleft school.A total of 935 during 2008-09 and 556 during 2009-10 Muslims left the school from upperprimary stage. Assam is the only state experiencing highest number of Muslim school leavers atupper primary stage followed by West Bengal and Gujarat during the two years. (Refer tables6.2.4 and 6.2.6 in Annexure-I)6.3 Status of school leavers6.3.1 School leaver’s status of SC students at the primary stageNearly one-fourth of the total SC students who left the school in 2008-09, discontinued theireducation. Among rest of the students who continued their education in some otherrecognized or unrecognized schools, 27.3 % continued their education as repeater. In 2009-10,proportion of SC students who discontinued their education after leaving the school was 34.9%.West Bengal in 2008-09 and Madhya Pradesh in 2009-10 experienced highest percentageamong SC students who discontinued education after leaving from primary grades. In AndhraPradesh nearly 2/3 rd of the total SC students left the school and continued their education inthe next grade in some other recognized and unrecognized schools in 2009-10. (Table 6.3.1 and6.3.2, Annexure-I)6.3.2 School leaver’s status of ST students at the primary stageAbout 1/4 th of the total ST school leavers in 2009-10 discontinued education after leaving theschool in primary grades. Of the 3/4 th students who continued their education in some otherschools, 47.5% continued in the next grade as a promotee and 27.1% continued in the samegrade as a repeater81
Highest proportion of ST school leavers of 2009-10 academic year who continued theireducation in some other school as promotees found in the <strong>states</strong> of Himachal Pradesh (81.3%)followed by Orissa (67.6%) and Rajasthan (60.2%). Grade wise status of ST students who leftthe primary school is given in tables 6.3.3 and 6.3.4 of Annexure-I6.3.3 School leaver’s status of Muslim students at the primary stageA little over one-fourth of the total Muslim students who left the school in any of the primarygrades discontinued their education in 2008-09. Next year, the proportion of students whodiscontinued education after leaving school had increased to one-third.Jammu and Kashmir is the state where 3/4 th of the total school leavers continued education inthe next grade in some other school and only 3.5 % discontinued in 2009-10. Kerala is the statewhere nearly 2/3 rd of the total school leavers of 2009-10 continued their education as repeaterin some other school. Grade wise status of Muslim students who left the primary school isgiven in tables 6.3.5 and 6.3.6 of Annexure-I.6.3.4 School leaver’s status of SC students at the upper primaryOne out of four SC students who left the school in 2008-09 from any of the upper primarygrades had discontinued their education and nearly one out of three continued their educationas repeater and two out of five continued as promotees in some other upper primary school. In2009-10, a little less than one-third of the total SC school leavers continued as promotees, alittle over 1/3 rd continued as repeater in some other school and around 1/3 rd discontinued theireducation.In Maharashtra and Uttarakhand, 80% or more of the total SC students who left the schoolcontinued their education in some other upper primary schools either as repeaters or aspromotees. Grade wise status of school leavers is given in table 6.3.7 and 6.3.8 of Annexure-I.6.3.5 School leaver’s status of ST students at the upper primary stagePercentage of ST students who continued their education after leaving school in 2008-09 wasaround 75% and it had come down to nearly 66% in 2009-10.Gujarat, Himachal Pradesh, Maharashtra, Orissa, Rajasthan and Uttarakhand are the <strong>states</strong>where promotees among ST school leavers in 2009-10 is more than all <strong>states</strong> average i.e. 44.1%. Andhra Pradesh observed highest percentage (75 %) in 2009-10 of students whodiscontinued after leaving school among 12 <strong>states</strong> considered for ST data presentation. Forgrade wise details of ST school leavers, please refer table 6.6.9 and 6.6.10 in Annexure-I.82
6.3.6 School leaver’s status of Muslim students at the upper primary stageIn 2009-10, among Muslim students of upper primary stage, large proportion of students whodid not continue their education after leaving school were found in Karnataka (73.9 %) andUttarakhand (66.7 %). Jammu & Kashmir experienced lowest dropout after leaving the schoolin upper primary stage during 2009-10.In 2008-09, nearly 1/4 th Muslim students did not continue after leaving school and while in2009-10, 1/3 rd Muslim students discontinued after leaving school. Grade wise status of schoolleavers is given in table 6.6.11 & 6.6.12 of Annexure-I for <strong>states</strong> selected for Muslim datapresentation.6.4 School Leavers’ RateFigure 6.2: School Leavers’ rates for 2009-10 amongst SC, ST and Muslims9634.13.35.14.33.53.30SC ST MuslimsPrimaryUpper Primary6.4.1 Grade wise school leaver rates for SC studentsAt primary stage, school leaver rates have come down from 6.8 % in 2008-09 to 4.1 % in 2009-10 among SC students. Grade -1 experienced highest school leaver rates in all the grades inboth the assessment years.Highest school leaver rate during 2008-09 was found in Rajasthan (12.6%) followed by AndhraPradesh (10.3%) and Uttar Pradesh (9.1%). In the assessment year 2009-10, highest schoolleaver rates were observed in Bihar (9.2%) and Andhra Pradesh (7.5%). Delhi and Uttarakhandexperienced lowest school leaver rate in both the assessment years. (Refer table 6.4.1 inAnnexure)Uttarakhand had SC students’ enrolment of 27.9% out of total enrolment in both theassessment years and it recorded the lowest school leavers’ rates at the primary stage.83
6.4.2 Grade wise school leaver rates for ST studentsThe <strong>states</strong> of Jharkhand and Rajasthan had highest school leaver rates in both the assessmentyears. In 2009-10, Jharkhand observed a decrease of 6.3 percentage points and Rajasthanshowed a decrease of 4.7 percentage points at primary stage.At all <strong>states</strong> level, the school leavers’ rate of ST students reduced from 8.2 % to 5.1 %. Amongall the primary stage grades, grade-1 observed the highest school leaver rates (6.1%) followedby grade-3, grade-2, grade-4 and grade-5 in the year 2009-10. In both the reference years(2008-09 and 2009-10), Uttarakhand experienced lowest rates (0.8% and 0.7% respectively) atprimary stage. (Refer table 6.4.2)6.4.3 Grade wise school leaver rates for Muslim studentsOver all school leaver rates at primary stage among Muslim students were 6.1% in 2008-09which has come down to 3.5 % in 2009-10. In the recent assessment year (2009-10), Biharrecorded the highest (8.5%) and Uttarakhand recorded the least (0.5%) school leaver’s ratesamong all the <strong>states</strong>. Grade wise school leaver rates decreases with the increase in grade in therecent assessment years. (Refer table 6.4.3).School leaver rates at upper primary stage (Grades 5/6 to 7/8)6.4.4 Grade wise school leaver rates for SC studentsAt upper primary stage, school leaver rate was 5.2 % in 2008-09 which have come down to3.3% in 2009-10. States that recorded a high school leavers’ rate was Bihar, Orissa and Punjabin the recent assessment year (2009-10). School leaver rates were found to be highest in grade-6 in both the assessment years. Delhi recorded the lowest school leavers’ rates in both theassessment years. (Refer table 6.4.4)6.4.5 Grade wise school leaver rates for ST studentsAmong ST students, school leaver’s rates were recorded as 6.3% and 4.3% in 2008-09 and2009-10 years respectively. It has been observed that the rates reduced by nearly 50% fromgrade-6 to grade-8 in 2008-09. Andhra Pradesh and Jharkhand recorded a high school leavers’rate in 2008-09 and Orissa and Rajasthan in 2009-10. Assam and Uttarakhand recorded thelowest school leavers’ rate in both the years among SC students in upper primary stage. (Refertable 6.4.5)6.4.6 Grade wise school leaver rates for Muslim studentsIn those <strong>states</strong> where school leaver rates for Muslims have been estimated, Jharkhandobserved 11.8% and 7% - highest school leaver rates in 2008-09 and 2009-10 respectively.Other <strong>states</strong> with high school leavers’ rate are Assam and Uttar Pradesh. Grade-7 had themaximum and grade-8 had the minimum school leaver rates among upper primary grades inboth the reference years among Muslim students. (Refer table 6.4.6)84
6.5 Students dropout rates among school leavers6.5.1 Grade wise SC student’s dropout rates among school leavers at primary stageAmong SC students, the overall dropout rate among school leavers in primary stage is found tobe 34.6 % in 2009-10 which was 25.8 % in 2008-09. The <strong>states</strong> with high dropout rates amongthe school leavers at the primary stage are Madhya Pradesh (66.3 %), West Bengal (56 %) andPunjab (55.3 %) and Uttar Pradesh (53.6%).The grade-wise dropout rates of SC students at the all <strong>states</strong> level are varying from lowest27.3% (grade 1) to highest 60 % (grade 5) in 2009-10. It indicates that a maximum dropouttakes place at the end of the primary stage (Refer table 6.5.1, Annexure-I)6.5.2 Grade wise ST students’ dropout rates among school leavers at primary stageAmong ST students, the overall dropout rate among school leavers in Primary stage is found tobe 34.9 % in 2009-10 which is an improvement from the previous year data of 23.7 %. The<strong>states</strong> with overall dropout rates higher than the combined state figure (35%) are MadhyaPradesh, Chhattisgarh, Assam and Uttarakhand. Nearly 3 out 4 students dropped out in thestate of Madhya Pradesh. Overall grade wise dropout rate vary from 28% to 63.8% in 2009-10.(Refer table 6.5.2, Annexure-I)6.5.3 Grade wise Muslim students’ dropout rates among school leavers at primary stageAmong Muslim students, the overall dropout rate among school leavers in primary stage isfound to be 36.9% in 2009-2010 which was considerably higher from 2008-09(23.2%). The<strong>states</strong> with overall dropout rates higher than the combined state figure (36.9 %) are Assam,Karnataka, Uttar Pradesh, Uttarakhand, West Bengal and Bihar. The grade-wise dropout ratesof Muslim students at the all <strong>states</strong> level are varying from lowest 32.4% (grade 3) to highest45.7% (grade 5) in 2009-10. It indicates that the maximum dropout takes place at grade 5among Muslims in the primary stage. (Refer table 6.5.3, Annexure-I).Students’ dropout rates among school leavers at upper primary stage (Grades 5/6 to 7/8)6.5.4 Grade wise SC students’ dropout rates among school leaversAmong SC students, the overall dropout rate among school leavers at upper primary stage isfound to be 37.5 % in 2009-10. High school leavers’ rate is found in Delhi and Karnataka. Closeto 50 % of the upper primary students among SC students dropped out in the state of MadhyaPradesh. The grade-wise dropout rates of SC students are varying from 33.9% (grade 8) to43.2% (grade 7). (Refer table 6.5.4, Annexure-I)6.5.5 Grade wise ST students’ dropout rates among school leaversAmong ST students, the overall dropout rate among school leavers in Upper primary stage isfound to be 37.9% in 2009-2010. The <strong>states</strong> with overall dropout rates higher than the all<strong>states</strong> (37.9 %) are Andhra Pradesh, Chhattisgarh, Karnataka, Madhya Pradesh and Orissa.85
Nearly 70% ST students of upper primary stage in Chhattisgarh dropped out after leavingschool. The grade-wise dropout rates of ST students are varying from lowest 29.7% (grade 6) tohighest 51.4% (grade 8). It indicates that the maximum dropout takes place at grade 8. (Refertable 6.5.5, Annexure-I)6.5.6 Grade wise Muslim students’ dropout rates among school leaversAmong Muslim students, the overall dropout rate among school leavers in upper primary stageis found to be 36.4 % in 2009-10 which was higher than the previous year (24.9 %). The <strong>states</strong>with overall dropout rates higher than the all <strong>states</strong> figure (36.4 %) are Bihar, Karnataka, Kerala,Uttar Pradesh and Uttarakhand.The grade-wise dropout rates of Muslim students at the all <strong>states</strong> level are varying from lowest32.5% (grade 7) to highest 48.8% (grade 8). It indicates that the maximum dropout takes placeat grade 8 among Muslims in the upper primary stage. (Refer table 6.5.6, Annexure-I)6.6 Pass out rates of SC, ST and MuslimsThe numbers of SC, ST and Muslim students who pass out of terminal grade of primary orupper primary stage are termed as graduates for that stage. The terminal grade of a stage isbased on the state classification / pattern which are discussed in detail in chapter 1. In 2009-10,houses of primary graduates of 11,751 SCs, 4,604 STs and 7,130 Muslims were visited. Housesof SC (3,063), ST (2,395) and Muslim (3,385) graduates of 2009-10 of upper primary stage werealso visited during survey to ascertain the status of their education. (Refer table 6.6, Annexure-I)6.6.1 Status of SC graduated students of primary stage whose houses were visitedHouses of the pass outs of terminal grade were visited to ascertain the status of educationwhether they are continuing in the next grade or they discontinued their education aftergraduating from primary stage. It is clear from table 6.2 that in 2008-09, 88.9% of the total SCstudents graduated in primary stage continued their education in the next stage and the rest11.1% discontinued. In 2009-10, proportion of SC graduated students who continued theireducation declined by 4.2 percentage points and those who discontinued education increasedby 4.2 percentage points. Seven out of 16 <strong>states</strong> (refer table 6.2) had more than 90% SCgraduated students who continued their education in the next stage. In 2009-10, number of<strong>states</strong> increased from 7 to 12.86
Table 6.2 Status of SC pass out students of primary stage whose houses were visitedPrimary Stage2008-09 2009-10States Continued Discontinued Continued DiscontinuedAndhra Pradesh 91.7 8.3 92.5 7.5Bihar 86.3 13.7 90.0 10.0Delhi 89.2 10.8 76.1 23.9Haryana 88.5 11.5 92.8 7.2Himachal Pradesh 92.4 7.6 90.8 9.2Jammu & Kashmir 95.6 4.4 88.5 11.5Karnataka 87.9 12.1 92.0 8.0Madhya Pradesh 92.1 7.9 92.5 7.5Maharashtra 94.5 5.5 93.2 6.8Orissa 85.8 14.2 93.2 6.8Punjab 93.9 6.1 93.4 6.6Rajasthan 85.1 14.9 88.8 11.2Tamil Nadu 87.2 12.8 93.6 6.4Uttar Pradesh 88.0 12.0 69.0 31.0Uttarakhand 90.3 9.7 95.7 4.3West Bengal 86.0 14.0 93.5 6.5All States 88.9 11.1 84.7 15.36.6.2 Status of ST graduated students of primary stage whose houses were visitedIn 5 out of 12 <strong>states</strong>, more than 90% ST primary graduated students continued their educationafter leaving school in 2008-09 whereas in 2009-10, 8 out 12 <strong>states</strong> experienced similar trend.Table 6.3 clearly indicates that a sizeable reduction (4 percentage points) in the percentage ofST students observed who discontinued education after graduating from primary stagebetween 2008-09 and 2009-10. Andhra Pradesh, Assam, Gujarat, Himachal Pradesh,Karnataka, Madhya Pradesh, Maharashtra and Orissa are the <strong>states</strong> where more than 90 % STprimary graduated students of 2009-10 continued education in the next stage. (Refer table 6.3)Table 6.3 Status of ST graduated students of primary stage whose houses were visitedPrimary Stage2008-09 2009-10StateContinued Discontinued Continued DiscontinuedAndhra Pradesh 88.3 11.7 91.2 8.8Assam 87.9 12.1 94.3 5.7Chhattisgarh 90.9 9.1 85.0 15.0Gujarat 95.8 4.2 98.7 1.3Himachal Pradesh 96.8 3.2 93.3 6.7Jharkhand 87.6 12.4 88.9 11.187
Primary Stage2008-09 2009-10StateContinued Discontinued Continued DiscontinuedKarnataka 94.2 5.8 92.2 7.8Madhya Pradesh 92.0 8.0 95.6 4.4Maharashtra 89.7 10.3 95.5 4.5Orissa 86.3 13.7 95.2 4.8Rajasthan 84.0 16.0 89.6 10.4Uttarakhand 80.0 20.0 78.9 <strong>21</strong>.1All States 88.6 11.4 92.6 7.46.6.3 Status of Muslims graduated students of primary stage whose houses were visitedAmong Muslim graduated students of primary stage, 91.1 % in 2008-09 and 85 % in 2009-10continued their education in the upper primary stage. 8.9% graduated Muslim studentsdiscontinued education in 2008-09 and in 2009-10, this figure had increased by 6.1 percentagepoints. States like Assam, Bihar, Jammu & Kashmir, Jharkhand, Uttarakhand and West Bengalare the <strong>states</strong> where more than 90% graduated Muslim students continued education in thenext stage after graduating in 2009-10. (Refer table 6.4)Table 6.4 Status of Muslim graduated students of primary stage whose houses were visitedPrimary Stage2008-09 2009-10StateContinued Discontinued Continued DiscontinuedAssam 92.7 7.3 94.0 6.0Bihar 88.1 11.9 93.1 6.9Gujarat 91.3 8.7 78.1 <strong>21</strong>.9Jammu & Kashmir 90.5 9.5 91.8 8.2Jharkhand 93.9 6.1 96.3 3.7Karnataka 95.1 4.9 81.9 18.1Kerala 84.3 15.7 71.3 28.7Uttar Pradesh 91.7 8.3 74.4 25.6Uttarakhand 90.8 9.2 95.6 4.4West Bengal 91.6 8.4 92.6 7.4All States 91.1 8.9 85.0 15.06.6.4 Status of SC graduated students of upper primary stage whose houses were visitedStatus of upper primary stage SC graduated students was collected only from those <strong>states</strong>where terminal grade of upper primary stage was VII as well as <strong>states</strong> selected for SC datapresentation. There were only 4 such <strong>states</strong> viz. Andhra Pradesh, Karnataka, Maharashtra andOrissa. Of these four <strong>states</strong>, Maharashtra and Orissa are the two <strong>states</strong> where more than 90 %SC graduated students continued their studies in next stage. Overall 90.5% upper primarygraduated SC students continued education after graduating in 2008-09. Proportion of students88
who discontinued after graduating from upper primary stage reduced from 9.5% in 2008-09 to7.9% in 2009-10. (Refer table 6.5)Table 6.5 Status of SC graduated students of upper primary stage whose houses were visitedUpper Primary Stage (SC)2008-09 2009-10StatesContinued Discontinued Continued DiscontinuedAndhra Pradesh 85.4 14.6 91.9 8.1Karnataka 88.3 11.7 89.9 10.1Maharashtra 95.6 4.4 91.0 9.0Orissa 92.0 8.0 94.0 6.0All States 90.5 9.5 92.1 7.96.6.5 Status of ST graduated students of upper primary stage whose houses were visitedOver all proportion of ST students who continued education in the next stage was 90.7% in2008-09. In 2009-10, this proportion increased up to 92.2%. Except Assam and Maharashtra,rest all <strong>states</strong> observed more than 90% continuation rate after graduating from upper primarystage in 2008-09 while in 2009-10, all <strong>states</strong> except Karnataka crossed 90%. Table 3.5 revealsthat ST graduated students who discontinued reduced from 9.3% in 2008-09 to 7.8% in 2009-10. Karnataka recorded highest percentage (12.1%) of students who discontinued after2009-10. (Refer table 6.6)Table 6.6 Status of ST graduated students of upper primary stage whose houses were visitedUpper Primary Stage (ST)2008-09 2009-10StatesContinued Discontinued Continued DiscontinuedAndhra Pradesh 93.3 6.7 100.0 0.0Assam 75.0 25.0 99.5 0.5Gujarat 90.9 9.1 91.4 8.6Karnataka 92.7 7.3 87.9 12.1Maharashtra 89.0 11.0 100.0 0.0Orissa 94.1 5.9 92.1 7.9All States 90.7 9.3 92.2 7.86.6.6 Status of Muslim graduated students of upper primary stage whose houses werevisitedOf the total Muslim graduated students of 2008-09, whose houses were visited, more than 90%continued education for the next stage. This percentage increased to 93.8% in 2009-10.Graduated students who discontinue in the subsequent year reduced from 9.3% to 6.2%. (Refertable 6.7)89
Table 6.7 Status of Muslim graduated students of upper primary stage whose houses were visitedUpper Primary Stage (Muslim)2008-09 2009-10StatesContinued Discontinued Continued DiscontinuedAssam 94.1 5.9 96.0 4.0Gujarat 89.2 10.8 95.4 4.6Karnataka 83.6 16.4 89.2 10.8Kerala 93.5 6.5 89.3 10.7All States 90.7 9.3 93.8 6.26.7.1 Pass out rates among SC students of terminal grades of primary and upper stagesTable 6.8 shows that at primary stage overall pass out rate among SC students was found to be92.1% in 2008-09 and 94.7 % in 2009-10. In 2009-10, out of 16 <strong>states</strong> selected for SC datapresentation, 4 <strong>states</strong> (Bihar, Madhya Pradesh, Punjab, Rajasthan & West Bengal) recordedpass out rate less than all <strong>states</strong> average. Top four <strong>states</strong> in pass out rate among SC students in2009-10 were Uttarakhand, Delhi, Uttar Pradesh and Himachal Pradesh.Table 6.8 Pass out rate among SC students at primary and upper primary stages for2008-09 & 2009-10Sr. No StatePrimary StageUpper Primary Stage2008-09 2009-10 2008-09 2009-101 Andhra Pradesh 95.9 94.8 99.4 97.32 Bihar 85.8 87.4 96.7 96.63 Delhi 99.0 98.6 94.2 99.14 Haryana 97.5 97.5 89.1 97.95 Himachal Pradesh 98.0 97.6 82.7 92.16 Jammu & Kashmir 97.0 96.9 82.8 85.37 Karnataka 94.4 94.7 98.4 97.78 Madhya Pradesh 88.4 93.8 96.6 96.19 Maharashtra 90.7 95.4 96.5 98.310 Orissa 92.4 95.0 81.9 89.611 Punjab 89.1 92.4 70.3 80.112 Rajasthan 82.9 91.6 79.2 89.513 Tamil Nadu 97.4 97.1 95.4 97.814 Uttar Pradesh 94.2 97.7 98.6 95.615 Uttarakhand 99.8 99.3 99.8 98.816 West Bengal 89.1 92.0 88.3 92.9All States 92.1 94.7 93.1 94.7Pass out rate at upper primary stage was found to be 93.1 % in 2008-09 and 94.7% in 2009-10.Table 6.8 clearly reveals that 7 out of 16 <strong>states</strong> had pass out rate less than all <strong>states</strong> average in2008-09. In 2009-10, only Haryana could cross the limit of all <strong>states</strong> average while all other<strong>states</strong> that were below average during 2008-09, were still below all <strong>states</strong> average. Top three<strong>states</strong> who had highest pass out rate among SC students of upper primary stage in 2009-10 areDelhi (99.1 %), Uttarakhand (98.8%) and Maharashtra (98.3 %).90
Sr. No StatePrimary Stage Upper Primary Stage2008-09 2009-10 2008-09 2009-109 Jammu & Kashmir 95.9 97.4 86.5 93.810 Jharkhand 85.5 93.3 89.9 94.911 Karnataka 96.6 98.0 99.2 98.312 Kerala 98.2 98.0 98.0 99.419 Uttar Pradesh 93.2 99.3 99.9 99.520 Uttarakhand 99.3 99.9 100.0 99.3<strong>21</strong> West Bengal 87.4 93.4 92.0 96.6All States 91.2 95.8 96.3 97.0Table 6.10 also presents data on pass out rate of Muslim students in upper primary stage. At all<strong>states</strong> level negligible improvement (0.7 percentage points) in pass out rate was observedbetween 2008-09 and 09-10. In 2009-10 Assam, Gujarat, Jammu & Kashmir, Jharkhand andWest Bengal recorded pass out rate less than all <strong>states</strong> average in upper primary stage.6.8 Promotion rates at primary stage (Grades 1 to 4/5)6.8.1 Grade wise promotion rates among SC studentsBihar, West Bengal and Rajasthan are three <strong>states</strong> who have not fared well in grade wisepromotion rate for SC students in primary grades. The data indicates that promotion rate ingrade 1 is close to 70% in Bihar and West Bengal and nearly 80% in Rajasthan.Andhra Pradesh, Haryana, Himachal Pradesh, Karnataka, Maharashtra, Tamil Nadu andUttarakhand are some of the <strong>states</strong> where promotion rate among SC students in primarygrades is more than 95% during 2009-10. Overall promotion rate of SC students at primarystage was 89% in 2008-09 which has gone up by 1.4 percentage points in the year 2009-10.(Refer table 6.7.1, Annexure-I)6.8.2 Grade wise promotion rates among ST studentsData from the <strong>states</strong> of Jharkhand and Madhya Pradesh indicates that only 69.8% students inJharkhand and 73.6% in Madhya Pradesh got promoted in grade 1 during 2008-09. Grade wisepromotion rates among ST students in primary grades vary from 80% to 87.6% in 2008-09 and85.4% to 92.5% in 2009-10. States like Jharkhand, Madhya Pradesh and Rajasthan observedpromotion rates lower than all <strong>states</strong> (85.1%). Nearly 4 percentage points improvementrecorded in overall promotion rate of ST students at primary stage from 2008-09 to 2009-10academic years. (Refer table 6.7.2, Annexure-I)6.8.3 Grade wise promotion rates among Muslim studentsWest Bengal presents a dismal story especially with regard to grade 1 where only 61.3% ofMuslim students have got promotion to the next grade. Similar is the case of Jharkhand where63.7% students got promoted to grade 2 in 2008-09, this figure has gone up to 79.3 % in 2009-92
10. The <strong>states</strong> which recorded >= 95% promotion rate among in the primary stage are GujaratKarnataka, Kerala, Uttar Pradesh and Uttarakhand in 2009-10 (Refer table 6.7.3, Annexure-I)Promotion rates at upper primary stage (Grades 5/6 to 7/8)6.8.4 Grade wise promotion rates among SC studentsOverall the <strong>states</strong> have done well in grade wise promotion rate for SC students in upperprimary grades. In 2008-09, there were 5 out of 16 <strong>states</strong> recorded more than 95% promotionrate and in 2009-10, 8 <strong>states</strong> recorded more than 95% promotion rate. Uttarakhand, Delhi andTamil Nadu and Uttar Pradesh recorded highest promotion rate during 2009-10 among all<strong>states</strong>. (Refer table 6.7.4 Annexure-I)6.8.5 Grade wise promotion rates among ST studentsOverall average promotion rate among ST students vary from 82.8% in Jharkhand to 98% inUttarakhand. In grade 8, it varies from 86.9% in Rajasthan to 100 % in Uttarakhand. Promotionrate increases with the increase in grades at upper primary stage in both the assessment years.Overall promotion rate increased from 87.7% in 2008-09 to 91.8% in 2009-10. (Refer table6.7.5, Annexure-I)6.8.6 Grade wise promotion rates among Muslim studentsGrade wise promotion rate for Muslim students in upper primary grades indicates that <strong>states</strong>like Kerala, Uttar Pradesh, Uttarakhand and Bihar have fared quite well as far as promotion rateis concerned. Overall picture of the <strong>states</strong> shows that promotion rates lie between 92.6 to98.2% from grade 6 to grade 8 during the recent reference year. Highest promotion rate amongMuslim students in upper primary grades was recorded in Uttarakhand and lowest was foundin Jharkhand. (Refer table 6.7.6, Annexure-I)6.9 Repetition ratesFigure 6.3: Repetition rates for 2009-10 amongst SC, ST and Muslims9634.13.35.14.33.53.30SC ST MuslimsPrimary Upper Primary93
6.9.1 Grade wise repetition rates among SC students at the primary stageThe overall (primary stage) repetition rate among SC students among all <strong>study</strong> <strong>states</strong> combinedtogether is found to be 6.3% in 2009-10. The <strong>states</strong> with overall repetition rates higher than theall combined <strong>states</strong> (6.3%) are Bihar, West Bengal, Madhya Pradesh, Punjab and Rajasthan. TheOverall (all <strong>states</strong> combined) grade wise repetition rates for SC students are varying fromlowest 2.6% (grade 5) to highest 11.7 % (grade 1) in 2009-10. It is observed that the highestnumber of SC children is repeating at grade 1 level. In the year 2008-09, similar percentage ofchildren in grade 1 repeated the grades. (Refer table 6.8.1, Annexure-I)6.9.2 Grade wise repetition rates among ST studentsThe repetition rate for all the <strong>states</strong> combined together is found to be 8.1% which has comedown from 11.7% from the previous year. The <strong>states</strong> with overall repetition rates higher thanthe combined <strong>states</strong> figure (8.1%) are Jharkhand (13.3%), Madhya Pradesh (11.4%), Gujarat(10.9%) and Rajasthan (9.7%). The grade wise repetition rates for ST students at All <strong>states</strong> levelare varying from lowest 5.6% (grade 4) to highest 12.6% (grade 1). It is observed that thehighest number of ST children is repeating at grade 1 level. In the year 2008-09, 17.9% of thechildren in grade 1 repeated the grades. (Refer table 6.8.2, Annexure-I)6.9.3 Grade wise repetition rates among Muslim studentsOverall (all <strong>states</strong> combined) repetition rate at the primary stage for Muslim students is foundto be 6.0% in 2009-10. Assam, Bihar, Jharkhand and West Bengal are the <strong>states</strong> where overallrepetition rates are higher than the combined <strong>states</strong> figure (6.0%).Overall (all <strong>states</strong> combined) the grade wise repetition rates for Muslim students are varyingfrom lowest 2.8% (grade 5) to highest 11.8% (grade 1). It is observed that the highest numberof Muslim children is repeating at grade 1 level. (Refer table 6.8.3, Annexure-I)Repetition rates at upper primary stage (Grades 5/6 to 7/8)6.9.4 Grade wise repetition rates among SC studentsThe overall (upper primary stage) repetition rate for SC students of all the <strong>states</strong> combinedtogether is found to be 6.0% which has reduced by 1.9 percentage points from the previousyear. The <strong>states</strong> with overall repetition rates higher than combined all <strong>states</strong> (6.0%) areRajasthan (17.6%), Punjab (16.6%), West Bengal (13.7%), Orissa (10.7%), Jammu & Kashmir(10.5%), Haryana (8.4%), Madhya Pradesh (8.3%) and Himachal Pradesh (8.1%). The grade wiserepetition rates for SC students of all <strong>study</strong> <strong>states</strong> are varying from lowest 3.6% (grade 8) tohighest 5.0% (grade 6). It is observed that the highest number of SC children is repeating atgrade 6 level. (Refer table 6.8.4, Annexure-I)6.9.5 Grade wise repetition rates among ST studentsAt the upper primary stage repetition rate for ST students for all the <strong>study</strong> <strong>states</strong> is found to be5.6% in 2009-10. The <strong>states</strong> with overall repetition rates higher than the combined figure of all<strong>study</strong> <strong>states</strong> (5.6%) are Jharkhand (8.4%), Madhya Pradesh (8.3%), Rajasthan (6.8%) and94
Gujarat (6.5%). The overall (all <strong>states</strong> combined) grade wise repetition rates for ST studentsvarying from lowest 3.8% (grade 8) to highest 7.3% (grade 6) during 2009-10. It is observed thatthe highest number of ST children is repeating at grade 6 level in both the assessment years.(Refer table 6.8.5, Annexure-I)6.9.6 Grade wise repetition rates among Muslim studentsRepetition rate among Muslims at the upper primary stage for all the <strong>states</strong> was 5.0% during2008-09 and in 2009-10, it has come down to 3.4%. The <strong>states</strong> with overall repetition rateshigher than the combined <strong>states</strong> figure (3.4%) are West Bengal (8.7%), Jharkhand (8.4%)Gujarat (6.1%) and Assam (5.2%). The grade wise repetition rates among Muslim students forall <strong>study</strong> <strong>states</strong> are varying from lowest 1.6% (grade 8) to highest 4.2% (grade 7). (Refer table6.8.6, Annexure-I)6.10 <strong>Dropout</strong> rates9Figure 6.4: <strong>Dropout</strong> rates for 2009-10 amongst SC, ST and Muslims633.31.82.6 2.72.61.80SC ST MuslimsPrimary Upper PrimaryGrade wise dropout rate among SC students at the primary stageThe overall dropout rate for SC students for all <strong>states</strong> at primary stage in 2009-10 is found to be3.3 % which was 3.1 % in 2008-2009. The <strong>states</strong> with a high dropout rate at the primary stageare Uttar Pradesh (6.3%), Punjab (4.0%) and Delhi (4.5%) in 2009-10. Punjab and Uttar Pradeshhave recorded a high dropout rate in both the <strong>study</strong> periods. Grade 5 has recorded the highestdropout amongst the SC in 2008-09 and 2009-10 at 9.3% and 11.7% respectively (Refer table6.9.1, Annexure-I).6.10.2 Grade wise dropout rates among ST students at the primary stageThe overall dropout rate of all <strong>states</strong> among ST students for primary stage in 2008-2009 was3.2% which declined to 2.6% in 2009-10. The <strong>states</strong> with overall dropout rates higher than theall <strong>states</strong> figure (2.6%) are Andhra Pradesh (3.0%), Madhya Pradesh (3.0%), Uttarakhand(3.1%), Rajasthan (3.4%), Chhattisgarh (3.7%) and Jharkhand (4.2%). The grade wise dropoutrates for primary ST students at all <strong>states</strong> level is varying from lowest 1.7% (grade 2) to highest6.8% (grade 5). It indicates that for primary stage ST students, highest dropout takes place atgrade 5 level. (Refer table 6.9.2, Annexure-I)95
6.10.3 Grade wise dropout rates among Muslim students at the primary stageThe overall dropout rate among Muslim students for primary stage in 2009-10 is found to be2.6 % which was 2.2% in 2008-09. Assam (3.5%), Bihar (3.6%), and Kerala (4.6%) are the top 3<strong>states</strong> where dropout rates are higher among Muslims at primary stage. The grade wisedropout rates for Muslim students for primary stage grades at all <strong>states</strong> level is varying fromlowest 1.1% (grade3) to highest 7.0% (grade 5) during 2009-10. It shows that most of theMuslim students dropout at grade 5.(Refer table 6.9.3, Annexure-I)<strong>Dropout</strong> rates at upper primary stage (Grades 5/6 to 7/8)6.10.4 Grade wise dropout rates among SC studentsThe overall dropout rate for SC students at All <strong>states</strong> level for upper primary stage in 2009-10 isfound to be 1.8% which was 2.1% in 2008-2009. The <strong>states</strong> with overall dropout rates higherthan the all <strong>states</strong> figure (1.8%) are Karnataka (7.1%), Andhra Pradesh (3.4%) and Orissa (5.3%).The grade-wise dropout rates of SC students at the All <strong>states</strong> level are varying from lowest 0.8%(grade 8) to highest 3.0% (grade 7). It implies that the maximum dropout takes place at grade 7level. (Refer table 6.9.4, Annexure-I)6.10.5 Grade wise dropout rates among ST studentsThe overall dropout rate among ST students at All <strong>states</strong> level for upper primary stage in 2009-10 is found to be 2.7% which is similar to the trend in the previous year. The <strong>states</strong> with overalldropout rates higher than the all <strong>states</strong> figure are Karnataka (8.6%), Orissa (6.1%) and Gujarat(3.3%). The grade wise dropout rates for upper primary ST students at all <strong>states</strong> level is varyingfrom lowest 1.3% (grade 6) to highest 4.7% (grade 7). It indicates that for ST students, highestdropout takes place at grade 7 level. (Refer table 6.9.5, Annexure-I)6.10.6 Grade wise dropout rates among Muslim studentsThe overall dropout rate among Muslim students for upper primary stage in 2009-10 is foundto be 1.8% which was 2.3% in 2008-2009. Top three <strong>states</strong> where dropout rate is highestamong Muslims at Upper primary stage are Karnataka (6.3%), Kerala (3.9%) and Assam (2.8%).The grade where maximum dropout takes place among Muslims at upper primary stage is 7 thgrade. (Refer table 6.9.6, Annexure-I)96
6.11 Cohort dropout ratesFigure 6.5: Cohort dropout rates for 2009-10 amongst SC, ST and Muslims252015105017.822.220.814.4 13.6SC ST MuslimsPrimary Elementary17.96.11.1 Cohort dropout rate for SC students at the primary stageAt primary stage (1-4/5), cohort dropout rate of all <strong>states</strong> among SC students was 16.7% in2008-09. In 2009-10, it had increased to 17.8%. Rajasthan recorded highest cohort dropout rateamong all <strong>states</strong> in 2008-09 while in 2009-10, highest cohort dropout rate was observed inUttar Pradesh (29.4%). (Refer table 6.10.1, Annexure-I)6.11.2 Cohort dropout rate for ST students at the primary stageCohort dropout rate at completing primary stage (1-4/5) among ST students was found to be17.7% in 2008-09 and 14.4% in 2009-10.The cohort dropout rate was highest in the state ofJharkhand (32.3%) during 2008-09 followed by Rajasthan (26.2%) and Andhra Pradesh (24.8%)among ST students. In 2009-10, Jharkhand (22.3%) recorded highest cohort dropout rate atprimary stage in all the <strong>states</strong> selected for ST data presentation. (Refer table 6.10.2, Annexure-I)6.11.3 Cohort dropout rate for Muslim students at the primary stageAll <strong>states</strong> cohort dropout rate estimated to be 12.2% in 2008-09 and 13.6% in 2009-10 amongMuslim students at completing primary stage. Estimated cohort dropout rate of Bihar (18.7%),Assam (15.0%) and Kerala (17.5%) is higher than all <strong>states</strong> figure for Muslim students in 2009-10 at primary stage. (Refer table 6.10.3, Annexure-I)Cohort dropout rates at the elementary stage6.11.4 Cohort dropout rate for SC studentsAt elementary stage (1 – 7/8), SC students cohort dropout rate was <strong>21</strong>.9% in 2008-09 and it hadincreased to 22.2% in 2009-10. States showing cohort dropout rate higher than all <strong>states</strong> figurein 2009-10 are Bihar (25.4%), Delhi (23.2%), Karnataka (22.9%), Punjab (24.4%) and UttarPradesh (31.8%). (Refer table 6.10.1, Annexure-I)6.11.5 Cohort dropout rate for ST studentsAt elementary stage (1 to 7/8), cohort dropout rate was found to be 24.6% in 2008-09 and20.8% in 2009-10 assessment years. Chhattisgarh (23.7%), Jharkhand (27.3%), Karnataka97
(23.1%), Madhya Pradesh (22.2%) and Rajasthan (22.0%) recorded greater than all <strong>states</strong>cohort dropout rate of ST students in 2009-10. (Refer table 6.10.2, Annexure-I)6.11.6 Cohort dropout rate for Muslim studentsIn elementary stage (1-7/8), a cohort dropout rate of all <strong>states</strong> was 17.9% in both theassessment years. Assam (23%), Bihar (<strong>21</strong>.1%), Karnataka (19%), Kerala (26.7%) and UttarPradesh (18%) are the <strong>states</strong> showing cohort dropout rates at completing elementary stage (1-7/8) among Muslims higher than all <strong>states</strong> figure. (Refer table 6.10.3, Annexure-I)6.12 Coefficient of internal efficiencyThe coefficient of internal efficiency of the system is the ratio of ideal number of pupil-yearsrequired to produce the same number of graduates to actual number of pupil-years spent toproduce graduates for a cohort. The more number of years taken for pass out the less is theinternal efficiency. Details of computational procedure are already given in chapter 5.6.12.1 Coefficient of internal efficiency (CIE) at primary and elementary stage for SCsCoefficient of internal efficiency for SCs in primary stage was found to be 79.7% in 2008-09 and79.5% in 2009-10. States observed low CIE than all <strong>states</strong> figure are Andhra Pradesh, Haryana,Himachal Pradesh, Jammu & Kashmir, Karnataka, Madhya Pradesh, Maharashtra, Orissa,Rajasthan, Tamil Nadu, and Uttarakhand in 2009-10. (Refer table 6.11.1 in Annexure-I)At all <strong>states</strong> level, coefficient of internal efficiency for 2008-09 in elementary stage was 80.0%and it had increased to 81.0% in 2009-10. The <strong>states</strong> with coefficient of internal efficiency inexcess of all <strong>states</strong> figure (81.0%) in 2009-10 are Andhra Pradesh, Delhi, Haryana, HimachalPradesh, Jammu & Kashmir, Madhya Pradesh, Maharashtra, Tamil Nadu, and Uttar Pradesh.(Refer table 6.11.1 in Annexure-I)6.12.2 Coefficient of internal efficiency (CIE) at primary and elementary stage for STsCIE at primary (1-4/5) and elementary stage (1-7/8) was found to be 76.1% and 75.1%respectively for ST students in 2008-09. In 2009-10, CIE for primary stage was 81.9%, while forelementary stage (1-7/8), it was 80.3% each. Jharkhand recorded lowest CIE at primary as wellas upper primary stages among STs. (Refer table 6.11.2 in Annexure-I)6.12.3 Coefficient of internal efficiency (CIE) at primary and elementary stage for MuslimsCIE was 83.2% for primary stage and 82.3% for elementary stage (1-7/8) in 2008-09.Corresponding figures for Muslims in 2009-10 was recorded as 83.8% and 84.5% for primarystage and elementary stage. At primary and elementary stages, highest CIE was recorded inUttarakhand (95.0% and 95.5% respectively) during 2009-10. (Refer table 6.11.3, Annexure-I)98
6.13 Average duration of <strong>study</strong> at primary and elementary stagesThe average duration of <strong>study</strong> has also been calculated separately for primary and elementarystages for both the assessment years i.e. 2008-09 and 2009-10.6.13.1 Average duration of <strong>study</strong> at primary and elementary stages for SCsThe average duration of <strong>study</strong> for SCs at primary stage in 2008-09 and 2009-10 for all <strong>states</strong>combined together was 5.4 years and 5.3 years respectively. Highest average duration of <strong>study</strong>was found to be 5.9 years in Bihar.In elementary stage (1-7/8), average duration of <strong>study</strong> in 2008-09 and 2009-10 among SCs was8.6 years and 8.4 years respectively. At elementary stage (1-7), Bihar and West Bengal recordedhighest average duration of <strong>study</strong> (9.1 years) among SCs during 2009-10. (Refer table 6.12.1,Annexure-I)6.13.2 Average duration of <strong>study</strong> at primary and elementary stages for STsIn those <strong>states</strong> where primary stage was from grade-1 to grade-4, average duration of <strong>study</strong> forSTs was varying between 4.0 years to 4.5 years in both the assessment years. In other <strong>states</strong>where primary stage was from grade-1 to grade-5, average duration of <strong>study</strong> for STs wasbetween 5.0 years to 5.9 years.In elementary stage (1-7/8), average duration of <strong>study</strong> for all <strong>states</strong> combined together was 8.9years in 2008-09 and 8.6 years in 2009-10. (Refer table 6.12.2, Annexure-I)6.13.3 Average duration of <strong>study</strong> at primary and elementary stages for MuslimsIn those <strong>states</strong> where primary stage was from grade-1 to grade-4, average duration of <strong>study</strong> forMuslims was varying between 4.0 years to 4.9 years in both the assessment years. In other<strong>states</strong> where primary stage was from grade-1 to grade-5, average duration of <strong>study</strong> for STs wasbetween 5.0 years to 6.2 years.In elementary stage (1-7/8), average duration of <strong>study</strong> for all <strong>states</strong> combined together was 8.6in 2008-09 and 8.4 in 2009-10. (Refer table 6.12.3, Annexure-I)99
Chapter 7Reasons for dropping out and their current activity7.1 Reasons for Dropping outThe students who dropped out of the school or whose status was not known were furtherasked about the reason for leaving the school. The top most reasons cited for dropping out ofthe school are:i. Lack of interest in studies,ii. Due to economic reasons,iii. family migrated to other place andiv. Help in domestic work to the parents.The following series of charts gives us the gender-wise reasons for dropping out of schools. Theresults were tabulated for primary and upper primary stages separately so as to enableourselves better equipped to develop age-specific action plans for eradicating dropout rates.Figure 7.1: Reasons for dropping out at primary stage in 2009-104030201026.9422.94 24.01 23.62<strong>21</strong>.3819.8<strong>21</strong>1.7412.355.64 4.575.885.075.72 5.340EconomicreasonsHelp in domesticworkLack of Interest instudiesFamily migratedto other placeteaching facilities-UnsatisfactoryinconvenientlocationChild's illnessBoys Girls in percent7.1.1 Reasons for dropping out at the Primary Stage:For boys in primary classes the main reasons for dropping out was the lack of interest instudies, and due to the poor economic reason of the family. The low interest of studiestranslates to either the lack of interest of parents of these boys to educate or poor results ofboys over the years and hence a lack of interest of boy himself. In the latter case, it is100
government duty to equip schools with innovative ways of education which would pull theseboys towards education.The reasons for dropping out of the school were almost similar for boys and girls. The majorreason for girls dropping out of the school is to help the parents in the domestic work or due toeconomic reasons. Close to 12 % of both boys and girls dropped out because of the familymigrating from one place to another in search of work and livelihood.Need to help family in domestic work was reported as the foremost reason by majority of thedrop outs across all the <strong>states</strong>. Poverty was yet another reason to drop out of the schools forboth boys and girls.37.04% boys and 33.30% girls in Bihar, 39.67% boys and 35.14% girls inOrissa dropped out because of lack of interest in studies. 31.95% boys and 24.84% girls inAndhra Pradesh dropped out because of parents migrating to other towns/city for livelihoodpurpose.Need for separate girls school and the right to <strong>study</strong> for girlsIn 2009-10, 2.99 % girls dropped out because of unavailability of separate girls’ school at the all<strong>states</strong> level, in Himachal Pradesh 8% and Uttarakhand 11.7% of the girls dropped out due tothis reason. 1.99 % dropped out because the parents thought that there was no need for thegirls to <strong>study</strong> and 9% of the girls in Rajasthan and 6.60% in Karnataka dropped out because ofthis reason.Reasons for dropping out at the upper primary stage:The boys in upper primary classes have majorly dropped out of the education system to work asa help in domestic work of the family. Poor economic condition of the family (24.25 %) and lackof interest in studies (23.12 %) is also a major factor for boys discontinuing studies beforecompleting the upper primary stage.The main reason for dropping out of the girls in upper primary classes is to work as a help indomestic work of the family and next is due to the poor economic condition of the parents. Ascompared to boys in primary classes, higher proportions of girls have reported helping family indomestic work as a reason for dropping out of the school at upper primary stage. This supportsthe ancient ideology of parents involving their girl children in domestic work rather thansending them for higher education.101
Figure 7.2: Reasons for dropping out at upper primary stage in 2009-1040302010029.7328.22Help in domesticwork24.25 22.65 23.12<strong>21</strong>.11Economic reasonsLack of Interest instudiesApart from this 4.25% girls dropped outbecause parents thought there was no needfor girls to <strong>study</strong> and 1.29% because of lackof separate girls school12.1710.42Family migratedto other place5.00 5.544.23 3.35 3.02inconvenientlocationteachingfacilities-Unsatisfactory1.67Child's illnessBoys Girls in percentTamil Nadu and Assam recorded a high percentage of students (both boys and girls) droppingout from the school due to economic reason of the family.7.2 Current Activity of <strong>Dropout</strong>s7.2.1 Current activity of the dropouts at the primary stageAfter dropping out from the school at or before primary stage, most of the boys (nearly onefifth) and girls (one third) are helping the parents/family in household work. It is dishearteningto see 23.<strong>21</strong> % of boys and close to 18% of girls dropping out at primary stage is sitting idle athome. It is also of concern to see that higher proportion of boys and girls reporting involved ineconomic activities after dropping out of school in 2009-10. This suggests that the childrenwere lured/ forced into these activities in poor economic conditions of the household. Theconcerned ministries shall be alerted so that each household is provided with enoughemployment in a year so that these child-labor cases are minimized. It is also suggested that theteachers in all schools should given additional responsibilities of bringing the dropped outchildren back to school who are sitting idle at home. These children’s parents can be easilyconvinced.102
Figure 7.3: Activities after <strong>Dropout</strong>s at Primary Stage in 2009-10504034.34302010<strong>21</strong>.80 23.<strong>21</strong> 22.7117.83 17.9616.08 13.98 13.53 13.032.672.850Helping Parents -household workIdleHelp parentsoccupationalworkWorking to earnmoneyNot knownIdle due to illnessBoys Girls in percentAfter dropping out from the school at the upper primary stage, most of the boys and girls (werehelping the parents/family in household work or in occupational work. Those dropping out at orbelow upper primary stage are rather working to help household with economic stability (byjoining the workforce). These girls and boys were mostly found involved in family’s occupationalwork or working somewhere else for money. The percentage of dropouts sitting idle at home atthe upper primary stage is less as compared to the primary stage.Figure 7.4: Activities after <strong>Dropout</strong>s at Upper Primary Stage in 2009-105040302010028.9236.<strong>21</strong>Helping Parents -household work26.91 25.86 25.1818.58Help parentsoccupationalworkWorking to earnmoney10.07 9.00 7.91 8.431.011.92Idle Not Known Idle due to illnessBoys Girls in percentThe gender divide is clearly observed with higher proportion of girls reporting helping familywith household when compared to the proportions among boys. Lower proportions of girlsreported working to earn money when compared to boys which is understandable with familiesbeing more concerned to send girl child to work at outside sources/ out of the village.103
Annexure – I: List of TablesChapter 2Table 2.1.1 Number of schools covered, schools replaced and schools could not be coveredSr.NoStateSchools covered inthe present surveySchoolsReplaced# Schools could not becovered1 Andhra Pradesh 208 15 32 Assam 190 10 03 Bihar <strong>21</strong>5 7 14 Chhattisgarh 193 24 35 Delhi 170 15 46 Gujarat 194 11 17 Haryana 193 2 18 Himachal Pradesh 195 6 09 Jammu & Kashmir 180 11 1510 Jharkhand 195 11 <strong>21</strong>1 Karnataka <strong>21</strong>0 4 012 Kerala 193 33 013 Madhya Pradesh 207 12 414 Maharashtra 202 3 115 Orissa 197 1 016 Punjab 193 8 017 Rajasthan 207 3 318 Tamil Nadu 193 8 019 Uttar Pradesh <strong>21</strong>8 16 520 Uttarakhand 191 11 3<strong>21</strong> West Bengal <strong>21</strong>0 6 0Total 4,154 <strong>21</strong>7 46104
Table 2.1.2: Number of school covered by area and school categorySr. noStateSchools with onlyprimary gradesUpper primaryschools withprimary gradesSchools with upper primary gradesUpper primaryschools withoutprimary gradesUpper primaryschools withsecondary gradesT R U T R U T R U T R U1 Andhra Pradesh 138 125 13 33 27 6 1 1 0 36 22 142 Assam 144 137 7 2 2 0 39 38 1 5 2 33 Bihar 130 1<strong>21</strong> 9 82 72 10 2 2 0 1 1 04 Chhattisgarh 134 127 7 16 11 5 43 37 6 0 0 05 Delhi 90 8 82 35 2 33 22 0 22 23 4 196 Gujarat 25 18 7 164 134 30 3 2 1 2 2 07 Haryana 100 85 15 13 10 3 18 15 3 62 47 158 Himachal Pradesh 134 128 6 15 12 3 27 26 1 19 17 29 Jammu & Kashmir 88 80 8 61 53 8 0 0 0 31 22 910 Jharkhand 122 107 15 72 61 11 0 0 0 1 0 111 Karnataka 83 74 9 122 93 29 0 0 0 5 3 <strong>21</strong>2 Kerala 88 67 <strong>21</strong> 76 60 16 29 <strong>21</strong> 8 0 0 013 Madhya Pradesh 116 104 12 31 16 15 56 44 12 4 1 314 Maharashtra 100 88 12 67 60 7 11 1 10 24 15 915 Orissa 137 129 8 43 37 6 15 15 0 2 1 116 Punjab 126 112 14 8 5 3 42 39 3 17 11 617 Rajasthan 85 79 6 74 60 14 1 1 0 47 30 1718 Tamil Nadu 119 92 27 42 32 10 17 11 6 15 5 1019 Uttar Pradesh 155 133 22 14 9 5 34 27 7 15 8 720 Uttarakhand 124 113 11 28 <strong>21</strong> 7 15 12 3 24 20 4<strong>21</strong> West Bengal 163 132 31 10 8 2 17 9 8 20 18 2All States 2,401 2,059 342 1,008 785 223 392 301 91 353 229 124T=Total, R= Rural and U= Urban105
Primary onlyPrimary andupperprimaryOnly upperprimaryTotalPrimary onlyPrimary andupperprimaryOnly upperprimaryTotalPrimary onlyPrimary andupperprimaryOnly upperprimaryTotalTable 2.1.3 Primary and upper primary school by type of managementType of management of schoolsGovernment & Local Body Private Aided Private UnaidedSl. State1 Andhra Pradesh 130 30 25 185 6 4 5 15 2 6 0 82 Assam 142 3 37 182 2 0 5 7 0 0 1 13 Bihar 130 79 3 <strong>21</strong>2 0 2 0 2 0 1 0 14 Chhattisgarh 132 11 42 185 1 3 1 5 1 2 0 35 Delhi 81 18 31 130 4 10 1 15 5 19 1 256 Gujarat 22 153 1 176 3 6 4 13 0 5 0 57 Haryana 96 20 53 169 0 1 0 1 4 17 2 238 Himachal Pradesh 132 8 39 179 0 6 0 6 2 8 0 109 Jammu & Kashmir 83 65 3 151 1 7 0 8 4 17 0 <strong>21</strong>10 Jharkhand 1<strong>21</strong> 72 1 194 1 0 0 1 0 0 0 011 Karnataka 78 95 1 174 2 18 0 20 3 13 0 1612 Kerala 54 47 11 112 34 29 17 80 0 0 1 113 Madhya Pradesh 109 11 53 173 5 9 2 16 2 13 3 1814 Maharashtra 93 65 16 174 5 6 12 23 2 1 2 515 Orissa 136 43 15 194 1 0 2 3 0 0 0 016 Punjab 123 8 53 184 1 2 1 4 2 1 2 517 Rajasthan 75 64 15 154 1 4 0 5 9 38 1 4818 Tamil Nadu 91 37 17 145 23 10 4 37 5 2 4 1119 Uttar Pradesh 143 9 34 186 6 6 5 17 6 5 4 1520 Uttarakhand 115 17 31 163 3 4 3 10 6 11 1 18<strong>21</strong> West Bengal 161 12 34 207 0 0 0 0 2 0 1 3All <strong>states</strong> 2,247 867 515 3,629 99 127 62 288 55 159 23 237106
Table 2.2.1: Grade wise enrolments in the sampled primary schools by gender across <strong>study</strong> <strong>states</strong> as on 30th Sep 2009Sr.NoState2008-09Grade 1 Grade 2 Grade 3 Grade 4 Grade 5 Primary StageB G T B G T B G T B G T B G T B G T1AndhraPradesh1,374 1,299 2,673 1,419 1,334 2,753 1,458 1,339 2,797 1,319 1,407 2,726 1,314 1,323 2,637 6,884 6,702 13,5862 Assam 1,588 1,500 3,088 1,441 1,359 2,800 1,355 1,207 2,562 1,266 1,294 2,560 - - - 5,650 5,360 11,0103 Bihar 5,888 5,719 11,607 5,319 5,296 10,615 4,833 4,711 9,544 4,354 3,923 8,277 4,057 3,233 7,290 24,451 22,882 47,3334 Chhattisgarh 1,652 1,588 3,240 1,515 1,318 2,833 1,617 1,374 2,991 1,519 1,284 2,803 1,247 1,151 2,398 7,550 6,715 14,2655 Delhi 4,681 6,453 11,134 4,910 6,504 11,414 4,759 6,159 10,918 4,753 6,053 10,806 4,560 6,014 10,574 23,663 31,183 54,8466 Gujarat 3,317 2,820 6,137 3,242 2,759 6,001 3,378 2,782 6,160 3,147 2,918 6,065 - - - 13,084 11,279 24,3637 Haryana 1,942 1,673 3,615 1,772 1,617 3,389 1,7<strong>21</strong> 1,558 3,279 1,702 1,440 3,142 1,751 1,452 3,203 8,888 7,740 16,6288HimachalPradesh783 740 1,523 7<strong>21</strong> 789 1,510 861 722 1,583 922 775 1,697 957 850 1,807 4,244 3,876 8,1209Jammu &Kashmir979 864 1,843 903 731 1,634 876 696 1,572 964 691 1,655 1,036 783 1,819 4,758 3,765 8,52310 Jharkhand 3,134 3,010 6,144 2,776 2,875 5,651 2,751 2,943 5,694 2,574 2,759 5,333 2,436 2,487 4,923 13,671 14,074 27,74511 Karnataka 2,438 2,178 4,616 2,531 2,284 4,815 2,578 2,245 4,823 2,538 2,305 4,843 2,417 2,180 4,597 12,502 11,192 23,69412 Kerala 1,906 1,822 3,728 2,169 1,890 4,059 2,327 2,005 4,332 2,379 2,135 4,514 - - - 8,781 7,852 16,63313MadhyaPradesh1,919 1,873 3,792 1,744 1,755 3,499 1,709 1,761 3,470 1,699 1,766 3,465 1,612 1,537 3,149 8,683 8,692 17,37514 Maharashtra 2,532 1,979 4,511 2,367 1,9<strong>21</strong> 4,288 2,417 2,024 4,441 2,223 1,906 4,129 - - - 9,539 7,830 17,36915 Orissa 2,072 1,918 3,990 1,844 1,683 3,527 1,815 1,661 3,476 1,720 1,725 3,445 1,807 1,616 3,423 9,258 8,603 17,86116 Punjab 1,438 1,360 2,798 1,425 1,129 2,554 1,467 1,149 2,616 1,451 1,171 2,622 1,251 1,174 2,425 7,032 5,983 13,01517 Rajasthan 2,826 2,364 5,190 2,292 1,913 4,205 2,182 1,771 3,953 1,971 1,666 3,637 1,822 1,507 3,329 11,093 9,2<strong>21</strong> 20,31418 Tamil Nadu 1,634 1,686 3,320 1,573 1,565 3,138 1,787 1,7<strong>21</strong> 3,508 1,896 1,850 3,746 1,999 1,798 3,797 8,889 8,620 17,50919 Uttar Pradesh 2,864 2,609 5,473 2,942 2,899 5,841 2,939 2,971 5,910 2,519 2,685 5,204 2,509 2,502 5,011 13,773 13,666 27,43920 Uttarakhand 1,494 1,282 2,776 1,332 1,253 2,585 1,431 1,315 2,746 1,430 1,257 2,687 1,291 1,117 2,408 6,978 6,224 13,202<strong>21</strong> West Bengal 4,085 3,607 7,692 3,096 2,875 5,971 2,979 2,749 5,728 2,924 2,608 5,532 - - - 13,084 11,839 24,923All States 50,546 48,344 98,890 47,333 45,749 93,082 47,240 44,863 92,103 45,270 43,618 88,888 43,334 42,649 85,983 2,33,723 2,25,223 4,58,946107
Table 2.2.2: Grade wise enrolments in the sampled primary schools by gender across <strong>study</strong> <strong>states</strong> as on 30th Sep 2010Sr.NoState2009-10Grade 1 Grade 2 Grade 3 Grade 4 Grade 5 Total primary stageB G T B G T B G T B G T B G T B G T1 Andhra Pradesh 1,378 1,253 2,631 1,307 1,297 2,604 1,371 1,293 2,664 1,384 1,324 2,708 1,270 1,403 2,673 6,710 6,570 13,2802 Assam 1,598 1,436 3,034 1,334 1,351 2,685 1,340 1,<strong>21</strong>8 2,558 1,241 1,209 2,450 - - - 5,513 5,<strong>21</strong>4 10,7273 Bihar 5,474 5,442 10,916 5,201 5,039 10,240 4,964 4,842 9,806 4,483 4,199 8,682 4,181 3,619 7,800 24,303 23,141 47,4444 Chhattisgarh 1,557 1,419 2,976 1,419 1,325 2,744 1,476 1,273 2,749 1,550 1,296 2,846 1,444 1,265 2,709 7,446 6,578 14,0245 Delhi 4,499 6,233 10,732 4,818 6,495 11,313 4,719 6,425 11,144 4,744 5,946 10,690 4,689 5,923 10,612 23,469 31,022 54,4916 Gujarat 3,<strong>21</strong>6 2,798 6,014 3,086 2,688 5,774 3,2<strong>21</strong> 2,745 5,966 3,234 2,678 5,912 - - - 12,757 10,909 23,6667 Haryana 1,791 1,611 3,402 1,841 1,636 3,477 1,744 1,653 3,397 1,807 1,548 3,355 1,641 1,515 3,156 8,824 7,963 16,787Himachal8 Pradesh769 748 1,517 750 747 1,497 720 777 1,497 866 725 1,591 909 771 1,680 4,014 3,768 7,782Jammu &9 Kashmir1,0<strong>21</strong> 833 1,854 943 763 1,706 892 727 1,619 849 724 1,573 908 679 1,587 4,613 3,726 8,33910 Jharkhand 2,614 2,623 5,237 2,391 2,539 4,930 2,405 2,540 4,945 2,293 2,524 4,817 2,222 2,330 4,552 11,925 12,556 24,48111 Karnataka 2,186 2,135 4,3<strong>21</strong> 2,389 2,126 4,515 2,461 2,333 4,794 2,499 2,249 4,748 2,573 2,330 4,903 12,108 11,173 23,28112 Kerala 2,0<strong>21</strong> 1,722 3,743 1,988 1,816 3,804 2,202 1,964 4,166 2,323 2,007 4,330 - - - 8,534 7,509 16,04313 Madhya Pradesh 1,772 1,733 3,505 1,644 1,694 3,338 1,658 1,679 3,337 1,574 1,642 3,<strong>21</strong>6 1,546 1,574 3,120 8,194 8,322 16,51614 Maharashtra 2,278 1,984 4,262 2,346 1,866 4,<strong>21</strong>2 2,314 1,862 4,176 2,367 2,004 4,371 - - - 9,305 7,716 17,0<strong>21</strong>15 Orissa 1,910 1,882 3,792 1,787 1,680 3,467 1,793 1,589 3,382 1,723 1,642 3,365 1,726 1,650 3,376 8,939 8,443 17,38<strong>21</strong>6 Punjab 1,408 1,200 2,608 1,407 1,229 2,636 1,337 1,085 2,422 1,389 1,115 2,504 1,413 1,166 2,579 6,954 5,795 12,74917 Rajasthan 2,637 2,233 4,870 2,391 2,068 4,459 2,155 1,781 3,936 1,932 1,605 3,537 1,884 1,565 3,449 10,999 9,252 20,25118 Tamil Nadu 1,606 1,527 3,133 1,573 1,519 3,092 1,642 1,618 3,260 1,797 1,735 3,532 1,910 1,847 3,757 8,528 8,246 16,77419 Uttar Pradesh 2,630 2,696 5,326 2,681 2,498 5,179 2,784 2,757 5,541 2,629 2,755 5,384 2,390 2,498 4,888 13,114 13,204 26,31820 Uttarakhand 1,430 1,<strong>21</strong>7 2,647 1,436 1,295 2,731 1,322 1,<strong>21</strong>3 2,535 1,344 1,274 2,618 1,370 1,<strong>21</strong>6 2,586 6,902 6,<strong>21</strong>5 13,117<strong>21</strong> West Bengal 3,850 3,398 7,248 3,089 2,741 5,830 2,857 2,632 5,489 2,894 2,742 5,636 - - - 12,690 11,513 24,203All States 47,645 46,123 93,768 45,8<strong>21</strong> 44,412 90,233 45,377 44,006 89,383 44,922 42,943 87,865 43,440 43,343 86,783 2,27,205 2,20,827 4,48,03<strong>21</strong>08
Table 2.2.3: Grade wise enrolments in the sampled upper primary schools by gender across <strong>study</strong> <strong>states</strong> as on 30th Sep 2009Sr.NoState2008-09Grade 5 Grade 6 Grade 7 Grade 8 Total upper primary stageB G T B G T B G T B G T B G T1 Andhra Pradesh - - - 1,134 1,240 2,374 1,277 1,364 2,641 - - - 2,411 2,604 5,0152 Assam 1,<strong>21</strong>5 1,033 2,248 1,148 987 2,135 1,057 938 1,995 - - - 3,420 2,958 6,3783 Bihar - - - 3,133 2,426 5,559 2,805 2,282 5,087 2,580 1,743 4,323 8,518 6,451 14,9694 Chhattisgarh - - - 1,182 1,156 2,338 906 1,080 1,986 1,061 943 2,004 3,149 3,179 6,3285 Delhi - - - 6,312 5,569 11,881 6,3<strong>21</strong> 5,<strong>21</strong>5 11,536 5,734 4,152 9,886 18,367 14,936 33,3036 Gujarat 2,859 2,546 5,405 2,918 2,573 5,491 2,728 2,448 5,176 - - - 8,505 7,567 16,0727 Haryana - - - 2,022 1,896 3,918 1,939 1,858 3,797 1,982 1,746 3,728 5,943 5,500 11,4438 Himachal Pradesh - - - 829 697 1,526 830 697 1,527 842 763 1,605 2,501 2,157 4,6589 Jammu & Kashmir - - - 1,157 885 2,042 1,018 734 1,752 1,007 771 1,778 3,182 2,390 5,57<strong>21</strong>0 Jharkhand - - - 1,778 1,866 3,644 1,514 1,447 2,961 1,089 1,233 2,322 4,381 4,546 8,92711 Karnataka - - - 2,184 1,969 4,153 2,231 1,967 4,198 - - - 4,415 3,936 8,35112 Kerala 2,174 1,997 4,171 2,202 2,097 4,299 2,361 2,092 4,453 - - - 6,737 6,186 12,92313 Madhya Pradesh - - - 1,809 1,914 3,723 1,382 1,599 2,981 1,205 1,223 2,428 4,396 4,736 9,13<strong>21</strong>4 Maharashtra 2,145 1,756 3,901 2,144 1,987 4,131 2,071 1,850 3,9<strong>21</strong> - - - 6,360 5,593 11,95315 Orissa - - - 1,328 1,304 2,632 1,330 1,313 2,643 - - - 2,658 2,617 5,27516 Punjab - - - 1,277 1,102 2,379 1,198 1,124 2,322 1,331 1,228 2,559 3,806 3,454 7,26017 Rajasthan - - - 2,003 1,376 3,379 1,906 1,325 3,231 2,089 1,326 3,415 5,998 4,027 10,02518 Tamil Nadu - - - 1,726 1,895 3,6<strong>21</strong> 1,910 2,029 3,939 1,929 2,013 3,942 5,565 5,937 11,50<strong>21</strong>9 Uttar Pradesh - - - 1,322 1,443 2,765 1,390 1,547 2,937 1,304 1,528 2,832 4,016 4,518 8,53420 Uttarakhand - - - 998 870 1,868 910 845 1,755 896 813 1,709 2,804 2,528 5,332<strong>21</strong> West Bengal 2,875 4,593 7,468 2,374 4,149 6,523 2,073 3,419 5,492 1,774 3,020 4,794 9,096 15,181 24,277All States - - - 40,980 39,401 80,381 39,157 37,173 76,330 24,823 22,502 47,325 1,04,960 99,076 2,04,036109
Table 2.2.4: Grade wise enrolments in the sampled upper primary schools by gender across <strong>study</strong> <strong>states</strong> as on 30th Sep 2010Sr.NoState2009-10Grade 5 Grade 6 Grade 7 Grade 8 Total upper primary stageB G T B G T B G T B G T B G T1 Andhra Pradesh - - - 1,068 1,329 2,397 1,193 1,279 2,472 - - - 2,261 2,608 4,8692 Assam 1,179 1,029 2,208 1,125 961 2,086 1,031 977 2,008 - - - 3,335 2,967 6,3023 Bihar - - - 3,243 2,665 5,908 2,943 2,287 5,230 2,723 1,980 4,703 8,909 6,932 15,8414 Chhattisgarh - - - 1,117 969 2,086 1,067 1,101 2,168 906 1,079 1,985 3,090 3,149 6,2395 Delhi - - - 6,140 5,536 11,676 5,860 5,119 10,979 6,301 4,560 10,861 18,301 15,<strong>21</strong>5 33,5166 Gujarat 2,866 2,610 5,476 2,839 2,491 5,330 2,764 2,431 5,195 - - - 8,469 7,532 16,0017 Haryana - - - 1,874 1,934 3,808 2,092 1,951 4,043 2,040 1,929 3,969 6,006 5,814 11,8208 Himachal Pradesh - - - 836 711 1,547 803 666 1,469 915 784 1,699 2,554 2,161 4,7159 Jammu & Kashmir - - - 1,135 874 2,009 1,092 825 1,917 1,031 722 1,753 3,258 2,4<strong>21</strong> 5,67910 Jharkhand - - - 1,790 2,000 3,790 1,542 1,744 3,286 1,077 1,237 2,314 4,409 4,981 9,39011 Karnataka - - - 2,184 2,008 4,192 2,<strong>21</strong>7 1,983 4,200 - - - 4,401 3,991 8,39<strong>21</strong>2 Kerala 2,146 1,994 4,140 2,111 1,913 4,024 2,208 2,059 4,267 - - - 6,465 5,966 12,43113 Madhya Pradesh - - - 1,668 1,955 3,623 1,558 1,641 3,199 1,347 1,553 2,900 4,573 5,149 9,72<strong>21</strong>4 Maharashtra 2,230 1,779 4,009 1,991 1,764 3,755 2,050 1,896 3,946 - - - 6,271 5,439 11,71015 Orissa - - - 1,347 1,231 2,578 1,357 1,430 2,787 - - - 2,704 2,661 5,36516 Punjab - - - 1,265 1,008 2,273 1,223 1,090 2,313 1,319 1,206 2,525 3,807 3,304 7,11117 Rajasthan - - - 1,881 1,422 3,303 1,939 1,271 3,<strong>21</strong>0 1,994 1,340 3,334 5,814 4,033 9,84718 Tamil Nadu - - - 1,651 1,698 3,349 1,613 1,850 3,463 1,846 1,974 3,820 5,110 5,522 10,63<strong>21</strong>9 Uttar Pradesh - - - 1,279 1,388 2,667 1,291 1,472 2,763 1,380 1,540 2,920 3,950 4,400 8,35020 Uttarakhand - - - 935 759 1,694 947 776 1,723 931 890 1,8<strong>21</strong> 2,813 2,425 5,238<strong>21</strong> West Bengal 2,943 4,580 7,523 2,339 3,941 6,280 2,220 3,704 5,924 1,841 3,024 4,865 9,343 15,249 24,592All States - - - 39,818 38,557 78,375 39,010 37,552 76,562 25,651 23,818 49,469 1,04,479 99,927 2,04,406110
Table 2.3.1: Grade wise attendance rates on the day of visit in schools for primary schools by gender across <strong>study</strong> <strong>states</strong>Sr.NoStateGradesGrade 1 Grade 2 Grade 3 Grade 4 Grade 5 Average primary stageB G T B G T B G T B G T B G T B G T1 Andhra Pradesh 78.6 80.5 79.6 80.5 81.1 80.8 81.6 81.6 81.6 85.3 87.7 86.5 84.8 84.8 84.8 82.1 82.9 82.52 Assam 67.1 67.5 67.3 66.3 68.1 67.2 64.4 70.4 67.4 71.1 78.0 74.8 - - - 67.3 71.4 69.43 Bihar 62.1 62.3 62.2 60.0 62.2 61.1 59.2 59.1 59.1 56.9 59.6 58.2 59.0 60.4 59.7 59.5 60.7 60.14 Chhattisgarh 60.9 61.8 61.4 65.2 64.6 64.9 63.9 65.0 64.5 69.9 69.5 69.7 73.5 73.0 73.3 66.7 66.8 66.75 Delhi 80.7 79.6 80.0 83.1 79.6 80.9 82.9 80.2 81.2 85.0 81.6 82.8 85.4 82.6 83.6 83.4 80.8 81.86 Gujarat 84.8 84.2 84.5 89.1 87.0 88.1 87.5 88.7 88.1 88.6 88.0 88.3 - - - 87.5 86.9 87.27 Haryana 83.0 83.4 83.2 82.4 82.9 82.7 85.3 84.9 85.1 88.6 86.0 87.3 88.8 87.5 88.1 85.6 85.0 85.38 Himachal Pradesh 87.8 87.5 87.7 86.5 89.8 88.2 91.9 87.2 89.5 87.1 86.6 86.9 91.2 87.5 89.4 89.0 87.7 88.39 Jammu & Kashmir 77.0 82.2 79.3 87.8 83.7 85.9 84.3 84.4 84.4 89.0 90.2 89.6 85.8 83.4 84.7 84.3 84.6 84.410 Jharkhand 57.4 57.6 57.5 58.8 57.5 58.1 55.8 59.4 57.7 57.5 59.5 58.6 56.1 61.1 58.8 57.1 59.1 58.111 Karnataka 87.1 87.5 87.3 88.4 86.8 87.6 89.1 89.0 89.1 62.1 87.8 72.6 86.4 86.2 86.3 81.1 87.4 84.012 Kerala 94.0 91.8 93.0 95.3 95.2 95.3 96.3 93.1 94.7 95.7 96.6 96.2 - - - 95.4 94.2 94.813 Madhya Pradesh 60.9 59.2 60.0 64.5 62.6 63.5 60.5 62.2 61.4 61.7 65.3 63.5 64.0 66.2 65.1 62.3 63.1 62.714 Maharashtra 91.2 92.8 92.0 91.8 93.3 92.5 87.8 89.8 88.7 92.9 93.0 92.9 - - - 91.0 92.1 91.515 Orissa 67.3 73.3 70.3 71.3 73.1 72.2 76.3 73.9 75.1 74.7 74.8 74.8 76.5 77.9 77.2 73.0 74.5 73.816 Punjab 79.0 80.3 79.6 81.3 83.6 82.3 83.5 88.4 85.9 84.1 85.8 84.9 83.0 84.4 83.7 82.2 84.6 83.317 Rajasthan 74.3 71.9 73.2 72.5 71.4 72.0 73.8 71.6 72.7 76.8 75.0 75.9 77.1 75.2 76.2 74.7 72.8 73.818 Tamil Nadu 87.7 89.8 88.7 87.6 89.9 88.8 89.7 89.4 89.5 89.6 90.2 89.9 91.3 91.5 91.4 89.3 90.2 89.719 Uttar Pradesh 68.4 67.4 67.9 63.7 65.7 64.7 65.0 66.8 65.9 65.7 64.3 65.0 63.7 64.9 64.3 65.4 65.9 65.620 Uttarakhand 76.3 69.7 73.1 79.0 74.2 76.7 75.3 76.2 75.8 76.6 75.9 76.2 68.2 74.9 71.4 75.0 74.2 74.6<strong>21</strong> West Bengal 61.1 61.2 61.1 61.6 66.0 63.7 64.1 69.5 66.7 63.0 66.1 64.5 - - - 62.3 65.4 63.8All States 73.9 73.9 73.9 75.2 75.2 75.2 75.3 75.7 75.5 74.8 77.0 75.9 77.3 76.5 76.9 75.3 75.6 75.5111
Table 2.3.2: Grade wise attendance rates on the day of visit in schools for upper primary school by gender across <strong>study</strong> <strong>states</strong>Sr.NoStateGradesGrade 5 Grade 6 Grade 7 Grade 8 Average Upper Primary StageB G T B G T B G T B G T B G T1 Andhra Pradesh - - - 86.1 85.0 85.5 83.6 86.6 85.2 - - - 84.9 85.8 85.42 Assam 68.0 72.7 70.3 66.3 68.7 67.4 63.4 66.9 65.1 - - - 66.1 69.8 67.93 Bihar - - - 50.7 53.2 51.9 50.5 57.0 53.6 57.0 54.7 56.0 52.8 54.9 53.74 Chhattisgarh - - - 74.4 80.7 77.6 69.9 78.8 74.4 72.4 78.6 75.5 72.3 79.4 75.95 Delhi - - - 85.1 81.4 83.7 80.5 80.2 80.4 82.6 75.9 80.0 82.7 79.3 81.46 Gujarat 90.4 88.4 89.4 90.3 89.5 89.9 89.8 87.9 88.9 - - - 90.2 88.6 89.47 Haryana - - - 84.3 89.3 86.6 88.4 90.1 89.2 75.1 79.9 77.4 82.2 86.1 84.18 Himachal Pradesh - - - 88.1 88.4 88.2 89.7 86.5 88.2 76.1 80.9 78.4 84.2 84.9 84.59 Jammu & Kashmir - - - 85.7 82.1 84.2 85.9 83.2 84.7 64.7 63.9 64.3 77.4 75.0 76.310 Jharkhand - - - 51.7 57.4 54.9 48.0 56.7 52.6 50.9 49.8 50.3 50.2 54.9 52.811 Karnataka - - - 86.0 86.8 86.4 88.1 90.0 89.0 - - - 87.1 88.4 87.712 Kerala 93.9 95.8 94.9 70.3 91.3 79.2 89.1 95.2 91.5 - - - 83.6 94.1 88.113 Madhya Pradesh - - - 64.9 64.6 64.8 64.7 61.6 63.0 61.3 67.9 64.5 63.7 64.6 64.114 Maharashtra 92.4 91.3 91.9 92.7 92.2 92.4 91.9 91.8 91.8 - - - 92.3 91.8 92.115 Orissa - - - 73.7 76.1 74.9 72.8 73.2 73.0 - - - 73.3 74.6 73.916 Punjab - - - 82.7 85.7 84.0 83.6 86.0 84.7 86.1 89.1 87.4 84.1 86.9 85.317 Rajasthan - - - 76.5 74.7 75.7 79.3 73.4 76.6 79.9 74.5 77.5 78.5 74.2 76.618 Tamil Nadu - - - 91.0 91.8 91.4 90.1 92.5 91.3 88.0 91.5 89.8 89.7 91.9 90.919 Uttar Pradesh - - - 72.4 68.2 70.2 69.5 67.4 68.4 65.1 67.9 66.6 68.9 67.8 68.320 Uttarakhand - - - 74.3 80.3 77.2 70.5 78.3 74.1 68.2 76.7 72.4 71.0 78.4 74.5<strong>21</strong> West Bengal 61.0 52.4 55.7 54.6 55.1 54.9 56.1 52.7 53.8 53.8 54.3 54.2 56.8 53.6 54.7All States - - - 76.2 77.1 76.6 77.6 77.5 77.6 72.9 72.6 72.8 76.1 75.9 76.0112
Table 2.4.1 Grade wise number of school leavers of primary stage whose houses were visited- 2008-09Sr.NoStateGrade 1 Grade 2 Grade 3 Grade 4 Grade 5 Total primary stageBoys Girls Total Boys Girls Total Boys Girls Total Boys Girls Total Boys Girls Total Boys Girls Total1 Andhra Pradesh 187 154 341 171 143 314 151 130 281 152 146 298 56 36 92 717 609 1,3262 Assam 73 64 137 62 59 1<strong>21</strong> 71 34 105 22 19 41 - - - 228 176 4043 Bihar 481 460 941 484 480 964 457 404 861 382 290 672 240 166 406 2,044 1,800 3,8444 Chhattisgarh 137 128 265 97 89 186 132 64 196 98 66 164 41 39 80 505 386 8915 Delhi 103 113 <strong>21</strong>6 104 116 220 90 68 158 81 75 156 69 83 152 447 455 9026 Gujarat 235 158 393 209 142 351 194 142 336 174 158 332 - - - 812 600 1,4127 Haryana 105 58 163 145 77 222 136 101 237 92 50 142 52 47 99 530 333 8638 Himachal Pradesh 51 43 94 39 42 81 49 33 82 45 27 72 20 18 38 204 163 3679 Jammu & Kashmir 107 93 200 56 35 91 55 31 86 81 52 133 43 32 75 342 243 58510 Jharkhand 436 379 815 396 319 715 361 348 709 338 325 663 208 126 334 1,739 1,497 3,23611 Karnataka 149 118 267 140 130 270 136 98 234 132 116 248 135 83 <strong>21</strong>8 692 545 1,23712 Kerala 56 36 92 58 35 93 54 34 88 45 31 76 - - - <strong>21</strong>3 136 34913 Madhya Pradesh 169 148 317 156 129 285 140 119 259 144 104 248 78 60 138 687 560 1,24714 Maharashtra 172 114 286 147 118 265 158 89 247 167 126 293 - - - 644 447 1,09115 Orissa 130 82 <strong>21</strong>2 78 64 142 80 71 151 64 66 130 76 62 138 428 345 77316 Punjab 145 114 259 150 97 247 146 111 257 132 86 <strong>21</strong>8 75 61 136 648 469 1,11717 Rajasthan 5<strong>21</strong> 324 845 356 267 623 361 249 610 267 202 469 227 161 388 1,732 1,203 2,93518 Tamil Nadu 101 90 191 78 50 128 80 64 144 60 41 101 57 48 105 376 293 66919 Uttar Pradesh 287 232 519 262 <strong>21</strong>6 478 309 265 574 231 220 451 80 70 150 1,169 1,003 2,17220 Uttarakhand 80 54 134 73 41 114 72 33 105 63 37 100 28 4 32 316 169 485<strong>21</strong> West Bengal 157 123 280 103 99 202 88 90 178 78 67 145 - - - 426 379 805All States 3,882 3,085 6,967 3,364 2,748 6,112 3,320 2,578 5,898 2,848 2,304 5,152 2,012 1,486 3,498 15,426 12,201 27,627113
Table 2.4.2 Grade wise number of school leavers of primary stage whose houses were visited - 2009-10Sr.NoStateGrade 1 Grade 2 Grade 3 Grade 4 Grade 5 Total primary stageBoys Girls Total Boys Girls Total Boys Girls Total Boys Girls Total Boys Girls Total Boys Girls Total1 Andhra Pradesh 162 136 298 120 143 263 106 112 <strong>21</strong>8 120 100 220 64 63 127 572 554 1,1262 Assam 90 55 145 57 35 92 34 22 56 19 17 36 - - - 200 129 3293 Bihar 404 357 761 389 354 743 436 337 773 319 277 596 249 180 429 1,797 1,505 3,3024 Chhattisgarh 95 92 187 107 65 172 101 70 171 77 67 144 18 13 31 398 307 7055 Delhi 70 137 207 86 102 188 70 122 192 63 81 144 63 81 144 352 523 8756 Gujarat 140 133 273 138 108 246 162 94 256 137 101 238 - - - 577 436 1,0137 Haryana 89 69 158 79 65 144 84 77 161 61 55 116 29 25 54 342 291 6338 Himachal Pradesh 15 17 32 27 20 47 11 16 27 16 16 32 22 6 28 91 75 1669 Jammu & Kashmir 112 82 194 59 38 97 42 31 73 23 15 38 15 10 25 251 176 42710 Jharkhand 316 270 586 240 268 508 284 251 535 246 <strong>21</strong>6 462 154 126 280 1,240 1,131 2,37111 Karnataka 74 88 162 88 65 153 88 70 158 86 69 155 83 57 140 419 349 76812 Kerala 60 41 101 61 40 101 62 41 103 43 35 78 - - - 226 157 38313 Madhya Pradesh 1<strong>21</strong> 108 229 123 114 237 74 101 175 101 88 189 38 41 79 457 452 90914 Maharashtra 118 98 <strong>21</strong>6 92 61 153 55 43 98 78 48 126 - - - 343 250 59315 Orissa 76 58 134 70 53 123 53 31 84 52 44 96 50 33 83 301 <strong>21</strong>9 52016 Punjab 131 100 231 107 89 196 87 68 155 63 53 116 48 47 95 436 357 79317 Rajasthan 384 294 678 313 264 577 277 222 499 224 178 402 128 114 242 1,326 1,072 2,39818 Tamil Nadu 49 32 81 26 30 56 30 32 62 25 25 50 42 32 74 172 151 32319 Uttar Pradesh <strong>21</strong>4 199 413 207 185 392 <strong>21</strong>6 205 4<strong>21</strong> 186 181 367 58 37 95 881 807 1,68820 Uttarakhand 47 16 63 47 18 65 49 10 59 50 19 69 27 8 35 220 71 291<strong>21</strong> West Bengal 110 82 192 79 70 149 57 47 104 66 46 112 - - - 312 245 557All States 2,877 2,464 5,341 2,515 2,187 4,702 2,378 2,002 4,380 2,055 1,731 3,786 1,486 1,140 2,626 11,311 9,524 20,835114
Table 2.4.3 Grade wise number of school leavers of upper primary stage whose houses were visited-2008-09Sr.NoStateGrade 5 Grade 6 Grade 7 Grade 8 Total upper primary stageBoys Girls Total Boys Girls Total Boys Girls Total Boys Girls Total Boys Girls Total1 Andhra Pradesh - - - 79 73 152 37 37 74 - - - 116 110 2262 Assam 74 54 128 105 62 167 46 35 81 - - - 225 151 3763 Bihar - - - 225 150 375 245 154 399 58 19 77 528 323 8514 Chhattisgarh - - - 101 68 169 98 54 152 39 24 63 238 146 3845 Delhi - - - 96 70 166 95 82 177 4 3 7 195 155 3506 Gujarat 181 158 339 189 161 350 60 62 122 - - - 430 381 8117 Haryana - - - 64 49 113 45 48 93 42 35 77 151 132 2838 Himachal Pradesh - - - 31 29 60 24 22 46 16 14 30 71 65 1369 Jammu & Kashmir - - - 59 31 90 60 25 85 <strong>21</strong> 6 27 140 62 20<strong>21</strong>0 Jharkhand - - - <strong>21</strong>4 128 342 202 128 330 60 29 89 476 285 76111 Karnataka - - - 108 82 190 42 24 66 - - - 150 106 25612 Kerala 63 58 1<strong>21</strong> 14 10 24 6 7 13 - - - 83 75 15813 Madhya Pradesh - - - 172 115 287 92 75 167 15 15 30 279 205 48414 Maharashtra 173 95 268 140 82 222 61 56 117 - - - 374 233 60715 Orissa - - - 86 64 150 77 55 132 - - - 163 119 28<strong>21</strong>6 Punjab - - - 78 54 132 81 54 135 86 53 139 245 161 40617 Rajasthan - - - 269 188 457 260 166 426 83 49 132 612 403 1,01518 Tamil Nadu - - - 105 97 202 123 83 206 49 39 88 277 <strong>21</strong>9 49619 Uttar Pradesh - - - 89 58 147 114 77 191 12 7 19 <strong>21</strong>5 142 35720 Uttarakhand - - - 56 19 75 51 20 71 14 4 18 1<strong>21</strong> 43 164<strong>21</strong> West Bengal 36 25 61 30 122 152 33 111 144 27 45 72 126 303 429All States - - - 2,310 1,712 4,022 1,852 1,375 3,227 526 342 868 4,688 3,429 8,117115
Table 2.4.4 Grade wise number of school leavers of upper primary stage whose houses were visited 2009-10Sr.NoStateGrade 5 Grade 6 Grade 7 Grade 8 Total upper primary stageBoys Girls Total Boys Girls Total Boys Girls Total Boys Girls Total Boys Girls Total1 Andhra Pradesh - - - 72 60 132 53 <strong>21</strong> 74 - - - 125 81 2062 Assam 87 46 133 49 42 91 51 22 73 - - - 187 110 2973 Bihar - - - 252 156 408 220 139 359 59 27 86 531 322 8534 Chhattisgarh - - - 101 45 146 50 60 110 26 12 38 177 117 2945 Delhi - - - 91 71 162 99 67 166 14 13 27 204 151 3556 Gujarat 129 119 248 113 104 <strong>21</strong>7 57 60 117 - - - 299 283 5827 Haryana - - - 28 24 52 41 30 71 22 16 38 91 70 1618 Himachal Pradesh - - - 17 35 52 18 5 23 4 3 7 39 43 829 Jammu & Kashmir - - - 63 27 90 23 16 39 8 11 19 94 54 14810 Jharkhand - - - 143 132 275 131 83 <strong>21</strong>4 86 43 129 360 258 61811 Karnataka - - - 73 50 123 25 30 55 - - - 98 80 17812 Kerala 7 7 14 56 29 85 49 23 72 - - - 112 59 17113 Madhya Pradesh - - - 105 66 171 50 46 96 52 38 90 207 150 35714 Maharashtra 156 57 <strong>21</strong>3 107 82 189 43 31 74 - - - 306 170 47615 Orissa - - - 54 34 88 112 62 174 - - - 166 96 26<strong>21</strong>6 Punjab - - - 85 46 131 37 52 89 57 38 95 179 136 31517 Rajasthan - - - 189 167 356 171 91 262 128 63 191 488 3<strong>21</strong> 80918 Tamil Nadu - - - 89 60 149 73 57 130 72 74 146 234 191 42519 Uttar Pradesh - - - 58 32 90 68 43 111 61 33 94 187 108 29520 Uttarakhand - - - 36 13 49 46 11 57 18 5 23 100 29 129<strong>21</strong> West Bengal 19 38 57 54 56 110 46 64 110 <strong>21</strong> 28 49 140 186 326All States - - - 1,835 1,331 3,166 1,463 1,013 2,476 628 404 1,032 3,926 2,748 6,674116
Table 2.5.1 Number of graduates and completers of highest grade by gender & stage, whose houses were visited, 2008-09 & 2009-10Primary stageUpper primary stage2008-09 2009-10 2008-09 2009-10Sr. No StatesBoys Girls Total Boys Girls Total Boys Girls Total Boys Girls Total1 Andhra Pradesh 1,251 1,284 2,535 1,206 1,340 2,546 1,240 1,3<strong>21</strong> 2,561 1,131 1,256 2,3872 Assam 1,166 1,229 2,395 1,154 1,129 2,283 965 879 1,844 938 932 1,8703 Bihar 3,590 2,894 6,484 3,744 3,275 7,019 2,410 1,672 4,082 2,570 1,917 4,4874 Chhattisgarh 1,173 1,094 2,267 1,407 1,243 2,650 993 876 1,869 864 1,045 1,9095 Delhi 4,451 5,922 10,373 4,587 5,793 10,380 5,688 4,145 9,833 6,<strong>21</strong>7 4,534 10,7516 Gujarat 2,798 2,644 5,442 2,874 2,440 5,314 2,568 2,337 4,905 2,641 2,299 4,9407 Haryana 1,671 1,375 3,046 1,592 1,474 3,066 1,904 1,645 3,549 1,993 1,896 3,8898 Himachal Pradesh 928 8<strong>21</strong> 1,749 882 763 1,645 741 664 1,405 867 756 1,6239 Jammu & Kashmir 985 747 1,732 885 657 1,542 914 705 1,619 952 662 1,61410 Jharkhand 2,094 2,<strong>21</strong>8 4,312 1,976 2,105 4,081 994 1,180 2,174 942 1,165 2,10711 Karnataka 2,273 2,092 4,365 2,489 2,271 4,760 2,168 1,942 4,110 2,191 1,946 4,13712 Kerala 2,318 2,094 4,412 2,260 1,957 4,<strong>21</strong>7 2,390 2,097 4,487 2,149 2,032 4,18113 Madhya Pradesh 1,467 1,386 2,853 1,442 1,430 2,872 1,135 1,157 2,292 1,262 1,490 2,75<strong>21</strong>4 Maharashtra 2,030 1,759 3,789 2,286 1,953 4,239 1,982 1,782 3,764 2,002 1,863 3,86515 Orissa 1,693 1,511 3,204 1,647 1,587 3,234 1,165 1,172 2,337 1,179 1,337 2,51616 Punjab 1,089 1,037 2,126 1,332 1,086 2,418 996 986 1,982 1,099 1,026 2,12517 Rajasthan 1,510 1,270 2,780 1,656 1,376 3,032 1,794 1,174 2,968 1,712 1,174 2,88618 Tamil Nadu 1,931 1,745 3,676 1,864 1,807 3,671 1,846 1,950 3,796 1,765 1,889 3,65419 Uttar Pradesh 2,425 2,427 4,852 2,332 2,458 4,790 1,292 1,5<strong>21</strong> 2,813 1,311 1,505 2,81620 Uttarakhand 1,256 1,110 2,366 1,341 1,205 2,546 882 808 1,690 912 885 1,797<strong>21</strong> West Bengal 2,635 2,353 4,988 2,670 2,570 5,240 1,637 2,839 4,476 1,724 2,897 4,6<strong>21</strong>All States 40,734 39,012 79,746 41,626 39,919 81,545 35,704 32,852 68,556 36,4<strong>21</strong> 34,506 70,927117
Table 2.5.2: Number of graduates of terminal classes whose houses were visitedPrimary stageUpper primary stageSr No State2008-09 2009-10 2008-09 2009-10Boys Girls Total Boys Girls Total Boys Girls Total Boys Girls Total1 Andhra Pradesh 904 863 1,767 851 980 1,831 357 362 719 342 320 6622 Assam 1,160 1,229 2,389 1,144 1,120 2,264 965 879 1,844 942 935 1,8773 Bihar 1,687 1,379 3,066 1,751 1,504 3,255 46 28 74 201 197 3984 Chhattisgarh 1,076 997 2,073 1,304 1,149 2,453 7 4 11 0 0 05 Delhi 1,8<strong>21</strong> 4,161 5,982 1,966 4,055 6,0<strong>21</strong> 25 758 783 19 761 7806 Gujarat 367 297 664 361 295 656 2,504 2,341 4,845 2,642 2,316 4,9587 Haryana 1,133 970 2,103 1,026 1,030 2,056 9 4 13 5 4 98 Himachal Pradesh 718 693 1,411 666 633 1,299 7 11 18 1 2 39 Jammu & Kashmir 330 319 649 264 226 490 18 10 28 43 36 7910 Jharkhand 1,073 982 2,055 881 855 1,736 <strong>21</strong>8 102 320 319 249 56811 Karnataka 432 345 777 384 400 784 2,087 1,845 3,932 2,137 1,876 4,01312 Kerala 1,129 1,085 2,<strong>21</strong>4 1,170 1,047 2,<strong>21</strong>7 2,501 2,144 4,645 2,249 2,085 4,33413 Madhya Pradesh 1,128 1,103 2,231 1,091 1,094 2,185 0 1 1 12 6 1814 Maharashtra 824 854 1,678 950 875 1,825 1,<strong>21</strong>5 1,018 2,233 1,201 1,051 2,25<strong>21</strong>5 Orissa 1,<strong>21</strong>8 1,077 2,295 1,151 1,118 2,269 1,092 1,027 2,119 1,056 1,140 2,19616 Punjab 1,005 997 2,002 1,283 1,061 2,344 16 12 28 0 0 017 Rajasthan 538 473 1,011 478 472 950 55 38 93 75 38 11318 Tamil Nadu 1,338 1,151 2,489 1,261 1,200 2,461 39 20 59 37 20 5719 Uttar Pradesh 2,256 2,258 4,514 2,172 2,281 4,453 0 0 0 0 0 020 Uttarakhand 945 837 1,782 1,005 933 1,938 0 0 0 0 0 0<strong>21</strong> West Bengal 2,428 2,150 4,578 2,476 2,372 4,848 209 <strong>21</strong>3 422 240 190 430All States 24,124 24,789 48,913 24,356 25,255 49,611 10,756 10,248 <strong>21</strong>,004 10,800 10,671 <strong>21</strong>,471118
Annexure- Chapter 3Table 3.1.1: Grade wise status of primary school leavers (boys) whose house were visited for the year 2008-09Sr.Average PrimaryState Grade-1 Grade-2 Grade-3 Grade-4 Grade-5NoStageR P D R P D R P D R P D R P D R P D1 Andhra Pradesh 24.5 60.0 15.4 16.1 71.1 12.8 27.8 63.6 8.6 41.1 48.9 10.0 19.0 27.9 53.1 27.0 58.6 14.52 Assam 37.4 30.4 32.2 56.4 15.4 28.2 41.4 25.3 33.3 22.5 26.3 51.2 - - - 42.2 24.2 33.63 Bihar 23.9 39.3 36.8 22.7 46.8 30.5 29.1 44.6 26.3 26.2 41.5 32.3 16.4 23.2 60.5 24.0 39.8 36.24 Chhattisgarh 51.0 37.4 11.6 39.2 37.9 22.8 40.4 32.2 27.4 15.0 51.6 33.4 35.0 19.8 45.2 39.1 37.0 23.95 Delhi 16.5 37.5 46.0 23.1 29.0 47.8 25.9 31.5 42.5 <strong>21</strong>.6 40.2 38.2 14.1 25.2 60.6 20.6 33.2 46.26 Gujarat 22.3 71.5 6.2 18.5 77.3 4.3 16.5 74.3 9.3 17.3 39.7 42.9 - - - 18.8 66.5 14.67 Haryana 39.1 56.5 4.4 36.4 53.2 10.4 38.0 48.9 13.1 45.5 40.5 14.0 26.6 25.4 48.0 38.1 48.0 13.98 Himachal Pradesh 16.6 79.0 4.4 13.3 72.6 14.0 17.9 79.4 2.7 24.4 73.1 2.5 0.0 56.0 44.0 16.0 73.9 10.19 Jammu & Kashmir 31.7 62.6 5.7 41.0 46.3 12.7 18.4 62.7 19.0 30.2 57.8 12.0 18.9 36.2 44.9 29.8 55.8 14.310 Jharkhand 30.4 45.6 24.0 33.5 47.0 19.6 34.2 41.8 24.0 41.9 38.2 19.9 28.6 20.7 50.7 34.0 40.0 26.011 Karnataka 26.0 54.5 19.5 13.3 70.1 16.6 16.7 71.1 12.2 10.7 68.7 20.6 9.0 39.7 51.3 15.4 61.1 23.512 Kerala 19.6 71.2 9.3 32.3 67.7 0.0 32.6 65.0 2.5 9.3 72.2 18.5 - - - 24.4 68.8 6.813 Madhya Pradesh 31.4 51.6 17.0 37.4 42.6 20.0 31.3 42.4 26.3 33.9 43.7 22.3 31.1 10.4 58.5 33.2 40.9 25.914 Maharashtra 22.8 66.4 10.8 27.0 63.3 9.6 20.0 73.4 6.6 3.9 48.6 47.5 - - - 18.4 63.2 18.415 Orissa 11.6 64.7 23.6 23.2 52.0 24.8 24.5 66.1 9.4 15.0 61.3 23.7 8.1 36.3 55.6 15.5 56.5 28.016 Punjab 26.6 28.8 44.6 33.1 31.3 35.6 32.1 35.7 32.2 49.1 23.9 27.1 26.8 15.8 57.4 34.2 28.6 37.<strong>21</strong>7 Rajasthan 28.8 59.9 11.4 32.8 51.9 15.3 43.1 45.9 11.1 29.7 57.5 12.9 16.0 34.2 49.9 31.2 51.6 17.<strong>21</strong>8 Tamil Nadu 19.4 67.4 13.2 15.3 68.1 16.6 13.4 72.2 14.3 17.6 65.6 16.8 5.0 41.8 53.2 14.7 64.1 <strong>21</strong>.<strong>21</strong>9 Uttar Pradesh 51.3 38.6 10.2 45.2 42.5 12.3 58.2 31.7 10.1 49.9 41.1 9.0 <strong>21</strong>.3 30.4 48.3 50.1 37.6 12.320 Uttarakhand 30.3 23.5 46.2 33.3 28.6 38.1 15.3 42.7 42.0 30.9 34.3 34.8 13.9 19.9 66.1 27.1 30.6 42.3<strong>21</strong> West Bengal 27.2 <strong>21</strong>.8 51.0 28.3 24.0 47.7 35.5 20.9 43.6 3.5 16.5 80.0 - - - 26.1 <strong>21</strong>.4 52.5All States 33.1 48.6 18.3 32.0 49.2 18.8 38.2 45.3 16.5 32.3 45.3 22.4 20.0 31.9 48.1 32.4 45.5 22.1R=Continued as Repeater; P=Continued as Promotees; D=Discontinued119
Table 3.1.2: Grade wise status of primary school leavers (girls) whose house were visited for the year 2008-09Sr.No State Grade-1 Grade-2 Grade-3 Grade-4 Grade-5Average PrimaryStageR P D R P D R P D R P D R P D R P D1 Andhra Pradesh <strong>21</strong>.5 65.3 13.2 22.3 67.4 10.3 18.4 64.9 16.6 20.6 69.3 10.1 18.8 23.2 58.1 20.6 64.5 14.82 Assam 52.6 23.6 23.8 48.5 18.1 33.4 36.7 29.5 33.8 41.1 6.9 51.9 - - - 46.9 20.4 32.63 Bihar 22.4 41.7 35.9 30.9 41.0 28.0 26.3 44.3 29.5 28.4 40.1 31.5 17.5 28.6 54.0 25.8 40.4 33.84 Chhattisgarh 57.0 31.4 11.6 37.8 37.5 24.6 30.7 33.7 35.5 31.0 51.7 17.3 35.8 11.4 52.7 43.4 34.9 <strong>21</strong>.75 Delhi 15.9 17.9 66.2 <strong>21</strong>.8 11.3 66.9 39.1 10.2 50.7 30.8 16.6 52.6 15.7 22.7 61.6 22.7 15.6 61.76 Gujarat 20.5 75.0 4.6 <strong>21</strong>.7 71.9 6.4 32.3 59.1 8.6 19.9 37.1 43.0 - - - 23.3 60.0 16.77 Haryana 41.0 56.0 3.1 27.5 61.6 10.9 30.4 56.0 13.6 50.2 34.5 15.3 26.3 30.4 43.4 34.0 50.8 15.38 Himachal Pradesh 1.9 91.3 6.8 14.0 83.5 2.6 17.9 74.1 8.0 17.6 80.2 2.2 0.0 71.7 28.3 10.9 81.5 7.69 Jammu & Kashmir 48.3 45.6 6.1 49.5 50.5 0.0 10.4 73.4 16.2 16.3 63.4 20.3 9.4 56.1 34.5 35.0 53.5 11.510 Jharkhand 26.1 42.7 31.3 33.0 41.9 25.1 36.3 39.6 24.0 48.3 32.2 19.5 26.1 <strong>21</strong>.1 52.8 34.6 37.6 27.711 Karnataka 24.0 54.0 22.0 23.4 60.0 16.6 13.8 70.4 15.8 6.7 68.5 24.8 6.0 47.4 46.6 15.7 60.5 23.812 Kerala 25.2 69.6 5.2 24.6 73.1 2.3 23.6 70.8 5.6 14.3 68.4 17.2 - - - 22.1 70.5 7.413 Madhya Pradesh 28.5 56.8 14.7 42.6 41.7 15.6 45.7 35.2 19.1 57.9 32.4 9.7 49.9 16.6 33.6 42.9 39.8 17.414 Maharashtra 26.5 64.8 8.7 31.9 65.0 3.0 16.8 81.8 1.4 6.6 51.3 42.0 - - - 20.3 64.4 15.315 Orissa 10.5 65.6 23.9 2.5 69.1 28.4 3.1 57.8 39.2 27.5 60.1 12.4 8.5 42.8 48.7 9.9 59.3 30.716 Punjab 33.6 32.0 34.4 36.4 37.6 26.0 31.4 17.3 51.3 46.4 29.0 24.6 35.0 15.0 50.1 36.0 26.9 37.<strong>21</strong>7 Rajasthan 32.9 56.0 11.2 29.8 55.3 14.9 32.5 50.7 16.8 40.4 44.0 15.6 13.5 30.4 56.1 31.2 49.8 19.018 Tamil Nadu 23.9 65.9 10.3 12.4 77.6 10.0 3.5 80.7 15.8 8.3 52.1 39.5 15.8 27.0 57.2 13.9 63.4 22.719 Uttar Pradesh 38.0 49.6 12.4 35.9 43.4 20.7 48.3 40.3 11.4 39.3 45.4 15.2 45.0 4.7 50.3 41.8 33.6 24.620 Uttarakhand 42.8 24.4 32.7 32.3 31.7 36.0 22.7 36.4 40.8 26.3 34.1 39.6 0.0 32.8 67.2 31.9 30.8 37.4<strong>21</strong> West Bengal 27.7 25.9 46.4 28.9 24.4 46.8 25.9 19.4 54.7 5.4 36.2 58.5 - - - 23.6 25.8 50.6All States 29.8 50.1 20.1 31.0 48.0 <strong>21</strong>.0 33.1 46.9 20.0 31.6 45.4 23.1 33.9 19.2 46.9 31.7 43.4 24.9R=Continued as Repeater; P=Continued as Promotees; D=Discontinued120
Table 3.1.3: Grade wise status of primary school leavers (total) whose house were visited for the year 2008-09Sr.No StateAverage PrimaryGrade-1 Grade-2 Grade-3 Grade-4 Grade-5StageR P D R P D R P D R P D R P D R P D1 Andhra Pradesh 23.2 62.4 14.4 19.1 69.4 11.6 23.4 64.2 12.4 31.4 58.5 10.0 18.9 26.0 55.1 24.0 61.3 14.62 Assam 44.8 27.1 28.1 52.5 16.7 30.8 40.0 26.5 33.5 31.7 16.7 51.6 - - - 44.3 22.5 33.23 Bihar 23.1 40.5 36.4 26.9 43.8 29.2 27.8 44.5 27.7 27.1 41.0 32.0 16.8 25.1 58.1 24.8 40.1 35.14 Chhattisgarh 54.0 34.5 11.6 38.5 37.7 23.8 37.7 32.6 29.6 22.0 51.7 26.3 35.4 16.2 48.5 41.0 36.1 22.95 Delhi 16.2 26.7 57.2 22.4 18.7 59.0 31.6 22.4 46.0 26.6 27.4 46.0 15.1 23.6 61.2 <strong>21</strong>.8 23.5 54.86 Gujarat <strong>21</strong>.6 72.9 5.5 19.8 75.1 5.1 22.9 68.0 9.0 18.6 38.4 43.0 - - - 20.7 63.7 15.57 Haryana 39.7 56.3 3.9 33.3 56.1 10.6 34.8 51.9 13.3 47.1 38.5 14.4 26.4 27.7 45.8 36.5 49.1 14.48 Himachal Pradesh 10.8 83.8 5.4 13.7 78.7 7.6 17.9 77.4 4.8 <strong>21</strong>.8 75.8 2.4 0.0 62.7 37.3 13.8 77.1 9.19 Jammu & Kashmir 40.5 53.6 5.9 44.4 48.0 7.6 15.5 66.6 18.0 24.5 60.1 15.4 15.0 44.4 40.6 32.2 54.8 13.110 Jharkhand 28.4 44.3 27.3 33.3 44.8 22.0 35.2 40.7 24.0 44.7 35.6 19.7 27.8 20.8 51.4 34.3 38.9 26.811 Karnataka 25.1 54.2 20.7 18.2 65.2 16.6 15.5 70.8 13.7 8.8 68.6 22.6 7.9 42.6 49.5 15.5 60.8 23.712 Kerala <strong>21</strong>.9 70.5 7.6 29.4 69.7 0.9 29.2 67.1 3.6 11.4 70.7 18.0 - - - 23.5 69.5 7.013 Madhya Pradesh 30.1 54.0 16.0 39.8 42.2 18.0 38.2 39.0 22.8 43.7 39.1 17.2 39.2 13.1 47.7 37.5 40.4 22.014 Maharashtra 24.4 65.7 9.9 29.3 64.1 6.5 18.8 76.5 4.7 5.2 49.9 44.9 - - - 19.2 63.7 17.015 Orissa 11.2 65.0 23.7 12.0 61.3 26.7 13.5 61.8 24.7 <strong>21</strong>.4 60.7 17.9 8.2 39.0 52.7 13.0 57.8 29.<strong>21</strong>6 Punjab 30.1 30.4 39.5 34.4 33.7 31.9 31.8 27.5 40.7 48.0 25.9 26.1 30.6 15.4 54.0 35.0 27.9 37.<strong>21</strong>7 Rajasthan 30.4 58.3 11.3 31.5 53.3 15.1 38.3 48.1 13.7 34.6 51.3 14.1 15.0 32.7 52.3 31.2 50.8 18.018 Tamil Nadu <strong>21</strong>.4 66.7 11.9 14.1 72.1 13.8 9.2 75.9 15.0 14.1 60.5 25.5 9.4 35.7 54.8 14.3 63.8 <strong>21</strong>.919 Uttar Pradesh 46.4 42.6 11.0 40.8 42.9 16.3 54.0 35.4 10.7 45.4 43.0 11.7 41.1 8.9 50.0 46.0 35.6 18.320 Uttarakhand 35.5 23.9 40.6 32.9 29.9 37.2 18.0 40.4 41.6 28.9 34.2 36.9 10.5 23.1 66.4 29.0 30.7 40.3<strong>21</strong> West Bengal 27.4 23.6 49.0 28.6 24.2 47.2 31.0 20.2 48.8 4.5 26.9 68.7 - - - 24.9 23.5 51.6All States 31.7 49.3 19.0 31.5 48.7 19.8 35.9 46.0 18.1 32.0 45.3 22.7 27.4 25.1 47.5 32.1 44.5 23.4R=Continued as Repeater; P=Continued as Promotees; D=Discontinued1<strong>21</strong>
Table 3.1.4: Grade wise status of primary school leavers (boys) whose house were visited for the year 2009-10Sr.Average PrimaryState Grade-1 Grade-2 Grade-3 Grade-4 Grade-5NoStageR P D R P D R P D R P D R P D R P D1 Andhra Pradesh 36.3 54.2 9.5 44.3 37.9 17.8 40.0 37.3 22.6 47.3 42.6 10.1 19.6 33.4 47.0 39.2 43.0 17.82 Assam 24.9 46.0 29.1 23.7 53.6 22.7 25.4 8.6 65.9 <strong>21</strong>.9 16.0 62.1 - - - 24.3 39.3 36.43 Bihar 17.9 51.9 30.2 24.7 46.4 28.9 32.7 38.8 28.4 27.8 49.3 22.9 15.2 31.8 53.0 24.0 44.1 31.94 Chhattisgarh 50.2 7.8 41.9 50.4 9.7 39.9 56.2 3.0 40.8 59.8 2.6 37.6 28.0 2.3 69.7 52.8 5.7 41.55 Delhi 16.8 48.0 35.2 27.7 47.7 24.5 25.5 53.2 <strong>21</strong>.4 28.9 60.4 10.6 9.1 52.0 38.8 22.9 51.5 25.66 Gujarat 41.2 50.1 8.7 35.0 54.2 10.9 37.7 55.3 6.9 18.6 40.1 41.3 - - - 32.9 49.9 17.37 Haryana 38.5 47.4 14.1 48.3 43.2 8.5 47.0 39.4 13.7 55.9 19.0 25.1 35.0 16.2 48.7 45.8 36.5 17.78 Himachal Pradesh 6.2 93.8 0.0 12.1 72.0 16.0 0.0 88.0 12.0 9.7 49.6 40.8 0.0 51.5 48.5 5.9 72.0 22.29 Jammu & Kashmir 35.2 60.3 4.6 24.4 58.3 17.3 34.2 54.5 11.4 15.6 79.4 5.0 1.4 29.0 69.6 29.5 59.5 11.010 Jharkhand 46.7 31.4 <strong>21</strong>.9 39.0 34.2 26.7 57.6 23.1 19.4 48.0 30.3 <strong>21</strong>.7 26.6 11.0 62.4 44.4 26.0 29.611 Karnataka 20.7 53.5 25.9 10.2 57.1 32.7 6.0 67.8 26.2 14.8 57.2 28.0 13.6 <strong>21</strong>.8 64.6 12.9 51.1 36.012 Kerala 13.6 79.1 7.3 32.9 66.1 1.1 22.7 77.3 0.0 11.5 76.2 12.3 - - - 20.8 74.6 4.513 Madhya Pradesh 24.0 35.2 40.8 57.0 24.4 18.7 36.0 20.4 43.6 74.8 12.1 13.1 15.2 25.4 59.4 47.6 23.4 29.114 Maharashtra 19.3 35.7 45.0 37.8 47.1 15.1 26.9 51.1 22.0 9.0 41.3 49.7 - - - 24.1 43.0 32.815 Orissa 9.8 70.3 19.9 19.2 66.2 14.5 15.8 63.0 <strong>21</strong>.2 33.1 54.6 12.3 5.0 34.5 60.5 16.8 59.2 24.016 Punjab 24.8 26.7 48.5 28.7 38.6 32.7 19.1 30.2 50.7 22.8 15.6 61.6 13.4 15.4 71.2 22.4 26.0 51.517 Rajasthan 41.1 41.2 17.8 49.3 35.1 15.6 47.0 32.5 20.4 43.7 31.6 24.7 18.5 20.3 61.2 42.9 34.5 22.618 Tamil Nadu 32.8 43.8 23.4 65.2 20.1 14.7 <strong>21</strong>.0 45.3 33.7 26.8 29.3 43.9 15.4 43.2 41.4 30.3 38.7 31.019 Uttar Pradesh 66.7 7.1 26.2 52.4 12.5 35.1 57.7 10.1 32.1 66.2 14.3 19.5 29.2 11.0 59.8 59.6 10.7 29.720 Uttarakhand 39.5 18.1 42.4 18.0 16.4 65.6 14.0 32.6 53.5 12.2 42.8 45.0 17.9 19.9 62.2 20.6 26.6 52.8<strong>21</strong> West Bengal 23.9 25.9 50.2 35.5 24.7 39.8 18.2 41.5 40.4 7.1 29.2 63.7 - - - 23.1 29.5 47.4All States 40.1 34.1 25.8 42.1 32.9 25.0 42.8 29.7 27.5 44.9 30.6 24.5 28.6 24.4 47.1 40.7 31.1 28.1R=Continued as Repeater; P=Continued as Promotees; D=Discontinued122
Table 3.1.5: Grade wise status of primary school leavers (girls) whose house were visited for the year 2009-10Sr.No State Grade-1 Grade-2 Grade-3 Grade-4 Grade-5Average PrimaryStageR P D R P D R P D R P D R P D R P D1 Andhra Pradesh 31.0 55.5 13.5 33.2 57.8 9.0 29.9 46.6 23.4 45.5 43.5 11.1 17.7 27.0 55.3 32.5 48.8 18.72 Assam 36.3 5.5 58.2 39.2 6.1 54.7 31.9 8.6 59.5 22.5 0.0 77.5 - - - 34.5 5.4 60.13 Bihar 14.4 56.8 28.9 24.4 41.0 34.5 26.4 35.0 38.6 24.6 46.3 29.1 15.5 26.1 58.3 <strong>21</strong>.1 42.7 36.24 Chhattisgarh 58.2 9.5 32.3 71.9 4.3 23.9 64.8 4.0 31.2 64.0 3.2 32.8 0.0 14.6 85.4 61.5 5.7 32.75 Delhi 67.0 16.5 16.5 55.4 24.2 20.5 64.0 9.5 26.5 59.0 22.5 18.5 34.7 15.0 50.2 57.9 17.1 25.06 Gujarat 40.4 49.0 10.6 27.0 61.6 11.4 30.3 59.4 10.4 23.5 31.3 45.2 - - - 31.2 49.7 19.17 Haryana 32.8 40.0 27.3 32.2 43.0 24.7 43.0 32.4 24.5 48.6 38.2 13.1 31.5 12.9 55.6 38.2 36.0 25.88 Himachal Pradesh 22.0 39.2 38.8 32.1 50.9 17.0 17.8 61.6 20.6 20.4 60.0 19.6 19.1 55.8 25.1 22.7 53.6 23.79 Jammu & Kashmir 23.5 70.4 6.0 15.5 75.0 9.5 42.8 48.2 9.0 0.0 77.2 22.8 18.3 36.1 45.6 23.0 67.8 9.<strong>21</strong>0 Jharkhand 42.5 25.7 31.8 49.2 27.7 23.1 60.6 18.0 <strong>21</strong>.4 60.7 20.8 18.5 36.1 8.3 55.6 50.6 20.4 29.111 Karnataka 13.7 64.4 <strong>21</strong>.9 12.4 50.0 37.6 8.9 75.1 16.0 17.5 49.3 33.2 6.8 29.1 64.1 12.2 54.6 33.<strong>21</strong>2 Kerala 15.1 84.9 0.0 18.6 81.4 0.0 16.3 83.7 0.0 24.8 45.4 29.8 - - - 18.6 74.6 6.913 Madhya Pradesh 55.4 16.3 28.3 65.6 14.4 20.0 70.1 11.5 18.4 68.0 15.1 16.9 0.0 22.5 77.5 59.6 15.0 25.514 Maharashtra 39.0 34.1 26.9 37.4 46.8 15.7 31.8 54.9 13.3 26.1 27.3 46.6 - - - 35.2 40.2 24.615 Orissa 19.5 66.2 14.3 8.7 79.4 11.9 13.4 70.3 16.3 29.0 49.2 <strong>21</strong>.8 2.8 30.9 66.2 15.8 61.4 22.916 Punjab 37.2 25.8 37.0 30.8 23.4 45.8 35.6 <strong>21</strong>.9 42.5 31.3 29.1 39.6 20.0 19.1 60.9 32.0 24.1 43.917 Rajasthan 47.8 35.6 16.6 45.6 39.4 15.0 59.3 30.2 10.5 63.9 22.8 13.3 29.6 26.9 43.6 50.8 32.1 17.118 Tamil Nadu 30.0 59.0 10.9 <strong>21</strong>.8 55.1 23.1 29.7 36.4 33.9 27.9 41.2 30.9 9.8 <strong>21</strong>.0 69.2 24.5 45.9 29.619 Uttar Pradesh 70.3 12.2 17.4 68.5 7.3 24.2 70.6 14.0 15.4 69.5 14.3 16.2 30.1 11.9 58.0 68.2 11.8 20.120 Uttarakhand 19.9 19.4 60.7 <strong>21</strong>.5 39.1 39.4 39.2 13.9 47.0 11.0 24.7 64.2 30.0 0.0 70.0 <strong>21</strong>.8 23.4 54.8<strong>21</strong> West Bengal 19.4 20.6 60.0 27.1 32.6 40.3 49.9 18.9 31.2 10.2 34.0 55.9 - - - 25.9 25.9 48.2All States 42.8 34.2 23.1 46.6 30.8 22.6 52.1 26.9 <strong>21</strong>.1 50.4 27.2 22.4 25.6 <strong>21</strong>.8 52.6 45.3 29.2 25.5R=Continued as Repeater; P=Continued as Promotees; D=Discontinued123
Table 3.1.6: Grade wise status of primary school leavers (total) whose house were visited for the year 2009-10Sr.No StateAverage PrimaryGrade-1 Grade-2 Grade-3 Grade-4 Grade-5StageR P D R P D R P D R P D R P D R P D1 Andhra Pradesh 33.9 54.8 11.3 38.5 48.2 13.2 34.7 42.2 23.1 46.4 43.0 10.5 18.6 30.1 51.2 35.9 45.9 18.22 Assam 28.8 32.1 39.1 29.2 36.9 33.9 28.0 8.6 63.4 22.2 9.5 68.3 - - - 28.0 27.0 45.03 Bihar 16.2 54.2 29.6 24.6 43.9 31.5 30.0 37.2 32.7 26.3 47.9 25.7 15.3 29.5 55.2 22.7 43.5 33.84 Chhattisgarh 53.9 8.6 37.5 60.1 7.3 32.7 60.3 3.5 36.3 61.8 2.9 35.3 15.4 7.8 76.8 56.9 5.7 37.45 Delhi 54.7 24.2 <strong>21</strong>.1 45.5 32.6 <strong>21</strong>.9 54.4 20.4 25.2 49.5 34.5 16.0 28.8 23.6 47.6 48.1 26.7 25.26 Gujarat 40.8 49.5 9.7 31.6 57.3 11.1 35.1 56.8 8.2 20.6 36.6 42.9 - - - 32.2 49.8 18.07 Haryana 36.0 44.2 19.8 41.2 43.1 15.6 45.1 36.1 18.8 52.5 27.9 19.6 33.4 14.6 52.0 42.4 36.3 <strong>21</strong>.48 Himachal Pradesh 12.2 73.1 14.7 19.8 63.8 16.4 9.0 74.7 16.3 14.5 54.2 31.2 3.9 52.4 43.7 12.5 64.7 22.89 Jammu & Kashmir 29.4 65.3 5.3 20.6 65.4 14.0 37.8 51.8 10.4 10.9 78.7 10.4 8.2 31.9 59.9 26.5 63.2 10.<strong>21</strong>0 Jharkhand 45.0 29.1 26.0 44.2 30.9 24.9 58.9 20.7 20.3 54.0 25.9 20.2 30.8 9.8 59.4 47.2 23.5 29.411 Karnataka 16.8 59.5 23.7 11.1 54.2 34.7 7.2 70.9 <strong>21</strong>.8 16.0 53.6 30.4 10.9 24.8 64.4 12.6 52.7 34.712 Kerala 14.2 81.4 4.4 27.1 72.3 0.6 20.2 79.8 0.0 17.7 61.8 20.5 - - - 19.9 74.6 5.513 Madhya Pradesh 41.6 24.6 33.8 61.5 19.2 19.3 58.4 14.6 27.0 71.7 13.5 14.8 6.9 23.8 69.3 54.1 18.8 27.114 Maharashtra 28.6 34.9 36.5 37.7 47.0 15.4 28.9 52.6 18.4 15.1 36.3 48.6 - - - 28.8 41.8 29.415 Orissa 14.0 68.5 17.5 14.4 72.2 13.3 14.9 65.8 19.3 31.2 52.1 16.6 4.2 33.1 62.7 16.3 60.2 23.516 Punjab 30.2 26.3 43.4 29.7 31.7 38.6 26.5 26.5 47.0 26.2 <strong>21</strong>.0 52.8 16.2 17.0 66.8 26.6 25.2 48.<strong>21</strong>7 Rajasthan 43.9 38.8 17.3 47.7 36.9 15.4 52.6 31.5 15.9 53.4 27.4 19.2 23.9 23.5 52.6 46.4 33.5 20.118 Tamil Nadu 31.5 50.8 17.6 40.3 40.2 19.5 24.9 41.3 33.8 27.4 35.3 37.4 13.6 36.0 50.4 27.7 42.0 30.419 Uttar Pradesh 68.1 9.1 22.8 60.2 10.0 29.8 63.6 11.9 24.5 67.7 14.3 18.0 29.6 11.4 59.1 63.4 11.2 25.420 Uttarakhand 33.6 18.5 47.8 19.0 23.1 57.9 18.5 29.2 52.3 11.9 37.7 50.4 <strong>21</strong>.3 14.3 64.4 20.9 25.7 53.4<strong>21</strong> West Bengal <strong>21</strong>.7 23.3 54.9 31.8 28.2 40.0 32.5 31.3 36.2 8.6 31.5 59.9 - - - 24.4 27.8 47.8All States 41.3 34.1 24.5 44.2 31.9 23.9 47.1 28.4 24.5 47.4 29.0 23.5 27.3 23.2 49.5 42.8 30.2 26.9R=Continued as Repeater; P=Continued as Promotees; D=Discontinued124
Table 3.1.7: Grade wise status of upper primary school leavers (boys) whose house were visited for the year 2008-09Sr. No State Grade-5 Grade-6 Grade-7 Grade-8Average upperPrimary StageR P D R P D R P D R P D R P D1 Andhra Pradesh - - - 24.0 58.2 17.8 47.3 34.7 18.0 - - - 32.1 50.0 17.82 Assam 49.7 19.8 30.5 59.9 4.3 35.8 69.2 1.5 29.3 - - - 57.7 9.3 33.03 Bihar - - - 40.6 38.5 20.9 <strong>21</strong>.8 48.9 29.3 34.9 35.0 30.1 30.5 43.4 26.14 Chhattisgarh - - - 29.9 43.2 26.9 46.1 30.5 23.3 66.0 8.3 25.7 44.4 30.3 25.35 Delhi - - - 28.1 69.9 1.9 <strong>21</strong>.1 75.8 3.2 0.0 25.0 75.0 24.3 71.8 3.96 Gujarat 25.9 63.9 10.2 31.9 56.8 11.3 35.9 40.9 23.2 - - - 30.3 57.0 12.77 Haryana - - - 15.7 68.6 15.7 51.1 35.6 13.3 45.6 40.2 14.2 34.4 51.0 14.68 Himachal Pradesh - - - 4.3 38.1 57.5 6.3 39.1 54.6 33.9 9.4 56.7 9.9 33.7 56.49 Jammu & Kashmir - - - 27.5 43.2 29.3 28.3 52.9 18.8 16.9 69.5 13.7 24.7 54.6 20.610 Jharkhand - - - 48.8 31.7 19.5 35.5 42.0 22.5 54.7 28.3 17.0 43.9 35.7 20.511 Karnataka - - - 11.6 66.2 22.1 29.1 24.9 46.0 - - - 14.2 60.2 25.612 Kerala 20.3 77.1 2.6 71.0 23.8 5.1 73.4 0.0 26.6 - - - 31.2 64.1 4.613 Madhya Pradesh - - - 28.9 41.8 29.4 24.1 48.6 27.3 44.9 29.6 25.6 28.2 43.4 28.414 Maharashtra 12.0 72.5 15.5 13.2 73.5 13.3 31.3 60.3 8.5 - - - 16.1 70.6 13.<strong>21</strong>5 Orissa - - - <strong>21</strong>.7 57.7 20.6 40.5 28.4 31.2 - - - 32.5 40.9 26.716 Punjab - - - 70.9 16.6 12.5 58.9 27.5 13.6 63.3 24.3 12.4 64.7 22.5 12.817 Rajasthan - - - 25.1 55.2 19.7 35.7 35.1 29.2 25.6 56.5 17.9 29.4 47.4 23.<strong>21</strong>8 Tamil Nadu - - - 4.3 64.6 31.1 3.6 70.6 25.8 28.6 14.9 56.5 8.0 58.9 33.019 Uttar Pradesh - - - 10.9 44.2 44.9 35.3 50.2 14.5 18.4 38.4 43.2 26.2 47.7 26.120 Uttarakhand - - - 23.9 17.6 58.5 28.5 33.7 37.8 35.3 28.8 35.8 27.2 25.8 47.1<strong>21</strong> West Bengal 31.3 4.3 64.4 53.8 <strong>21</strong>.4 24.9 25.1 34.2 40.7 19.8 68.9 11.3 31.6 29.8 38.5All States - - - 27.7 46.2 26.1 32.9 44.7 22.4 38.8 36.0 25.2 31.0 44.6 24.4R=Continued as Repeater; P=Continued as Promotees; D=Discontinued125
Table 3.1.8: Grade wise status of upper primary school leavers (girls) whose house were visited for the year 2008-09Average upper PrimarySr. No State Grade-5 Grade-6 Grade-7 Grade-8StageR P D R P D R P D R P D R P D1 Andhra Pradesh - - - 8.1 70.2 <strong>21</strong>.8 11.5 76.4 12.1 - - - 9.2 72.2 18.62 Assam 62.4 11.8 25.8 51.3 2.6 46.1 58.4 2.0 39.5 - - - 57.1 6.0 36.93 Bihar - - - 51.1 26.6 22.3 30.8 47.5 <strong>21</strong>.7 49.8 36.2 13.9 40.1 38.3 <strong>21</strong>.64 Chhattisgarh - - - 35.1 33.9 31.0 50.2 26.7 23.1 75.8 9.0 15.2 50.4 25.3 24.35 Delhi - - - 11.4 88.6 0.0 9.8 84.1 6.1 33.3 33.3 33.3 11.0 85.2 3.96 Gujarat 43.0 45.8 11.2 43.9 43.3 12.8 44.4 <strong>21</strong>.8 33.9 - - - 43.7 40.0 16.37 Haryana - - - 38.0 36.4 25.7 20.8 56.3 23.0 49.1 27.7 23.2 33.7 42.3 24.08 Himachal Pradesh - - - 1.6 56.0 42.3 4.6 42.4 53.0 34.8 26.3 38.9 9.5 44.9 45.79 Jammu & Kashmir - - - 38.6 12.5 48.9 35.9 43.3 20.8 6.3 57.7 35.9 35.9 25.3 38.810 Jharkhand - - - 49.5 35.9 14.6 33.0 41.9 25.1 30.4 53.1 16.5 40.3 40.3 19.511 Karnataka - - - 11.6 71.6 16.8 29.9 26.0 44.1 - - - 15.0 63.0 <strong>21</strong>.912 Kerala <strong>21</strong>.6 77.4 1.0 42.3 31.5 26.2 35.9 44.1 20.0 - - - 24.4 71.2 4.413 Madhya Pradesh - - - 22.7 51.3 26.0 35.5 42.3 22.2 26.5 3.6 70.0 27.6 45.0 27.414 Maharashtra 19.5 68.1 12.3 16.2 75.5 8.3 23.1 72.1 4.8 - - - 19.3 71.8 8.915 Orissa - - - 32.4 38.6 29.0 29.1 52.5 18.4 - - - 31.0 44.7 24.316 Punjab - - - 52.2 39.4 8.4 58.4 37.9 3.7 69.9 20.6 9.4 59.9 33.3 6.817 Rajasthan - - - 37.3 40.4 22.2 28.9 45.3 25.8 35.2 49.9 14.9 33.2 43.8 23.118 Tamil Nadu - - - 8.5 71.8 19.7 36.9 41.5 <strong>21</strong>.6 43.3 35.8 20.9 26.0 53.3 20.619 Uttar Pradesh - - - 34.1 42.8 23.1 22.6 43.9 33.5 3.5 83.7 12.8 26.1 45.4 28.520 Uttarakhand - - - 20.6 49.5 30.0 31.0 25.4 43.6 0.0 33.3 66.7 24.4 36.2 39.4<strong>21</strong> West Bengal 27.6 6.9 65.5 19.4 68.6 12.0 12.5 76.1 11.4 30.9 43.9 25.1 20.6 56.7 22.7All States - - - 33.8 44.4 <strong>21</strong>.8 29.5 44.5 25.9 37.0 42.1 20.9 32.1 44.3 23.6R=Continued as Repeater; P=Continued as Promotees; D=Discontinued126
Table 3.1.9: Grade wise status of upper primary school leavers (total) whose house were visited for the year 2008-09Sr.NoAverage upperState Grade-5 Grade-6 Grade-7 Grade-8Primary StageR P D R P D R P D R P D R P D1 Andhra Pradesh - - - 16.4 63.9 19.7 30.7 54.0 15.3 - - - <strong>21</strong>.3 60.6 18.22 Assam 54.5 16.7 28.7 57.3 3.8 38.9 64.2 1.7 34.1 - - - 57.5 8.1 34.43 Bihar - - - 44.7 33.8 <strong>21</strong>.5 25.3 48.3 26.3 38.0 35.3 26.8 34.1 41.5 24.44 Chhattisgarh - - - 31.7 40.0 28.4 47.6 29.2 23.3 69.5 8.5 22.0 46.5 28.6 24.95 Delhi - - - <strong>21</strong>.4 77.4 1.1 15.8 79.7 4.5 14.3 28.6 57.1 18.5 77.6 3.96 Gujarat 34.1 55.2 10.7 37.7 50.2 12.0 40.5 30.4 29.1 - - - 36.9 48.6 14.57 Haryana - - - 26.3 53.2 20.4 32.8 48.1 19.1 47.2 34.5 18.3 34.1 46.5 19.48 Himachal Pradesh - - - 3.1 46.3 50.6 5.5 40.8 53.7 34.4 18.7 46.9 9.7 39.3 51.19 Jammu & Kashmir - - - 31.9 31.2 36.9 30.0 50.8 19.2 16.2 68.8 15.0 27.5 47.3 25.<strong>21</strong>0 Jharkhand - - - 49.1 33.2 17.8 34.6 42.0 23.4 48.1 35.0 16.9 42.6 37.2 20.111 Karnataka - - - 11.6 68.5 19.9 29.5 25.5 45.0 - - - 14.6 61.4 24.012 Kerala <strong>21</strong>.0 77.2 1.8 59.9 26.8 13.3 59.0 16.9 24.1 - - - 28.0 67.5 4.513 Madhya Pradesh - - - 26.2 45.9 27.9 29.2 45.8 25.0 36.8 18.1 45.2 27.9 44.1 28.014 Maharashtra 15.0 70.8 14.3 14.3 74.2 11.5 27.3 66.0 6.7 - - - 17.4 71.1 11.515 Orissa - - - 27.1 48.1 24.8 36.3 37.2 26.5 - - - 31.8 42.5 25.716 Punjab - - - 64.6 24.3 11.1 58.7 32.2 9.2 65.4 23.2 11.4 62.9 26.5 10.617 Rajasthan - - - 29.8 49.5 20.7 32.7 39.6 27.7 29.1 54.1 16.8 30.9 45.9 23.118 Tamil Nadu - - - 6.4 68.2 25.4 18.4 57.6 23.9 36.4 25.9 37.8 16.7 56.2 27.119 Uttar Pradesh - - - 20.5 43.7 35.8 30.6 47.8 <strong>21</strong>.6 11.3 60.1 28.7 26.2 46.8 27.020 Uttarakhand - - - 23.0 26.3 50.7 29.3 31.0 39.7 28.3 29.7 42.0 26.4 28.8 44.9<strong>21</strong> West Bengal 29.9 5.2 64.8 29.8 54.3 15.9 17.1 60.9 22.1 25.2 56.8 18.0 25.5 44.9 29.6All States - - - 30.2 45.5 24.4 31.5 44.6 23.8 38.2 38.2 23.7 31.4 44.5 24.1R=Continued as Repeater; P=Continued as Promotees; D=Discontinued127
Table 3.1.10: Grade wise status of upper primary school leavers (boys) whose house were visited for the year 2009-10Sr.Average upper PrimaryState Grade-5 Grade-6 Grade-7 Grade-8NoStageR P D R P D R P D R P D R P D1 Andhra Pradesh - - - 35.8 51.1 13.0 46.2 33.9 20.0 - - - 40.4 43.6 16.12 Assam 87.7 5.4 6.9 45.4 4.4 50.2 68.1 5.6 26.3 - - - 74.0 5.2 20.73 Bihar - - - 43.6 27.1 29.3 25.8 48.9 25.3 <strong>21</strong>.4 37.7 40.9 34.1 37.2 28.74 Chhattisgarh - - - 32.9 1.5 65.6 <strong>21</strong>.9 19.1 59.0 0.0 20.7 79.3 26.3 7.5 66.25 Delhi - - - 4.0 80.5 15.5 6.1 81.8 12.1 28.6 7.1 64.3 6.6 76.3 17.16 Gujarat 31.9 57.2 10.9 32.3 58.2 9.5 37.8 47.9 14.3 - - - 33.4 55.6 11.07 Haryana - - - 48.4 32.6 19.1 38.8 51.6 9.6 58.4 18.6 23.0 45.4 39.7 15.08 Himachal Pradesh - - - 7.4 57.7 35.0 0.0 90.5 9.5 0.0 27.5 72.5 3.5 69.1 27.49 Jammu & Kashmir - - - 9.2 43.8 47.0 20.5 50.2 29.3 2.7 94.6 2.7 13.2 51.8 35.110 Jharkhand - - - 39.7 <strong>21</strong>.2 39.1 39.4 14.2 46.4 19.1 13.7 67.2 35.3 17.1 47.611 Karnataka - - - 13.5 42.8 43.7 13.7 14.4 71.8 - - - 13.6 35.4 51.012 Kerala 67.5 25.1 7.4 5.7 91.4 2.9 8.8 88.7 2.5 - - - 12.0 84.9 3.113 Madhya Pradesh - - - 24.4 20.1 55.5 <strong>21</strong>.5 32.5 46.0 14.2 14.5 71.2 19.8 20.7 59.514 Maharashtra 77.4 <strong>21</strong>.9 0.6 80.5 13.5 6.0 10.7 42.1 47.1 - - - 69.9 <strong>21</strong>.2 8.815 Orissa - - - 14.0 57.8 28.1 14.4 38.6 46.9 - - - 14.3 45.0 40.716 Punjab - - - 53.7 12.4 33.9 48.1 17.0 35.0 51.6 34.7 13.7 51.5 23.7 24.817 Rajasthan - - - 52.2 29.6 18.2 56.6 26.1 17.2 43.6 20.9 35.5 51.3 26.1 22.718 Tamil Nadu - - - 38.3 12.9 48.8 46.1 <strong>21</strong>.2 32.7 43.4 15.1 41.5 42.2 16.0 41.719 Uttar Pradesh - - - 35.8 10.3 53.9 52.7 7.4 39.9 30.0 <strong>21</strong>.8 48.3 41.1 12.4 46.520 Uttarakhand - - - 16.6 23.0 60.4 10.9 50.3 38.8 20.7 45.4 33.9 14.8 40.6 44.6<strong>21</strong> West Bengal 62.7 6.1 31.2 18.0 60.1 <strong>21</strong>.9 6.1 66.2 27.8 38.7 7.2 54.1 18.8 54.4 26.8All States - - - 39.8 25.3 34.9 36.8 28.9 34.3 28.3 <strong>21</strong>.2 50.5 36.5 25.8 37.6R=Continued as Repeater; P=Continued as Promotees; D=Discontinued128
Table 3.1.11 Grade wise status of upper primary school leavers (girls) whose house were visited for the year 2009-10Sr.Average upper PrimaryState Grade-5 Grade-6 Grade-7 Grade-8NoStageR P D R P D R P D R P D R P D1 Andhra Pradesh - - - 12.3 41.7 46.0 16.7 53.8 29.5 - - - 13.4 44.7 41.92 Assam 20.7 1.4 77.9 33.4 8.2 58.3 74.6 2.4 23.0 - - - 32.9 3.5 63.63 Bihar - - - 23.3 54.9 <strong>21</strong>.8 32.9 37.4 29.7 30.1 35.6 34.3 27.2 47.2 25.74 Chhattisgarh - - - 34.2 8.8 57.0 58.3 4.1 37.6 0.0 0.0 100.0 46.0 5.2 48.85 Delhi - - - 2.5 76.8 20.6 4.5 89.6 6.0 4.7 4.7 90.6 3.6 72.7 23.76 Gujarat 47.8 45.2 7.0 24.7 68.2 7.2 45.2 33.4 <strong>21</strong>.4 - - - 38.6 50.9 10.57 Haryana - - - 35.1 22.9 42.0 38.0 51.2 10.7 16.9 42.6 40.5 31.9 39.7 28.48 Himachal Pradesh - - - 7.0 18.8 74.1 0.0 41.1 58.9 0.0 66.7 33.3 5.7 24.5 69.79 Jammu & Kashmir - - - 31.1 50.5 18.3 45.5 35.6 18.9 41.3 18.6 40.1 37.3 38.5 24.<strong>21</strong>0 Jharkhand - - - 56.2 20.0 23.8 76.3 14.1 9.6 42.9 27.8 29.4 61.8 18.9 19.311 Karnataka - - - 20.3 52.3 27.4 14.2 4.4 81.4 - - - 17.9 33.5 48.712 Kerala 38.0 27.5 34.5 24.8 69.4 5.8 4.6 92.7 2.7 - - - 18.4 73.8 7.813 Madhya Pradesh - - - 15.3 30.7 54.0 18.5 14.5 67.0 18.4 29.9 51.7 17.0 25.1 57.914 Maharashtra 85.0 15.0 0.0 84.6 12.0 3.5 17.7 57.6 24.7 - - - 70.8 22.2 6.915 Orissa - - - 19.4 18.6 62.0 5.7 31.3 63.0 - - - 10.7 26.7 62.616 Punjab - - - 60.5 2.5 37.0 28.9 17.0 54.2 67.5 28.7 3.8 48.5 16.4 35.117 Rajasthan - - - 54.4 22.5 23.1 45.2 20.5 34.3 52.9 18.0 29.1 51.7 <strong>21</strong>.2 27.118 Tamil Nadu - - - 50.8 7.3 41.9 40.1 13.9 45.9 40.4 10.6 49.0 43.8 10.5 45.719 Uttar Pradesh - - - 52.9 4.9 42.3 43.9 18.9 37.1 24.6 33.0 42.4 40.7 19.4 39.920 Uttarakhand - - - 1.9 76.5 <strong>21</strong>.7 14.1 59.8 26.1 0.0 68.5 31.5 6.6 68.3 25.0<strong>21</strong> West Bengal 81.0 9.3 9.7 17.6 62.0 20.3 6.0 77.7 16.3 62.8 12.8 24.4 26.9 55.6 17.6All States - - - 39.7 30.2 30.1 38.0 24.8 37.2 34.0 26.5 39.5 38.2 27.6 34.2R=Continued as Repeater; P=Continued as Promotees; D=Discontinued129
Table 3.1.13 Grade wise school levers by gender in primary classes as on 30th Sep 2008 & 30th Sep 20092008-09Sr.Average PrimaryStateGrade 1 Grade 2 Grade 3 Grade 4 Grade 5NoStageB G T B G T B G T B G T B G T B G T1 Andhra Pradesh 14.1 11.6 12.9 11.9 11.0 11.4 11.4 10.4 10.9 13.7 11.0 12.3 3.7 2.6 3.1 11.0 9.4 10.22 Assam 4.7 4.7 4.7 4.9 5.1 5.0 6.0 2.8 4.5 2.3 2.1 2.2 - - - 4.5 3.7 4.13 Bihar 7.7 8.2 7.9 8.2 8.5 8.4 9.0 7.9 8.5 8.9 6.3 7.7 7.3 5.4 6.5 8.2 7.4 7.84 Chhattisgarh 8.9 6.6 7.6 5.5 7.5 6.4 8.2 3.5 6.0 5.7 5.4 5.5 3.5 2.8 3.1 6.6 5.4 6.05 Delhi 1.6 1.4 1.5 1.6 1.6 1.6 1.2 0.7 0.9 1.1 1.0 1.0 0.8 1.0 0.9 1.3 1.2 1.26 Gujarat 6.5 5.4 6.0 5.5 4.6 5.1 5.3 4.6 5.0 5.1 5.1 5.1 - - - 5.6 4.9 5.37 Haryana 5.2 3.1 4.2 7.3 4.3 5.9 7.6 6.5 7.1 5.0 3.1 4.1 2.5 2.7 2.6 5.5 3.9 4.88 Himachal Pradesh 5.0 3.8 4.4 4.0 4.7 4.4 3.8 3.5 3.7 3.8 3.1 3.5 2.2 2.0 2.1 3.7 3.4 3.69 Jammu & Kashmir 11.0 12.6 11.8 6.3 5.0 5.7 5.1 3.9 4.6 7.7 7.3 7.5 3.2 2.7 2.9 6.7 6.6 6.610 Jharkhand 13.1 12.3 12.7 14.5 10.7 12.5 12.2 11.2 11.7 13.9 11.0 12.5 9.1 4.9 7.1 12.5 10.1 11.311 Karnataka 6.3 6.0 6.1 5.6 5.8 5.7 5.6 4.5 5.1 5.6 5.4 5.5 5.4 3.7 4.6 5.7 5.1 5.412 Kerala 3.2 2.3 2.7 3.3 2.2 2.8 2.8 1.9 2.4 2.3 1.7 2.0 - - - 2.9 2.0 2.513 Madhya Pradesh 9.6 8.3 8.9 9.8 8.1 9.0 8.6 7.9 8.2 8.0 5.6 6.8 6.0 4.9 5.5 8.5 7.1 7.814 Maharashtra 6.6 5.8 6.3 6.0 6.2 6.1 6.5 4.6 5.6 6.8 6.6 6.7 - - - 6.5 5.8 6.115 Orissa 6.2 3.5 4.9 3.5 4.6 4.0 4.4 5.2 4.8 3.7 4.0 3.8 5.0 3.9 4.5 4.6 4.2 4.416 Punjab 7.9 7.1 7.5 8.3 6.9 7.7 7.9 8.5 8.1 8.0 6.3 7.2 4.7 4.1 4.4 7.5 6.6 7.117 Rajasthan 18.4 14.9 16.8 16.0 13.2 14.7 15.9 15.6 15.8 11.5 11.5 11.5 11.5 9.7 10.8 15.0 13.3 14.<strong>21</strong>8 Tamil Nadu 5.7 4.8 5.2 5.0 3.6 4.3 4.2 3.2 3.7 3.4 2.2 2.8 3.0 2.3 2.7 4.2 3.2 3.719 Uttar Pradesh 13.2 5.8 8.9 7.3 5.2 6.1 8.5 7.0 7.8 7.9 4.3 5.8 2.3 10.1 6.5 7.8 6.3 7.020 Uttarakhand 4.7 4.1 4.4 4.5 3.6 4.1 3.8 2.5 3.2 3.4 3.2 3.3 1.0 0.4 0.7 3.5 2.9 3.2<strong>21</strong> West Bengal 4.3 3.7 4.0 3.8 3.9 3.8 3.8 3.6 3.7 2.4 3.0 2.7 - - - 3.7 3.6 3.6All States 9.0 6.6 7.8 7.4 6.2 6.8 7.6 6.4 7.0 6.9 5.2 6.0 4.9 5.7 5.3 7.3 6.0 6.7131
Table 3.1.14 Grade wise school levers by gender in primary classes as on 30th Sep 2009 & 30th Sep 20102009-10Sr.Average PrimaryStateGrade 1 Grade 2 Grade 3 Grade 4 Grade 5NoStageB G T B G T B G T B G T B G T B G T1 Andhra Pradesh 12.2 10.7 11.5 10.1 10.5 10.3 7.9 9.1 8.5 8.9 7.9 8.4 5.1 4.6 4.8 8.9 8.5 8.72 Assam 5.3 3.1 4.2 4.3 2.3 3.3 2.1 1.6 1.9 1.8 1.2 1.5 - - - 3.5 2.1 2.83 Bihar 8.2 7.7 7.9 7.5 6.9 7.2 9.3 7.1 8.2 7.7 7.0 7.4 7.0 5.6 6.3 7.9 6.9 7.44 Chhattisgarh 7.3 7.3 7.3 5.7 4.2 4.9 7.4 7.7 7.5 6.4 7.2 6.8 1.5 1.4 1.4 5.7 5.4 5.65 Delhi 0.9 2.0 1.6 1.2 1.6 1.4 0.8 1.8 1.4 0.7 1.2 1.0 0.5 1.3 1.0 0.8 1.6 1.36 Gujarat 4.1 5.0 4.5 4.3 3.6 4.0 4.9 3.3 4.2 4.7 3.8 4.3 - - - 4.5 3.9 4.27 Haryana 4.5 3.8 4.2 4.0 3.6 3.8 4.3 4.1 4.2 3.3 3.4 3.3 1.6 1.5 1.6 3.6 3.3 3.48 Himachal Pradesh 2.8 1.8 2.3 2.8 2.0 2.4 2.3 2.3 2.3 1.5 1.8 1.7 2.0 0.8 1.5 2.2 1.8 2.09 Jammu & Kashmir 13.2 14.0 13.6 6.1 5.4 5.8 4.2 3.6 3.9 2.8 1.5 2.2 1.2 1.0 1.1 5.7 5.6 5.710 Jharkhand 11.0 8.3 9.7 8.4 8.7 8.6 11.2 9.1 10.1 9.7 8.4 9.1 9.6 7.8 8.7 10.0 8.5 9.<strong>21</strong>1 Karnataka 3.9 4.8 4.3 3.9 2.9 3.4 3.9 3.1 3.5 3.8 3.6 3.7 3.8 2.9 3.4 3.9 3.4 3.712 Kerala 2.8 2.1 2.5 2.8 2.1 2.5 2.8 2.0 2.4 1.7 1.7 1.7 - - - 2.5 2.0 2.<strong>21</strong>3 Madhya Pradesh 6.1 7.7 6.9 7.9 8.1 8.0 4.0 7.3 5.7 6.9 5.8 6.4 2.1 2.6 2.4 5.5 6.4 5.914 Maharashtra 4.7 4.6 4.7 4.6 3.8 4.2 2.6 2.2 2.4 3.2 2.0 2.6 - - - 3.8 3.1 3.515 Orissa 3.1 2.4 2.8 3.0 2.7 2.9 2.7 2.0 2.4 3.0 2.7 2.8 2.4 1.6 2.0 2.9 2.3 2.616 Punjab 7.8 6.9 7.4 6.2 5.6 5.9 5.5 5.8 5.6 5.3 4.5 5.0 4.4 3.7 4.1 5.8 5.3 5.617 Rajasthan 16.1 13.9 15.1 15.1 13.1 14.2 13.1 12.8 13.0 11.2 12.9 12.0 6.2 7.1 6.6 12.7 12.2 12.418 Tamil Nadu 3.3 3.0 3.2 1.8 2.5 2.2 2.1 1.7 1.9 1.2 1.2 1.2 2.7 1.3 2.0 2.2 1.9 2.119 Uttar Pradesh 10.5 4.2 6.7 7.8 5.5 6.5 7.1 4.9 5.9 6.2 4.5 5.3 1.5 0.9 1.1 6.6 4.1 5.220 Uttarakhand 2.6 1.3 2.0 2.6 1.2 2.0 2.6 0.6 1.7 2.7 1.2 2.0 1.1 0.5 0.8 2.3 1.0 1.7<strong>21</strong> West Bengal 2.7 2.8 2.7 2.8 2.6 2.7 2.4 2.1 2.3 1.9 1.9 1.9 - - - 2.5 2.4 2.4All States 7.3 5.5 6.3 6.4 5.4 5.9 5.9 5.0 5.4 5.4 4.6 5.0 3.7 2.8 3.3 5.8 4.7 5.<strong>21</strong>32
Table 3.1.15 Grade wise school levers by gender in upper primary classes as on 30th Sep 2008 & 30th Sep 20092008-09Sr.Average upper primaryStateGrade 5 Grade 6 Grade 7 Grade 8NostageB G T B G T B G T B G T B G T1 Andhra Pradesh - - - 6.9 5.8 6.3 3.1 2.7 2.9 - - - 4.8 4.2 4.52 Assam 5.9 4.8 5.4 9.3 5.2 7.5 3.0 3.2 3.1 - - - 6.1 4.4 5.43 Bihar - - - 5.6 4.8 5.2 7.8 6.9 7.4 1.6 0.6 1.2 5.1 4.2 4.74 Chhattisgarh - - - 8.0 5.1 6.7 9.8 5.0 7.3 5.0 3.3 4.2 7.5 4.5 6.15 Delhi - - - 1.4 1.1 1.3 1.2 1.3 1.2 0.1 0.1 0.1 0.9 0.9 0.96 Gujarat 5.3 5.8 5.5 6.1 6.9 6.4 2.1 2.9 2.5 - - - 4.5 5.2 4.87 Haryana - - - 2.6 2.5 2.5 1.8 2.8 2.3 1.9 1.7 1.8 2.1 2.3 2.28 Himachal Pradesh - - - 3.5 3.8 3.6 2.6 3.7 3.1 1.2 1.7 1.4 2.4 3.0 2.79 Jammu & Kashmir - - - 3.3 2.9 3.1 5.0 1.8 3.6 3.3 0.3 2.0 3.8 1.7 2.910 Jharkhand - - - 10.3 6.9 8.8 12.0 8.4 10.4 4.9 2.4 3.8 9.4 6.2 8.011 Karnataka - - - 5.2 4.3 4.8 0.9 1.0 1.0 - - - 3.1 2.7 2.912 Kerala 4.2 4.4 4.3 0.7 0.5 0.6 0.3 0.2 0.3 - - - 1.6 1.7 1.613 Madhya Pradesh - - - 9.6 6.2 7.8 7.4 4.5 5.8 1.6 1.0 1.3 6.8 4.3 5.414 Maharashtra 7.8 5.7 6.8 6.4 3.9 5.2 2.9 3.0 3.0 - - - 5.5 4.1 4.815 Orissa - - - 4.6 4.9 4.8 6.5 4.1 5.4 - - - 5.5 4.5 5.116 Punjab - - - 6.3 3.8 5.2 5.8 5.0 5.4 5.1 3.4 4.4 5.6 4.1 4.917 Rajasthan - - - 15.1 13.6 14.5 13.5 16.0 14.5 4.6 4.0 4.3 11.1 11.3 11.118 Tamil Nadu - - - 6.6 5.9 6.3 6.5 4.9 5.6 2.6 2.6 2.6 5.2 4.4 4.819 Uttar Pradesh - - - 8.0 4.9 6.4 12.2 6.5 9.2 0.7 0.6 0.6 7.2 4.0 5.520 Uttarakhand - - - 4.9 1.9 3.5 4.8 2.4 3.6 1.4 0.3 0.8 3.8 1.5 2.6<strong>21</strong> West Bengal 1.5 0.7 1.0 1.0 1.5 1.3 1.3 1.6 1.5 1.6 1.0 1.3 1.3 1.2 1.3All States - - - 7.2 5.4 6.3 7.3 5.3 6.3 2.2 1.3 1.8 6.0 4.4 5.<strong>21</strong>33
Table 3.1.16 Grade wise school leavers by gender in upper primary classes as on 30th Sep 2009 & 30th Sep 20102009-10Sr.Average upper primaryStateGrade 5 Grade 6 Grade 7 Grade 8NostageB G T B G T B G T B G T B G T1 Andhra Pradesh - - - 6.3 4.7 5.4 4.4 1.7 3.0 - - - 5.3 3.3 4.22 Assam 8.1 6.1 7.3 3.5 3.4 3.4 3.6 1.9 2.8 - - - 5.2 3.8 4.63 Bihar - - - 6.7 5.1 6.0 6.0 3.5 4.9 1.4 1.1 1.3 4.7 3.4 4.24 Chhattisgarh - - - 13.2 3.6 9.5 4.3 6.0 5.1 3.6 0.7 2.1 7.5 3.3 5.65 Delhi - - - 1.3 1.3 1.3 1.3 1.2 1.3 0.2 0.4 0.3 0.9 0.9 0.96 Gujarat 3.8 4.4 4.1 3.9 4.1 4.0 2.0 2.6 2.3 - - - 3.2 3.7 3.47 Haryana - - - 1.0 1.0 1.0 1.4 1.4 1.4 0.5 0.8 0.7 1.0 1.1 1.08 Himachal Pradesh - - - 2.0 5.7 3.6 1.8 0.9 1.4 0.4 0.4 0.4 1.4 2.3 1.89 Jammu & Kashmir - - - 2.3 2.4 2.4 1.9 1.3 1.7 0.5 1.5 1.0 1.6 1.8 1.710 Jharkhand - - - 9.4 7.1 8.3 9.1 5.9 7.6 6.4 2.9 4.8 8.5 5.6 7.111 Karnataka - - - 3.5 2.7 3.1 1.2 1.7 1.4 - - - 2.3 2.2 2.312 Kerala 0.3 0.3 0.3 2.0 1.2 1.6 1.6 0.9 1.3 - - - 1.3 0.8 1.113 Madhya Pradesh - - - 5.4 3.1 4.1 3.4 2.7 3.0 6.8 1.7 3.8 5.1 2.5 3.714 Maharashtra 7.8 3.0 5.5 5.3 4.5 4.9 1.8 1.8 1.8 - - - 4.8 3.1 4.015 Orissa - - - 3.8 3.1 3.4 7.4 4.7 6.1 - - - 5.6 3.9 4.816 Punjab - - - 5.0 4.8 4.9 3.1 6.6 4.7 5.8 3.9 5.0 4.7 5.1 4.917 Rajasthan - - - 10.7 13.7 11.9 8.4 6.8 7.8 6.8 4.5 5.9 8.6 8.4 8.518 Tamil Nadu - - - 5.5 4.3 4.9 4.2 3.7 4.0 4.1 4.0 4.0 4.6 4.0 4.319 Uttar Pradesh - - - 4.0 2.0 2.9 5.6 3.4 4.4 3.4 1.9 2.6 4.3 2.4 3.320 Uttarakhand - - - 2.6 1.5 2.1 3.9 1.4 2.7 1.9 0.4 1.1 2.8 1.0 1.9<strong>21</strong> West Bengal 0.4 0.6 0.5 2.7 1.5 2.0 2.0 1.6 1.7 0.4 0.4 0.4 1.4 1.0 1.2All States - - - 5.6 4.1 4.8 4.7 3.3 4.0 3.5 1.9 2.8 4.7 3.2 4.0134
Table 3.1.17 Grade wise discontinued students among school leavers by gender in primary grades as on 30th Sep 20092008-09Sr.Average PrimaryStateGrade 1 Grade 2 Grade 3 Grade 4 Grade 5NoStageB G T B G T B G T B G T B G T B G T1 Andhra Pradesh 15.4 13.2 14.4 12.8 10.3 11.6 8.6 16.6 12.4 10.0 10.1 10.0 53.1 58.1 55.1 14.5 14.8 14.62 Assam 32.2 23.8 28.1 28.2 33.4 30.8 33.3 33.8 33.5 51.2 51.9 51.6 - - - 33.6 32.6 33.23 Bihar 36.8 35.9 36.4 30.5 28.0 29.2 26.3 29.5 27.7 32.3 31.5 32.0 60.5 54.0 58.1 36.2 33.8 35.14 Chhattisgarh 11.6 11.6 11.6 22.8 24.6 23.8 27.4 35.5 29.6 33.4 17.3 26.3 45.2 52.7 48.5 23.9 <strong>21</strong>.7 22.95 Delhi 46.0 66.2 57.2 47.8 66.9 59.0 42.5 50.7 46.0 38.2 52.6 46.0 60.6 61.6 61.2 46.2 61.7 54.86 Gujarat 6.2 4.6 5.5 4.3 6.4 5.1 9.3 8.6 9.0 42.9 43.0 43.0 - - - 14.6 16.7 15.57 Haryana 4.4 3.1 3.9 10.4 10.9 10.6 13.1 13.6 13.3 14.0 15.3 14.4 48.0 43.4 45.8 13.9 15.3 14.48 Himachal Pradesh 4.4 6.8 5.4 14.0 2.6 7.6 2.7 8.0 4.8 2.5 2.2 2.4 44.0 28.3 37.3 10.1 7.6 9.19 Jammu & Kashmir 5.7 6.1 5.9 12.7 0.0 7.6 19.0 16.2 18.0 12.0 20.3 15.4 44.9 34.5 40.6 14.3 11.5 13.110 Jharkhand 24.0 31.3 27.3 19.6 25.1 22.0 24.0 24.0 24.0 19.9 19.5 19.7 50.7 52.8 51.4 26.0 27.7 26.811 Karnataka 19.5 22.0 20.7 16.6 16.6 16.6 12.2 15.8 13.7 20.6 24.8 22.6 51.3 46.6 49.5 23.5 23.8 23.712 Kerala 9.3 5.2 7.6 0.0 2.3 0.9 2.5 5.6 3.6 18.5 17.2 18.0 - - - 6.8 7.4 7.013 Madhya Pradesh 17.0 14.7 16.0 20.0 15.6 18.0 26.3 19.1 22.8 22.3 9.7 17.2 58.5 33.6 47.7 25.9 17.4 22.014 Maharashtra 10.8 8.7 9.9 9.6 3.0 6.5 6.6 1.4 4.7 47.5 42.0 44.9 - - - 18.4 15.3 17.015 Orissa 23.6 23.9 23.7 24.8 28.4 26.7 9.4 39.2 24.7 23.7 12.4 17.9 55.6 48.7 52.7 28.0 30.7 29.<strong>21</strong>6 Punjab 44.6 34.4 39.5 35.6 26.0 31.9 32.2 51.3 40.7 27.1 24.6 26.1 57.4 50.1 54.0 37.2 37.2 37.<strong>21</strong>7 Rajasthan 11.4 11.2 11.3 15.3 14.9 15.1 11.1 16.8 13.7 12.9 15.6 14.1 49.9 56.1 52.3 17.2 19.0 18.018 Tamil Nadu 13.2 10.3 11.9 16.6 10.0 13.8 14.3 15.8 15.0 16.8 39.5 25.5 53.2 57.2 54.8 <strong>21</strong>.2 22.7 <strong>21</strong>.919 Uttar Pradesh 10.2 12.4 11.0 12.3 20.7 16.3 10.1 11.4 10.7 9.0 15.2 11.7 48.3 50.3 50.0 12.3 24.6 18.320 Uttarakhand 46.2 32.7 40.6 38.1 36.0 37.2 42.0 40.8 41.6 34.8 39.6 36.9 66.1 67.2 66.4 42.3 37.4 40.3<strong>21</strong> West Bengal 51.0 46.4 49.0 47.7 46.8 47.2 43.6 54.7 48.8 80.0 58.5 68.7 - - - 52.5 50.6 51.6All States 18.3 20.1 19.0 18.8 <strong>21</strong>.0 19.8 16.5 20.0 18.1 22.4 23.1 22.7 48.1 46.9 47.5 22.1 24.9 23.4135
Table 3.1.18 Grade wise discontinued students among school leavers by gender in primary grades as on 30th Sep 20102009-10Sr.Average PrimaryStateGrade 1 Grade 2 Grade 3 Grade 4 Grade 5NoStageB G T B G T B G T B G T B G T B G T1 Andhra Pradesh 9.5 13.5 11.3 17.8 9.0 13.2 22.6 23.4 23.1 10.1 11.1 10.5 47.0 55.3 51.2 17.8 18.7 18.22 Assam 29.1 58.2 39.1 22.7 54.7 33.9 65.9 59.5 63.4 62.1 77.5 68.3 - - - 36.4 60.1 45.03 Bihar 30.2 28.9 29.6 28.9 34.5 31.5 28.4 38.6 32.7 22.9 29.1 25.7 53.0 58.3 55.2 31.9 36.2 33.84 Chhattisgarh 41.9 32.3 37.5 39.9 23.9 32.7 40.8 31.2 36.3 37.6 32.8 35.3 69.7 85.4 76.8 41.5 32.7 37.45 Delhi 35.2 16.5 <strong>21</strong>.1 24.5 20.5 <strong>21</strong>.9 <strong>21</strong>.4 26.5 25.2 10.6 18.5 16.0 38.8 50.2 47.6 25.6 25.0 25.26 Gujarat 8.7 10.6 9.7 10.9 11.4 11.1 6.9 10.4 8.2 41.3 45.2 42.9 - - - 17.3 19.1 18.07 Haryana 14.1 27.3 19.8 8.5 24.7 15.6 13.7 24.5 18.8 25.1 13.1 19.6 48.7 55.6 52.0 17.7 25.8 <strong>21</strong>.48 Himachal Pradesh 0.0 38.8 14.7 16.0 17.0 16.4 12.0 20.6 16.3 40.8 19.6 31.2 48.5 25.1 43.7 22.2 23.7 22.89 Jammu & Kashmir 4.6 6.0 5.3 17.3 9.5 14.0 11.4 9.0 10.4 5.0 22.8 10.4 69.6 45.6 59.9 11.0 9.2 10.<strong>21</strong>0 Jharkhand <strong>21</strong>.9 31.8 26.0 26.7 23.1 24.9 19.4 <strong>21</strong>.4 20.3 <strong>21</strong>.7 18.5 20.2 62.4 55.6 59.4 29.6 29.1 29.411 Karnataka 25.9 <strong>21</strong>.9 23.7 32.7 37.6 34.7 26.2 16.0 <strong>21</strong>.8 28.0 33.2 30.4 64.6 64.1 64.4 36.0 33.2 34.712 Kerala 7.3 0.0 4.4 1.1 0.0 0.6 0.0 0.0 0.0 12.3 29.8 20.5 - - - 4.5 6.9 5.513 Madhya Pradesh 40.8 28.3 33.8 18.7 20.0 19.3 43.6 18.4 27.0 13.1 16.9 14.8 59.4 77.5 69.3 29.1 25.5 27.114 Maharashtra 45.0 26.9 36.5 15.1 15.7 15.4 22.0 13.3 18.4 49.7 46.6 48.6 - - - 32.8 24.6 29.415 Orissa 19.9 14.3 17.5 14.5 11.9 13.3 <strong>21</strong>.2 16.3 19.3 12.3 <strong>21</strong>.8 16.6 60.5 66.2 62.7 24.0 22.9 23.516 Punjab 48.5 37.0 43.4 32.7 45.8 38.6 50.7 42.5 47.0 61.6 39.6 52.8 71.2 60.9 66.8 51.5 43.9 48.<strong>21</strong>7 Rajasthan 17.8 16.6 17.3 15.6 15.0 15.4 20.4 10.5 15.9 24.7 13.3 19.2 61.2 43.6 52.6 22.6 17.1 20.118 Tamil Nadu 23.4 10.9 17.6 14.7 23.1 19.5 33.7 33.9 33.8 43.9 30.9 37.4 41.4 69.2 50.4 31.0 29.6 30.419 Uttar Pradesh 26.2 17.4 22.8 35.1 24.2 29.8 32.1 15.4 24.5 19.5 16.2 18.0 59.8 58.0 59.1 29.7 20.1 25.420 Uttarakhand 42.4 60.7 47.8 65.6 39.4 57.9 53.5 47.0 52.3 45.0 64.2 50.4 62.2 70.0 64.4 52.8 54.8 53.4<strong>21</strong> West Bengal 50.2 60.0 54.9 39.8 40.3 40.0 40.4 31.2 36.2 63.7 55.9 59.9 - - - 47.4 48.2 47.8All States 25.8 23.1 24.5 25.0 22.6 23.9 27.5 <strong>21</strong>.1 24.5 24.5 22.4 23.5 47.1 52.6 49.5 28.1 25.5 26.9136
Table 3.1.19 Grade wise discontinued students among school leavers by gender in upper primary grades as on 30th Sep 2009Sr.NoState2008-09Grade 5 Grade 6 Grade 7 Grade 8Average upper primarygradesB G T B G T B G T B G T B G T1 Andhra Pradesh - - - 17.8 <strong>21</strong>.8 19.7 18.0 12.1 15.3 - - - 17.8 18.6 18.22 Assam 30.5 25.8 28.7 35.8 46.1 38.9 29.3 39.5 34.1 - - - 33.0 36.9 34.43 Bihar - - - 20.9 22.3 <strong>21</strong>.5 29.3 <strong>21</strong>.7 26.3 30.1 13.9 26.8 26.1 <strong>21</strong>.6 24.44 Chhattisgarh - - - 26.9 31.0 28.4 23.3 23.1 23.3 25.7 15.2 22.0 25.3 24.3 24.95 Delhi - - - 1.9 0.0 1.1 3.2 6.1 4.5 75.0 33.3 57.1 3.9 3.9 3.96 Gujarat 10.2 11.2 10.7 11.3 12.8 12.0 23.2 33.9 29.1 - - - 12.7 16.3 14.57 Haryana - - - 15.7 25.7 20.4 13.3 23.0 19.1 14.2 23.2 18.3 14.6 24.0 19.48 Himachal Pradesh - - - 57.5 42.3 50.6 54.6 53.0 53.7 56.7 38.9 46.9 56.4 45.7 51.19 Jammu & Kashmir - - - 29.3 48.9 36.9 18.8 20.8 19.2 13.7 35.9 15.0 20.6 38.8 25.<strong>21</strong>0 Jharkhand - - - 19.5 14.6 17.8 22.5 25.1 23.4 17.0 16.5 16.9 20.5 19.5 20.111 Karnataka - - - 22.1 16.8 19.9 46.0 44.1 45.0 - - - 25.6 <strong>21</strong>.9 24.012 Kerala 2.6 1.0 1.8 5.1 26.2 13.3 26.6 20.0 24.1 - - - 4.6 4.4 4.513 Madhya Pradesh - - - 29.4 26.0 27.9 27.3 22.2 25.0 25.6 70.0 45.2 28.4 27.4 28.014 Maharashtra 15.5 12.3 14.3 13.3 8.3 11.5 8.5 4.8 6.7 - - - 13.2 8.9 11.515 Orissa - - - 20.6 29.0 24.8 31.2 18.4 26.5 - - - 26.7 24.3 25.716 Punjab - - - 12.5 8.4 11.1 13.6 3.7 9.2 12.4 9.4 11.4 12.8 6.8 10.617 Rajasthan - - - 19.7 22.2 20.7 29.2 25.8 27.7 17.9 14.9 16.8 23.2 23.1 23.118 Tamil Nadu - - - 31.1 19.7 25.4 25.8 <strong>21</strong>.6 23.9 56.5 20.9 37.8 33.0 20.6 27.119 Uttar Pradesh - - - 44.9 23.1 35.8 14.5 33.5 <strong>21</strong>.6 43.2 12.8 28.7 26.1 28.5 27.020 Uttarakhand - - - 58.5 30.0 50.7 37.8 43.6 39.7 35.8 66.7 42.0 47.1 39.4 44.9<strong>21</strong> West Bengal 64.4 65.5 64.8 24.9 12.0 15.9 40.7 11.4 22.1 11.3 25.1 18.0 38.5 22.7 29.6All States - - - 26.1 <strong>21</strong>.8 24.4 22.4 25.9 23.8 25.2 20.9 23.7 24.4 23.6 24.1137
Table 3.1.20 Grade wise discontinued students among school leavers by gender in upper primary grades as on 30th Sep 20102009-10Sr.StateGrade 5 Grade 6 Grade 7 Grade 8 Average upper primary gradesNoB G T B G T B G T B G T B G T1 Andhra Pradesh - - - 13.0 46.0 29.1 20.0 29.5 22.7 - - - 16.1 41.9 26.82 Assam 6.9 77.9 33.3 50.2 58.3 53.7 26.3 23.0 25.2 - - - 20.7 63.6 36.93 Bihar - - - 29.3 <strong>21</strong>.8 26.5 25.3 29.7 26.6 40.9 34.3 38.6 28.7 25.7 27.74 Chhattisgarh - - - 65.6 57.0 64.3 59.0 37.6 47.5 79.3 100.0 83.1 66.2 48.8 61.55 Delhi - - - 15.5 20.6 17.8 12.1 6.0 9.6 64.3 90.6 80.2 17.1 23.7 20.06 Gujarat 10.9 7.0 8.9 9.5 7.2 8.4 14.3 <strong>21</strong>.4 18.0 - - - 11.0 10.5 10.87 Haryana - - - 19.1 42.0 31.5 9.6 10.7 10.1 23.0 40.5 33.2 15.0 28.4 22.08 Himachal Pradesh - - - 35.0 74.1 61.5 9.5 58.9 22.2 72.5 33.3 54.8 27.4 69.7 50.79 Jammu & Kashmir - - - 47.0 18.3 33.7 29.3 18.9 25.8 2.7 40.1 28.1 35.1 24.2 30.110 Jharkhand - - - 39.1 23.8 33.0 46.4 9.6 32.8 67.2 29.4 56.7 47.6 19.3 37.<strong>21</strong>1 Karnataka - - - 43.7 27.4 37.0 71.8 81.4 77.3 - - - 51.0 48.7 49.912 Kerala 7.4 34.5 18.7 2.9 5.8 3.9 2.5 2.7 2.6 - - - 3.1 7.8 4.713 Madhya Pradesh - - - 55.5 54.0 54.8 46.0 67.0 56.4 71.2 51.7 66.3 59.5 57.9 58.814 Maharashtra 0.6 0.0 0.5 6.0 3.5 4.9 47.1 24.7 36.3 - - - 8.8 6.9 8.115 Orissa - - - 28.1 62.0 42.3 46.9 63.0 53.1 - - - 40.7 62.6 49.416 Punjab - - - 33.9 37.0 35.2 35.0 54.2 47.4 13.7 3.8 10.3 24.8 35.1 29.617 Rajasthan - - - 18.2 23.1 20.6 17.2 34.3 23.2 35.5 29.1 33.6 22.7 27.1 24.418 Tamil Nadu - - - 48.8 41.9 45.6 32.7 45.9 39.4 41.5 49.0 45.4 41.7 45.7 43.719 Uttar Pradesh - - - 53.9 42.3 49.8 39.9 37.1 38.7 48.3 42.4 46.0 46.5 39.9 43.920 Uttarakhand - - - 60.4 <strong>21</strong>.7 47.9 38.8 26.1 35.8 33.9 31.5 33.4 44.6 25.0 39.5<strong>21</strong> West Bengal 31.2 9.7 16.6 <strong>21</strong>.9 20.3 <strong>21</strong>.2 27.8 16.3 <strong>21</strong>.6 54.1 24.4 37.0 26.8 17.6 22.0All States - - - 34.9 30.1 33.0 34.3 37.2 35.4 50.5 39.5 46.8 37.6 34.2 36.3138
Table 3.3 Transition rate of primary stage by yearsSr. No State2008-2009 2009-2010Boys Girls Total Boys Girls Total1 Andhra Pradesh 87.7 90.8 89.3 90.0 90.2 90.12 Assam 84.9 86.7 85.8 86.7 88.1 87.43 Bihar 84.4 86.4 85.3 88.7 89.4 89.04 Chhattisgarh 86.6 84.5 85.6 85.8 84.8 85.45 Delhi 90.4 87.1 88.5 80.4 75.8 77.86 Gujarat 90.3 92.3 91.3 90.2 92.0 91.07 Haryana 87.8 90.0 88.8 91.5 92.4 91.98 Himachal Pradesh 93.8 92.4 93.1 94.4 95.1 94.79 Jammu & Kashmir 95.5 95.9 95.7 94.4 91.3 93.110 Jharkhand 84.4 88.0 86.1 86.0 87.3 86.711 Karnataka 94.2 96.4 95.3 96.0 96.3 96.112 Kerala 88.7 91.0 89.8 83.8 83.1 83.413 Madhya Pradesh 84.2 78.5 81.5 86.4 85.6 86.014 Maharashtra 93.1 92.0 92.6 94.6 94.4 94.515 Orissa 87.6 87.8 87.7 93.0 93.6 93.316 Punjab 86.1 86.4 86.3 87.3 87.9 87.617 Rajasthan 84.2 83.7 84.0 88.4 87.4 87.918 Tamil Nadu 89.1 90.7 89.9 91.9 95.1 93.419 Uttar Pradesh 92.1 83.5 87.5 81.3 81.6 81.520 Uttarakhand 92.7 91.4 92.1 94.8 95.7 95.2<strong>21</strong> West Bengal 80.8 81.0 80.9 87.3 88.8 88.0All States 88.3 86.6 87.5 87.5 86.9 87.<strong>21</strong>39
Table 3.4.1: Grade wise number of lateral entrants from total enrolment by gender in primary grades 2 and aboveSr.NoStateGrade 2-4/5- TotalGrade 2 Grade 3 Grade 4 Grade 5primary stageB G T B G T B G T B G T B G T1 Andhra Pradesh 295 225 520 227 170 397 119 129 248 138 138 276 779 662 1,4412 Assam 84 117 201 57 54 111 53 56 109 - - - 194 227 4<strong>21</strong>3 Bihar 955 954 1,909 638 583 1,2<strong>21</strong> 450 372 822 401 330 731 2,444 2,239 4,6834 Chhattisgarh 77 63 140 64 62 126 74 54 128 72 43 115 287 222 5095 Delhi 122 202 324 126 158 284 153 105 258 117 157 274 518 622 1,1406 Gujarat 253 173 426 349 <strong>21</strong>8 567 790 194 984 - - - 1,392 585 1,9777 Haryana 241 195 436 171 170 341 158 153 311 144 117 261 714 635 1,3498 Himachal Pradesh 84 71 155 49 62 111 69 49 118 86 65 151 288 247 5359 Jammu & Kashmir 56 43 99 66 36 102 63 55 118 52 48 100 237 182 41910 Jharkhand <strong>21</strong>2 286 498 165 190 355 122 151 273 96 132 228 595 759 1,35411 Karnataka 190 101 291 180 157 337 192 134 326 199 159 358 761 551 1,31<strong>21</strong>2 Kerala 228 224 452 231 243 474 254 <strong>21</strong>6 470 - - - 713 683 1,39613 Madhya Pradesh 135 101 236 116 101 <strong>21</strong>7 149 132 281 108 71 179 508 405 91314 Maharashtra 125 142 267 124 118 242 1<strong>21</strong> 131 252 - - - 370 391 76115 Orissa 136 131 267 115 77 192 84 73 157 119 57 176 454 338 79<strong>21</strong>6 Punjab 172 179 351 143 111 254 154 80 234 204 145 349 673 515 1,18817 Rajasthan 372 329 701 358 307 665 241 209 450 269 201 470 1,240 1,046 2,28618 Tamil Nadu 93 108 201 92 84 176 110 77 187 96 62 158 391 331 72<strong>21</strong>9 Uttar Pradesh 319 180 499 251 168 419 444 140 584 206 188 394 1,220 676 1,89620 Uttarakhand 144 133 277 128 177 305 95 101 196 99 1<strong>21</strong> 220 466 532 998<strong>21</strong> West Bengal <strong>21</strong>0 199 409 184 1<strong>21</strong> 305 146 135 281 - - - 540 455 995All States 4,503 4,156 8,659 3,834 3,367 7,201 4,041 2,746 6,787 3,327 2,975 6,302 15,705 13,244 28,949140
Table 3.4.2: Grade wise number of lateral entrants from total enrolment by gender in upper primary grades 5 and aboveSr.NoStateGradesGrade 5 Grade 6 Grade 7 Grade 8Total of upper primarygradesB G T B G T B G T B G T B G T1 Andhra Pradesh - - - 409 375 784 161 157 318 - - - 570 532 1,1022 Assam 5 24 29 33 39 72 65 38 103 - - - 103 101 2043 Bihar - - - 883 815 1,698 272 <strong>21</strong>4 486 102 122 224 1,257 1,151 2,4084 Chhattisgarh - - - 47 131 178 38 23 61 37 14 51 122 168 2905 Delhi - - - 401 208 609 128 73 201 117 80 197 646 361 1,0076 Gujarat 269 <strong>21</strong>4 483 293 227 520 261 151 412 - - - 823 592 1,4157 Haryana - - - 693 798 1,491 165 145 310 194 143 337 1,052 1,086 2,1388 Himachal Pradesh - - - 293 304 597 47 29 76 118 94 <strong>21</strong>2 458 427 8859 Jammu & Kashmir - - - 446 354 800 300 36 336 93 42 135 839 432 1,27110 Jharkhand - - - 484 597 1,081 88 83 171 34 43 77 606 723 1,32911 Karnataka - - - 270 <strong>21</strong>4 484 153 133 286 - - - 423 347 77012 Kerala 208 <strong>21</strong>5 423 186 175 361 190 166 356 - - - 584 556 1,14013 Madhya Pradesh - - - <strong>21</strong>7 77 294 130 57 187 130 73 203 477 207 68414 Maharashtra 220 157 377 131 127 258 117 79 196 - - - 468 363 83115 Orissa - - - <strong>21</strong>8 288 506 114 133 247 - - - 332 4<strong>21</strong> 75316 Punjab - - - 153 93 246 79 60 139 111 73 184 343 226 56917 Rajasthan - - - 527 330 857 253 146 399 285 197 482 1,065 673 1,73818 Tamil Nadu - - - 2<strong>21</strong> 177 398 99 83 182 101 78 179 4<strong>21</strong> 338 75919 Uttar Pradesh - - - 61 42 103 66 94 160 112 90 202 239 226 46520 Uttarakhand - - - 41 55 96 148 53 201 78 67 145 267 175 442<strong>21</strong> West Bengal <strong>21</strong>9 331 550 89 61 150 81 92 173 58 49 107 447 533 980All States - - - 6,096 5,487 11,583 2,955 2,045 5,000 1,570 1,165 2,735 10,6<strong>21</strong> 8,697 19,318141
Sr.NoTable 3.4.3: Grade wise percentage of students from EGS/AIE/Bridge course from total enrolment by gender in primary grade 2 and aboveStateGradesGrade 2 Grade 3 Grade 4 Grade 5Total primary stageGrade 2-4/5B G T B G T B G T B G T B G T1 Andhra Pradesh 3.4 1.9 2.7 2.7 2.5 2.6 0.4 1.5 0.9 0.9 1.4 1.2 1.9 1.8 1.82 Assam 1.5 1.3 1.4 1.0 0.5 0.7 1.0 0.7 0.9 - - - 1.2 0.9 1.03 Bihar 2.2 2.5 2.3 0.5 0.8 0.6 0.9 0.6 0.8 1.0 0.9 0.9 1.2 1.3 1.24 Chhattisgarh 0.0 0.0 0.0 0.0 0.1 0.0 0.0 0.0 0.0 0.0 0.0 0.0 0.0 0.0 0.05 Delhi 0.1 0.3 0.2 0.3 0.4 0.4 0.2 0.1 0.2 0.0 0.1 0.0 0.2 0.2 0.26 Gujarat 0.0 0.1 0.1 0.2 0.2 0.2 0.0 0.0 0.0 - - - 0.1 0.1 0.17 Haryana 0.2 0.0 0.1 0.2 0.0 0.1 0.1 0.0 0.1 0.1 0.0 0.0 0.2 0.0 0.18 Himachal Pradesh 0.0 0.0 0.0 0.0 0.0 0.0 0.0 0.0 0.0 0.0 0.0 0.0 0.0 0.0 0.09 Jammu & Kashmir 0.0 0.0 0.0 0.2 0.3 0.2 0.0 0.3 0.1 0.6 0.4 0.5 0.2 0.2 0.<strong>21</strong>0 Jharkhand 0.0 0.0 0.0 0.1 0.0 0.1 0.1 0.2 0.1 0.0 0.0 0.0 0.1 0.1 0.111 Karnataka 0.2 0.1 0.1 0.0 0.1 0.0 0.0 0.2 0.1 0.2 0.1 0.2 0.1 0.1 0.112 Kerala 0.5 0.2 0.4 0.0 0.2 0.1 0.2 0.0 0.1 - - - 0.2 0.1 0.<strong>21</strong>3 Madhya Pradesh 0.4 0.2 0.3 0.2 0.1 0.1 0.0 0.0 0.0 0.6 0.0 0.3 0.3 0.1 0.<strong>21</strong>4 Maharashtra 0.2 0.4 0.3 0.2 0.0 0.1 0.0 0.2 0.1 - - - 0.1 0.2 0.<strong>21</strong>5 Orissa 0.2 0.3 0.2 0.6 0.3 0.5 0.2 0.1 0.1 1.2 0.0 0.6 0.5 0.2 0.416 Punjab 1.4 1.5 1.4 2.3 1.9 2.1 1.6 0.8 1.2 1.3 1.3 1.3 1.6 1.4 1.517 Rajasthan 0.4 0.2 0.3 0.0 0.3 0.1 0.2 0.2 0.2 0.1 0.1 0.1 0.2 0.2 0.<strong>21</strong>8 Tamil Nadu 0.3 0.3 0.3 0.0 0.1 0.0 0.0 0.0 0.0 0.2 0.0 0.1 0.1 0.1 0.119 Uttar Pradesh 0.0 0.1 0.1 0.1 0.0 0.0 7.6 0.0 3.7 0.0 0.0 0.0 1.9 0.0 1.020 Uttarakhand 0.9 1.4 1.1 1.1 1.5 1.3 0.8 1.2 1.0 0.7 1.4 1.0 0.9 1.4 1.1<strong>21</strong> West Bengal 0.4 0.2 0.3 1.5 1.6 1.5 0.9 0.8 0.9 - - - 1.0 0.8 0.9All States 0.6 0.6 0.6 0.5 0.5 0.5 0.8 0.3 0.5 0.4 0.3 0.4 0.6 0.4 0.5142
Table 3.4.4: Grade wise percentage of students from EGS/AIE/Bridge course from total enrolment by gender in upper primary grade 5 andaboveSr.NoStateGradesGrade 5 Grade 6 Grade 7 Grade 8Average upperprimary gradesB G T B G T B G T B G T B G T1 Andhra Pradesh - - - 0.5 0.9 0.7 1.1 0.4 0.7 - - - 0.8 0.7 0.72 Assam 0.0 0.0 0.0 0.2 0.5 0.3 0.0 0.2 0.1 - - - 0.1 0.2 0.13 Bihar - - - 1.5 2.3 1.9 0.9 1.1 1.0 0.3 0.2 0.2 0.9 1.3 1.14 Chhattisgarh - - - 0.0 0.0 0.0 0.0 0.0 0.0 0.0 0.0 0.0 0.0 0.0 0.05 Delhi - - - 0.6 0.6 0.6 0.3 0.1 0.2 0.0 0.7 0.3 0.3 0.5 0.46 Gujarat 0.0 0.0 0.0 0.0 0.0 0.0 0.0 0.0 0.0 - - - 0.0 0.0 0.07 Haryana - - - 0.0 0.1 0.0 0.0 0.0 0.0 0.1 0.1 0.1 0.0 0.1 0.18 Himachal Pradesh - - - 0.0 0.0 0.0 0.0 0.0 0.0 0.0 0.0 0.0 0.0 0.0 0.09 Jammu & Kashmir - - - 1.4 1.8 1.6 0.7 0.7 0.7 0.9 1.0 0.9 1.0 1.2 1.110 Jharkhand - - - 0.0 0.0 0.0 0.0 0.0 0.0 0.0 0.0 0.0 0.0 0.0 0.011 Karnataka - - - 0.0 0.0 0.0 0.0 0.0 0.0 - - - 0.0 0.0 0.012 Kerala 0.5 0.8 0.6 0.1 0.1 0.1 0.5 0.1 0.3 - - - 0.3 0.3 0.313 Madhya Pradesh - - - 0.0 0.0 0.0 0.0 0.0 0.0 0.0 0.0 0.0 0.0 0.0 0.014 Maharashtra 0.3 0.0 0.1 0.0 0.0 0.0 0.0 0.0 0.0 - - - 0.1 0.0 0.115 Orissa - - - 0.4 0.2 0.3 0.3 0.8 0.6 - - - 0.4 0.6 0.516 Punjab - - - 0.1 0.1 0.1 0.6 0.4 0.5 0.8 0.4 0.6 0.5 0.3 0.417 Rajasthan - - - 0.1 0.0 0.1 0.0 0.0 0.0 0.0 0.0 0.0 0.0 0.0 0.018 Tamil Nadu - - - 0.0 0.2 0.1 0.4 0.2 0.3 0.8 0.3 0.5 0.4 0.2 0.319 Uttar Pradesh - - - 0.0 0.0 0.0 0.0 0.0 0.0 0.0 0.0 0.0 0.0 0.0 0.020 Uttarakhand - - - 0.6 1.3 0.9 11.2 1.2 6.7 1.1 1.0 1.0 4.3 1.2 2.9<strong>21</strong> West Bengal 1.3 0.9 1.0 0.0 0.0 0.0 0.0 0.0 0.0 0.0 0.0 0.0 0.4 0.3 0.3All States - - - 0.3 0.4 0.4 0.5 0.2 0.4 0.2 0.3 0.2 0.4 0.3 0.3143
Table 3.4.5: Grade wise percentage of students from home/private tuition/unrecognized schools from total enrolment by gender in primarygrade 2 and aboveSr.NoStateGradesGrade 2 Grade 3 Grade 4 Grade 5Total primary stageGrade 2-4/5B G T B G T B G T B G T B G T1 Andhra Pradesh 7.3 3.3 5.3 3.6 2.0 2.9 1.5 1.5 1.5 0.7 1.4 1.1 3.3 2.1 2.72 Assam 1.4 2.3 1.9 0.6 1.1 0.8 0.6 0.2 0.4 - - - 0.9 1.2 1.13 Bihar 12.2 12.6 12.4 9.2 8.3 8.7 6.8 5.6 6.2 5.6 5.3 5.5 8.7 8.2 8.54 Chhattisgarh 0.1 0.1 0.1 0.1 0.2 0.1 0.1 0.5 0.3 0.2 0.1 0.1 0.1 0.2 0.25 Delhi 0.1 0.5 0.3 0.3 0.7 0.6 0.2 0.2 0.2 0.0 0.1 0.1 0.1 0.4 0.36 Gujarat 0.0 0.0 0.0 0.0 0.0 0.0 0.0 0.0 0.0 - - - 0.0 0.0 0.07 Haryana 0.6 1.3 0.9 1.1 1.8 1.4 0.2 0.2 0.2 0.5 0.3 0.4 0.6 0.9 0.78 Himachal Pradesh 0.3 0.4 0.3 0.1 0.0 0.1 0.0 0.0 0.0 0.3 0.0 0.2 0.2 0.1 0.19 Jammu & Kashmir 0.0 0.1 0.1 0.0 0.0 0.0 0.0 1.0 0.4 0.4 0.4 0.4 0.1 0.4 0.<strong>21</strong>0 Jharkhand 7.9 10.4 9.2 5.8 7.1 6.5 4.2 5.2 4.8 3.3 4.9 4.1 5.4 7.0 6.<strong>21</strong>1 Karnataka 0.3 0.1 0.2 0.4 0.3 0.3 0.4 0.1 0.3 0.6 0.3 0.4 0.4 0.2 0.312 Kerala 0.8 0.9 0.9 0.1 0.4 0.2 0.4 0.0 0.3 - - - 0.4 0.4 0.413 Madhya Pradesh 0.1 0.0 0.0 0.1 0.0 0.0 0.0 0.1 0.1 0.1 0.0 0.1 0.1 0.0 0.014 Maharashtra 0.0 0.0 0.0 0.3 0.5 0.4 0.3 0.3 0.3 - - - 0.2 0.3 0.<strong>21</strong>5 Orissa 1.5 1.4 1.4 1.3 0.8 1.0 0.2 0.7 0.4 0.2 0.1 0.2 0.8 0.7 0.816 Punjab 3.7 7.2 5.3 3.9 4.1 4.0 3.0 2.1 2.6 3.3 2.7 3.1 3.5 4.1 3.817 Rajasthan 2.7 3.5 3.1 2.8 1.7 2.3 0.6 0.7 0.6 0.7 0.6 0.7 1.8 1.8 1.818 Tamil Nadu 0.7 0.7 0.7 0.2 0.1 0.2 0.2 0.1 0.1 0.4 0.1 0.2 0.4 0.2 0.319 Uttar Pradesh 1.8 1.5 1.6 0.7 0.9 0.8 0.2 0.2 0.2 0.5 0.3 0.4 0.8 0.7 0.820 Uttarakhand 1.6 0.5 1.1 0.5 0.9 0.7 0.6 1.2 0.9 0.6 0.9 0.7 0.8 0.9 0.9<strong>21</strong> West Bengal 1.3 1.0 1.1 0.7 0.8 0.7 0.6 0.4 0.5 - - - 0.9 0.7 0.8All States 2.7 3.0 2.8 2.0 2.0 2.0 1.3 1.2 1.2 1.1 1.0 1.1 1.8 1.8 1.8144
Table 3.4.6: Grade wise percentage of students from home/private tuition/unrecognized schools from total enrolment by gender upperprimary grade 5 and aboveGradesSr.Average upperStateGrade 5 Grade 6 Grade 7 Grade 8Noprimary gradesB G T B G T B G T B G T B G T1 Andhra Pradesh - - - 0.5 0.5 0.5 0.8 1.0 0.9 - - - 0.6 0.8 0.72 Assam 0.0 0.0 0.0 0.4 1.2 0.8 1.0 0.5 0.7 - - - 0.4 0.6 0.53 Bihar - - - 7.4 8.7 8.0 2.5 2.8 2.7 1.4 1.7 1.5 4.0 4.8 4.34 Chhattisgarh - - - 0.0 0.0 0.0 0.0 0.0 0.0 0.0 0.0 0.0 0.0 0.0 0.05 Delhi - - - 0.5 0.4 0.4 0.3 0.1 0.2 0.0 0.0 0.0 0.3 0.2 0.26 Gujarat 0.1 0.0 0.1 0.1 0.1 0.1 0.1 0.4 0.3 - - - 0.1 0.1 0.17 Haryana - - - 0.0 0.0 0.0 0.0 0.0 0.0 0.0 0.0 0.0 0.0 0.0 0.08 Himachal Pradesh - - - 0.4 0.7 0.5 0.0 0.0 0.0 0.0 0.0 0.0 0.1 0.2 0.29 Jammu & Kashmir - - - 1.5 1.7 1.6 0.5 0.1 0.3 0.1 0.0 0.1 0.7 0.7 0.710 Jharkhand - - - 3.1 6.9 5.1 0.5 1.1 0.8 0.1 0.2 0.1 1.4 3.2 2.411 Karnataka - - - 0.0 0.0 0.0 0.1 0.2 0.1 - - - 0.1 0.1 0.112 Kerala 0.8 0.8 0.8 0.0 0.2 0.1 0.8 0.3 0.6 - - - 0.5 0.4 0.513 Madhya Pradesh - - - 0.0 0.0 0.0 0.2 0.0 0.1 0.1 0.1 0.1 0.1 0.0 0.114 Maharashtra 0.2 0.0 0.1 0.2 0.0 0.1 0.0 0.0 0.0 - - - 0.2 0.0 0.115 Orissa - - - 0.0 0.0 0.0 0.0 0.1 0.0 - - - 0.0 0.0 0.016 Punjab - - - 1.7 1.8 1.7 1.1 0.5 0.8 2.0 1.2 1.6 1.6 1.2 1.417 Rajasthan - - - 0.2 0.1 0.1 0.0 0.1 0.0 0.1 0.0 0.0 0.1 0.0 0.118 Tamil Nadu - - - 0.2 0.3 0.2 0.4 0.2 0.3 0.8 0.3 0.5 0.5 0.3 0.419 Uttar Pradesh - - - 0.0 0.0 0.0 0.0 0.0 0.0 0.0 0.0 0.0 0.0 0.0 0.020 Uttarakhand - - - 0.6 1.4 1.0 0.8 1.2 1.0 0.6 0.9 0.8 0.7 1.2 0.9<strong>21</strong> West Bengal 0.4 0.2 0.3 0.0 0.0 0.0 0.0 0.0 0.0 0.4 0.2 0.2 0.2 0.1 0.1All States - - - 1.0 1.2 1.1 0.5 0.4 0.4 0.4 0.3 0.3 0.6 0.7 0.7145
Table 3.4.7: Grade wise percentage of students transferred from recognized school from total enrolment by gender in primary grade 2 andaboveGradesSr.Total primary stageStateGrade 2 Grade 3 Grade 4 Grade 5NoGrade 2-4/5B G T B G T B G T B G T B G T1 Andhra Pradesh 11.8 12.1 11.9 10.2 8.7 9.5 6.7 6.7 6.7 9.2 7.1 8.1 9.5 8.6 9.02 Assam 3.4 5.0 4.2 2.7 2.9 2.8 2.6 3.6 3.1 - - - 2.9 3.9 3.43 Bihar 3.9 3.9 3.9 3.2 3.0 3.1 2.3 2.6 2.5 3.0 2.9 3.0 3.1 3.2 3.24 Chhattisgarh 5.4 4.7 5.0 4.2 4.6 4.4 4.6 3.6 4.2 4.8 3.3 4.1 4.7 4.1 4.45 Delhi 2.3 2.2 2.3 2.1 1.3 1.6 2.8 1.4 2.1 2.5 2.5 2.5 2.4 1.9 2.16 Gujarat 8.1 6.4 7.3 10.6 7.8 9.3 24.4 7.2 16.6 - - - 14.5 7.1 11.17 Haryana 12.3 10.6 11.5 8.5 8.5 8.5 8.5 9.7 9.0 8.2 7.5 7.9 9.4 9.1 9.38 Himachal Pradesh 10.9 9.1 10.0 6.7 8.0 7.3 8.0 6.8 7.4 9.1 8.4 8.8 8.7 8.1 8.49 Jammu & Kashmir 5.9 5.5 5.7 7.2 4.7 6.1 7.4 6.4 6.9 4.7 6.2 5.4 6.3 5.7 6.010 Jharkhand 0.9 0.8 0.9 0.9 0.4 0.6 1.0 0.6 0.8 1.0 0.7 0.9 1.0 0.6 0.811 Karnataka 7.5 4.6 6.1 6.9 6.4 6.7 7.2 5.7 6.5 6.9 6.5 6.7 7.1 5.8 6.512 Kerala 10.2 11.2 10.6 10.4 11.8 11.0 10.3 10.7 10.5 - - - 10.3 11.2 10.713 Madhya Pradesh 7.8 5.8 6.8 6.8 5.9 6.3 9.5 7.9 8.7 6.3 4.5 5.4 7.6 6.0 6.814 Maharashtra 5.1 7.2 6.0 4.8 5.9 5.3 4.8 6.0 5.4 - - - 4.9 6.4 5.615 Orissa 6.0 6.1 6.1 4.5 3.8 4.2 4.4 3.7 4.1 5.5 3.3 4.4 5.1 4.3 4.716 Punjab 7.2 5.8 6.5 4.5 4.1 4.3 6.5 4.3 5.5 9.8 8.4 9.2 7.0 5.7 6.417 Rajasthan 12.5 12.2 12.4 13.8 15.2 14.5 11.7 12.1 11.9 13.5 12.1 12.9 12.9 12.9 12.918 Tamil Nadu 5.0 6.2 5.6 5.4 5.0 5.2 5.9 4.4 5.2 4.5 3.3 3.9 5.2 4.6 4.919 Uttar Pradesh 10.1 5.6 7.9 8.2 5.2 6.7 9.1 4.9 7.0 8.0 7.2 7.6 8.9 5.7 7.320 Uttarakhand 7.5 8.4 7.9 8.0 12.2 10.0 5.7 5.6 5.6 5.9 7.6 6.7 6.8 8.4 7.6<strong>21</strong> West Bengal 5.1 6.1 5.6 4.2 2.3 3.3 3.6 3.7 3.6 - - - 4.3 4.0 4.2All States 6.5 5.8 6.2 6.0 5.2 5.6 7.0 4.9 6.0 6.1 5.5 5.8 6.4 5.4 5.9146
Table 3.4.8: Grade wise percentage of students transferred from recognized school from total enrolment by gender upper primary grade 5and aboveSr.NoStateGradesGrade 5 Grade 6 Grade 7 Grade 8Average upperprimary gradesB G T B G T B G T B G T B G T1 Andhra Pradesh - - - 37.4 26.8 31.5 11.7 10.9 11.2 - - - 23.8 19.0 <strong>21</strong>.22 Assam 0.4 2.3 1.3 2.4 2.3 2.3 5.3 3.2 4.3 - - - 2.6 2.6 2.63 Bihar - - - 18.3 19.5 18.9 5.8 5.4 5.7 2.1 4.3 3.0 9.2 10.5 9.84 Chhattisgarh - - - 4.2 13.5 8.5 3.6 2.1 2.8 4.1 1.3 2.6 3.9 5.3 4.65 Delhi - - - 5.4 2.8 4.2 1.6 1.2 1.4 1.9 1.1 1.5 3.0 1.7 2.46 Gujarat 9.3 8.2 8.8 10.3 9.0 9.7 9.3 5.8 7.7 - - - 9.6 7.7 8.77 Haryana - - - 37.0 41.2 39.1 7.9 7.4 7.7 9.4 7.3 8.4 17.5 18.6 18.08 Himachal Pradesh - - - 34.7 42.1 38.1 5.7 4.4 5.1 12.7 12.0 12.4 17.6 19.5 18.59 Jammu & Kashmir - - - 36.4 37.0 36.6 26.3 3.5 16.5 8.1 4.8 6.7 24.0 16.0 20.610 Jharkhand - - - 24.0 23.0 23.5 5.3 3.7 4.4 3.1 3.3 3.2 12.3 11.3 11.811 Karnataka - - - 12.4 10.7 11.5 6.8 6.6 6.7 - - - 9.5 8.6 9.112 Kerala 8.4 9.3 8.8 8.7 8.8 8.7 7.4 7.6 7.5 - - - 8.2 8.5 8.313 Madhya Pradesh - - - 13.0 3.9 8.1 8.2 3.5 5.8 9.6 4.6 6.9 10.3 4.0 7.014 Maharashtra 9.4 8.8 9.1 6.4 7.2 6.8 5.7 4.2 4.9 - - - 7.2 6.7 7.015 Orissa - - - 15.7 23.2 19.3 8.1 8.4 8.3 - - - 11.9 15.2 13.616 Punjab - - - 10.4 7.3 9.0 4.7 4.7 4.7 5.7 4.4 5.1 6.9 5.4 6.<strong>21</strong>7 Rajasthan - - - 27.8 23.1 25.8 13.0 11.4 12.4 14.2 14.7 14.4 18.2 16.6 17.618 Tamil Nadu - - - 13.2 9.9 11.5 5.4 4.2 4.7 3.9 3.4 3.6 7.4 5.7 6.519 Uttar Pradesh - - - 4.8 3.0 3.9 5.1 6.4 5.8 8.1 5.8 6.9 6.1 5.1 5.620 Uttarakhand - - - 3.1 4.5 3.7 3.6 4.5 4.0 6.7 5.6 6.2 4.4 4.9 4.7<strong>21</strong> West Bengal 5.7 6.2 6.0 3.8 1.5 2.4 3.6 2.5 2.9 2.7 1.4 1.9 4.2 3.1 3.5All States - - - 14.0 12.6 13.3 6.6 4.8 5.7 5.5 4.3 5.0 9.2 7.7 8.5147
Table 3.4.9: Grade wise percentage of promotees from lateral entrants by gender in primary grade 2 and aboveGradesSr.Primary Stage (Grade 2-StateGrade 2 Grade 3 Grade 4 Grade 5No4/5)B G T B G T B G T B G T B G T1 Andhra Pradesh 71.9 88.0 78.8 90.7 88.8 89.9 78.2 85.3 81.9 92.0 87.7 89.9 81.9 87.6 84.52 Assam 41.7 47.0 44.8 71.9 50.0 61.3 86.8 78.6 82.6 - - - 62.9 55.5 58.93 Bihar 75.5 73.2 74.3 87.5 87.1 87.3 84.0 86.8 85.3 91.3 91.5 91.4 82.8 81.8 82.34 Chhattisgarh 88.3 90.5 89.3 79.7 75.8 77.8 85.1 72.2 79.7 70.8 81.4 74.8 81.2 80.2 80.75 Delhi 87.7 87.6 87.7 69.0 98.1 85.2 83.0 91.4 86.4 100.0 98.7 99.3 84.6 93.7 89.66 Gujarat 67.2 74.6 70.2 67.3 70.2 68.4 20.3 62.9 28.7 - - - 40.6 69.1 49.07 Haryana 83.0 93.8 87.8 90.1 95.3 92.7 94.3 90.8 92.6 93.8 94.0 93.9 89.4 93.5 91.38 Himachal Pradesh 94.0 100.0 96.8 100.0 100.0 100.0 97.1 91.8 94.9 96.5 100.0 98.0 96.5 98.4 97.49 Jammu & Kashmir 85.7 88.4 86.9 81.8 86.1 83.3 87.3 74.5 81.4 78.8 75.0 77.0 83.5 80.2 82.110 Jharkhand 88.7 88.1 88.4 92.7 92.1 92.4 85.2 94.7 90.5 86.5 85.6 86.0 88.7 90.0 89.411 Karnataka 82.1 87.1 83.8 86.7 92.4 89.3 90.6 96.3 92.9 93.0 96.9 94.7 88.2 93.6 90.512 Kerala 91.7 90.2 90.9 97.0 91.4 94.1 95.3 93.1 94.3 - - - 94.7 91.5 93.113 Madhya Pradesh 82.2 93.1 86.9 94.8 90.1 92.6 96.6 95.5 96.1 92.6 93.0 92.7 91.5 93.1 92.<strong>21</strong>4 Maharashtra 72.0 78.9 75.7 88.7 86.4 87.6 89.3 91.6 90.5 - - - 83.2 85.4 84.415 Orissa 92.6 93.9 93.3 84.3 85.7 84.9 73.8 94.5 83.4 80.7 96.5 85.8 83.9 92.6 87.616 Punjab 94.8 95.0 94.9 83.2 93.7 87.8 86.4 86.3 86.3 98.0 95.2 96.8 91.4 93.4 92.317 Rajasthan 76.6 79.3 77.9 80.2 80.8 80.5 93.4 86.1 90.0 88.8 89.1 88.9 83.5 83.0 83.318 Tamil Nadu 87.1 86.1 86.6 75.0 69.0 72.2 84.5 81.8 83.4 84.4 62.9 75.9 82.9 76.4 79.919 Uttar Pradesh 92.8 95.0 93.6 89.2 85.7 87.8 30.2 89.3 44.3 94.2 86.2 90.4 69.5 89.1 76.520 Uttarakhand 58.3 68.4 63.2 70.3 40.7 53.1 68.4 58.4 63.3 70.7 62.0 65.9 66.3 55.8 60.7<strong>21</strong> West Bengal 63.3 59.3 61.4 87.0 87.6 87.2 79.5 90.4 84.7 - - - 75.7 76.0 75.9All States 79.1 81.4 80.2 84.4 84.0 84.2 67.8 86.1 75.2 87.6 87.4 87.5 79.3 84.4 81.6148
Table 3.4.10: Grade wise percentage of promotees from lateral entrants by gender in upper primary grade 5 and aboveGradesSr.Average upper primaryStateGrade 5 Grade 6 Grade 7 Grade 8NogradesB G T B G T B G T B G T B G T1 Andhra Pradesh - - - 97.8 41.6 70.9 100.0 90.4 95.3 - - - 97.6 69.3 83.52 Assam 0.0 4.2 3.4 90.9 41.0 63.9 83.1 94.7 87.4 - - - 81.6 52.5 67.23 Bihar - - - 95.9 94.2 95.1 97.1 91.1 94.4 95.1 97.5 96.4 94.9 93.5 94.24 Chhattisgarh - - - 100.0 8.4 32.6 86.8 87.0 86.9 81.1 57.1 74.5 83.0 35.1 58.05 Delhi - - - 88.5 100.0 92.4 96.1 76.7 89.1 93.2 43.8 73.1 92.3 87.6 90.46 Gujarat 67.7 68.2 67.9 68.3 63.0 66.0 65.1 70.2 67.0 - - - 68.9 70.4 69.57 Haryana - - - 84.1 91.0 87.8 98.2 96.6 97.4 94.3 98.6 96.1 88.9 92.9 90.98 Himachal Pradesh - - - 99.7 96.4 98.0 95.7 100.0 97.4 93.2 97.9 95.3 97.4 97.4 97.49 Jammu & Kashmir - - - 82.1 77.1 79.9 90.3 63.9 87.5 84.9 59.5 77.0 85.0 74.4 81.310 Jharkhand - - - 93.6 92.1 92.8 94.3 92.8 93.6 94.1 95.3 94.8 92.7 91.3 92.011 Karnataka - - - 97.8 97.7 97.7 94.8 95.5 95.1 - - - 95.5 96.8 96.112 Kerala 89.9 91.2 90.5 98.9 97.1 98.1 95.3 97.6 96.3 - - - 94.9 95.0 95.013 Madhya Pradesh - - - 89.4 98.7 91.8 86.9 96.5 89.8 93.8 93.2 93.6 90.4 95.3 92.014 Maharashtra 90.0 95.5 92.3 80.2 76.4 78.3 88.0 91.1 89.3 - - - 89.6 91.0 90.<strong>21</strong>5 Orissa - - - 95.9 99.0 97.6 84.2 96.2 90.7 - - - 84.0 97.2 90.416 Punjab - - - 77.8 64.5 72.8 88.6 91.7 89.9 86.5 98.6 91.3 88.7 87.6 88.<strong>21</strong>7 Rajasthan - - - 85.2 91.2 87.5 92.1 91.1 91.7 80.7 88.3 83.8 86.3 90.0 87.818 Tamil Nadu - - - 67.4 82.5 74.1 74.7 81.9 78.0 81.2 91.0 85.5 74.7 81.0 77.419 Uttar Pradesh - - - 68.9 64.3 67.0 90.9 91.5 91.3 85.7 90.0 87.6 88.1 86.0 87.120 Uttarakhand - - - 70.7 54.5 61.5 14.9 52.8 24.9 67.9 53.7 61.4 47.5 57.1 51.8<strong>21</strong> West Bengal 81.7 91.2 87.5 100.0 100.0 100.0 100.0 98.9 99.4 98.3 100.0 99.1 90.8 94.4 92.8All States - - - 88.7 83.9 86.4 86.1 89.4 87.5 87.6 86.9 87.3 87.3 85.5 86.5149
Table 3.4.11: Grade wise percentage of repeaters from lateral entrants by gender in primary grade 2 and aboveGradesSr.Average primary stageStateGrade 2 Grade 3 Grade 4 Grade 5NoGrade 2-4/5B G T B G T B G T B G T B G T1 Andhra Pradesh 0.3 0.0 0.2 0.9 1.8 1.3 1.7 1.6 1.6 1.4 0.0 0.7 0.9 0.8 0.82 Assam 7.1 2.6 4.5 5.3 5.6 5.4 5.7 10.7 8.3 - - - 6.2 5.3 5.73 Bihar 10.3 6.5 8.4 5.6 7.4 6.5 8.4 5.4 7.1 3.2 3.6 3.4 7.6 6.1 6.94 Chhattisgarh 7.8 4.8 6.4 7.8 6.5 7.1 6.8 3.7 5.5 8.3 4.7 7.0 7.7 5.0 6.55 Delhi 10.7 9.4 9.9 12.7 0.0 5.6 3.3 8.6 5.4 0.0 1.3 0.7 6.6 4.8 5.66 Gujarat 1.6 1.7 1.6 2.0 1.4 1.8 0.8 0.5 0.7 - - - 1.2 1.2 1.27 Haryana 1.2 3.6 2.3 2.3 2.4 2.3 4.4 5.9 5.1 0.7 1.7 1.1 2.1 3.5 2.78 Himachal Pradesh 0.0 0.0 0.0 0.0 0.0 0.0 1.4 0.0 0.8 0.0 0.0 0.0 0.3 0.0 0.29 Jammu & Kashmir 0.0 0.0 0.0 0.0 0.0 0.0 1.6 10.9 5.9 0.0 0.0 0.0 0.4 3.3 1.710 Jharkhand 2.4 2.4 2.4 1.8 2.1 2.0 4.9 0.0 2.2 7.3 6.1 6.6 3.5 2.5 3.011 Karnataka 0.0 0.0 0.0 0.0 0.6 0.3 0.0 0.0 0.0 0.0 0.0 0.0 0.0 0.2 0.112 Kerala 1.8 3.6 2.7 0.4 1.6 1.1 1.2 1.4 1.3 - - - 1.1 2.2 1.613 Madhya Pradesh 8.1 5.9 7.2 4.3 8.9 6.5 3.4 3.8 3.6 2.8 5.6 3.9 4.7 5.9 5.314 Maharashtra 0.0 0.0 0.0 0.0 0.0 0.0 0.0 0.8 0.4 - - - 0.0 0.3 0.115 Orissa 3.7 3.8 3.7 10.4 3.9 7.8 6.0 0.0 3.2 1.7 3.5 2.3 5.3 3.0 4.316 Punjab 2.9 1.1 2.0 4.9 4.5 4.7 5.8 5.0 5.6 0.0 0.0 0.0 3.1 2.1 2.717 Rajasthan 18.3 16.1 17.3 10.3 12.4 11.3 4.1 10.0 6.9 7.8 6.5 7.2 11.0 12.0 11.418 Tamil Nadu 1.1 0.9 1.0 3.3 4.8 4.0 0.0 0.0 0.0 5.2 1.6 3.8 2.3 1.8 2.119 Uttar Pradesh 0.0 0.0 0.0 1.2 1.8 1.4 45.3 0.7 34.6 0.0 0.0 0.0 16.7 0.6 11.020 Uttarakhand 2.1 1.5 1.8 1.6 0.0 0.7 0.0 0.0 0.0 0.0 0.0 0.0 1.1 0.4 0.7<strong>21</strong> West Bengal 7.1 2.5 4.9 5.4 6.6 5.9 2.1 4.4 3.2 - - - 5.2 4.2 4.7All States 5.5 4.5 5.0 4.1 4.1 4.1 7.7 3.5 6.0 3.3 2.7 3.0 5.2 3.8 4.6150
Table 3.4.12: Grade wise percentage of repeaters from lateral entrants by gender in upper primary grade 5 and aboveGradesSr.Average of upperStateGrade 5 Grade 6 Grade 7 Grade 8Noprimary gradesB G T B G T B G T B G T B G T1 Andhra Pradesh - - - 0.0 0.0 0.0 0.0 0.0 0.0 - - - 0.2 0.0 0.12 Assam 0.0 4.2 3.4 6.1 7.7 6.9 9.2 0.0 5.8 - - - 7.8 4.0 5.93 Bihar - - - 1.8 2.6 2.2 1.5 7.0 3.9 2.9 2.5 2.7 2.2 3.4 2.84 Chhattisgarh - - - 0.0 0.0 0.0 2.6 8.7 4.9 10.8 <strong>21</strong>.4 13.7 5.7 3.3 4.45 Delhi - - - 11.5 0.0 7.6 3.9 9.6 6.0 6.8 0.0 4.1 7.7 1.7 5.36 Gujarat 3.0 0.5 1.9 3.1 3.1 3.1 0.4 0.0 0.2 - - - 2.1 1.2 1.77 Haryana - - - 9.2 9.0 9.1 0.6 1.4 1.0 2.1 0.7 1.5 5.9 6.4 6.18 Himachal Pradesh - - - 0.3 0.3 0.3 0.0 0.0 0.0 4.2 2.1 3.3 1.1 0.6 0.99 Jammu & Kashmir - - - 4.0 9.3 6.4 1.7 8.3 2.4 5.4 7.1 5.9 3.1 8.1 4.910 Jharkhand - - - 5.4 6.0 5.7 2.3 2.4 2.3 5.9 4.7 5.2 5.3 5.6 5.511 Karnataka - - - 0.0 0.5 0.2 0.0 0.0 0.0 - - - 0.0 0.2 0.112 Kerala 0.0 0.9 0.5 0.5 0.0 0.3 1.1 0.0 0.6 - - - 0.5 0.5 0.513 Madhya Pradesh - - - 6.0 0.0 4.4 9.2 0.0 6.4 2.3 4.1 3.0 5.3 2.5 4.414 Maharashtra 0.9 0.0 0.5 0.0 0.0 0.0 0.9 0.0 0.5 - - - 0.8 0.0 0.415 Orissa - - - 2.3 0.0 1.0 5.3 1.5 3.2 - - - 2.8 0.7 1.816 Punjab - - - 6.5 5.4 6.1 10.1 3.3 7.2 5.4 0.0 3.3 4.4 1.9 3.417 Rajasthan - - - 14.6 8.8 12.4 6.7 8.9 7.5 15.1 11.7 13.7 11.8 8.9 10.718 Tamil Nadu - - - 1.8 1.1 1.5 13.1 2.4 8.2 16.8 5.1 11.7 7.5 2.3 5.<strong>21</strong>9 Uttar Pradesh - - - 0.0 0.0 0.0 0.0 0.0 0.0 0.0 0.0 0.0 0.0 0.0 0.020 Uttarakhand - - - 0.0 0.0 0.0 0.0 0.0 0.0 0.0 0.0 0.0 0.0 0.0 0.0<strong>21</strong> West Bengal 18.3 8.8 12.5 0.0 0.0 0.0 0.0 0.0 0.0 1.7 0.0 0.9 9.2 5.4 7.1All States - - - 4.8 3.8 4.3 2.8 2.4 2.7 6.4 3.8 5.3 4.6 3.5 4.1151
Annexure-ITable 4.4.1 Grade wise promotion rate by gender in primary grades as on 30th sep 20092008-09Sr.Average PrimaryStateGrade 1 Grade 2 Grade 3 Grade 4 Grade 5NoStageB G T B G T B G T B G T B G T B G T1 Andhra Pradesh 92.4 94.1 93.3 95.6 94.5 95.0 95.3 95.7 95.5 92.5 96.1 94.4 87.7 90.8 89.3 92.8 94.3 93.62 Assam 82.7 81.4 82.0 86.7 84.9 85.8 88.2 91.1 89.6 84.9 86.7 85.8 - - - 85.5 85.7 85.63 Bihar 72.1 70.1 71.1 83.9 82.4 83.1 87.7 86.5 87.1 88.1 89.0 88.5 84.4 86.4 85.3 82.9 82.1 82.54 Chhattisgarh 86.4 89.9 88.3 92.4 91.7 92.0 89.3 93.3 91.2 93.9 94.8 94.3 86.6 84.5 85.6 89.6 90.8 90.25 Delhi 96.7 97.0 96.9 96.8 96.0 96.3 96.2 97.9 97.2 98.3 98.1 98.2 90.4 87.1 88.5 95.8 95.4 95.66 Gujarat 88.2 91.9 89.9 92.0 93.2 92.5 91.0 92.4 91.6 90.3 92.3 91.3 - - - 90.4 92.5 91.37 Haryana 94.6 94.9 94.7 93.2 95.8 94.4 91.9 94.0 92.9 92.1 95.8 93.8 87.8 90.0 88.8 92.0 94.2 93.08 Himachal Pradesh 95.8 96.4 96.1 97.5 97.4 97.5 97.1 97.8 97.4 97.6 98.1 97.8 93.8 92.4 93.1 96.3 96.4 96.39 Jammu & Kashmir 90.6 87.3 89.0 94.0 94.1 94.0 96.0 96.9 96.4 95.3 94.6 95.0 95.5 95.9 95.7 94.3 93.4 93.910 Jharkhand 67.4 66.0 66.7 80.7 82.9 81.8 84.3 82.7 83.5 87.3 87.0 87.2 84.4 88.0 86.1 80.5 81.2 80.911 Karnataka 96.9 96.8 96.9 97.4 97.5 97.4 98.2 98.6 98.4 98.0 97.9 98.0 94.2 96.4 95.3 97.0 97.5 97.<strong>21</strong>2 Kerala 98.2 99.1 98.6 98.3 99.1 98.7 98.5 99.1 98.8 88.7 91.0 89.8 - - - 95.8 96.9 96.313 Madhya Pradesh 81.0 82.6 81.8 84.2 84.6 84.4 86.4 85.8 86.1 86.1 84.9 85.5 84.2 78.5 81.5 84.3 83.4 83.914 Maharashtra 93.6 93.7 93.6 95.2 96.1 95.6 95.6 97.6 96.5 93.1 92.0 92.6 - - - 94.4 94.9 94.615 Orissa 84.7 82.1 83.5 92.5 91.5 92.0 93.2 92.5 92.8 95.7 95.0 95.3 87.6 87.8 87.7 90.5 89.6 90.116 Punjab 84.6 87.0 85.8 84.3 86.8 85.4 84.2 84.2 84.2 83.6 86.5 84.9 86.1 86.4 86.3 84.5 86.2 85.317 Rajasthan 75.2 76.1 75.6 81.1 82.7 81.8 82.0 82.7 82.3 89.8 86.8 88.4 84.2 83.7 84.0 81.9 82.0 81.918 Tamil Nadu 93.4 95.8 94.6 98.1 98.8 98.5 98.4 99.1 98.7 98.7 98.9 98.8 89.1 90.7 89.9 95.4 96.6 96.019 Uttar Pradesh 91.9 97.0 94.8 95.5 96.9 96.3 94.0 95.6 94.8 95.4 97.6 96.7 92.1 83.5 87.5 93.9 94.6 94.320 Uttarakhand 95.6 95.7 95.6 96.2 96.5 96.3 96.0 97.4 96.7 96.7 95.9 96.4 92.7 91.4 92.1 95.5 95.5 95.5<strong>21</strong> West Bengal 69.3 68.3 68.9 86.6 86.7 86.6 89.3 89.2 89.3 80.8 81.0 80.9 - - - 80.4 80.3 80.3All States 84.4 86.6 85.5 90.9 91.7 91.3 91.6 92.4 92.0 91.8 93.0 92.4 88.8 87.0 87.9 89.5 90.2 89.8152
Table 4.4.2 Grade wise promotion rate by gender in primary grades as on 30th Sep 20102009-10Sr.Average PrimaryStateGrade 1 Grade 2 Grade 3 Grade 4 Grade 5NoStageB G T B G T B G T B G T B G T B G T1 Andhra Pradesh 93.8 94.2 94.0 92.9 94.5 93.7 94.8 94.7 94.7 94.8 95.0 94.9 90.0 90.2 90.1 93.3 93.7 93.52 Assam 85.4 86.8 86.1 92.0 91.3 91.6 92.4 93.2 92.8 86.7 88.1 87.4 - - - 89.0 89.7 89.33 Bihar 72.5 73.1 72.8 83.1 81.7 82.4 85.7 87.3 86.5 90.2 89.8 90.0 88.7 89.4 89.0 83.7 83.7 83.74 Chhattisgarh 88.9 88.7 88.8 90.0 93.5 91.8 89.7 90.4 90.0 92.5 92.0 92.3 85.8 84.8 85.4 89.4 90.2 89.85 Delhi 97.0 96.5 96.7 97.5 97.0 97.2 97.1 96.4 96.7 98.3 98.2 98.2 80.4 75.8 77.8 94.3 93.1 93.66 Gujarat 90.3 89.8 90.1 89.9 92.8 91.3 89.9 92.0 90.8 90.2 92.0 91.0 - - - 90.1 91.6 90.87 Haryana 95.8 95.4 95.6 95.6 96.7 96.1 95.8 95.8 95.8 95.9 96.6 96.2 91.5 92.4 91.9 95.0 95.4 95.28 Himachal Pradesh 99.0 98.2 98.6 98.9 98.3 98.6 99.6 98.9 99.3 98.8 99.0 98.9 94.4 95.1 94.7 98.0 97.9 98.09 Jammu & Kashmir 90.9 91.5 91.2 96.0 92.4 94.3 96.6 94.5 95.7 98.6 97.1 97.9 94.4 91.3 93.1 95.2 93.2 94.310 Jharkhand 73.2 72.0 72.6 83.1 81.4 82.2 83.3 85.3 84.3 86.1 86.7 86.4 86.0 87.3 86.7 82.2 82.5 82.411 Karnataka 98.0 98.3 98.1 98.3 98.5 98.4 98.6 99.2 98.9 98.2 98.2 98.2 96.0 96.3 96.1 97.8 98.1 97.912 Kerala 98.3 99.5 98.9 98.4 99.2 98.8 98.8 99.3 99.0 83.8 83.1 83.4 - - - 94.5 95.0 94.713 Madhya Pradesh 83.5 83.7 83.6 88.1 86.5 87.3 90.3 87.1 88.7 88.0 90.3 89.1 86.4 85.6 86.0 87.2 86.6 86.914 Maharashtra 96.0 96.2 96.1 97.0 97.6 97.3 98.4 98.5 98.4 94.6 94.4 94.5 - - - 96.5 96.6 96.615 Orissa 87.8 89.2 88.5 95.6 95.6 95.6 96.6 96.9 96.7 97.0 96.0 96.5 93.0 93.6 93.3 93.9 94.1 94.016 Punjab 84.3 85.9 85.0 88.8 90.1 89.4 89.7 89.9 89.8 90.0 91.9 90.9 87.3 87.9 87.6 88.1 89.1 88.617 Rajasthan 78.4 77.7 78.1 79.5 82.2 80.7 86.3 84.0 85.3 88.6 86.0 87.5 88.4 87.4 87.9 83.8 83.1 83.518 Tamil Nadu 96.3 97.8 97.0 97.6 97.9 97.7 98.4 98.7 98.6 99.1 98.7 98.9 91.9 95.1 93.4 96.5 97.6 97.019 Uttar Pradesh 90.2 96.3 93.9 93.2 94.9 94.1 93.5 95.7 94.7 94.6 96.1 95.4 81.3 81.6 81.5 90.8 93.2 92.120 Uttarakhand 96.2 97.0 96.6 97.0 98.6 97.7 97.8 99.0 98.4 98.2 99.0 98.6 94.8 95.7 95.2 96.8 97.9 97.3<strong>21</strong> West Bengal 72.7 73.4 73.0 85.5 87.9 86.6 90.1 89.6 89.9 87.3 88.8 88.0 - - - 83.1 84.2 83.6All States 85.9 88.5 87.2 90.6 91.7 91.2 92.4 93.1 92.8 92.7 93.5 93.1 87.2 86.7 87.0 89.8 90.8 90.3153
Table 4.4.3 Grade wise promotion rate by gender in upper primary grades as on 30th Sep 20092008-09Sr.Average UpperStateGrade 5 Grade 6 Grade 7 Grade 8NoPrimary StageB G T B G T B G T B G T B G T1 Andhra Pradesh - - - 95.7 97.9 96.9 93.8 93.8 93.8 - - - 94.7 95.8 95.22 Assam 87.7 92.9 89.9 82.0 86.9 84.1 82.6 84.7 83.5 - - - 84.2 88.3 86.03 Bihar - - - 93.4 93.1 93.2 91.6 92.9 92.2 96.3 97.9 97.0 93.7 94.5 94.04 Chhattisgarh - - - 90.0 94.5 92.0 90.9 95.1 93.1 93.9 94.8 94.3 91.6 94.8 93.15 Delhi - - - 98.7 98.9 98.8 98.7 96.9 97.9 96.3 97.7 96.9 97.9 97.8 97.96 Gujarat 91.5 92.9 92.1 91.3 92.1 91.7 86.1 87.9 87.0 - - - 89.7 91.0 90.37 Haryana - - - 92.0 91.0 91.5 90.6 93.7 92.2 95.7 93.5 94.6 92.7 92.7 92.78 Himachal Pradesh - - - 94.1 94.2 94.2 95.1 95.1 95.1 90.2 88.8 89.5 93.1 92.5 92.99 Jammu & Kashmir - - - 92.9 93.3 93.1 95.4 95.5 95.5 89.9 91.3 90.5 92.7 93.3 93.010 Jharkhand - - - 83.4 86.1 84.6 86.8 86.5 86.7 93.0 95.7 94.2 87.1 88.7 87.811 Karnataka - - - 98.1 98.8 98.4 88.2 85.7 87.0 - - - 93.1 92.4 92.812 Kerala 98.5 98.2 98.4 99.4 99.5 99.5 90.8 91.7 91.2 - - - 96.0 96.5 96.<strong>21</strong>3 Madhya Pradesh - - - 82.0 84.5 83.4 90.5 94.3 92.7 93.9 95.0 94.5 87.9 90.6 89.414 Maharashtra 95.0 96.6 95.7 96.8 97.2 97.0 94.6 95.1 94.8 - - - 95.5 96.3 95.915 Orissa - - - 96.1 94.9 95.5 82.7 84.0 83.3 - - - 89.5 89.7 89.616 Punjab - - - 86.6 91.0 88.6 90.0 91.8 90.9 71.7 80.4 75.2 81.5 87.5 84.<strong>21</strong>7 Rajasthan - - - 79.8 81.4 80.5 82.2 83.3 82.7 84.5 88.8 86.2 82.2 84.4 83.118 Tamil Nadu - - - 96.3 97.5 96.9 96.8 96.5 96.7 96.0 97.6 96.9 96.4 97.2 96.819 Uttar Pradesh - - - 95.3 96.6 96.0 93.9 96.3 95.2 99.5 99.9 99.7 96.2 97.6 96.920 Uttarakhand - - - 94.2 96.9 95.5 95.9 96.3 96.1 99.0 99.7 99.4 96.3 97.7 97.0<strong>21</strong> West Bengal 79.7 83.0 81.6 83.8 91.7 88.6 87.2 90.6 89.2 90.4 93.2 92.1 84.7 89.3 87.4All States - - - 91.2 92.8 92.0 90.4 92.2 91.2 94.4 96.5 95.4 91.7 93.5 92.5# For grade it is the pass out rate and not the promotion rate as house visit was not made to ascertain the whether the student continued in the next grade154
Sr.NoStateTable 4.4.4 Grade wise promotion rate by gender in upper primary grades as on 30th Sep 20102009-10Grade 5 Grade 6 Grade 7 Grade 8Average UpperPrimary StageB G T B G T B G T B G T B G T1 Andhra Pradesh - - - 96.4 97.2 96.9 94.0 96.2 95.1 - - - 95.1 96.7 96.02 Assam 86.4 91.0 88.4 92.5 93.6 93.0 86.9 90.1 88.5 - - - 88.6 91.5 89.93 Bihar - - - 92.7 94.7 93.6 94.0 95.6 94.7 97.0 98.2 97.5 94.5 96.0 95.24 Chhattisgarh - - - 86.2 96.0 90.0 94.6 93.4 94.1 95.9 97.7 96.8 91.8 95.8 93.65 Delhi - - - 99.0 98.8 98.9 98.8 97.9 98.4 99.0 99.4 99.2 98.9 98.7 98.86 Gujarat 92.0 91.8 91.9 92.6 94.4 93.4 88.8 89.0 88.9 - - - 91.1 91.7 91.47 Haryana - - - 96.5 95.7 96.1 94.2 96.6 95.4 98.5 98.5 98.5 96.4 96.9 96.78 Himachal Pradesh - - - 98.9 95.3 97.3 99.7 99.4 99.6 93.6 96.8 95.0 97.3 97.1 97.39 Jammu & Kashmir - - - 97.7 97.2 97.5 98.2 98.1 98.1 93.9 92.9 93.4 96.7 96.1 96.410 Jharkhand - - - 88.4 89.3 88.8 87.5 91.6 89.5 88.6 95.6 91.8 88.1 91.7 89.811 Karnataka - - - 97.5 98.1 97.8 89.3 91.2 90.2 - - - 93.3 94.6 93.912 Kerala 99.4 99.2 99.3 99.8 99.2 99.5 88.6 89.8 89.2 - - - 95.8 95.9 95.913 Madhya Pradesh - - - 87.2 90.4 89.0 92.1 94.1 93.2 91.3 97.3 94.8 90.0 93.7 92.114 Maharashtra 93.2 96.6 94.8 95.2 95.9 95.5 94.6 96.8 95.7 - - - 94.4 96.4 95.415 Orissa - - - 97.3 96.9 97.1 86.1 90.5 88.3 - - - 91.6 93.5 92.516 Punjab - - - 89.0 89.6 89.2 91.8 88.8 90.4 78.6 84.7 81.3 86.0 87.5 86.717 Rajasthan - - - 84.8 84.3 84.6 88.6 90.5 89.4 86.3 87.9 87.0 86.6 87.5 87.018 Tamil Nadu - - - 94.7 95.6 95.2 96.1 96.3 96.2 96.2 96.3 96.2 95.7 96.1 95.919 Uttar Pradesh - - - 96.4 98.1 97.3 94.8 97.2 96.1 96.2 98.6 97.5 95.8 98.0 97.020 Uttarakhand - - - 98.0 99.7 98.7 97.9 99.4 98.6 99.0 99.9 99.4 98.3 99.7 99.0<strong>21</strong> West Bengal 85.2 88.3 87.0 84.7 87.6 86.4 88.2 92.2 90.5 90.7 95.9 93.8 86.9 90.6 89.1All States - - - 92.9 94.4 93.7 92.1 94.2 93.1 94.0 96.8 95.3 92.9 94.9 93.9# For grade it is the pass out rate and not the promotion rate as house visit was not made to ascertain the whether the student continued in the next grade155
Table 4.4.5 Grade wise repetition rate by gender in primary grades as on 30th Sep 20092008-09Sr.Average PrimaryStateGrade 1 Grade 2 Grade 3 Grade 4 Grade 5NoStageB G T B G T B G T B G T B G T B G T1 Andhra Pradesh 5.4 4.3 4.9 2.9 4.4 3.6 3.7 2.5 3.1 6.1 2.8 4.4 1.4 0.8 1.1 3.9 3.0 3.42 Assam 15.8 17.5 16.6 11.9 13.4 12.6 9.8 8.0 8.9 6.7 4.1 5.4 - - - 11.4 11.0 11.23 Bihar 25.0 27.0 26.0 13.6 15.2 14.4 9.9 11.2 10.5 9.0 9.0 9.0 7.2 6.7 6.9 13.4 14.7 14.04 Chhattisgarh 12.6 9.3 10.8 6.4 6.5 6.4 8.4 5.4 7.0 4.2 4.2 4.2 2.9 2.0 2.5 7.4 6.2 6.85 Delhi 2.6 2.0 2.3 2.4 2.2 2.3 3.3 1.7 2.4 1.3 1.4 1.3 0.4 0.4 0.4 2.1 1.6 1.86 Gujarat 11.4 7.8 9.8 7.8 6.5 7.2 8.4 7.0 7.8 6.7 4.9 5.8 - - - 8.6 6.5 7.67 Haryana 5.1 5.0 5.1 6.1 3.7 5.0 7.1 5.1 6.2 7.2 3.7 5.6 2.4 2.5 2.5 5.5 4.1 4.98 Himachal Pradesh 3.9 3.3 3.6 1.9 2.5 2.2 2.8 1.9 2.4 2.3 1.8 2.1 0.7 0.8 0.8 2.4 2.1 2.29 Jammu & Kashmir 8.7 11.9 10.3 5.2 5.9 5.5 3.0 2.4 2.7 3.8 3.9 3.8 1.5 0.8 1.2 4.4 5.4 4.910 Jharkhand 29.5 30.1 29.8 16.5 14.4 15.4 12.8 14.6 13.7 9.7 10.8 10.2 8.4 7.7 8.1 15.7 15.7 15.711 Karnataka 1.8 1.8 1.8 1.7 1.6 1.6 1.1 0.7 0.9 0.8 0.7 0.8 0.8 0.4 0.6 1.2 1.0 1.112 Kerala 1.5 0.8 1.1 1.7 0.8 1.3 1.4 0.8 1.1 0.8 0.6 0.7 - - - 1.3 0.8 1.113 Madhya Pradesh 17.3 16.2 16.8 13.9 14.1 14.0 11.1 12.7 11.9 12.1 14.5 13.3 6.8 8.5 7.6 12.5 13.4 12.914 Maharashtra 5.7 5.8 5.7 4.2 3.7 4.0 4.0 2.3 3.2 1.2 1.5 1.4 - - - 3.8 3.3 3.615 Orissa 13.8 17.0 15.4 6.6 7.2 6.9 6.4 5.5 5.9 3.4 4.5 4.0 2.5 2.7 2.6 6.7 7.6 7.<strong>21</strong>6 Punjab 11.9 10.5 11.2 12.7 11.4 12.1 13.3 11.5 12.5 14.3 12.0 13.2 7.0 6.6 6.8 12.0 10.4 11.317 Rajasthan 22.7 22.2 22.5 16.5 15.4 16.0 16.2 14.6 15.5 8.7 10.9 9.7 6.7 6.9 6.8 14.9 14.8 14.918 Tamil Nadu 5.9 3.7 4.8 1.1 0.8 0.9 1.0 0.4 0.7 0.7 0.3 0.5 0.7 0.6 0.6 1.8 1.1 1.519 Uttar Pradesh 6.8 2.3 4.2 3.6 2.0 2.7 5.1 3.6 4.4 3.9 1.7 2.7 0.6 4.7 2.8 4.0 2.8 3.320 Uttarakhand 2.2 3.0 2.6 2.1 2.2 2.2 2.4 1.6 2.0 2.1 2.8 2.4 0.6 0.1 0.4 1.9 2.0 1.9<strong>21</strong> West Bengal 28.5 29.9 29.2 11.6 11.5 11.5 9.1 8.8 8.9 7.9 7.9 7.9 - - - 15.7 15.9 15.8All States 13.9 12.1 13.0 7.7 6.9 7.3 7.1 6.3 6.7 5.6 4.7 5.1 4.0 4.4 4.2 7.9 7.1 7.5156
Table 4.4.6 Grade wise repetition rate by gender in primary grades as on 30th Sep 20102009-10Sr.Average PrimaryStateGrade 1 Grade 2 Grade 3 Grade 4 Grade 5NoStageB G T B G T B G T B G T B G T B G T1 Andhra Pradesh 5.0 4.3 4.7 5.3 4.5 4.9 3.4 3.2 3.3 4.3 4.1 4.2 1.0 0.8 0.9 3.9 3.4 3.62 Assam 13.0 11.4 12.3 7.1 7.5 7.3 6.2 5.9 6.1 5.6 5.7 5.6 - - - 8.2 7.8 8.03 Bihar 25.0 24.6 24.8 14.7 15.9 15.3 11.7 10.0 10.8 8.0 8.1 8.1 5.1 4.5 4.8 13.3 13.3 13.34 Chhattisgarh 8.1 8.9 8.5 7.8 5.5 6.6 7.2 7.2 7.2 5.0 5.5 5.2 1.2 0.5 0.9 6.0 5.5 5.85 Delhi 2.7 3.2 3.0 2.2 2.7 2.5 2.7 2.5 2.6 1.6 1.6 1.6 0.3 0.9 0.6 1.9 2.2 2.16 Gujarat 9.3 9.7 9.5 9.6 6.8 8.3 9.4 7.0 8.3 7.5 5.8 6.7 - - - 8.9 7.3 8.27 Haryana 3.6 3.6 3.6 4.1 2.4 3.3 3.6 3.2 3.4 3.3 2.9 3.1 1.8 1.2 1.5 3.3 2.7 3.08 Himachal Pradesh 1.0 1.1 1.0 0.7 1.4 1.0 0.1 0.6 0.4 0.5 0.6 0.6 0.3 0.3 0.3 0.5 0.8 0.69 Jammu & Kashmir 8.4 7.6 8.1 2.9 7.1 4.9 2.9 5.2 3.9 1.3 2.6 1.9 1.6 3.4 2.4 3.6 5.4 4.410 Jharkhand 24.4 25.4 24.9 14.6 16.6 15.6 14.5 12.8 13.6 11.8 11.8 11.8 6.7 7.0 6.8 14.6 14.8 14.711 Karnataka 1.0 0.7 0.8 0.4 0.4 0.4 0.3 0.3 0.3 0.7 0.6 0.6 0.5 0.2 0.4 0.6 0.4 0.512 Kerala 1.5 0.5 1.0 1.6 0.8 1.2 1.2 0.7 1.0 0.9 1.2 1.0 - - - 1.3 0.8 1.113 Madhya Pradesh 14.0 14.1 14.1 10.4 11.9 11.2 8.0 11.6 9.8 11.1 8.7 9.9 5.7 6.5 6.1 10.0 10.7 10.314 Maharashtra 1.9 2.5 2.2 2.3 1.8 2.1 1.0 1.2 1.1 0.4 0.7 0.5 - - - 1.4 1.6 1.515 Orissa 11.6 10.5 11.0 3.9 4.1 4.0 2.8 2.8 2.8 2.6 3.4 3.0 1.6 1.9 1.7 4.7 4.8 4.716 Punjab 12.0 11.6 11.8 9.2 7.3 8.3 7.5 7.6 7.5 6.7 6.3 6.5 2.7 4.3 3.4 7.6 7.4 7.517 Rajasthan 18.7 20.0 19.3 18.2 15.8 17.1 11.0 14.6 12.7 8.6 12.0 10.1 5.0 6.1 5.5 12.8 14.2 13.418 Tamil Nadu 2.9 1.9 2.4 2.2 1.6 1.9 0.9 0.7 0.8 0.4 0.9 0.7 0.5 0.5 0.5 1.3 1.1 1.<strong>21</strong>9 Uttar Pradesh 7.0 3.0 4.5 4.1 3.8 3.9 4.2 3.5 3.8 4.2 3.2 3.6 0.4 0.3 0.4 3.9 2.8 3.320 Uttarakhand 2.7 2.2 2.4 1.3 0.9 1.1 0.8 0.7 0.7 0.6 0.2 0.4 0.3 0.3 0.3 1.1 0.9 1.0<strong>21</strong> West Bengal 26.0 24.9 25.5 13.3 11.1 12.3 8.9 9.8 9.3 5.7 4.4 5.1 - - - 14.5 13.4 14.0All States 12.2 10.3 11.2 7.8 7.1 7.4 6.0 5.7 5.9 5.0 4.6 4.8 3.2 2.7 3.0 7.0 6.3 6.6157
Table 4.4.7 Grade wise repetition rate by gender in upper primary grades as on 30th Sep 20092008-09Sr.Average Upper PrimaryStateGrade 5 Grade 6 Grade 7 Grade 8NoStageB G T B G T B G T B G T B G T1 Andhra Pradesh - - - 3.0 0.8 1.9 1.4 0.3 0.9 - - - 2.2 0.6 1.42 Assam 10.5 5.9 8.6 14.7 10.7 12.9 7.9 5.0 6.6 - - - 11.1 7.2 9.43 Bihar - - - 5.5 5.8 5.6 6.1 5.6 5.9 3.2 2.0 2.7 5.0 4.6 4.84 Chhattisgarh - - - 7.9 3.9 6.1 6.8 3.7 5.2 4.9 4.7 4.8 6.5 4.1 5.45 Delhi - - - 1.2 1.1 1.2 1.2 1.2 1.2 3.6 2.2 3.0 2.0 1.5 1.86 Gujarat 8.0 6.4 7.2 8.0 7.0 7.5 4.4 3.4 3.9 - - - 6.8 5.6 6.27 Haryana - - - 7.6 8.3 8.0 9.1 5.6 7.4 4.1 6.1 5.1 7.0 6.7 6.88 Himachal Pradesh - - - 3.9 4.2 4.0 3.5 3.0 3.3 9.1 10.6 9.8 5.5 6.1 5.89 Jammu & Kashmir - - - 6.1 5.3 5.8 3.6 4.1 3.8 9.6 8.6 9.2 6.5 6.0 6.310 Jharkhand - - - 14.6 12.9 13.8 9.7 9.4 9.6 6.1 3.9 5.2 10.7 9.5 10.111 Karnataka - - - 0.7 0.5 0.6 0.3 0.3 0.3 - - - 0.5 0.4 0.412 Kerala 1.3 1.7 1.5 0.6 0.3 0.5 0.6 1.0 0.7 - - - 0.8 1.0 0.913 Madhya Pradesh - - - 15.2 13.9 14.4 7.5 4.7 5.9 5.7 4.3 4.9 10.2 8.2 9.114 Maharashtra 3.8 2.7 3.3 2.4 2.4 2.4 2.2 1.3 1.8 - - - 2.7 2.1 2.415 Orissa - - - 2.7 2.0 2.4 10.6 10.4 10.5 - - - 6.6 6.1 6.316 Punjab - - - 12.5 8.7 10.8 9.2 8.0 8.6 27.7 19.3 24.3 17.8 12.2 15.317 Rajasthan - - - 16.9 15.1 16.2 13.8 12.5 13.3 14.7 10.6 13.1 15.2 12.8 14.<strong>21</strong>8 Tamil Nadu - - - 1.5 1.3 1.4 1.5 2.4 2.0 2.5 1.9 2.2 1.8 1.9 1.819 Uttar Pradesh - - - 1.1 2.3 1.7 4.3 1.5 2.8 0.1 0.0 0.1 2.0 1.3 1.620 Uttarakhand - - - 3.0 2.5 2.8 2.2 2.6 2.4 0.5 0.1 0.3 1.9 1.7 1.8<strong>21</strong> West Bengal 19.3 16.6 17.7 15.9 8.1 11.2 12.2 9.2 10.4 9.4 6.5 7.6 14.8 10.4 12.2All States - - - 6.8 5.9 6.4 5.8 4.2 5.0 5.1 3.2 4.2 6.0 4.6 5.4158
Table 4.4.8 Grade wise repetition rate by gender in upper primary grades as on 30th Sep 20102009-10Sr.Average UpperStateGrade 5 Grade 6 Grade 7 Grade 8NoPrimary StageB G T B G T B G T B G T B G T1 Andhra Pradesh - - - 2.7 0.6 1.5 3.2 0.3 1.7 - - - 3.0 0.5 1.62 Assam 13.0 4.2 9.2 5.8 4.5 5.2 6.7 4.4 5.6 - - - 8.7 4.4 6.73 Bihar - - - 5.4 4.2 4.9 4.5 3.4 4.0 2.4 1.4 2.0 4.1 3.1 3.74 Chhattisgarh - - - 5.1 1.9 3.9 2.9 4.3 3.5 1.2 1.6 1.4 3.3 2.6 3.05 Delhi - - - 0.8 1.0 0.9 0.9 1.2 1.1 0.9 0.2 0.6 0.9 0.8 0.96 Gujarat 7.5 7.8 7.6 7.0 5.3 6.2 2.7 4.1 3.3 - - - 5.6 5.7 5.77 Haryana - - - 3.3 3.9 3.6 5.6 3.3 4.5 1.3 1.2 1.2 3.5 2.8 3.18 Himachal Pradesh - - - 0.4 0.5 0.4 0.1 0.1 0.1 6.1 3.1 4.8 2.3 1.3 1.89 Jammu & Kashmir - - - 1.2 2.4 1.7 1.3 1.7 1.4 6.1 6.5 6.3 2.8 3.4 3.110 Jharkhand - - - 7.9 9.0 8.5 7.6 7.4 7.5 7.2 3.6 5.5 7.6 7.0 7.311 Karnataka - - - 0.5 0.5 0.5 0.2 0.2 0.2 - - - 0.3 0.4 0.412 Kerala 0.6 0.7 0.7 0.2 0.8 0.4 0.4 0.2 0.3 - - - 0.4 0.6 0.513 Madhya Pradesh - - - 9.8 8.0 8.8 6.3 4.1 5.1 3.8 1.8 2.7 6.9 4.9 5.714 Maharashtra 6.5 3.3 5.0 4.5 3.9 4.2 0.4 0.4 0.4 - - - 3.6 2.5 3.115 Orissa - - - 1.6 1.2 1.4 4.8 2.1 3.4 - - - 3.2 1.6 2.516 Punjab - - - 9.3 8.6 9.0 7.1 7.6 7.3 20.6 15.2 18.2 12.9 10.7 11.917 Rajasthan - - - 13.3 12.5 13.0 9.4 7.1 8.4 11.2 10.8 11.1 11.3 10.2 10.818 Tamil Nadu - - - 2.5 2.6 2.5 2.6 2.0 2.3 2.1 1.8 1.9 2.4 2.1 2.<strong>21</strong>9 Uttar Pradesh - - - 1.4 1.0 1.2 3.0 1.5 2.2 2.1 0.6 1.3 2.2 1.0 1.620 Uttarakhand - - - 0.4 0.0 0.2 0.6 0.2 0.4 0.4 0.0 0.2 0.5 0.1 0.3<strong>21</strong> West Bengal 14.6 11.6 12.9 14.7 12.1 13.1 11.3 7.6 9.1 9.0 4.0 6.1 12.7 9.2 10.6All States - - - 5.1 4.3 4.7 4.1 3.0 3.6 4.2 2.4 3.4 4.5 3.3 4.0159
Table 4.4.9 Grade wise dropouts rate by gender in primary grades as on 30th Sep 2009Sr.NoGrade 1 Grade 2 Grade 3 Grade 4 Grade 5Average PrimaryStageStateB G T B G T B G T B G T B G T B G T1 Andhra Pradesh 2.2 1.5 1.9 1.5 1.1 1.3 1.1 1.7 1.4 1.4 1.1 1.2 10.9 8.4 9.7 3.3 2.7 3.02 Assam 1.5 1.1 1.3 1.4 1.7 1.5 2.0 1.0 1.5 8.4 9.2 8.8 - - - 3.1 3.2 3.23 Bihar 2.8 2.9 2.9 2.5 2.4 2.4 2.4 2.3 2.3 2.9 2.0 2.4 8.4 6.9 7.8 3.7 3.1 3.44 Chhattisgarh 1.0 0.8 0.9 1.3 1.8 1.5 2.2 1.3 1.8 1.9 1.0 1.5 10.5 13.5 11.9 3.0 3.0 3.05 Delhi 0.7 0.9 0.9 0.8 1.8 1.3 0.5 0.3 0.4 0.4 0.5 0.5 9.1 12.4 11.1 2.1 3.0 2.76 Gujarat 0.4 0.2 0.3 0.2 0.3 0.3 0.6 0.6 0.6 3.0 2.8 2.9 - - - 1.0 1.0 1.07 Haryana 0.2 0.1 0.2 0.8 0.5 0.6 1.0 0.9 0.9 0.7 0.5 0.6 9.8 7.4 8.7 2.5 1.8 2.18 Himachal Pradesh 0.2 0.3 0.2 0.6 0.1 0.3 0.1 0.3 0.2 0.1 0.1 0.1 5.5 6.9 6.1 1.3 1.6 1.49 Jammu & Kashmir 0.6 0.8 0.7 0.8 0.0 0.4 1.0 0.6 0.8 0.9 1.5 1.2 2.9 3.2 3.1 1.3 1.3 1.310 Jharkhand 3.1 3.8 3.5 2.8 2.7 2.8 2.9 2.7 2.8 3.0 2.2 2.6 7.1 4.3 5.8 3.8 3.1 3.511 Karnataka 1.2 1.3 1.3 0.9 1.0 1.0 0.7 0.7 0.7 1.2 1.3 1.2 5.1 3.2 4.2 1.8 1.5 1.612 Kerala 0.3 0.1 0.2 0.0 0.1 0.0 0.1 0.1 0.1 10.5 8.4 9.5 - - - 2.9 2.4 2.713 Madhya Pradesh 1.6 1.2 1.4 2.0 1.3 1.6 2.5 1.5 2.0 1.8 0.5 1.2 9.0 13.0 10.9 3.2 3.2 3.<strong>21</strong>4 Maharashtra 0.7 0.5 0.6 0.6 0.2 0.4 0.4 0.1 0.3 5.7 6.5 6.1 - - - 1.8 1.8 1.815 Orissa 1.5 0.8 1.2 0.9 1.3 1.1 0.5 2.0 1.2 0.9 0.5 0.7 9.9 9.5 9.7 2.7 2.8 2.716 Punjab 3.5 2.5 3.0 3.0 1.8 2.5 2.5 4.4 3.3 2.2 1.5 1.9 6.8 7.0 6.9 3.5 3.4 3.417 Rajasthan 2.1 1.7 1.9 2.4 2.0 2.2 1.8 2.6 2.2 1.6 2.3 1.9 9.1 9.4 9.2 3.2 3.2 3.<strong>21</strong>8 Tamil Nadu 0.7 0.5 0.6 0.8 0.4 0.6 0.6 0.5 0.6 0.6 0.9 0.7 10.2 8.7 9.5 2.8 2.3 2.619 Uttar Pradesh 1.3 0.7 1.0 0.9 1.1 1.0 0.9 0.8 0.8 0.7 0.7 0.7 7.3 11.8 9.7 2.1 2.7 2.420 Uttarakhand 2.2 1.4 1.8 1.7 1.3 1.5 1.6 1.0 1.3 1.2 1.3 1.2 6.7 8.5 7.5 2.6 2.5 2.6<strong>21</strong> West Bengal 2.2 1.7 2.0 1.8 1.8 1.8 1.7 2.0 1.8 11.3 11.1 11.2 - - - 4.0 3.8 3.9All States 1.6 1.3 1.5 1.4 1.4 1.4 1.3 1.3 1.3 2.6 2.2 2.4 7.3 8.6 7.9 2.7 2.7 2.7160
Table 4.4.10 Grade wise dropouts rate by gender in primary grades as on 30th Sep 2010Average PrimaryGrade 1 Grade 2 Grade 3 Grade 4 Grade 5Sr. No StateStageB G T B G T B G T B G T B G T B G T1 Andhra Pradesh 1.2 1.5 1.3 1.8 0.9 1.4 1.8 2.1 2.0 0.9 0.9 0.9 9.0 9.0 9.0 2.8 2.9 2.92 Assam 1.5 1.8 1.7 1.0 1.2 1.1 1.4 0.9 1.2 7.8 6.2 7.0 - - - 2.8 2.5 2.63 Bihar 2.5 2.2 2.3 2.2 2.4 2.3 2.7 2.7 2.7 1.8 2.0 1.9 6.2 6.2 6.2 3.0 3.0 3.04 Chhattisgarh 3.1 2.4 2.8 2.3 1.0 1.6 3.0 2.4 2.7 2.4 2.5 2.5 12.9 14.7 13.7 4.6 4.2 4.45 Delhi 0.3 0.3 0.3 0.3 0.3 0.3 0.2 1.1 0.7 0.1 0.2 0.2 19.3 23.3 <strong>21</strong>.6 3.8 4.7 4.36 Gujarat 0.4 0.5 0.4 0.5 0.4 0.4 0.8 1.0 0.8 2.3 2.2 2.3 - - - 1.0 1.0 1.07 Haryana 0.6 1.0 0.8 0.3 0.9 0.6 0.6 1.0 0.8 0.8 0.4 0.7 6.7 6.4 6.5 1.7 1.9 1.88 Himachal Pradesh 0.0 0.7 0.3 0.4 0.3 0.4 0.3 0.5 0.4 0.6 0.4 0.5 5.3 4.6 5.0 1.5 1.2 1.49 Jammu & Kashmir 0.6 0.8 0.7 1.1 0.5 0.8 0.5 0.3 0.4 0.1 0.3 0.2 3.9 5.3 4.5 1.2 1.4 1.310 Jharkhand 2.4 2.6 2.5 2.3 2.0 2.1 2.2 1.9 2.1 2.1 1.6 1.8 7.3 5.7 6.5 3.2 2.7 3.011 Karnataka 1.0 1.0 1.0 1.3 1.1 1.2 1.0 0.5 0.8 1.1 1.2 1.1 3.5 3.4 3.5 1.6 1.5 1.512 Kerala 0.2 0.0 0.1 0.0 0.0 0.0 0.0 0.0 0.0 15.3 15.7 15.5 - - - 4.2 4.3 4.<strong>21</strong>3 Madhya Pradesh 2.5 2.2 2.3 1.5 1.6 1.5 1.7 1.3 1.5 0.9 1.0 0.9 7.9 7.9 7.9 2.8 2.7 2.814 Maharashtra 2.1 1.2 1.7 0.7 0.6 0.7 0.6 0.3 0.4 5.0 4.8 4.9 - - - 2.1 1.8 2.015 Orissa 0.6 0.3 0.5 0.4 0.3 0.4 0.6 0.3 0.5 0.4 0.6 0.5 5.5 4.5 5.0 1.5 1.2 1.316 Punjab 3.8 2.6 3.2 2.0 2.6 2.3 2.8 2.5 2.6 3.3 1.8 2.6 10.1 7.8 9.0 4.4 3.5 3.917 Rajasthan 2.9 2.3 2.6 2.4 2.0 2.2 2.7 1.3 2.1 2.9 2.0 2.5 6.6 6.6 6.6 3.4 2.7 3.118 Tamil Nadu 0.8 0.3 0.6 0.3 0.6 0.4 0.7 0.6 0.6 0.5 0.4 0.4 7.6 4.4 6.0 2.2 1.3 1.719 Uttar Pradesh 2.8 0.7 1.5 2.7 1.3 1.9 2.3 0.8 1.5 1.2 0.7 1.0 18.3 18.1 18.1 5.3 4.0 4.620 Uttarakhand 1.1 0.8 1.0 1.7 0.5 1.1 1.4 0.3 0.9 1.2 0.8 1.0 4.9 4.0 4.5 2.1 1.2 1.7<strong>21</strong> West Bengal 1.3 1.7 1.5 1.1 1.0 1.1 1.0 0.7 0.8 7.0 6.8 6.9 - - - 2.4 2.5 2.5All States 1.9 1.3 1.6 1.6 1.2 1.4 1.6 1.1 1.4 2.3 1.9 2.1 9.5 10.6 10.1 3.2 3.0 3.1161
Table 4.4.11 Grade wise dropouts rate by gender in upper primary grades as on 30th Sept. 2009Average Upper PrimaryGrade 5 Grade 6 Grade 7 Grade 8Sr. NoStateStageB G T B G T B G T B G T B G T1 Andhra Pradesh - - - 1.2 1.3 1.2 4.7 5.9 5.3 - - - 3.1 3.7 3.42 Assam 1.8 1.2 1.6 3.3 2.4 2.9 9.5 10.3 9.9 - - - 4.7 4.5 4.63 Bihar - - - 1.2 1.1 1.1 2.3 1.5 1.9 0.5 0.1 0.3 1.3 0.9 1.14 Chhattisgarh - - - 2.1 1.6 1.9 2.3 1.2 1.7 1.3 0.5 0.9 1.9 1.1 1.55 Delhi - - - 0.0 0.0 0.0 0.1 1.9 0.9 0.0 0.0 0.0 0.0 0.7 0.36 Gujarat 0.5 0.7 0.6 0.7 0.9 0.8 9.5 8.7 9.1 - - - 3.5 3.5 3.57 Haryana - - - 0.4 0.6 0.5 0.2 0.6 0.4 0.3 0.4 0.3 0.3 0.6 0.48 Himachal Pradesh - - - 2.0 1.6 1.8 1.4 2.0 1.7 0.7 0.7 0.7 1.4 1.4 1.49 Jammu & Kashmir - - - 1.0 1.4 1.2 0.9 0.4 0.7 0.5 0.1 0.3 0.8 0.7 0.710 Jharkhand - - - 2.0 1.0 1.6 3.5 4.1 3.8 0.8 0.4 0.6 2.2 1.9 2.111 Karnataka - - - 1.2 0.7 1.0 11.5 14.0 12.7 - - - 6.4 7.2 6.812 Kerala 0.1 0.0 0.1 0.0 0.1 0.1 8.7 7.3 8.1 - - - 3.2 2.5 2.913 Madhya Pradesh - - - 2.8 1.6 2.2 2.0 1.0 1.4 0.4 0.7 0.6 1.9 1.2 1.514 Maharashtra 1.2 0.7 1.0 0.8 0.3 0.6 3.2 3.5 3.4 - - - 1.8 1.6 1.715 Orissa - - - 1.2 3.0 2.1 6.7 5.6 6.2 - - - 3.9 4.3 4.116 Punjab - - - 0.8 0.3 0.6 0.8 0.2 0.5 0.6 0.3 0.5 0.7 0.3 0.517 Rajasthan - - - 3.2 3.5 3.3 4.0 4.2 4.1 0.8 0.6 0.7 2.7 2.8 2.718 Tamil Nadu - - - 2.2 1.3 1.7 1.7 1.0 1.4 1.5 0.5 1.0 1.8 1.0 1.319 Uttar Pradesh - - - 3.6 1.1 2.3 1.8 2.2 2.0 0.3 0.1 0.2 1.9 1.2 1.520 Uttarakhand - - - 2.9 0.6 1.7 1.8 1.0 1.4 0.5 0.2 0.3 1.8 0.6 1.2<strong>21</strong> West Bengal 1.0 0.4 0.7 0.2 0.2 0.2 0.5 0.2 0.3 0.2 0.3 0.2 0.5 0.3 0.4All States - - - 1.9 1.3 1.6 3.8 3.6 3.7 0.5 0.3 0.4 2.3 1.9 2.1162
Table 4.4.12 Grade wise dropouts rate by gender in upper primary grades as on 30th Sept. 2010Sr.NoGrade 5 Grade 6 Grade 7 Grade 8Average UpperPrimary StageStateB G T B G T B G T B G T B G T1 Andhra Pradesh - - - 0.8 2.2 1.6 2.8 3.5 3.2 - - - 1.9 2.8 2.42 Assam 0.6 4.8 2.4 1.7 2.0 1.8 6.4 5.5 5.9 - - - 2.7 4.1 3.33 Bihar - - - 2.0 1.1 1.6 1.5 1.0 1.3 0.6 0.4 0.5 1.4 0.9 1.24 Chhattisgarh - - - 8.7 2.0 6.1 2.5 2.3 2.4 2.9 0.7 1.7 5.0 1.6 3.45 Delhi - - - 0.2 0.3 0.2 0.2 0.9 0.5 0.1 0.3 0.2 0.2 0.5 0.36 Gujarat 0.5 0.4 0.5 0.4 0.3 0.3 8.5 7.0 7.8 - - - 3.3 2.6 3.07 Haryana - - - 0.2 0.4 0.3 0.1 0.1 0.1 0.1 0.3 0.2 0.2 0.3 0.28 Himachal Pradesh - - - 0.7 4.2 2.2 0.2 0.5 0.3 0.3 0.1 0.2 0.4 1.6 0.99 Jammu & Kashmir - - - 1.1 0.4 0.8 0.6 0.3 0.4 0.0 0.6 0.3 0.6 0.4 0.510 Jharkhand - - - 3.7 1.7 2.7 4.9 1.0 3.0 4.3 0.9 2.7 4.2 1.2 2.811 Karnataka - - - 2.0 1.3 1.7 10.5 8.6 9.6 - - - 6.4 5.0 5.712 Kerala 0.0 0.1 0.1 0.1 0.1 0.1 11.0 10.0 10.5 - - - 3.8 3.5 3.713 Madhya Pradesh - - - 3.0 1.7 2.2 1.6 1.8 1.7 4.8 0.9 2.5 3.1 1.5 2.<strong>21</strong>4 Maharashtra 0.3 0.1 0.2 0.3 0.2 0.2 4.9 2.8 3.9 - - - 1.9 1.1 1.515 Orissa - - - 1.1 1.9 1.5 9.1 7.4 8.3 - - - 5.1 4.9 5.016 Punjab - - - 1.7 1.8 1.7 1.1 3.5 2.2 0.8 0.1 0.5 1.2 1.8 1.417 Rajasthan - - - 1.9 3.2 2.5 2.0 2.4 2.2 2.4 1.3 2.0 2.1 2.3 2.<strong>21</strong>8 Tamil Nadu - - - 2.8 1.9 2.3 1.4 1.7 1.6 1.7 2.0 1.8 1.9 1.8 1.919 Uttar Pradesh - - - 2.2 0.8 1.5 2.2 1.3 1.7 1.7 0.8 1.2 2.0 1.0 1.520 Uttarakhand - - - 1.6 0.3 1.0 1.5 0.4 1.0 0.6 0.1 0.4 1.2 0.3 0.8<strong>21</strong> West Bengal 0.1 0.1 0.1 0.6 0.3 0.4 0.5 0.3 0.4 0.2 0.1 0.2 0.4 0.2 0.3All States - - - 2.0 1.3 1.6 3.8 2.8 3.3 1.8 0.8 1.3 2.6 1.7 2.<strong>21</strong>63
Chapter 5:Annexure - ITable 5.1 Cohort dropout rate at completing primary and upper primary stage by gender and yearSr. No State YearPrimary Elementary (1-7) Elementary(1-8)Boys Girls Total Boys Girls Total Boys Girls Total1Andhra 2008-09 16.6 13.4 15.0 <strong>21</strong>.5 19.7 20.6 - - -Pradesh 2009-10 14.3 14.0 14.2 17.5 18.8 18.3 - - -2 Assam2008-09 13.6 13.3 13.5 27.6 25.9 27.0 - - -2009-10 12.2 10.4 11.1 20.3 <strong>21</strong>.3 20.4 - - -3 Bihar2008-09 20.1 18.1 19.3 - - - 23.5 20.4 22.12009-10 16.8 16.4 16.5 - - - 20.5 18.6 19.84 Chhattisgarh2008-09 16.7 18.2 17.5 - - - <strong>21</strong>.5 <strong>21</strong>.0 <strong>21</strong>.32009-10 22.8 22.1 22.3 - - - 33.7 26.0 30.05 Delhi2008-09 11.3 15.5 14.1 - - - 11.4 17.1 14.92009-10 20.1 25.0 23.0 - - - 20.4 26.1 23.56 Gujarat2008-09 4.4 4.0 4.2 14.9 14.0 14.6 - - -2009-10 4.2 4.3 4.2 13.2 11.9 12.5 - - -7 Haryana2008-09 12.5 9.4 11.2 - - - 13.4 10.8 12.32009-10 8.9 9.7 9.3 - - - 9.3 10.4 9.78Himachal 2008-09 6.5 7.6 6.8 - - - 10.4 11.6 10.6Pradesh 2009-10 6.5 6.4 6.6 - - - 7.6 10.9 9.29Jammu & 2008-09 6.3 6.1 6.4 - - - 8.4 8.0 8.6Kashmir 2009-10 6.3 7.6 6.7 - - - 8.0 8.8 8.110 Jharkhand2008-09 <strong>21</strong>.2 18.3 19.9 - - - 27.5 23.8 26.02009-10 18.1 15.6 16.8 - - - 29.5 19.3 24.611 Karnataka2008-09 8.9 7.4 8.2 20.3 20.8 20.7 - - -2009-10 7.7 7.1 7.4 19.1 16.2 17.6 - - -12 Kerala2008-09 10.9 8.8 9.8 18.8 15.6 17.3 - - -2009-10 15.6 15.9 15.8 24.9 24.5 24.8 - - -13Madhya 2008-09 17.7 18.7 18.0 - - - 22.8 <strong>21</strong>.8 22.2Pradesh 2009-10 15.4 14.6 14.8 - - - 23.8 18.7 20.714 Maharashtra2008-09 7.5 7.4 7.5 12.4 11.6 12.2 - - -2009-10 8.3 6.8 7.6 13.3 9.7 11.6 - - -15 Orissa2008-09 13.9 14.0 14.0 <strong>21</strong>.3 <strong>21</strong>.7 <strong>21</strong>.7 - - -2009-10 7.6 6.0 7.0 17.4 14.6 16.2 - - -16 Punjab2008-09 18.6 17.7 18.2 - - - <strong>21</strong>.8 19.0 20.82009-10 <strong>21</strong>.6 17.2 19.5 - - - 24.9 22.0 23.517 Rajasthan2008-09 18.5 19.4 18.6 - - - 27.3 27.8 27.12009-10 18.4 15.7 17.0 - - - 24.7 22.6 23.618 Tamil Nadu2008-09 12.5 10.8 11.7 - - - 17.2 13.3 15.32009-10 9.8 6.2 8.0 - - - 15.1 11.3 13.<strong>21</strong>9Uttar2008-09 10.8 15.3 13.1 - - - 15.8 18.2 16.9Pradesh 2009-10 25.7 <strong>21</strong>.1 22.9 - - - 30.0 23.3 26.320 Uttarakhand2008-09 12.9 13.0 12.8 - - - 17.5 14.6 15.82009-10 10.0 6.3 8.1 - - - 13.3 7.1 10.2<strong>21</strong> West Bengal2008-09 17.9 17.4 17.6 - - - 22.2 20.3 <strong>21</strong>.02009-10 10.8 10.8 10.7 - - - 13.8 12.4 13.2All States2008-09 14.2 14.8 14.5 19.3 19.1 19.2 19.6 19.4 19.52009-10 16.8 16.0 16.3 <strong>21</strong>.8 19.5 20.5 23.2 20.1 <strong>21</strong>.6164
Table 5.2 Coefficient of internal efficiency by stage and genderPrimary Elementary (1-7) Elementary(1-8)Sr. No State YearBoys Girls Total Boys Girls Total Boys Girls TotalAndhra 2008-09 82.8 86.4 84.8 81.5 83.5 82.7 - - -1Pradesh 2009-10 84.9 85.5 85.1 84.8 84.3 84.4 - - -2 Assam3 Bihar4 Chhattisgarh5 Delhi6 Gujarat7 Haryana89HimachalPradeshJammuKashmir10 Jharkhand11 Karnataka12 Kerala13MadhyaPradesh14 Maharashtra15 Orissa16 Punjab17 Rajasthan18 Tamil Nadu19UttarPradesh20 Uttarakhand<strong>21</strong> West BengalAll States&2008-09 78.3 78.7 78.4 70.5 72.5 71.2 - - -2009-10 82.7 84.7 83.6 78.3 79.3 79.0 - - -2008-09 73.6 74.6 73.9 - - - 77.1 79.2 78.22009-10 76.4 76.5 76.5 - - - 79.7 81.1 80.32008-09 79.7 79.2 79.4 - - - 80.0 82.2 81.12009-10 76.9 76.6 76.9 - - - 73.1 79.5 75.92008-09 88.0 84.8 86.1 - - - 91.1 87.8 89.42009-10 78.8 74.1 76.1 - - - 84.9 80.6 82.72008-09 87.7 90.1 89.0 80.2 82.3 81.3 - - -2009-10 88.0 89.4 88.5 82.0 84.5 83.0 - - -2008-09 83.6 87.5 85.5 - - - 86.0 88.1 87.22009-10 89.0 89.5 89.1 - - - 91.3 91.7 91.32008-09 92.0 91.0 91.4 - - - 89.5 88.8 89.22009-10 93.4 93.6 93.5 - - - 94.1 92.0 93.12008-09 90.9 90.0 90.4 - - - 89.6 90.1 89.92009-10 91.5 88.8 90.4 - - - 92.2 90.4 91.22008-09 71.4 74.0 72.7 - - - 72.1 74.9 73.32009-10 74.0 75.7 74.9 - - - 70.2 78.5 74.02008-09 91.8 93.6 92.8 82.2 81.3 81.8 - - -2009-10 93.8 94.3 93.9 83.8 86.5 85.0 - - -2008-09 88.2 90.7 89.4 84.4 87.0 85.6 - - -2009-10 83.4 83.4 83.3 79.6 80.4 79.9 - - -2008-09 75.4 72.4 74.0 - - - 76.2 75.9 76.32009-10 79.9 79.3 79.4 - - - 76.7 81.3 79.22008-09 89.9 90.0 90.0 88.4 88.9 88.5 - - -2009-10 92.3 92.7 92.5 88.8 91.7 90.2 - - -2008-09 82.3 81.1 81.6 77.9 76.8 77.3 - - -2009-10 89.2 90.1 89.5 81.6 84.0 82.7 - - -2008-09 76.6 78.0 77.2 - - - 75.7 80.4 77.72009-10 77.6 80.7 79.0 - - - 77.7 79.5 78.62008-09 73.4 72.6 72.9 - - - 70.2 70.4 70.42009-10 76.0 76.3 76.1 - - - 74.9 75.3 75.02008-09 86.7 89.0 87.9 - - - 86.4 90.0 88.42009-10 90.1 93.5 91.8 - - - 88.1 90.7 89.42008-09 87.3 83.7 85.5 - - - 86.8 86.0 86.62009-10 75.2 78.2 76.7 - - - 77.9 82.5 80.32008-09 88.7 87.6 88.2 - - - 88.0 89.9 88.92009-10 91.3 94.0 92.6 - - - 91.3 95.5 93.22008-09 71.8 71.4 71.6 - - - 75.5 78.1 77.12009-10 77.7 78.9 78.3 - - - 80.2 83.8 82.02008-09 81.8 81.5 81.6 86.0 88.0 87.1 81.2 82.2 81.62009-10 80.4 80.9 80.8 89.4 91.1 90.2 79.6 82.3 80.8165
Sr. No State Year1AndhraPradesh2 Assam3 Bihar4 Chhattisgarh5 Delhi6 Gujarat7 Haryana89HimachalPradeshJammuKashmir10 Jharkhand11 Karnataka12 Kerala13MadhyaPradesh&14 Maharashtra15 Orissa16 Punjab17 Rajasthan18 Tamil Nadu19UttarPradesh20 Uttarakhand<strong>21</strong> West BengalAll StatesTable 5.3 Average duration of <strong>study</strong> by stage and genderPrimary Elementary (1-7) Elementary(1-8)Boys Girls Total Boys Girls Total Boys Girls Total2008-09 5.2 5.2 5.2 7.2 7.2 7.2 - - -2009-10 5.2 5.2 5.2 7.3 7.2 7.2 - - -2008-09 4.5 4.5 4.5 7.9 7.7 7.8 - - -2009-10 4.4 4.3 4.3 7.6 7.5 7.6 - - -2008-09 5.8 5.8 5.8 - - - 8.9 8.9 8.92009-10 5.8 5.7 5.8 - - - 8.9 8.8 8.92008-09 5.4 5.3 5.3 - - - 8.6 8.4 8.52009-10 5.3 5.3 5.3 - - - 8.4 8.4 8.42008-09 5.1 5.1 5.1 - - - 8.2 8.1 8.12009-10 5.1 5.1 5.1 - - - 8.1 8.1 8.12008-09 4.4 4.3 4.3 7.6 7.5 7.5 - - -2009-10 4.4 4.3 4.4 7.6 7.5 7.5 - - -2008-09 5.3 5.2 5.3 - - - 8.5 8.4 8.52009-10 5.2 5.1 5.2 - - - 8.3 8.2 8.22008-09 5.1 5.1 5.1 - - - 8.3 8.3 8.32009-10 5.0 5.0 5.0 - - - 8.1 8.1 8.12008-09 5.2 5.3 5.3 - - - 8.4 8.5 8.42009-10 5.2 5.3 5.2 - - - 8.3 8.4 8.32008-09 5.9 5.9 5.9 - - - 9.2 9.2 9.22009-10 5.8 5.9 5.9 - - - 9.1 9.1 9.12008-09 5.1 5.1 5.1 7.1 7.1 7.1 - - -2009-10 5.0 5.0 5.0 7.0 7.0 7.0 - - -2008-09 4.1 4.0 4.0 7.1 7.1 7.1 - - -2009-10 4.1 4.0 4.0 7.1 7.1 7.1 - - -2008-09 5.7 5.7 5.7 - - - 8.8 8.9 8.92009-10 5.6 5.6 5.6 - - - 8.5 8.5 8.52008-09 4.2 4.1 4.1 7.1 7.1 7.1 - - -2009-10 4.1 4.1 4.1 7.0 7.0 7.0 - - -2008-09 5.4 5.4 5.4 7.1 7.1 7.1 - - -2009-10 5.2 5.2 5.2 7.1 7.0 7.1 - - -2008-09 5.7 5.6 5.6 - - - 9.0 9.0 9.02009-10 5.4 5.4 5.4 - - - 8.8 8.7 8.72008-09 5.8 5.8 5.8 - - - 7.2 7.2 7.22009-10 5.7 5.8 5.7 - - - 7.2 7.1 7.22008-09 5.1 5.1 5.1 - - - 7.5 7.5 7.52009-10 5.1 5.1 5.1 - - - 7.3 7.3 7.32008-09 5.2 5.2 5.2 - - - 9.2 9.0 9.12009-10 5.2 5.1 5.2 - - - 8.8 8.7 8.82008-09 5.1 5.1 5.1 - - - 9.3 9.2 9.32009-10 5.1 5.0 5.0 - - - 9.1 9.1 9.12008-09 4.7 4.7 4.7 - - - 8.2 8.1 8.12009-10 4.6 4.6 4.6 - - - 8.1 8.1 8.12008-09 5.4 5.4 5.4 7.6 7.5 7.5 8.3 8.2 8.22009-10 5.4 5.3 5.3 7.5 7.4 7.4 8.3 8.2 8.<strong>21</strong>66
Annexure-ITable 6.1.1: Year-wise and grade-wise enrolments in the sampled primary schools across <strong>study</strong> <strong>states</strong> amongSCsSr.NoState Year Grade-1 Grade-2 Grade-3 Grade-4 Grade-5 Primary Stage1 Andhra Pradesh2 Assam3 Bihar4 Chhattisgarh5 Delhi6 Gujarat7 Haryana8 Himachal Pradesh9 Jammu & Kashmir10 Jharkhand11 Karnataka12 Kerala13 Madhya Pradesh14 Maharashtra15 Orissa16 Punjab17 Rajasthan18 Tamil Nadu19 Uttar Pradesh20 Uttarakhand<strong>21</strong> West BengalAll StatesChange in Enrolment amongSCs between 2008-09 and2009-102008-09 540 564 572 540 506 2,7222009-10 584 554 580 557 536 2,8112008-09 470 458 412 489 - 1,8292009-10 457 433 457 422 - 1,7692008-09 2,708 2,264 1,931 1,490 1,305 9,6982009-10 2,8<strong>21</strong> 2,534 2,088 1,782 1,482 10,7072008-09 394 384 361 314 293 1,7462009-10 383 331 362 329 303 1,7082008-09 1,704 1,896 1,955 1,855 1,928 9,3382009-10 1,630 1,850 1,924 1,933 1,920 9,2572008-09 387 387 384 432 - 1,5902009-10 418 413 415 411 - 1,6572008-09 1,296 1,207 1,<strong>21</strong>2 1,067 988 5,7702009-10 1,102 1,233 1,160 1,172 949 5,6162008-09 455 459 480 511 529 2,4342009-10 490 445 457 476 493 2,3612008-09 382 381 371 416 453 2,0032009-10 405 350 381 412 409 1,9572008-09 701 693 720 643 554 3,3112009-10 681 563 625 601 535 3,0052008-09 940 903 959 946 851 4,5992009-10 906 895 883 930 944 4,5582008-09 362 390 384 446 - 1,5822009-10 387 371 366 407 - 1,5312008-09 744 677 642 672 653 3,3882009-10 676 636 662 593 619 3,1862008-09 738 689 709 675 - 2,8112009-10 727 697 700 687 - 2,8112008-09 820 699 656 628 641 3,4442009-10 754 714 700 629 631 3,4282008-09 1,863 1,629 1,742 1,672 1,487 8,3932009-10 1,731 1,732 1,542 1,660 1,641 8,3062008-09 1,374 1,036 1,023 831 737 5,0012009-10 1,229 1,133 960 836 757 4,9152008-09 939 904 1,045 1,044 1,037 4,9692009-10 934 838 953 1,029 1,037 4,7912008-09 1,324 1,322 1,323 1,081 1,144 6,1942009-10 1,238 1,277 1,327 1,157 1,060 6,0592008-09 834 740 776 846 734 3,9302009-10 808 846 720 744 810 3,9282008-09 1,752 1,452 1,393 1,428 - 6,0252009-10 1,709 1,399 1,380 1,451 - 5,9392008-09 20,727 19,134 19,050 18,026 17,052# 93,989*2009-10 20,070 19,244 18,642 18,<strong>21</strong>8 17,344# 93,518*Number -657 110 -408 192 286 -471% -3.2 0.6 -2.1 1.1 2.1 -0.5*the value includes the total enrolment of grade 1 to 5 for all the <strong>21</strong> <strong>states</strong>.# includes the Grade 5 enrolment even for the <strong>states</strong> with Grade 1-4 primary167
Table 6.1.2: Year-wise and grade-wise enrolments in the sampled primary schools across <strong>study</strong> <strong>states</strong> among STsSr. No State Year Grade-1 Grade-2 Grade-3 Grade-4 Grade-5 Primary Stage2008-09 254 222 240 <strong>21</strong>6 189 1,1<strong>21</strong>1 Andhra Pradesh2009-10 228 <strong>21</strong>5 2<strong>21</strong> <strong>21</strong>9 198 1,0812 Assam3 Bihar4 Chhattisgarh5 Delhi6 Gujarat7 Haryana8 Himachal Pradesh9 Jammu & Kashmir10 Jharkhand11 Karnataka12 Kerala13 Madhya Pradesh14 Maharashtra15 Orissa16 Punjab17 Rajasthan18 Tamil Nadu19 Uttar Pradesh20 Uttarakhand<strong>21</strong> West BengalAll StatesChange in Enrolment among STsbetween 2008-09 and 2009-102008-09 443 467 403 388 - 1,7012009-10 450 416 428 377 - 1,6712008-09 84 67 41 38 27 2572009-10 95 70 66 34 34 2992008-09 1,041 851 935 819 660 4,3062009-10 910 927 836 879 783 4,3352008-09 160 129 111 115 103 6182009-10 146 158 141 130 1<strong>21</strong> 6962008-09 1,247 1,149 1,118 1,079 - 4,5932009-10 1,<strong>21</strong>1 1,105 1,098 1,112 - 4,5262008-09 23 50 35 38 27 1732009-10 34 28 45 41 33 1812008-09 104 92 102 102 120 5202009-10 106 96 92 115 107 5162008-09 42 19 34 32 42 1692009-10 34 32 22 31 33 1522008-09 1,851 1,673 1,457 1,508 1,273 7,7622009-10 1,487 1,454 1,418 1,166 1,169 6,6942008-09 420 479 429 401 369 2,0982009-10 366 419 500 457 382 2,1242008-09 75 111 112 116 - 4142009-10 86 84 98 103 - 3712008-09 1,<strong>21</strong>5 1,000 1,023 968 730 4,9362009-10 1,085 988 969 900 815 4,7572008-09 396 354 328 250 - 1,3282009-10 382 340 292 282 - 1,2962008-09 1,086 870 944 941 863 4,7042009-10 1,075 946 844 904 907 4,6762008-09 - 3 - - 3 62009-10 - - - - - -2008-09 1,055 748 661 568 608 3,6402009-10 984 836 693 559 562 3,6342008-09 58 46 52 63 53 2722009-10 68 59 43 51 57 2782008-09 24 16 27 14 23 1042009-10 43 36 16 28 8 1312008-09 180 190 207 201 165 9432009-10 183 169 180 169 188 8892008-09 327 279 257 274 - 1,1372009-10 299 288 282 245 - 1,1142008-09 10,085 8,815 8,516 8,131 7,105# 42,652*2009-10 9,272 8,666 8,284 7,802 7,222# 41,246*Number -813 -149 -232 -329 117 -1,406% -8.1 -1.7 -2.7 -4.0 1.6 -3.4*the value includes the total enrolment of grade 1 to 5 for all the <strong>21</strong> <strong>states</strong>.# includes the Grade 5 enrolment even for the <strong>states</strong> with Grade 1-4 primary168
Table6.1.3: Year-wise & grade-wise enrolments in the sampled primary schools across <strong>study</strong> <strong>states</strong> among MuslimsSr. No State Year Grade-1 Grade-2 Grade-3 Grade-4 Grade-5 Primary Stage2008-09 147 180 178 149 134 7881 Andhra Pradesh2009-10 1<strong>21</strong> 153 145 166 129 7142 Assam3 Bihar4 Chhattisgarh5 Delhi6 Gujarat7 Haryana8 Himachal Pradesh9 Jammu & Kashmir10 Jharkhand11 Karnataka12 Kerala13 Madhya Pradesh14 Maharashtra15 Orissa16 Punjab17 Rajasthan18 Tamil Nadu19 Uttar Pradesh20 Uttarakhand<strong>21</strong> West BengalAll StatesChange in Enrolment amongMuslims between 2008-09and 2009-102008-09 1,269 1,059 915 882 - 4,1252009-10 1,261 1,058 904 855 - 4,0782008-09 1,334 1,393 1,201 1,117 932 5,9772009-10 1,194 1,148 1,311 1,1<strong>21</strong> 966 5,7402008-09 22 13 24 20 14 932009-10 20 15 15 <strong>21</strong> 20 912008-09 1,287 1,309 1,169 1,077 963 5,8052009-10 1,240 1,371 1,340 1,116 991 6,0582008-09 894 906 924 983 - 3,7072009-10 837 857 852 875 - 3,4<strong>21</strong>2008-09 78 47 48 34 31 2382009-10 55 60 47 38 36 2362008-09 15 14 18 9 22 782009-10 22 11 11 13 12 692008-09 523 477 383 438 523 2,3442009-10 561 502 450 393 420 2,3262008-09 923 931 963 852 817 4,4862009-10 848 839 807 843 773 4,1102008-09 611 690 650 660 655 3,2662009-10 610 614 670 652 664 3,<strong>21</strong>02008-09 830 1,054 1,071 1,058 - 4,0132009-10 843 861 1,074 1,072 - 3,8502008-09 77 81 108 93 97 4562009-10 115 84 116 98 85 4982008-09 398 418 342 348 - 1,5062009-10 401 406 367 351 - 1,5252008-09 111 114 120 70 86 5012009-10 84 112 1<strong>21</strong> 90 83 4902008-09 14 17 10 10 9 602009-10 12 14 10 8 11 552008-09 344 302 257 <strong>21</strong>8 <strong>21</strong>4 1,3352009-10 309 311 277 236 192 1,3252008-09 162 115 158 161 155 7512009-10 119 119 109 123 160 6302008-09 986 962 954 815 770 4,4872009-10 952 1,034 923 933 785 4,6272008-09 657 586 580 547 418 2,7882009-10 617 638 539 583 520 2,8972008-09 3,972 2,755 2,430 2,290 - 11,4472009-10 3,645 2,722 2,318 2,313 - 10,9982008-09 14,654 13,423 12,503 11,831 12,689# 65,100*2009-10 13,866 12,929 12,406 11,900 12,931# 64,032*Number -788 -494 -97 69 242 -1,068*the value includes the total enrolment of grade 1 to 5 for all the <strong>21</strong> <strong>states</strong>.# includes the Grade 5 enrolment even for the <strong>states</strong> with Grade 1-4 primary% -5.4 -3.7 -0.8 0.6 1.9 -1.6169
Table 6.1.4: Year-wise and grade-wise enrolments in the sampled upper primary schools across <strong>study</strong> <strong>states</strong>among SCsSr.NoState Year Grade-5 Grade-6 Grade-7 Grade-8 Upper Primary Stage1 Andhra Pradesh2 Assam3 Bihar4 Chhattisgarh5 Delhi6 Gujarat7 Haryana8 Himachal Pradesh9 Jammu & Kashmir10 Jharkhand11 Karnataka12 Kerala13 Madhya Pradesh14 Maharashtra15 Orissa16 Punjab17 Rajasthan18 Tamil Nadu19 Uttar Pradesh20 Uttarakhand<strong>21</strong> West BengalAll StatesChange in Enrolment among SCsbetween 2008-09 and 2009-102008-09 - 424 510 - 9342009-10 - 440 443 - 8832008-09 244 240 198 - 6822009-10 237 <strong>21</strong>1 206 - 6542008-09 - 979 887 633 2,4992009-10 - 1,072 965 695 2,7322008-09 - 298 234 246 7782009-10 - 273 273 257 8032008-09 - 2,315 2,347 1,829 6,4912009-10 - 2,291 2,202 1,996 6,4892008-09 407 441 399 - 1,2472009-10 393 391 404 - 1,1882008-09 - 1,340 1,246 1,101 3,6872009-10 - 1,439 1,388 1,326 4,1532008-09 - 350 350 385 1,0852009-10 - 380 338 425 1,1432008-09 - 442 372 350 1,1642009-10 - 404 419 360 1,1832008-09 - 400 333 225 9582009-10 - 507 400 256 1,1632008-09 - 694 662 - 1,3562009-10 - 678 679 - 1,3572008-09 346 399 389 - 1,1342009-10 371 318 396 - 1,0852008-09 - 765 530 430 1,7252009-10 - 734 627 553 1,9142008-09 668 662 571 - 1,9012009-10 663 567 616 - 1,8462008-09 - 463 490 - 9532009-10 - 450 541 - 9912008-09 - 1,302 1,<strong>21</strong>1 1,172 3,6852009-10 - 1,279 1,266 1,250 3,7952008-09 - 618 560 568 1,7462009-10 - 596 597 585 1,7782008-09 - 1,149 1,312 1,270 3,7312009-10 - 1,019 1,069 1,243 3,3312008-09 - 642 581 543 1,7662009-10 - 489 574 606 1,6692008-09 - 528 439 459 1,4262009-10 - 441 484 451 1,3762008-09 1,547 1,477 1,204 1,022 5,2502009-10 1,554 1,301 1,292 1,028 5,1752008-09 - 15,928 14,825 10,233 40,9862009-10 - 15,280 15,179 11,031 41,490Number - -648 354 798 504% - -4.1 2.4 7.8 1.<strong>21</strong>70
Table 6.1.5: Year-wise and grade-wise enrolments in the sampled upper primary schools across <strong>study</strong> <strong>states</strong>among STsSr. No State Year Grade-5 Grade-6 Grade-7 Grade-8 Upper PrimaryStage1 Andhra Pradesh 2008-09 79 69 1482009-10 73 78 1512 Assam 2008-09 143 117 116 3762009-10 151 127 125 4033 Bihar 2008-09 6 9 5 202009-10 16 11 11 384 Chhattisgarh 2008-09 520 417 436 1,3732009-10 433 448 369 1,2505 Delhi 2008-09 49 43 39 1312009-10 45 43 42 1306 Gujarat 2008-09 1,087 1,104 998 3,1892009-10 1,036 1,106 975 3,1177 Haryana 2008-09 63 71 62 1962009-10 59 57 55 1718 Himachal Pradesh 2008-09 186 147 138 4712009-10 195 140 131 4669 Jammu & Kashmir 2008-09 42 33 23 982009-10 51 37 26 11410 Jharkhand 2008-09 882 638 529 2,0492009-10 894 750 486 2,13011 Karnataka 2008-09 281 262 5432009-10 290 306 59612 Kerala 2008-09 62 111 99 2722009-10 77 105 101 28313 Madhya Pradesh 2008-09 834 575 446 1,8552009-10 909 679 526 2,11414 Maharashtra 2008-09 273 208 182 6632009-10 296 239 206 74115 Orissa 2008-09 826 850 1,6762009-10 897 870 1,76716 Punjab 2008-09 - - - -2009-10 - - - -17 Rajasthan 2008-09 546 538 594 1,6782009-10 555 534 559 1,64818 Tamil Nadu 2008-09 <strong>21</strong> 22 23 662009-10 26 <strong>21</strong> 15 6<strong>21</strong>9 Uttar Pradesh 2008-09 15 20 14 492009-10 5 15 16 3620 Uttarakhand 2008-09 110 109 95 3142009-10 120 85 117 322<strong>21</strong> West Bengal 2008-09 285 154 109 82 6302009-10 265 166 146 84 661All States 2008-09 6,154 5,307 2,486 13,9472009-10 6,311 5,627 2,437 14,375Change in Enrolment among STs Number - 157 320 -49 428between 2008-09 and 2009-10 % - 2.6 6.0 -2.0 3.0171
Table 6.1.6: Year-wise and grade-wise enrolments in the sampled upper primary schools across <strong>study</strong> <strong>states</strong>among MuslimsSr. No State Year Grade-5 Grade-6 Grade-7 Grade-8 Upper Primary Stage1 Andhra Pradesh 2008-09 233 245 4782009-10 239 263 5022 Assam 2008-09 1,035 1,020 1,005 3,0602009-10 1,042 974 972 2,9883 Bihar 2008-09 622 499 416 1,5372009-10 707 573 453 1,7334 Chhattisgarh 2008-09 13 16 17 462009-10 24 20 22 665 Delhi 2008-09 485 501 368 1,3542009-10 448 463 411 1,3226 Gujarat 2008-09 674 705 655 2,0342009-10 794 652 715 2,1617 Haryana 2008-09 35 31 19 852009-10 38 32 36 1068 Himachal Pradesh 2008-09 10 13 14 372009-10 14 12 17 439 Jammu & Kashmir 2008-09 637 458 507 1,6022009-10 631 570 494 1,69510 Jharkhand 2008-09 477 343 253 1,0732009-10 505 422 270 1,19711 Karnataka 2008-09 637 576 1,<strong>21</strong>32009-10 612 631 1,24312 Kerala 2008-09 777 859 950 2,5862009-10 853 731 865 2,44913 Madhya Pradesh 2008-09 131 117 1<strong>21</strong> 3692009-10 127 119 125 37114 Maharashtra 2008-09 284 334 333 9512009-10 255 348 317 92015 Orissa 2008-09 38 29 672009-10 30 41 7116 Punjab 2008-09 3 18 6 272009-10 5 3 18 2617 Rajasthan 2008-09 174 146 163 4832009-10 171 153 149 47318 Tamil Nadu 2008-09 176 143 157 4762009-10 168 138 161 46719 Uttar Pradesh 2008-09 455 525 445 1,4252009-10 483 479 523 1,48520 Uttarakhand 2008-09 197 187 190 5742009-10 251 166 <strong>21</strong>9 636<strong>21</strong> West Bengal 2008-09 4,079 3,520 2,728 2,405 12,7322009-10 4,140 3,417 3,059 2,448 13,064All States 2008-09 10,761 9,518 5,081 25,3602009-10 10,575 10,013 5,346 25,934Change in Enrolment amongMuslims between 2008-09 and2009-10Number - -186 495 265 574% - -1.7 5.2 5.2 2.3172
Table 6.1.7 Proportion of SC, ST and Muslim enrolment to the total enrolmentSr.NoState1 Andhra Pradesh2 Assam3 Bihar4 Chhattisgarh5 Delhi6 Gujarat7 Haryana8 Himachal Pradesh9 Jammu & Kashmir10 Jharkhand11 Karnataka12 Kerala13 Madhya Pradesh14 Maharashtra15 Orissa16 Punjab17 Rajasthan18 Tamil Nadu19 Uttar Pradesh20 Uttarakhand<strong>21</strong> West BengalAll StatesYearPercentage of Total EnrolmentSCs STs Muslims2008-09 19.7 6.8 6.82009-10 20.4 6.8 6.72008-09 14.4 11.9 41.32009-10 14.2 12.2 41.52008-09 19.6 0.4 12.12009-10 <strong>21</strong>.2 0.5 11.82008-09 12.3 27.6 0.72009-10 12.4 27.6 0.82008-09 17.9 0.8 8.12009-10 17.9 0.9 8.42008-09 7.0 19.2 14.22009-10 7.2 19.3 14.12008-09 33.7 1.3 1.22009-10 34.1 1.2 1.22008-09 27.5 7.8 0.92009-10 28.0 7.8 0.92008-09 22.5 1.9 28.02009-10 22.4 1.9 28.72008-09 11.6 26.8 15.22009-10 12.3 26.1 15.72008-09 18.6 8.2 14.02009-10 18.7 8.6 14.12008-09 9.2 2.3 22.32009-10 9.2 2.3 22.12008-09 19.3 25.6 3.12009-10 19.4 26.2 3.32008-09 16.1 6.8 8.42009-10 16.2 7.1 8.52008-09 19.0 27.6 2.52009-10 19.4 28.3 2.52008-09 59.6 0.0 0.42009-10 60.9 0.0 0.42008-09 22.2 17.5 6.02009-10 22.2 17.5 6.02008-09 30.0 1.2 4.22009-10 29.6 1.2 4.02008-09 22.1 0.4 16.42009-10 22.3 0.5 17.62008-09 28.9 6.8 18.12009-10 28.9 6.6 19.22008-09 22.9 3.6 49.12009-10 22.7 3.6 49.22008-09 20.3 8.5 13.62009-10 20.7 8.5 13.8173
Table 6.2.1 Grade wise number of SC school leavers in primary stage whose houses were visited-2008-09 & 2009-102008-09 2009-10Sr.PrimaryGrade-1 Grade-2 Grade-3 Grade-4 Grade-5Grade-1 Grade-2 Grade-3 Grade-4 Grade-5NoStateStage1 Andhra Pradesh 71 73 57 65 14 280 52 51 37 36 24 2002 Bihar <strong>21</strong>2 232 149 108 61 762 220 243 176 123 73 8353 Delhi 26 <strong>21</strong> 25 13 14 99 31 14 14 9 16 844 Haryana 43 47 63 57 12 222 29 13 22 20 8 925 Himachal Pradesh 26 23 23 27 6 105 7 13 7 9 7 436 Jammu & Kashmir 42 22 14 38 17 133 35 15 22 9 9 907 Karnataka 66 63 68 60 51 308 45 29 30 38 43 1858 Madhya Pradesh 62 42 43 35 22 204 20 9 15 11 13 689 Maharashtra 56 35 34 56 - 181 27 19 10 30 - 8610 Orissa 44 23 27 27 28 149 8 46 12 <strong>21</strong> 17 10411 Punjab 154 153 156 142 82 687 149 105 88 71 70 48312 Rajasthan 190 124 150 88 76 628 111 81 79 45 39 35513 Tamil Nadu 54 28 34 20 23 159 20 14 12 13 19 7814 Uttar Pradesh 137 114 147 127 32 557 42 47 52 46 33 22015 Uttarakhand 30 15 13 18 - 76 11 4 4 8 2 2916 West Bengal 49 50 42 19 23 183 54 27 12 17 - 110All States 1,440 1,248 1,<strong>21</strong>0 1,038 625 5,561 981 812 665 582 450 3,490PrimaryStage174
Table 6.2.2 Grade wise number of ST school leavers in primary stage whose houses were visited-2008-09 & 2009-102008-09 2009-10Sr.Total PrimaryTotal PrimaryGrade-1 Grade-2 Grade-3 Grade-4 Grade-5Grade-1 Grade-2 Grade-3 Grade-4 Grade-5No StateStageStage1 Andhra Pradesh 64 35 <strong>21</strong> 34 2 156 26 24 <strong>21</strong> 22 2 952 Assam 14 12 7 1 - 34 4 3 5 3 - 153 Chhattisgarh 67 54 63 49 19 252 31 49 53 29 8 1704 Gujarat 61 38 33 42 - 174 34 34 32 30 - 1305 Himachal Pradesh 2 2 5 4 3 16 1 1 2 1 0 56 Jharkhand 275 267 <strong>21</strong>9 241 105 1,107 167 159 158 124 40 6487 Karnataka 35 22 13 30 22 122 19 11 15 22 11 788 Madhya Pradesh 86 51 76 72 29 314 43 32 29 28 27 1599 Maharashtra 42 31 18 14 - 105 15 9 8 3 - 3510 Orissa 82 65 56 55 54 312 62 38 44 35 34 <strong>21</strong>311 Rajasthan 172 109 109 94 87 571 106 88 76 55 47 37<strong>21</strong>2 Uttarakhand 1 4 5 0 - 10 2 1 3 2 0 8All States 948 715 653 665 416 3,397 550 487 485 376 2<strong>21</strong> 2,119Table 6.2.3 Grade wise number of Muslim school leavers in primary stage whose houses were visited-2008-09 & 2009-102008-09 2009-10Sr.Total PrimaryTotal PrimaryGrade-1 Grade-2 Grade-3 Grade-4 Grade-5Grade-1 Grade-2 Grade-3 Grade-4 Grade-5No StateStageStage1 Assam 67 32 53 16 - 168 61 37 37 20 - 1552 Bihar 152 144 129 125 69 619 115 90 116 83 90 4943 Gujarat 103 79 65 58 - 305 30 19 26 36 - 1114 Jammu & Kashmir 83 38 26 37 17 201 86 48 23 12 4 1735 Jharkhand 94 106 96 94 56 446 89 84 54 31 24 2826 Karnataka 24 37 17 33 20 131 20 20 19 15 13 877 Kerala 10 15 13 12 - 50 3 17 9 8 - 378 Uttar Pradesh 112 53 56 53 26 300 27 25 25 16 22 1159 Uttarakhand 15 <strong>21</strong> 7 6 - 51 1 10 3 6 1 <strong>21</strong>10 West Bengal 170 123 96 80 32 501 89 79 60 59 - 287All States 1,012 839 720 667 450 3,688 654 552 454 366 338 2,364175
Table 6.2.4 Grade wise number of SC school leavers in upper primary stage whose houses were visited-2008-09 & 2009-102008-09 2009-10Sr.Grade-5 Grade-6 Grade-7 Grade-8 UpperNoStatePrimary Stage1 Andhra Pradesh - 38 6 - 44 - 23 12 - 35Grade-5 Grade-6 Grade-7 Grade-8 Upper PrimaryStage2 Bihar - 61 47 6 114 - 105 45 16 1663 Delhi - 1 1 0 2 - 0 5 3 84 Haryana - 26 23 28 77 - 16 10 10 365 Himachal Pradesh - 14 6 9 29 - 3 1 3 76 Jammu & Kashmir - 24 26 1 51 - 13 15 6 347 Karnataka - 35 12 - 47 - 32 16 - 488 Madhya Pradesh - 62 <strong>21</strong> 2 85 - 27 12 7 469 Maharashtra 45 32 15 - 92 12 6 8 - 2610 Orissa - 30 25 - 55 - 18 32 - 5011 Punjab - 72 62 76 <strong>21</strong>0 - 65 48 51 16412 Rajasthan - 72 70 <strong>21</strong> 163 - 40 23 10 7313 Tamil Nadu - 62 72 40 174 - 32 <strong>21</strong> 22 7514 Uttar Pradesh - 40 38 5 83 - 7 24 16 4715 Uttarakhand - 13 14 1 28 - 6 6 3 1516 West Bengal 23 20 16 19 78 13 <strong>21</strong> 26 16 76All States - 711 535 223 1,469 - 472 338 177 810176
Table 6.2.5 Grade wise number of ST school leavers in upper primary stage whose houses were visited – 2008-09 and 2009-102008-09 2009-10Sr.Grade-5 Grade-6 Grade-7 Grade-8 Total Upper Grade-5 Grade-6 Grade-7 Grade-8 Total UpperNoStatePrimary StagePrimary Stage1 Andhra Pradesh - 10 4 - 14 - 1 3 - 42 Assam 4 1 0 - 5 0 0 0 - 03 Chhattisgarh - 44 45 19 108 - 11 8 8 274 Gujarat 48 57 24 - 129 25 35 10 - 705 Himachal Pradesh - 10 15 2 27 - 3 1 1 56 Jharkhand - 111 92 33 236 - 57 45 20 1227 Karnataka - 9 4 - 13 - 16 10 - 268 Madhya Pradesh - 75 33 8 116 - 54 23 12 899 Maharashtra 23 12 12 - 47 4 1 4 - 910 Orissa - 69 65 - 134 - 45 93 - 13811 Rajasthan - 77 62 28 167 - 46 46 22 11412 Uttarakhand - 2 2 0 4 - 0 1 0 1All States - 493 368 97 958 - 274 253 67 527Table 6.2.6 Grade wise number of Muslim school leavers in upper primary stage whose houses were visited- 2008-09 and 2009-102008-09 2009-10Sr.Grade-5 Grade- Grade-7 Grade-8 Total Upper Grade-5 Grade-6 Grade-7 Grade-8 Total UpperNo State6Primary StagePrimary Stage1 Assam 74 107 62 - 243 45 67 59 - 1712 Bihar - 48 24 16 88 - 50 44 4 983 Gujarat 50 49 10 - 109 39 24 14 - 774 Jammu & Kashmir - 20 30 16 66 - 6 4 2 125 Jharkhand - 45 36 12 93 - 31 26 7 646 Karnataka - 29 7 - 36 - 13 10 - 237 Kerala 5 9 6 - 20 9 4 1 - 148 Uttar Pradesh - 23 52 1 76 - 7 25 1 339 Uttarakhand - 4 10 0 14 - 5 4 3 1<strong>21</strong>0 West Bengal 32 36 43 40 151 28 <strong>21</strong> 15 19 84All States - 484 353 98 935 - 302 258 46 556177
Table 6.3.1: Grade wise status of primary school leavers whose houses were visited-SC, 2008-09Sr.Grade 1 Grade 2 Grade 3 Grade 4 Grade 5Average PrimaryStageNo StateR P D R P D R P D R P D R P D R P D1 Andhra Pradesh 22.5 66.2 11.3 6.8 87.7 5.5 17.5 66.7 15.8 30.8 53.8 15.4 7.1 28.6 64.3 18.6 67.1 14.32 Bihar 19.8 39.2 41.0 26.3 38.8 34.9 28.2 38.3 33.6 24.1 48.1 27.8 11.5 34.4 54.1 23.4 39.8 36.93 Delhi 38.5 7.7 53.8 28.6 19.0 52.4 40.0 12.0 48.0 30.8 15.4 53.8 7.1 14.3 78.6 31.3 13.1 55.64 Haryana 25.6 69.8 4.7 31.9 51.1 17.0 33.3 54.0 12.7 49.1 33.3 17.5 41.7 16.7 41.7 36.0 49.1 14.95 Himachal Pradesh 3.8 88.5 7.7 0.0 78.3 <strong>21</strong>.7 13.0 82.6 4.3 11.1 81.5 7.4 0.0 50.0 50.0 6.7 81.0 12.46 Jammu & Kashmir 33.3 52.4 14.3 31.8 45.5 22.7 0.0 71.4 28.6 28.9 60.5 10.5 5.9 52.9 41.2 24.8 55.6 19.57 Karnataka 31.8 47.0 <strong>21</strong>.2 11.1 68.3 20.6 13.2 67.6 19.1 16.7 58.3 25.0 17.6 27.5 54.9 18.2 54.9 26.98 Madhya Pradesh 32.3 56.5 11.3 31.0 40.5 28.6 34.9 39.5 25.6 37.1 45.7 17.1 27.3 13.6 59.1 32.8 43.1 24.09 Maharashtra <strong>21</strong>.4 67.9 10.7 11.4 77.1 11.4 5.9 85.3 8.8 1.8 55.4 42.9 - - - 10.5 69.1 20.410 Orissa 18.2 56.8 25.0 30.4 56.5 13.0 22.2 51.9 25.9 18.5 70.4 11.1 17.9 35.7 46.4 20.8 54.4 24.811 Punjab 30.5 27.9 41.6 35.3 34.0 30.7 37.2 25.0 37.8 42.3 26.8 31.0 32.9 14.6 52.4 35.8 26.8 37.412 Rajasthan <strong>21</strong>.6 64.7 13.7 29.0 58.9 12.1 51.3 36.0 12.7 39.8 45.5 14.8 17.1 26.3 56.6 32.2 49.4 18.513 Tamil Nadu 16.7 72.2 11.1 14.3 57.1 28.6 8.8 67.6 23.5 15.0 50.0 35.0 17.4 <strong>21</strong>.7 60.9 14.5 58.5 27.014 Uttar Pradesh 29.9 58.4 11.7 24.6 62.3 13.2 49.7 36.7 13.6 46.5 38.6 15.0 28.1 28.1 43.8 37.7 47.2 15.115 Uttarakhand 16.7 50.0 33.3 46.7 20.0 33.3 30.8 38.5 30.8 38.9 33.3 27.8 - - - 30.3 38.2 31.616 West Bengal 14.3 26.5 59.2 14.0 30.0 56.0 23.8 <strong>21</strong>.4 54.8 10.5 <strong>21</strong>.1 68.4 - - - 16.3 25.6 58.1All States 24.9 50.3 24.9 26.1 49.8 24.0 32.7 43.2 24.0 31.0 44.2 24.8 18.9 32.3 48.8 27.3 45.5 27.2R=Continued as Repeater; P=Continued as Promotees; D=Discontinued178
Table 6.3.2 Grade wise status of primary school leavers whose houses were visited-SC, 2009-10Sr.Grade 1 Grade 2 Grade 3 Grade 4 Grade 5Average PrimaryStageNo StateR P D R P D R P D R P D R P D R P D1 Andhra Pradesh 13.5 73.1 13.5 23.5 74.5 2.0 32.4 54.1 13.5 36.1 61.1 2.8 4.2 50.0 45.8 22.5 65.0 12.52 Bihar 17.7 45.5 36.8 27.2 36.6 36.2 22.7 33.0 44.3 27.6 37.4 35.0 11.0 26.0 63.0 22.4 37.4 40.23 Delhi 61.3 22.6 16.1 35.7 35.7 28.6 78.6 7.1 14.3 22.2 55.6 22.2 37.5 18.8 43.8 51.2 25.0 23.84 Haryana 31.0 41.4 27.6 23.1 61.5 15.4 18.2 54.5 27.3 40.0 35.0 25.0 50.0 12.5 37.5 30.4 43.5 26.15 Himachal Pradesh 0.0 71.4 28.6 30.8 46.2 23.1 0.0 57.1 42.9 11.1 77.8 11.1 0.0 42.9 57.1 11.6 58.1 30.26 Jammu & Kashmir 25.7 60.0 14.3 33.3 53.3 13.3 18.2 72.7 9.1 22.2 77.8 0.0 11.1 33.3 55.6 23.3 61.1 15.67 Karnataka 13.3 64.4 22.2 20.7 44.8 34.5 16.7 70.0 13.3 <strong>21</strong>.1 42.1 36.8 2.3 20.9 76.7 14.1 47.6 38.48 Madhya Pradesh 0.0 25.0 75.0 11.1 44.4 44.4 13.3 40.0 46.7 36.4 9.1 54.5 0.0 7.7 92.3 10.3 25.0 64.79 Maharashtra 11.1 59.3 29.6 10.5 52.6 36.8 10.0 70.0 20.0 13.3 46.7 40.0 - - - 11.6 54.7 33.710 Orissa 25.0 75.0 0.0 23.9 65.2 10.9 25.0 50.0 25.0 19.0 71.4 9.5 0.0 23.5 76.5 19.2 58.7 22.111 Punjab 28.9 28.2 43.0 32.4 32.4 35.2 31.8 30.7 37.5 38.0 18.3 43.7 22.9 22.9 54.3 30.6 27.3 42.012 Rajasthan 37.8 42.3 19.8 35.8 51.9 12.3 34.2 51.9 13.9 37.8 42.2 20.0 20.5 30.8 48.7 34.6 45.4 20.013 Tamil Nadu 45.0 30.0 25.0 50.0 <strong>21</strong>.4 28.6 16.7 33.3 50.0 15.4 30.8 53.8 15.8 36.8 47.4 29.5 30.8 39.714 Uttar Pradesh 33.3 26.2 40.5 25.5 <strong>21</strong>.3 53.2 <strong>21</strong>.2 26.9 51.9 19.6 26.1 54.3 27.3 9.1 63.6 25.0 22.7 52.315 Uttarakhand 27.3 27.3 45.5 25.0 25.0 50.0 25.0 0.0 75.0 0.0 62.5 37.5 50.0 0.0 50.0 20.7 31.0 48.316 West Bengal 22.2 20.4 57.4 29.6 25.9 44.4 25.0 25.0 50.0 5.9 17.6 76.5 - - - <strong>21</strong>.8 <strong>21</strong>.8 56.4All States 26.5 40.7 32.8 28.7 41.9 29.4 27.5 40.6 31.9 27.1 37.3 35.6 18.0 28.9 53.1 26.2 38.9 34.9R=Continued as Repeater; P=Continued as Promotees; D=Discontinued179
Table 6.3.3: Grade wise status of primary school leavers whose houses were visited-ST, 2008-09Sr.Grade 1 Grade 2 Grade 3 Grade 4 Grade 5 Average Primary StageNo StateR P D R P D R P D R P D R P D R P D1 Andhra Pradesh 28.1 46.9 25.0 20.0 42.9 37.1 14.3 57.1 28.6 47.1 38.2 14.7 50.0 0.0 50. 28.8 44.9 26.32 Assam 64.3 14.3 <strong>21</strong>.4 58.3 41.7 0.0 28.6 71.4 0.0 0.0 0.0 100.0 - - 0 - 52.9 35.3 11.83 Chhattisgarh 55.2 28.4 16.4 53.7 33.3 13.0 33.3 36.5 30.2 28.6 38.8 32.7 <strong>21</strong>.1 <strong>21</strong>.1 57. 41.7 32.9 25.44 Gujarat 23.0 67.2 9.8 13.2 86.8 0.0 12.1 72.7 15.2 7.1 52.4 40.5 - - 9 - 14.9 69.0 16.15 Himachal Pradesh 50.0 50.0 0.0 0.0 100.0 0.0 20.0 80.0 0.0 0.0 100.0 0.0 0.0 66.7 33. 12.5 81.3 6.36 Jharkhand 26.5 37.5 36.0 24.7 43.8 31.5 34.2 36.1 29.7 39.4 30.7 29.9 34.3 12.4 53. 3 31.2 34.9 34.07 Karnataka 28.6 28.6 42.9 13.6 54.5 31.8 53.8 30.8 15.4 10.0 66.7 23.3 18.2 45.5 36. 3 22.1 45.9 32.08 Madhya Pradesh 20.9 57.0 22.1 19.6 49.0 31.4 38.2 46.1 15.8 51.4 37.5 11.1 24.1 24.1 51. 4 32.2 45.5 22.39 Maharashtra 31.0 52.4 16.7 51.6 48.4 0.0 38.9 61.1 0.0 14.3 57.1 28.6 - - 7 - 36.2 53.3 10.510 Orissa 2.4 84.1 13.4 4.6 81.5 13.8 8.9 71.4 19.6 16.4 70.9 12.7 1.9 50.0 48. 6.4 73.1 20.511 Rajasthan 20.9 70.3 8.7 20.2 66.1 13.8 18.3 56.9 24.8 16.0 70.2 13.8 14.9 36.8 48. 1 18.6 61.8 19.612 Uttarakhand 0.0 0.0 100.0 25.0 50.0 25.0 0.0 60.0 40.0 - - - - - 3 - 10.0 50.0 40.0All States 26.7 50.4 22.9 24.9 53.1 22.0 28.2 47.8 24.0 32.2 44.4 23.5 <strong>21</strong>.9 35.8 42. 27.1 47.5 25.43Table 6.3.4: Grade wise status of primary school leavers whose houses were visited-ST, 2009-10Sr.Grade 1 Grade 2 Grade 3 Grade 4 Grade 5 Average Primary StageNo StateR P D R P D R P D R P D R P D R P D1 Andhra Pradesh 30.8 61.5 7.7 33.3 50.0 16.7 28.6 42.9 28.6 31.8 40.9 27.3 0.0 100.0 0.0 30.5 50.5 18.92 Assam 0.0 25.0 75.0 0.0 33.3 66.7 20.0 20.0 60.0 66.7 0.0 33.3 - - - 20.0 20.0 60.03 Chhattisgarh 25.8 9.7 64.5 14.3 26.5 59.2 22.6 11.3 66.0 20.7 6.9 72.4 25.0 0.0 75.0 20.6 14.1 65.34 Gujarat 20.6 70.6 8.8 35.3 47.1 17.6 43.8 53.1 3.1 16.7 53.3 30.0 - - - 29.2 56.2 14.65 Himachal Pradesh 0.0 100.0 0.0 0.0 100.0 0.0 50.0 50.0 0.0 0.0 100.0 0.0 - - - 20.0 80.0 0.06 Jharkhand 37.7 26.9 35.3 34.6 27.0 38.4 41.8 24.7 33.5 29.8 36.3 33.9 15.0 20.0 65.0 35.0 27.8 37.27 Karnataka 36.8 31.6 31.6 36.4 63.6 0.0 6.7 73.3 20.0 18.2 54.5 27.3 18.2 18.2 63.6 23.1 48.7 28.28 Madhya Pradesh 11.6 14.0 74.4 9.4 28.1 62.5 3.4 20.7 75.9 17.9 28.6 53.6 11.1 3.7 85.2 10.7 18.9 70.49 Maharashtra 26.7 33.3 40.0 22.2 66.7 11.1 0.0 75.0 25.0 66.7 0.0 33.3 - - - 22.9 48.6 28.610 Orissa 9.7 77.4 12.9 15.8 71.1 13.2 6.8 72.7 20.5 20.0 68.6 11.4 0.0 38.2 61.8 10.3 67.6 22.111 Rajasthan <strong>21</strong>.7 66.0 12.3 14.8 64.8 20.5 23.7 64.5 11.8 23.6 61.8 14.5 17.0 29.8 53.2 20.2 60.2 19.612 Uttarakhand 0.0 0.0 100. 0.0 100.0 0.0 0.0 66.7 33.3 50.0 0.0 50.0 - - - 12.5 37.5 50.0All States 26.4 43.3 30.4 0 24.0 42.7 33.3 26.4 40.0 33.6 24.5 44.1 31.4 16.3 27.6 56.1 24.4 40.9 34.6R=Continued as Repeater; P=Continued as Promotees; D=Discontinued180
Table 6.3.5: Grade wise status of primary school leavers whose houses were visited-Muslims, 2008-09SrStateGrade 1 Grade 2 Grade 3 Grade 4 Grade 5 Average Primary StageNo.R P D R P D R P D R P D R P D R P D1 Assam 37.3 22.4 40.3 50.0 9.4 40.6 39.6 13.2 47.2 37.5 18.8 43.8 - - - 40.5 16.7 42.92 Bihar 24.3 38.2 37.5 16.0 56.3 27.8 20.2 39.5 40.3 16.0 50.4 33.6 10.1 31.9 58.0 18.3 44.4 37.33 Gujarat 10.7 86.4 2.9 5.1 89.9 5.1 6.2 89.2 4.6 22.4 36.2 41.4 - - - 10.5 78.4 11.14 Jammu & Kashmir 19.3 77.1 3.6 26.3 71.1 2.6 19.2 76.9 3.8 35.1 51.4 13.5 5.9 47.1 47.1 22.4 68.7 9.05 Jharkhand 33.0 46.8 20.2 41.5 38.7 19.8 42.7 39.6 17.7 44.7 34.0 <strong>21</strong>.3 32.1 23.2 44.6 39.5 37.7 22.96 Karnataka 25.0 50.0 25.0 29.7 54.1 16.2 17.6 64.7 17.6 3.0 72.7 24.2 20.0 30.0 50.0 19.1 55.7 25.27 Kerala 60.0 30.0 10.0 80.0 13.3 6.7 84.6 15.4 0.0 58.3 0.0 41.7 - - - 72.0 14.0 14.08 Uttar Pradesh 61.6 27.7 10.7 39.6 52.8 7.5 32.1 50.0 17.9 43.4 41.5 15.1 23.1 26.9 50.0 45.7 38.7 15.79 Uttarakhand 40.0 26.7 33.3 28.6 19.0 52.4 14.3 14.3 71.4 0.0 50.0 50.0 0.0 0.0 100.0 25.5 23.5 51.010 West Bengal 33.5 24.7 41.8 22.8 26.8 50.4 30.2 26.0 43.8 8.8 16.3 75.0 - - - 25.8 24.1 50.1All States 30.2 46.8 22.9 29.0 47.1 24.0 29.6 44.6 25.8 26.5 39.9 33.6 26.0 32.9 41.1 28.6 43.5 27.9R=Continued as Repeater; P=Continued as Promotees; D=DiscontinuedTable 6.3.6: Grade wise status of primary school leavers whose houses were visited-Muslims, 2009-10SrGrade 1 Grade 2 Grade 3 Grade 4 Grade 5 Average Primary StageStateNo.R P D R P D R P D R P D R P D R P D1 Assam 32.8 1.6 65.6 29.7 8.1 62.2 18.9 2.7 78.4 20.0 10.0 70.0 - - - 27.1 4.5 68.42 Bihar 9.6 47.8 42.6 18.9 42.2 38.9 37.9 31.0 31.0 33.7 37.3 28.9 32.2 12.2 55.6 26.1 34.6 39.33 Gujarat 36.7 50.0 13.3 26.3 57.9 15.8 19.2 65.4 15.4 22.2 33.3 44.4 - - - 26.1 49.5 24.34 Jammu & Kashmir 16.3 83.7 0.0 25.0 72.9 2.1 43.5 52.2 4.3 16.7 75.0 8.3 0.0 25.0 75.0 22.0 74.6 3.55 Jharkhand 51.7 33.7 14.6 54.8 27.4 17.9 53.7 31.5 14.8 38.7 32.3 29.0 41.7 12.5 45.8 50.7 29.4 19.96 Karnataka 5.0 50.0 45.0 10.0 45.0 45.0 10.5 68.4 <strong>21</strong>.1 20.0 40.0 40.0 7.7 23.1 69.2 10.3 47.1 42.57 Kerala 100.0 0.0 0.0 58.8 41.2 0.0 100.0 0.0 0.0 25.0 25.0 50.0 - - - 64.9 24.3 10.88 Uttar Pradesh 25.9 25.9 48.1 28.0 32.0 40.0 16.0 52.0 32.0 31.3 37.5 31.3 36.4 4.5 59.1 27.0 30.4 42.69 Uttarakhand 0.0 0.0 100.0 10.0 10.0 80.0 33.3 0.0 66.7 16.7 0.0 83.3 0.0 0.0 100.0 14.3 4.8 81.010 West Bengal 22.5 24.7 52.8 25.3 26.6 48.1 31.7 33.3 35.0 10.2 30.5 59.3 - - - 22.6 28.2 49.1All States 28.1 39.8 32.1 34.2 35.5 30. 38.3 33.9 27.8 27.3 36.1 36.6 43.2 17.5 39.3 33.5 33.9 32.6R=Continued as Repeater; P=Continued as Promotees; D=Discontinued 3181
Table 6.3.7: Grade wise status of upper primary school leavers whose houses were visited-SC, 2008-09Sr.Grade 5 Grade 6 Grade 7 Grade 8 Average Upper Primary StageNo StateR P D R P D R P D R P D R P D1 Andhra Pradesh - - - 10.5 73.7 15.8 50.0 50.0 0.0 - - - 15.9 70.5 13.62 Bihar - - - 23.0 50.8 26.2 31.9 53.2 14.9 50.0 16.7 33.3 28.1 50.0 <strong>21</strong>.93 Delhi - - - 100.0 0.0 0.0 100.0 0.0 0.0 - - - 100.0 0.0 0.04 Haryana - - - 26.9 34.6 38.5 43.5 26.1 30.4 35.7 42.9 <strong>21</strong>.4 35.1 35.1 29.95 Himachal Pradesh - - - 7.1 14.3 78.6 0.0 33.3 66.7 44.4 0.0 55.6 17.2 13.8 69.06 Jammu & Kashmir - - - 37.5 29.2 33.3 19.2 26.9 53.8 0.0 100.0 0.0 27.5 29.4 43.17 Karnataka - - - 20.0 60.0 20.0 41.7 8.3 50.0 - - - 25.5 46.8 27.78 Madhya Pradesh - - - 37.1 45.2 17.7 23.8 57.1 19.0 100.0 0.0 0.0 35.3 47.1 17.69 Maharashtra 8.9 82.2 8.9 6.3 93.8 0.0 26.7 73.3 0.0 - - - 10.9 84.8 4.310 Orissa - - - 23.3 50.0 26.7 48.0 32.0 20.0 - - - 34.5 41.8 23.611 Punjab - - - 51.4 30.6 18.1 53.2 35.5 11.3 57.9 <strong>21</strong>.1 <strong>21</strong>.1 54.3 28.6 17.112 Rajasthan - - - 43.1 38.9 18.1 57.1 20.0 22.9 38.1 28.6 33.3 48.5 29.4 22.113 Tamil Nadu - - - 11.3 64.5 24.2 22.2 51.4 26.4 17.5 50.0 32.5 17.2 55.7 27.014 Uttar Pradesh - - - 20.0 52.5 27.5 31.6 34.2 34.2 20.0 60.0 20.0 25.3 44.6 30.115 Uttarakhand - - - 30.8 30.8 38.5 14.3 42.9 42.9 0.0 0.0 100.0 <strong>21</strong>.4 35.7 42.916 West Bengal <strong>21</strong>.7 4.3 73.9 40.0 25.0 35.0 31.3 31.3 37.5 31.6 31.6 36.8 30.8 <strong>21</strong>.8 47.4All States - - - 29.5 47.8 22.6 35.9 38.9 25.2 41.3 30.9 27.8 33.6 42.0 24.4R=Continued as Repeater; P=Continued as Promotees; D=Discontinued182
T able 6.3.8: Grade wise status of upper primary school leavers whose houses were visited-SC, 2009-10Sr.Grade 5 Grade 6 Grade 7 Grade 8 Average Upper Primary StageNo StateR P D R P D R P D R P D R P D1 Andhra Pradesh - - - 8.7 69.6 <strong>21</strong>.7 0.0 41.7 58.3 - - - 5.7 60.0 34.32 Bihar - - - 63.8 22.9 13.3 15.6 51.1 33.3 31.3 31.3 37.5 47.6 31.3 <strong>21</strong>.13 Delhi - - - - - - 20.0 0.0 80.0 0.0 0.0 100.0 12.5 0.0 87.54 Haryana - - - 43.8 6.3 50.0 30.0 60.0 10.0 20.0 40.0 40.0 33.3 30.6 36.15 Himachal Pradesh - - - 0.0 66.7 33.3 0.0 0.0 100.0 0.0 66.7 33.3 0.0 57.1 42.96 Jammu & Kashmir - - - 7.7 53.8 38.5 33.3 26.7 40.0 33.3 16.7 50.0 23.5 35.3 41.27 Karnataka - - - 25.0 31.3 43.8 12.5 6.3 81.3 - - - 20.8 22.9 56.38 Madhya Pradesh - - - 7.4 14.8 77.8 16.7 50.0 33.3 57.1 42.9 0.0 17.4 28.3 54.39 Maharashtra 25.0 75.0 0.0 50.0 50.0 0.0 25.0 25.0 50.0 - - - 30.8 53.8 15.410 Orissa - - - 27.8 55.6 16.7 12.5 25.0 62.5 - - - 18.0 36.0 46.011 Punjab - - - 61.5 12.3 26.2 50.0 25.0 25.0 60.8 <strong>21</strong>.6 17.6 57.9 18.9 23.<strong>21</strong>2 Rajasthan - - - 40.0 35.0 25.0 39.1 34.8 26.1 50.0 40.0 10.0 41.1 35.6 23.313 Tamil Nadu - - - 18.8 31.3 50.0 42.9 14.3 42.9 22.7 36.4 40.9 26.7 28.0 45.314 Uttar Pradesh - - - 57.1 14.3 28.6 54.2 16.7 29.2 18.8 50.0 31.3 42.6 27.7 29.815 Uttarakhand - - - 16.7 66.7 16.7 16.7 66.7 16.7 66.7 0.0 33.3 26.7 53.3 20.016 West Bengal 61.5 15.4 23.1 33.3 19.0 47.6 46.2 11.5 42.3 31.3 31.3 37.5 42.1 18.4 39.5All States - - - 39.0 30.5 30.5 31.4 29.6 39.1 36.7 32.2 31.1 36.0 30.5 33.5R=Continued as Repeater; P=Continued as Promotees; D=Discontinued183
Table 6.3.9: Grade wise status of upper primary school leavers whose houses were visited-ST, 2008-09Sr.Grade 5 Grade 6 Grade 7 Grade 8 Average Upper Primary StageNo StateR P D R P D R P D R P D R P D1 Andhra Pradesh - - - 0.0 50.0 50.0 25.0 25.0 50.0 - - - 7.1 42.9 50.02 Assam 25.0 25.0 50.0 0.0 0.0 100.0 - - - - - - 20.0 20.0 60.03 Chhattisgarh - - - 20.5 47.7 31.8 51.1 28.9 20.0 63.2 15.8 <strong>21</strong>.1 40.7 34.3 25.04 Gujarat 20.8 72.9 6.3 42.1 45.6 12.3 33.3 58.3 8.3 - - - 32.6 58.1 9.35 Himachal Pradesh - - - 0.0 70.0 30.0 0.0 40.0 60.0 100.0 0.0 0.0 7.4 48.1 44.46 Jharkhand - - - 44.1 31.5 24.3 37.0 45.7 17.4 42.4 33.3 24.2 41.1 37.3 <strong>21</strong>.67 Karnataka - - - 0.0 66.7 33.3 0.0 25.0 75.0 - - - 0.0 53.8 46.28 Madhya Pradesh - - - 13.3 46.7 40.0 24.2 18.2 57.6 25.0 0.0 75.0 17.2 35.3 47.49 Maharashtra 34.8 56.5 8.7 0.0 83.3 16.7 0.0 100.0 0.0 - - - 17.0 74.5 8.510 Orissa - - - 11.6 59.4 29.0 32.3 44.6 23.1 - - - <strong>21</strong>.6 52.2 26.111 Rajasthan - - - 23.4 64.9 11.7 35.5 50.0 14.5 25.0 57.1 17.9 28.1 58.1 13.812 Uttarakhand - - - 0.0 50.0 50.0 50.0 0.0 50.0 - - - 25.0 25.0 50.0All States - - - 25.4 49.1 25.6 32.6 42.9 24.5 44.3 30.9 24.7 30.1 44.9 25.1Table 6.3.10: Grade wise status of upper primary school leavers whose houses were visited-ST, 2009-10Sr.Grade 5 Grade 6 Grade 7 Grade 8 Average Upper Primary StageNo StateR P D R P D R P D R P D R P D1 Andhra Pradesh - - - 0.0 100.0 0.0 0.0 0.0 100.0 - - - 0.0 25.0 75.02 Assam - - - - - - - - - - - - - - -3 Chhattisgarh - - - 18.2 36.4 45.5 12.5 25.0 62.5 12.5 12.5 75.0 14.8 25.9 59.34 Gujarat 36.0 48.0 16.0 31.4 62.9 5.7 30.0 60.0 10.0 - - - 32.9 57.1 10.05 Himachal Pradesh - - - 0.0 100.0 0.0 0.0 0.0 100.0 0.0 100.0 0.0 0.0 80.0 20.06 Jharkhand - - - 40.4 24.6 35.1 44.4 22.2 33.3 50.0 5.0 45.0 43.4 20.5 36.17 Karnataka - - - 6.3 68.8 25.0 0.0 0.0 100.0 - - - 3.8 42.3 53.88 Madhya Pradesh - - - 16.7 40.7 42.6 <strong>21</strong>.7 <strong>21</strong>.7 56.5 0.0 25.0 75.0 15.7 33.7 50.69 Maharashtra 0.0 100.0 0.0 100.0 0.0 0.0 0.0 75.0 25.0 - - - 11.1 77.8 11.110 Orissa - - - 11.1 53.3 35.6 10.8 50.5 38.7 - - - 10.9 51.4 37.711 Rajasthan - - - 19.6 65.2 15.2 13.0 78.3 8.7 18.2 63.6 18.2 16.7 70.2 13.<strong>21</strong>2 Uttarakhand - - - - - - 0.0 100.0 0.0 - - - 0.0 100.0 0.0All States - - - 23.0 47.8 29.2 19.8 43.9 36.4 22.4 29.9 47.8 <strong>21</strong>.5 44.1 34.3R=Continued as Repeater; P=Continued as Promotees; D=Discontinued184
Table 6.3.11: Grade wise status of primary school leavers whose houses were visited-Muslims, 2008-09SrStateGrade 5 Grade 6 Grade 7 Grade 8 Average Upper Primary StageNo.R P D R P D R P D R P D R P D1 Assam 43.2 9.5 47.3 45.8 7.5 46.7 64.5 1.6 33.9 - - - 49.8 6.6 43.62 Bihar - - - 45.8 31.3 22.9 16.7 62.5 20.8 25.0 75.0 0.0 34.1 47.7 18.23 Gujarat 22.0 68.0 10.0 40.8 57.1 2.0 60.0 20.0 20.0 - - - 33.9 58.7 7.34 Jammu & Kashmir - - - 20.0 50.0 30.0 33.3 53.3 13.3 18.8 75.0 6.2 25.8 57.6 16.75 Jharkhand - - - 60.0 26.7 13.3 63.9 25.0 11.1 50.0 50.0 0.0 60.2 29.0 10.86 Karnataka - - - 10.3 62.1 27.6 42.9 0.0 57.1 - - - 16.7 50.0 33.37 Kerala 20.0 60.0 20.0 66.7 22.2 11.1 66.7 0.0 33.3 - - - 55.0 25.0 20.08 Uttar Pradesh - - - 8.7 52.2 39.1 30.8 46.2 23.1 0.0 0.0 100.0 23.7 47.4 28.99 Uttarakhand - - - 0.0 75.0 25.0 40.0 20.0 40.0 - - - 28.6 35.7 35.710 West Bengal 59.4 31.3 9.4 58.3 22.2 19.4 53.5 20.9 25.6 52.5 25.0 22.5 55.6 24.5 19.9All States - - - 38.0 36.4 25.6 44.2 32.9 22.9 39.8 43.9 16.3 40.5 35.8 23.6R=Continued as Repeater; P=Continued as Promotees; D=DiscontinuedTable 6.3.12: Grade wise status of primary school leavers whose houses were visited-Muslims, 2009-10SrGrade 5 Grade 6 Grade 7 Grade 8 Average Upper Primary StageStateNo.R P D R P D R P D R P D R P D1 Assam 53.3 17.8 28.9 25.4 9.0 65.7 57.6 5.1 37.3 - - - 43.9 9.9 46.22 Bihar - - - 38.0 32.0 30.0 22.7 45.5 31.8 0.0 0.0 100.0 29.6 36.7 33.73 Gujarat 53.8 38.5 7.7 8.3 75.0 16.7 64.3 28.6 7.1 - - - 41.6 48.1 10.44 Jammu & Kashmir - - - 16.7 66.7 16.7 50.0 50.0 0.0 0.0 100.0 0.0 25.0 66.7 8.35 Jharkhand - - - 67.7 22.6 9.7 65.4 26.9 7.7 42.9 14.3 42.9 64.1 23.4 12.56 Karnataka - - - 0.0 38.5 61.5 10.0 0.0 90.0 - - - 4.3 <strong>21</strong>.7 73.97 Kerala 77.8 0.0 22.2 50.0 0.0 50.0 0.0 100.0 0.0 - - - 64.3 7.1 28.68 Uttar Pradesh - - - 42.9 0.0 57.1 60.0 4.0 36.0 100.0 0.0 0.0 57.6 3.0 39.49 Uttarakhand - - - 20.0 0.0 80.0 25.0 25.0 50.0 33.3 0.0 66.7 25.0 8.3 66.710 West Bengal 69.0 24.1 6.9 76.2 0.0 23.8 26.7 6.7 66.7 78.9 5.3 15.8 65.5 10.7 23.8All States - - - 37.1 27.5 35.4 44.5 23.2 32.3 56.5 15.2 28.3 41.7 24.8 33.6R=Continued as Repeater; P=Continued as Promotees; D=Discontinued185
Table 6.4.1 Grade wise school leavers’ rate for SCs in primary stage as on 30th Sep 2008 and 30th Sep 20092008-09 2009-10Sr.StateAverageAverageNoGrade 1 Grade 2 Grade 3 Grade 4 Grade 5 Primary Stage Grade 1 Grade 2 Grade 3 Grade 4 Grade 5 Primary Stage1 Andhra Pradesh 12.8 13.2 9.5 12.7 2.3 10.3 8.2 9.2 7.7 6.8 5.2 7.52 Bihar 7.1 8.9 7.3 6.3 5.4 7.2 10.3 11.1 9.3 6.6 6.5 9.23 Delhi 0.8 0.8 0.7 0.6 0.5 0.7 1.5 0.5 0.7 0.4 0.6 0.74 Haryana 3.2 3.6 5.0 5.0 1.0 3.6 2.4 1.1 1.6 1.7 0.7 1.55 Himachal Pradesh 5.6 5.9 4.7 4.2 1.2 4.3 2.3 2.5 2.8 1.5 2.2 2.36 Jammu & Kashmir 9.2 5.0 2.9 10.5 2.1 6.0 8.8 4.4 4.5 1.8 1.6 4.27 Karnataka 7.9 7.2 8.1 6.4 5.6 7.1 5.8 3.7 3.6 4.8 5.3 4.78 Madhya Pradesh 9.9 8.8 8.7 7.3 5.5 8.1 2.9 1.4 1.8 1.6 1.9 1.99 Maharashtra 7.4 4.9 4.9 8.4 - 6.4 3.6 3.7 2.0 4.3 - 3.410 Orissa 4.5 3.6 5.0 5.2 5.3 4.7 0.9 5.8 1.6 3.9 2.7 2.911 Punjab 6.7 7.0 6.7 7.2 4.5 6.5 6.9 4.6 5.6 5.0 4.9 5.412 Rajasthan 13.3 12.2 15.5 9.9 10.6 12.6 8.6 7.3 8.1 4.8 4.0 6.813 Tamil Nadu 5.4 3.4 3.6 2.1 2.3 3.3 2.6 2.2 1.6 1.0 2.6 2.014 Uttar Pradesh 12.1 9.0 10.3 8.9 5.5 9.1 3.2 3.7 3.6 3.5 2.3 3.315 Uttarakhand 4.0 2.3 2.1 3.1 0.0 2.4 1.4 0.5 0.8 0.9 0.2 0.716 West Bengal 2.6 3.8 3.7 1.4 - 2.9 3.0 2.1 1.0 1.0 - 1.9All States 7.8 7.3 7.4 6.5 4.8 6.8 5.0 4.8 3.9 3.5 3.0 4.1186
Table 6.4.2 Grade wise school leavers’ rate for STs in primary stage as on 30th Sep 2008 and 30th Sep 20092008-09 2009-10Sr.StateNoGrade 1 Grade 2 Grade 3 Grade 4 Grade 5 AveragePrimary StageGrade 1 Grade 2 Grade 3 Grade 4 Grade 5 AveragePrimary Stage1 Andhra Pradesh 26.6 13.6 8.3 17.5 1.3 14.1 10.6 12.4 8.8 8.3 1.1 8.32 Assam 4.4 3.2 2.2 0.3 - 2.6 0.8 0.7 0.8 0.7 - 0.83 Chhattisgarh 5.0 5.8 5.5 4.9 3.9 5.1 2.4 1.6 4.7 2.3 1.6 2.34 Gujarat 4.3 3.5 3.1 3.7 - 3.7 3.4 3.2 3.3 3.1 - 3.35 Himachal Pradesh 1.0 1.5 3.4 2.4 3.4 2.3 0.6 0.6 1.2 1.0 0.0 0.76 Jharkhand 18.0 17.2 18.4 18.2 11.8 16.9 12.5 11.5 12.0 11.3 4.7 10.67 Karnataka 8.7 5.4 2.5 8.3 6.2 6.2 6.2 2.4 3.3 5.6 3.7 4.28 Madhya Pradesh 7.1 5.0 7.0 5.2 3.1 5.7 4.0 3.0 2.1 2.9 4.4 3.39 Maharashtra 11.2 10.3 5.5 6.5 - 8.7 3.7 2.3 2.5 1.2 - 2.510 Orissa 6.8 6.4 5.5 4.8 7.0 6.1 4.6 3.5 6.0 3.4 3.1 4.111 Rajasthan 17.8 15.7 15.9 14.6 11.8 15.6 12.3 12.6 10.2 9.7 7.5 10.912 Uttarakhand 0.4 1.6 1.9 0.0 0.0 0.8 0.9 0.3 1.3 0.9 0.0 0.7All States 10.0 8.3 7.8 7.7 6.2 8.2 6.1 5.3 5.4 4.6 3.7 5.1Table 6.4.3 Grade wise school leavers’ rate for Muslims in primary stage as on 30th Sep 2008 and 30th Sep 20092008-09 2009-10Sr.State Grade 1 Grade 2 Grade 3 Grade 4 Grade 5 Average Grade 1 Grade 2 Grade 3 Grade 4 Grade 5 AverageNoPrimary StagePrimary Stage1 Assam 5.6 3.6 6.3 2.7 - 4.6 4.4 3.5 3.6 2.5 - 3.62 Bihar 12.2 9.7 8.6 10.3 8.7 9.9 9.0 6.9 9.5 7.6 9.1 8.53 Gujarat 11.4 9.0 8.5 7.3 - 9.0 3.9 2.0 3.2 5.7 - 3.74 Jammu & Kashmir 13.4 7.3 5.6 7.3 3.5 7.7 18.4 8.3 4.2 2.6 0.9 7.75 Jharkhand 11.3 13.0 10.7 12.5 9.5 11.4 12.6 8.9 7.5 3.0 5.1 7.56 Karnataka 3.3 4.3 2.2 5.3 2.9 3.6 3.6 2.6 2.7 2.6 2.0 2.77 Kerala 1.4 1.6 1.4 1.3 - 1.4 0.5 2.2 0.9 0.8 - 1.18 Uttar Pradesh 9.5 3.3 4.5 3.6 6.8 5.3 4.1 2.2 2.4 2.4 0.7 2.49 Uttarakhand 2.7 4.8 1.0 0.9 0.4 2.1 0.1 1.1 0.3 0.8 0.1 0.510 West Bengal 4.6 5.0 4.8 2.7 - 4.4 2.5 2.9 2.6 1.9 - 2.5All States 7.8 5.4 5.8 5.2 6.4 6.1 4.8 3.4 3.3 3.1 2.6 3.5187
Table 6.4.4 Grade wise school leavers’ rate for SCs in upper primary stage as on 30th Sep 2008 and 30th Sep 20092008-09 2009-10Sr.StateAverage UpperAverage UpperNoGrade 5 Grade 6 Grade 7 Grade 8Grade 5 Grade 6 Grade 7 Grade 8Primary StagePrimary Stage1 Andhra Pradesh - 7.2 0.6 - 3.6 - 4.6 2.7 - 3.62 Bihar - 6.0 7.1 1.0 5.2 - 11.9 5.2 2.1 6.83 Delhi - 0.3 0.0 0.0 0.1 - 0.0 0.2 0.4 0.24 Haryana - 1.7 2.1 3.2 2.3 - 1.1 0.8 0.8 0.95 Himachal Pradesh - 3.1 1.5 1.3 1.9 - 1.1 0.0 0.4 0.56 Jammu & Kashmir - 4.2 5.9 0.1 3.4 - 3.0 3.4 1.2 2.57 Karnataka - 5.1 1.6 - 3.4 - 4.5 2.3 - 3.48 Madhya Pradesh - 8.4 4.5 0.5 5.2 - 3.4 2.3 1.8 2.69 Maharashtra 7.8 4.4 2.5 - 4.7 1.3 1.1 1.4 - 1.310 Orissa - 6.2 4.6 - 5.3 - 3.2 6.6 - 5.011 Punjab - 4.0 4.5 5.1 4.5 - 4.4 4.1 5.1 4.512 Rajasthan - 9.4 11.7 4.6 8.8 - 6.8 3.6 1.1 3.913 Tamil Nadu - 6.2 5.4 3.1 4.9 - 3.5 1.7 1.8 2.314 Uttar Pradesh - 8.7 8.9 1.4 6.5 - 1.1 4.4 3.7 3.<strong>21</strong>5 Uttarakhand - 2.5 2.8 0.2 1.9 - 1.6 1.5 1.2 1.416 West Bengal 2.6 0.9 0.7 1.3 1.5 0.6 1.9 1.0 1.0 1.1All States - 6.5 5.9 2.1 5.2 - 4.0 3.2 2.5 3.3188
Table 6.4.5 Grade wise school leavers’ rate for STs in upper primary stage as on 30th Sep 2008 and 30th Sep 20092008-09 2009-10Sr.StateAverage UpperNoGrade 5 Grade 6 Grade 7 Grade 8Grade 5 Grade 6 Grade 7 Grade 8Primary StageAverage UpperPrimary Stage1 Andhra Pradesh - 12.7 10.7 - 11.7 - 1.3 1.5 - 1.42 Assam 3.0 1.1 0.0 - 1.4 0.0 0.0 0.0 - 0.03 Chhattisgarh - 5.4 9.2 5.4 6.6 - 2.2 1.1 1.3 1.54 Gujarat 4.9 5.2 2.1 - 4.1 3.2 3.2 0.7 - 2.45 Himachal Pradesh - 3.3 7.1 1.0 3.5 - 1.5 0.3 0.7 0.96 Jharkhand - 11.8 12.3 6.2 10.5 - 5.8 5.4 3.6 5.17 Karnataka - 3.5 2.2 - 2.9 - 6.3 3.2 - 4.68 Madhya Pradesh - 7.7 4.6 1.0 5.0 - 4.6 3.9 3.3 4.09 Maharashtra 8.3 6.6 5.0 - 6.8 1.2 1.4 2.2 - 1.610 Orissa - 6.4 7.1 - 6.8 - 4.6 12.0 - 8.411 Rajasthan - 12.4 9.6 4.0 8.3 - 7.8 6.1 3.5 5.712 Uttarakhand - 2.9 2.6 0.0 1.9 - 0.0 2.2 0.0 0.6All States - 7.6 6.4 3.5 6.3 - 4.4 4.8 2.9 4.3Table 6.4.6 Grade wise school leavers’ rate for Muslims in upper primary stage as on 30th Sep 2008 and 30th Sep 20092008-09 2009-10Sr.StateAverage UpperAverage UpperNoGrade 5 Grade 6 Grade 7 Grade 8Grade 5 Grade 6 Grade 7 Grade 8Primary StagePrimary Stage1 Assam 7.9 10.7 5.5 - 8.0 4.5 6.0 5.2 - 5.22 Bihar - 4.7 3.5 1.2 3.3 - 3.5 1.7 0.5 2.03 Gujarat 6.8 7.4 2.3 - 5.5 6.3 4.2 2.5 - 4.34 Jammu & Kashmir - 2.5 4.5 3.7 3.5 - 1.0 1.0 0.4 0.85 Jharkhand - 14.4 12.7 5.6 11.8 - 8.2 8.3 3.2 7.06 Karnataka - 4.8 0.8 - 2.9 - 2.0 1.7 - 1.97 Kerala 0.6 1.6 0.7 - 1.0 0.9 0.4 0.1 - 0.58 Uttar Pradesh - 5.3 15.3 0.1 7.7 - 3.5 9.3 0.2 4.29 Uttarakhand - 1.3 4.2 0.0 1.7 - 1.0 1.0 0.7 0.910 West Bengal 0.6 0.8 1.2 1.3 0.9 0.6 0.8 0.4 0.3 0.6All States - 6.2 7.9 1.2 5.7 - 3.7 4.7 0.5 3.3189
Table 6.5.1 Grade wise dropouts among school leavers for SCs in primary stage as on 30th Sep 2008 and 30th Sep 20092008-09 2009-10Sr.StateAverageAverageNoGrade 1 Grade 2 Grade 3 Grade 4 Grade 5 Primary Stage Grade 1 Grade 2 Grade 3 Grade 4 Grade 5 Primary Stage1 Andhra Pradesh 8.8 5.4 13.7 12.4 62.3 11.9 13.8 1.4 14.6 1.7 50.7 13.62 Bihar 38.9 33.3 25.3 23.0 53.7 33.8 <strong>21</strong>.2 28.4 39.6 28.6 63.6 31.73 Delhi 64.3 61.1 54.9 50.9 84.9 62.2 15.5 40.1 14.3 27.1 76.3 29.54 Haryana 4.4 17.7 13.4 19.4 38.7 15.2 24.6 14.0 24.0 34.4 38.3 26.25 Himachal Pradesh 8.8 17.8 4.8 4.0 35.6 10.7 11.2 26.8 29.4 10.6 30.6 22.76 Jammu & Kashmir 15.8 22.5 18.5 8.5 37.2 16.0 19.2 14.8 12.9 0.0 52.9 18.17 Karnataka 17.1 20.6 20.7 27.7 54.5 26.1 20.7 41.6 14.0 38.2 75.5 40.18 Madhya Pradesh 11.6 30.3 42.2 22.9 73.1 31.9 74.9 48.3 45.8 52.6 96.3 66.39 Maharashtra 15.6 10.7 4.7 48.5 - 22.9 25.9 30.3 13.3 42.2 - 30.410 Orissa 18.6 <strong>21</strong>.3 25.5 7.0 51.8 25.1 0.0 7.1 22.6 8.2 76.0 20.811 Punjab 41.8 37.4 40.1 29.8 56.9 39.8 49.8 42.4 55.1 62.3 68.3 55.312 Rajasthan 17.7 16.2 12.5 17.4 53.9 20.4 17.9 16.4 17.9 25.2 56.3 22.013 Tamil Nadu 7.1 18.5 13.9 19.2 44.5 18.0 16.1 16.4 44.5 51.0 31.3 28.714 Uttar Pradesh 13.4 12.1 14.6 15.8 82.1 22.5 39.0 58.6 54.6 53.4 63.7 53.615 Uttarakhand 27.9 45.7 35.3 27.5 - 32.2 38.8 67.3 58.0 39.8 50.0 48.<strong>21</strong>6 West Bengal 61.2 52.8 54.6 60.8 - 56.5 61.8 45.6 44.7 65.5 - 56.0All States 20.8 <strong>21</strong>.0 20.4 22.3 61.2 25.8 27.3 29.0 34.0 36.3 60.0 34.6190
Table 6.5.2 Grade wise dropouts among school leavers for STs in primary stage as on 30th Sep 2008 and 30th Sep 20092008-09 2009-10Sr.StateAverageAverageNoGrade 1 Grade 2 Grade 3 Grade 4 Grade 5 Primary Stage Grade 1 Grade 2 Grade 3 Grade 4 Grade 5 Primary Stage1 Andhra Pradesh 23.0 33.9 24.9 10.8 47.0 22.5 8.8 17.8 23.9 <strong>21</strong>.5 0.0 16.82 Assam 32.8 0.0 0.0 100.0 - 17.0 74.7 69.5 59.5 33.3 - 60.13 Chhattisgarh 11.9 12.9 29.7 <strong>21</strong>.8 48.2 20.9 60.6 51.8 64.8 68.6 72.5 62.54 Gujarat 9.8 0.0 15.7 40.7 - 16.1 6.3 15.2 8.1 30.9 - 14.75 Himachal Pradesh 0.0 0.0 0.0 0.0 15.7 4.8 0.0 0.0 0.0 0.0 - 0.06 Jharkhand 30.5 26.8 24.2 23.3 54.2 29.7 31.2 30.5 30.4 26.2 53.3 31.67 Karnataka 49.2 27.0 23.8 27.3 35.9 34.7 40.2 0.0 25.4 28.6 71.0 34.58 Madhya Pradesh 22.9 34.5 20.9 12.4 50.2 24.8 76.1 65.2 77.6 50.4 87.7 72.89 Maharashtra 17.6 0.0 0.0 22.0 . 9.8 38.3 10.2 24.5 41.4 - 28.710 Orissa 17.2 24.8 24.0 15.5 48.5 26.6 19.1 28.6 23.6 15.8 68.8 28.711 Rajasthan 14.3 16.4 33.3 14.0 48.4 22.1 22.1 27.7 15.3 18.6 58.4 25.512 Uttarakhand 100.0 25.0 43.5 - - 41.7 100.0 0.0 31.1 52.8 - 52.1All States <strong>21</strong>.0 20.5 24.4 18.7 42.5 23.7 32.1 32.1 31.4 28.0 63.8 34.9Table 6.5.3 Grade wise dropouts among school leavers for Muslims in primary stage as on 30th Sep 2008 and 30th Sep 20092008-09 2009-10Sr.StateAverageAverageNoGrade 1 Grade 2 Grade 3 Grade 4 Grade 5 Primary Stage Grade 1 Grade 2 Grade 3 Grade 4 Grade 5 Primary Stage1 Assam 32.4 36.8 40.0 43.1 - 37.0 60.5 57.7 74.8 69.1 - 64.22 Bihar 36.4 32.3 34.6 35.3 58.0 38.7 40.5 40.6 27.9 20.5 58.1 37.83 Gujarat 3.8 2.2 5.5 41.3 - 12.6 8.7 10.8 11.7 40.8 - 22.44 Jammu & Kashmir 5.0 4.6 5.1 15.5 43.6 10.6 0.0 2.0 8.4 9.5 86.7 3.65 Jharkhand 18.7 14.7 17.5 15.4 39.9 20.2 8.4 18.3 11.7 26.6 43.4 17.46 Karnataka 27.6 22.8 17.6 25.5 56.3 29.2 51.0 54.0 19.8 40.6 72.3 46.17 Kerala 18.8 6.1 0.0 48.8 - 17.6 0.0 0.0 0.0 41.0 - 7.88 Uttar Pradesh 6.0 26.0 9.3 9.0 9.6 10.7 49.3 47.0 44.0 45.6 59.4 47.79 Uttarakhand 40.9 45.6 72.2 47.4 100.0 47.9 100.0 79.8 100.0 82.2 100.0 84.510 West Bengal 41.5 48.4 44.6 78.4 - 48.5 50.4 43.9 32.7 66.0 - 47.0All States 18.0 26.0 <strong>21</strong>.4 26.2 27.6 23.2 36.7 36.6 32.4 36.3 45.7 36.9191
Table 6.5.4 Grade wise dropouts among school leavers for SCs in upper primary stage as on 30th Sep 2008 and 30th Sep 20092008-09 2009-10Sr.StateAverage UpperAverage UpperNoGrade 5 Grade 6 Grade 7 Grade 8Grade 5 Grade 6 Grade 7 Grade 8Primary StagePrimary Stage1 Andhra Pradesh - 24.3 0.0 - <strong>21</strong>.9 - 37.7 52.0 - 42.92 Bihar - 19.1 8.3 50.9 15.2 - <strong>21</strong>.9 35.3 37.4 27.03 Delhi - 0.0 0.0 - 0.0 - - 80.0 100.0 93.94 Haryana - 29.2 22.9 18.5 22.9 - 52.8 5.4 38.2 34.25 Himachal Pradesh - 70.6 72.3 61.7 69.1 - 28.0 - 50.0 34.36 Jammu & Kashmir - 31.3 26.8 0.0 28.5 - 41.9 33.6 53.7 39.97 Karnataka - 22.1 49.8 - 28.1 - 48.6 83.6 - 60.78 Madhya Pradesh - 19.0 24.1 0.0 19.9 - 70.7 32.1 0.0 45.19 Maharashtra 10.0 0.0 0.0 - 4.7 0.0 0.0 49.2 - 18.710 Orissa - 33.4 13.2 - 24.3 - 22.4 63.3 - 51.511 Punjab - 22.2 14.3 15.4 17.2 - 42.0 48.1 19.0 35.012 Rajasthan - 19.4 31.4 45.7 28.9 - 38.8 46.1 10.8 38.713 Tamil Nadu - 25.9 18.4 34.2 24.7 - 51.8 27.9 32.7 40.414 Uttar Pradesh - 33.5 42.4 22.4 36.9 - 24.7 38.1 38.4 36.915 Uttarakhand - 42.3 31.3 100.0 38.7 - 2.2 19.0 60.8 25.316 West Bengal 90.1 64.6 70.5 45.9 75.4 40.8 62.9 75.0 41.7 59.3All States - 24.5 29.7 27.7 26.9 - 34.3 43.2 33.9 37.5192
Table 6.5.5 Grade wise dropouts among school leavers for STs in upper primary stage as on 30th Sep 2008 and 30th Sep 20092008-09 2009-10Sr.StateAverage UpperNoGrade 5 Grade 6 Grade 7 Grade 8Grade 5 Grade 6 Grade 7 Grade 8Primary StageAverage UpperPrimary Stage1 Andhra Pradesh - 56.5 50.0 - 53.7 - 0.0 100.0 - 52.62 Assam 26.0 100.0 - - 43.3 - - - - -3 Chhattisgarh - 40.6 14.8 19.3 23.2 - 64.4 72.4 79.8 70.64 Gujarat 5.6 12.0 6.3 - 8.5 30.7 10.1 13.6 - 19.05 Himachal Pradesh - 30.0 58.4 0.0 42.6 - 0.0 100.0 0.0 10.46 Jharkhand - 15.1 15.6 16.9 15.6 - 35.5 <strong>21</strong>.3 37.3 30.27 Karnataka - 34.7 85.3 - 53.9 - 22.5 100.0 - 51.78 Madhya Pradesh - 45.3 51.8 79.8 48.9 - 37.8 56.3 78.4 52.19 Maharashtra 5.5 32.2 0.0 - 12.3 0.0 0.0 34.2 - 13.910 Orissa - 32.0 17.9 - 24.6 - 29.0 47.8 - 42.811 Rajasthan - 12.6 18.0 20.6 16.0 - 12.8 6.8 12.1 10.612 Uttarakhand - 44.2 50.0 - 46.8 - - 0.0 - 0.0All States - 28.3 23.4 23.8 25.9 - 29.7 41.7 51.4 37.9Table 6.5.6 Grade wise dropouts among school leavers for Muslims in upper primary stage as on 30th Sep 2008 and 30th Sep 20092008-09 2009-10Sr.StateAverage UpperAverage UpperNoGrade 5 Grade 6 Grade 7 Grade 8Grade 5 Grade 6 Grade 7 Grade 8Primary StagePrimary Stage1 Assam 29.4 40.3 32.4 - 34.7 15.6 48.5 25.7 - 31.12 Bihar - <strong>21</strong>.6 29.8 0.0 22.0 - 38.3 48.5 100.0 45.63 Gujarat 4.1 1.4 24.2 - 5.7 0.0 10.7 8.8 - 4.94 Jammu & Kashmir - 39.2 14.1 6.7 18.9 - <strong>21</strong>.1 0.0 0.0 9.35 Jharkhand - 10.6 7.7 0.0 8.4 - 3.9 4.6 74.5 12.26 Karnataka - 25.8 58.4 - 30.4 - 67.3 93.6 - 79.77 Kerala 41.7 12.9 14.5 - 18.2 29.5 72.5 0.0 - 37.18 Uttar Pradesh - 64.4 17.7 100.0 28.0 - 69.9 36.3 0.0 43.99 Uttarakhand - 5.9 37.9 - 31.0 - 94.4 19.1 53.1 66.<strong>21</strong>0 West Bengal 6.5 12.6 34.6 10.1 16.9 4.7 32.0 68.4 9.0 27.0All States - 32.8 19.6 13.3 24.9 - 40.2 32.5 48.8 36.4193
Table 6.6: Number of SC, ST and Muslim graduates of terminal grades whose houses were visited2008-09 2009-10Sr.Primary Upper primary Primary Upper primaryNo.StateSC ST Muslims SC ST Muslims SC ST Muslims SC ST Muslims1 Andhra Pradesh 378 174 81 193 31 12 406 184 72 147 26 222 Assam 430 378 817 179 116 917 382 363 758 198 131 8853 Bihar 591 <strong>21</strong> 407 1 - 47 653 24 4<strong>21</strong> 85 - 654 Chhattisgarh 241 602 8 - 5 - 280 745 11 - - -5 Delhi 1,259 115 884 389 - 2 1,297 120 896 389 - 26 Gujarat 37 137 107 380 1,015 619 30 138 133 375 1,027 6637 Haryana 785 7 24 - - 1 774 7 24 - - -8 Himachal Pradesh 476 87 17 12 1 - 450 81 9 2 - -9 Jammu & Kashmir 208 18 232 6 1 6 144 8 176 18 2 1810 Jharkhand 189 760 410 45 55 43 186 597 330 80 154 7711 Karnataka 208 98 87 600 258 530 225 97 79 635 303 58412 Kerala 233 31 462 391 116 1,002 <strong>21</strong>2 48 551 403 118 92813 Madhya Pradesh 468 592 32 - - - 447 665 32 - - -14 Maharashtra 259 84 156 395 129 182 272 113 148 394 139 14915 Orissa 432 588 88 387 509 17 440 592 75 427 591 <strong>21</strong>16 Punjab 1,231 2 6 9 - - 1,498 - 10 - - -17 Rajasthan 300 261 64 27 22 10 277 227 54 20 50 1018 Tamil Nadu 696 38 105 11 - 37 671 40 110 11 - 3519 Uttar Pradesh 1,045 <strong>21</strong> 693 - - - 999 8 686 - - -20 Uttarakhand 614 134 287 - - - 674 153 377 - - -<strong>21</strong> West Bengal 1,146 <strong>21</strong>9 1,870 125 36 100 1,187 <strong>21</strong>5 2,020 126 33 84All States 11,473 4,502 7,025 2,903 2,159 3,337 11,751 4,604 7,130 3,063 2,395 3,385194
Table 6.7.1 Grade wise promotion rate for SCs in primary stage as on 30th Sep 2008 and 30th Sep 20092008-09 2009-10Sr.StateAverageAverageNoGrade 1 Grade 2 Grade 3 Grade 4 Grade 5 Primary Stage Grade 1 Grade 2 Grade 3 Grade 4 Grade 5 Primary Stage1 Andhra Pradesh 91.2 94.7 95.6 92.2 89.7 92.8 96.2 95.0 96.1 97.2 90.8 95.12 Bihar 69.5 82.0 85.9 90.0 82.6 80.7 69.2 78.8 81.2 88.7 85.7 79.23 Delhi 97.0 97.1 98.0 98.4 89.7 96.0 96.6 97.9 97.4 98.9 78.0 93.74 Haryana 95.9 94.9 93.9 92.3 88.6 93.4 97.6 97.8 97.3 96.8 91.8 96.45 Himachal Pradesh 95.6 96.3 97.6 97.5 92.9 96.0 98.8 98.4 98.7 98.8 91.9 97.36 Jammu & Kashmir 81.9 96.2 97.0 95.3 96.3 93.5 87.6 93.5 95.1 97.6 93.7 93.57 Karnataka 95.4 97.8 96.9 96.7 92.8 96.0 97.8 97.7 98.7 97.0 94.0 97.08 Madhya Pradesh 85.8 87.1 87.2 88.4 83.0 86.3 86.6 90.0 91.1 90.0 88.3 89.19 Maharashtra 94.5 96.8 96.9 92.5 - 95.2 98.5 98.5 99.5 94.4 - 97.710 Orissa 82.0 91.3 90.7 95.3 85.0 88.6 85.9 94.9 96.5 97.5 91.1 93.111 Punjab 86.5 84.9 83.6 83.2 85.0 84.7 85.0 90.1 88.4 89.3 87.8 88.112 Rajasthan 75.6 80.4 79.6 87.4 81.3 80.3 79.1 84.3 88.9 93.5 89.4 86.413 Tamil Nadu 95.2 98.3 99.1 99.3 88.7 96.0 97.5 98.5 99.0 99.2 93.9 97.514 Uttar Pradesh 95.5 96.5 93.2 94.4 86.5 93.1 97.8 96.9 96.9 97.3 75.8 92.915 Uttarakhand 96.9 96.9 96.2 95.2 92.4 95.6 97.7 99.1 98.5 99.4 96.2 98.<strong>21</strong>6 West Bengal 69.9 85.9 86.8 78.2 - 79.5 73.3 87.9 90.9 86.9 - 84.0All States 85.0 90.9 90.9 91.5 87.0 89.0 86.9 91.7 93.4 93.9 85.7 90.4195
Table 6.7.2 Grade wise promotion rate for STs in primary stage as on 30th Sep 2008 and 30th Sep 20092008-09 2009-10Sr.StateAverageNoGrade 1 Grade 2 Grade 3 Grade 4 Grade 5Grade 1 Grade 2 Grade 3 Grade 4 Grade 5Primary StageAveragePrimary Stage1 Andhra Pradesh 85.6 91.6 95.8 87.7 87.9 89.7 95.8 93.8 94.7 94.9 91.8 94.22 Assam 92.8 95.1 94.0 85.3 - 92.0 91.6 97.0 97.2 93.0 - 94.73 Chhattisgarh 89.4 90.3 90.2 94.0 87.5 90.2 92.9 93.3 92.7 96.5 83.5 92.14 Gujarat 83.1 89.0 90.2 90.3 - 88.0 88.5 85.5 88.5 91.8 - 88.65 Himachal Pradesh 97.6 95.2 98.9 96.4 92.6 96.1 98.4 100.0 99.4 100.0 94.7 98.56 Jharkhand 69.8 78.6 79.2 81.0 79.3 77.4 73.9 84.6 82.5 86.0 87.0 82.57 Karnataka 93.5 97.8 98.3 97.1 95.7 96.5 95.5 99.4 98.7 97.1 95.5 97.48 Madhya Pradesh 73.6 81.0 81.8 80.7 81.4 79.3 79.4 88.2 89.7 90.3 81.8 85.69 Maharashtra 84.3 88.7 94.1 92.5 - 89.4 94.6 96.9 96.9 96.3 - 96.110 Orissa 86.2 92.6 93.1 95.2 86.1 90.5 85.8 93.2 93.7 94.9 92.4 91.711 Rajasthan 73.8 83.1 80.8 87.4 81.3 80.3 83.1 86.6 91.0 90.9 85.0 86.912 Uttarakhand 97.2 99.2 98.4 97.8 87.4 96.3 98.0 93.0 98.8 98.6 87.0 94.9All States 80.0 86.7 87.6 87.4 85.2 85.1 85.4 90.5 90.8 92.5 87.4 89.3Table 6.7.3 Grade wise promotion rate for Muslims in primary stage as on 30th Sep 2008 and 30th Sep 20092008-09 2009-10Sr.StateAverageAverageNoGrade 1 Grade 2 Grade 3 Grade 4 Grade 5 Primary Stage Grade 1 Grade 2 Grade 3 Grade 4 Grade 5 Primary1 Assam 74.3 79.7 84.2 86.6 - 80.6 80.1 86.3 87.3 84.8 - Stage 84.32 Bihar 72.8 82.6 84.8 85.1 86.5 82.3 77.0 84.0 84.2 87.4 87.8 84.13 Gujarat 95.6 97.5 95.8 91.7 - 95.0 96.3 97.4 94.7 92.3 - 95.24 Jammu & Kashmir 92.3 92.2 96.5 93.2 94.6 93.6 93.7 92.5 96.0 97.7 94.9 94.75 Jharkhand 63.7 73.0 83.2 85.9 85.3 78.2 71.4 80.6 85.5 94.4 92.3 84.66 Karnataka 97.5 97.7 99.1 98.4 96.8 97.9 98.1 98.4 99.3 98.2 96.9 98.27 Kerala 98.8 98.6 98.1 90.2 - 96.4 99.5 98.3 98.8 81.2 - 94.28 Uttar Pradesh 92.5 97.7 96.6 97.2 90.2 95.2 96.2 98.0 98.0 97.8 91.5 96.49 Uttarakhand 97.5 95.3 97.6 99.6 92.1 96.6 98.9 98.9 99.7 99.2 96.3 98.610 West Bengal 61.3 83.5 88.2 80.9 - 76.1 65.0 84.1 88.2 87.2 - 79.3All States 82.2 91.5 92.7 91.9 89.2 89.4 86.5 92.9 94.0 93.9 90.2 91.4196
Table 6.13.1 6.7.4 Grade wise promotion rate rate for SCs for in SCs upper in upper primary primary stage as stage on 30th as on Sep 30th 2008 Sep and 2008 30th Sep and 2009 30th Sep 20092008-09 2009-10Sr.AverageStateNoGrade 5 Grade 6 Grade 7 Grade 8 Upper Primary Grade 5 Grade 6 Grade 7 Grade 8Stage1 Andhra Pradesh - 95.9 92.1 - 93.8 - 97.3 94.9 - 96.12 Bihar - 93.7 91.9 96.7 93.8 - 87.6 92.7 97.4 92.23 Delhi - 98.1 95.7 94.2 96.1 - 98.5 97.3 99.1 98.34 Haryana - 90.6 92.0 90.7 91.1 - 95.3 95.1 98.2 96.25 Himachal Pradesh - 93.8 95.1 82.7 90.5 - 99.5 99.8 92.3 96.96 Jammu & Kashmir - 92.4 89.8 82.9 88.5 - 96.2 96.2 85.4 92.77 Karnataka - 98.1 88.2 - 93.4 - 95.8 88.6 - 92.18 Madhya Pradesh - 84.7 94.3 96.6 90.7 - 89.7 95.5 97.0 93.79 Maharashtra 97.6 98.7 96.0 - 97.5 99.6 99.8 94.3 - 97.810 Orissa - 94.2 76.3 - 84.7 - 96.7 86.6 - 91.<strong>21</strong>1 Punjab - 86.8 89.6 71.2 82.6 - 88.6 89.3 81.6 86.412 Rajasthan - 78.9 79.3 80.7 79.5 - 86.1 90.7 90.0 88.913 Tamil Nadu - 96.2 96.2 97.0 96.5 - 97.2 97.8 98.4 97.914 Uttar Pradesh - 94.5 93.9 99.5 95.9 - 99.0 96.1 97.6 97.515 Uttarakhand - 96.0 96.3 99.8 97.3 - 99.7 99.6 98.8 99.416 West Bengal 80.7 86.3 86.8 88.8 85.2 86.4 83.0 88.4 93.1 87.3All States - 91.8 90.7 93.7 91.8 - 93.6 93.5 95.5 94.1# For grade it is the pass out rate and not the promotion rate as house visit was not made to ascertain the whether the student continued in the next gradeAverageUpperPrimaryStage197
Table 6.7.5 Grade wise promotion rate for STs in upper primary stage as on 30th Sep 2008 and 30th Sep 20092008-09 2009-10Sr.StateAverage UpperNoGrade 5 Grade 6 Grade 7 Grade 8Grade 5 Grade 6 Grade 7 Grade 8#Primary StageAverage UpperPrimary Stage1 Andhra Pradesh - 90.6 88.6 - 89.6 - 99.5 98.5 - 99.02 Assam 97.0 96.3 75.0 - 89.6 94.4 100.0 98.6 - 97.63 Chhattisgarh - 93.1 90.3 93.6 92.4 - 97.2 96.3 97.3 96.94 Gujarat 89.7 89.5 85.7 - 88.3 89.4 92.4 88.5 - 90.25 Himachal Pradesh - 82.9 91.2 94.8 89.5 - 99.5 99.7 94.8 98.36 Jharkhand - 82.5 78.6 88.3 82.8 - 89.3 88.1 92.9 89.77 Karnataka - 98.8 91.2 - 95.1 - 98.0 85.4 - 91.28 Madhya Pradesh - 78.3 90.1 93.0 85.8 - 84.5 91.6 95.4 89.69 Maharashtra 92.6 94.3 94.3 - 93.6 96.0 98.2 98.5 - 97.510 Orissa - 94.3 81.4 - 87.8 - 97.1 85.2 - 91.011 Rajasthan - 85.7 87.6 86.9 86.8 - 89.8 93.8 92.7 92.112 Uttarakhand - 96.8 97.4 100.0 98.0 - 100.0 100.0 100.0 100.0All States - 87.1 86.6 91.0 87.7 - 91.3 90.8 94.7 91.8# For grade it is the pass out rate and not the promotion rate as house visit was not made to ascertain the whether the student continued in the next gradeTable 6.7.6 Grade wise promotion rate for Muslims in upper primary stage as on 30th Sep 2008 and 30th Sep 20092008-09 2009-10Sr.StateAverage UpperNoGrade 5 Grade 6 Grade 7 Grade 8Grade 5 Grade 6 Grade 7 Grade 8#Primary StageAverage UpperPrimary Stage1 Assam 88.8 79.4 87.3 - 85.3 94.0 92.3 89.0 - 91.92 Bihar - 92.6 95.3 98.1 95.2 - 94.4 97.1 98.3 96.43 Gujarat 94.9 93.7 87.0 - 91.7 90.0 95.8 91.2 - 92.24 Jammu & Kashmir - 92.9 95.5 89.2 92.5 - 98.5 99.1 94.2 97.45 Jharkhand - 84.2 82.4 91.4 85.3 - 87.4 91.2 95.1 90.66 Karnataka - 98.2 84.5 - 91.6 - 98.6 88.8 - 93.67 Kerala 99.2 98.5 91.6 - 96.0 99.0 98.5 88.8 - 95.38 Uttar Pradesh - 96.1 91.2 99.9 95.3 - 96.5 90.9 99.5 95.79 Uttarakhand - 98.1 96.3 100.0 98.4 - 99.0 99.1 99.3 99.110 West Bengal 82.1 89.7 88.8 92.7 87.8 86.8 90.5 92.8 96.6 91.0All States - 91.8 90.9 97.3 92.7 - 94.8 92.6 98.2 94.8198
Table 6.8.1 Grade wise repetition rate for SCs in primary stage as on 30th Sep 2008 and 30th Sep 20092008-09 2009-10Sr.StateAverageGra AverageNoGrade 1 Grade 2 Grade 3 Grade 4 Grade 5 Primary Stage Grade 1 Grade 2 Grade 3 Grade 4 de 5 Primary Stage1 Andhra Pradesh 7.6 4.6 3.1 6.2 2.1 4.8 2.7 4.8 2.8 2.7 0.5 2.72 Bihar 27.7 15.0 12.3 8.5 9.7 16.2 28.7 18.0 15.1 9.4 6.9 17.43 Delhi 2.5 1.7 1.6 1.3 0.6 1.5 3.1 1.9 1.9 1.0 0.9 1.84 Haryana 3.9 4.5 5.4 6.7 2.0 4.5 1.8 2.1 2.3 2.6 2.1 2.25 Himachal Pradesh 3.9 2.6 2.2 2.3 0.8 2.3 1.0 0.9 0.4 1.1 0.3 0.76 Jammu & Kashmir 16.6 2.7 2.5 3.9 1.0 5.1 10.8 5.8 4.3 2.4 1.6 4.97 Karnataka 3.3 0.7 1.4 1.6 1.0 1.6 1.0 0.8 0.7 1.2 0.2 0.88 Madhya Pradesh 13.0 10.3 9.1 9.9 7.2 10.0 11.2 9.4 8.1 9.2 4.3 8.59 Maharashtra 4.4 2.6 2.9 1.0 - 2.8 0.6 0.4 0.2 0.8 - 0.510 Orissa 17.2 7.9 8.0 4.4 3.7 8.6 14.1 4.7 3.1 2.2 2.3 5.511 Punjab 10.7 12.4 13.7 14.7 7.7 11.9 11.5 8.0 8.6 7.6 3.4 7.812 Rajasthan 22.0 17.7 18.5 10.4 8.2 16.4 19.4 14.5 9.7 4.9 5.2 11.613 Tamil Nadu 4.5 1.1 0.4 0.3 0.7 1.3 2.1 1.1 0.3 0.2 0.6 0.914 Uttar Pradesh 2.9 2.4 5.2 4.2 0.8 3.1 0.9 1.0 0.9 0.8 0.6 0.815 Uttarakhand 2.0 2.1 3.1 3.9 0.2 2.3 1.8 0.5 1.1 0.2 0.6 0.816 West Bengal 28.5 12.1 11.1 9.5 - 16.2 24.8 11.2 8.6 7.0 - 13.6All States 13.4 7.6 7.6 5.8 3.8 7.9 11.7 6.9 5.2 4.0 2.6 6.3199
Table 6.8.2 Grade wise repetition rate for STs in primary stage as on 30th Sep 2008 and 30th Sep 20092008-09 2009-10Sr.StateNoAverageAverageGrade 1 Grade 2 Grade 3 Grade 4 Grade 5 Primary Stage Grade 1 Grade 2 Grade 3 Grade 4 Grade 5 Primary Stage1 Andhra Pradesh 8.3 3.8 1.8 10.4 0.7 5.2 3.3 4.0 3.2 3.3 0.0 2.82 Assam 5.7 4.9 6.0 2.6 - 4.8 7.8 2.6 2.3 1.4 - 3.73 Chhattisgarh 10.0 8.9 8.2 5.0 2.4 7.7 5.7 5.9 4.3 1.9 1.3 4.24 Gujarat 16.5 11.0 9.3 7.9 - 11.3 11.3 14.0 11.3 7.1 - 10.95 Himachal Pradesh 2.4 4.8 1.1 3.6 5.3 3.4 1.6 0.0 0.6 0.0 2.2 0.96 Jharkhand 24.7 16.8 16.4 14.1 9.2 16.6 22.2 11.9 13.9 11.1 5.7 13.37 Karnataka 2.2 0.7 1.1 0.7 0.6 1.1 2.0 0.6 0.4 1.3 0.6 0.98 Madhya Pradesh 24.7 17.2 16.6 18.7 10.4 18.3 17.6 9.8 8.7 8.2 10.8 11.49 Maharashtra 13.7 11.3 5.9 2.5 - 9.0 4.0 2.9 2.5 1.3 - 2.810 Orissa 12.7 5.8 5.6 4.0 2.1 6.2 13.3 5.8 4.9 4.6 2.5 6.611 Rajasthan 23.6 14.3 13.9 10.5 6.0 15.1 14.2 9.9 7.5 7.3 6.2 9.712 Uttarakhand 2.4 0.4 0.7 2.2 0.0 1.2 1.1 7.0 0.8 0.9 0.0 1.9All States 17.9 11.4 10.4 9.6 6.3 11.7 12.6 7.8 7.4 5.6 5.8 8.1Table 6.8.3 Grade wise repetition rate for Muslims in primary stage as on 30th Sep 2008 and 30th Sep 20092008-09 2009-10Sr.StateAverageAverageNoGrade 1 Grade 2 Grade 3 Grade 4 Grade 5 Primary Stage Grade 1 Grade 2 Grade 3 Grade 4 Grade 5 Primary Stage1 Assam 23.9 19.0 13.3 5.4 - 16.2 17.3 11.6 10.0 8.0 - 12.22 Bihar 22.8 14.2 12.2 11.3 5.4 13.2 19.4 13.3 13.2 11.1 5.2 12.43 Gujarat 4.0 2.3 3.7 4.8 - 3.8 3.4 2.4 4.9 3.6 - 3.64 Jammu & Kashmir 7.0 7.5 3.2 5.7 0.8 4.9 6.3 7.3 3.7 2.0 1.7 4.55 Jharkhand 34.2 25.1 14.9 12.1 8.8 19.0 27.6 17.8 13.6 4.8 4.4 13.96 Karnataka 1.6 1.3 0.5 0.2 1.0 1.0 0.1 0.2 0.2 0.7 0.2 0.37 Kerala 1.0 1.3 1.9 1.2 - 1.3 0.5 1.7 1.2 1.5 - 1.28 Uttar Pradesh 6.9 1.5 2.9 2.5 5.8 3.7 1.8 0.9 0.9 1.1 0.3 1.09 Uttarakhand 1.4 2.5 1.7 0.0 0.4 1.3 1.0 0.2 0.0 0.1 0.0 0.310 West Bengal 36.8 14.1 9.7 10.1 - 20.4 33.8 14.7 11.0 4.9 - 18.2All States 16.4 7.1 6.1 5.2 5.9 8.4 11.8 5.9 4.8 3.3 2.8 6.0200
Table 6.8.4 Grade wise repetition rate for SCs in upper primary stage as on 30th Sep 2008 and 30th Sep 20092008-09 2009-10Sr.N StateAverage UpperGrade 5 Grade 6 Grade 7 Grade 8oPrimary StageGrade 5 Grade 6 Grade 7 Grade 8Average UpperPrimary Stage1 Andhra Pradesh - 2.3 0.4 - 1.2 - 1.0 0.0 - 0.52 Bihar - 5.1 7.5 2.7 5.4 - 9.8 5.4 1.8 6.03 Delhi - 1.9 1.9 5.8 3.1 - 1.5 1.9 0.5 1.34 Haryana - 8.9 7.5 8.7 8.4 - 4.1 4.9 1.5 3.55 Himachal Pradesh - 4.0 3.8 16.5 8.1 - 0.2 0.2 7.5 2.96 Jammu & Kashmir - 6.3 8.6 17.1 10.5 - 2.5 2.6 13.9 6.37 Karnataka - 0.8 0.6 - 0.7 - 1.3 0.4 - 0.88 Madhya Pradesh - 13.7 4.6 3.4 8.3 - 7.9 3.7 3.0 5.29 Maharashtra 1.6 1.3 1.6 - 1.5 0.3 0.2 0.7 - 0.410 Orissa - 3.6 17.0 - 10.7 - 2.6 4.3 - 3.511 Punjab - 12.3 9.8 28.0 16.6 - 9.5 8.8 17.4 12.012 Rajasthan - 18.4 17.1 17.2 17.6 - 11.2 7.6 9.9 9.613 Tamil Nadu - 2.1 2.8 2.0 2.3 - 1.0 1.8 1.0 1.<strong>21</strong>4 Uttar Pradesh - 2.5 2.3 0.1 1.7 - 0.7 2.2 0.9 1.315 Uttarakhand - 2.9 2.8 0.0 1.9 - 0.3 0.1 0.5 0.316 West Bengal 17.0 13.1 12.6 10.6 13.7 13.3 15.8 10.9 6.5 12.1All States - 6.5 5.7 5.7 6.0 - 5.0 3.6 3.6 4.1201
Table 6.8.5 Grade wise repetition rate for STs in upper primary stage as on 30th Sep 2008 and 30th Sep 20092008-09 2009-10Sr.StateAverage UpperNoGrade 5 Grade 6 Grade 7 Grade 8Grade 5 Grade 6 Grade 7 Grade 8Primary StageAverage UpperPrimary Stage1 Andhra Pradesh - 2.3 2.7 - 2.5 - 0.5 0.0 - 0.22 Assam 2.2 2.6 0.0 - 1.6 5.6 0.0 0.8 - 2.23 Chhattisgarh - 4.6 8.3 5.3 6.0 - 1.4 3.0 1.7 2.14 Gujarat 9.9 9.9 5.8 - 8.5 9.3 7.3 3.1 - 6.55 Himachal Pradesh - 16.1 4.6 5.2 9.0 - 0.5 0.0 5.2 1.66 Jharkhand - 15.7 18.8 10.7 15.4 - 8.7 9.9 5.7 8.47 Karnataka - 0.0 0.0 - 0.0 - 0.6 0.0 - 0.38 Madhya Pradesh - 18.2 7.5 6.2 11.8 - 13.7 6.2 2.1 8.39 Maharashtra 6.9 3.6 0.0 - 3.8 3.1 1.8 0.7 - 2.010 Orissa - 3.1 14.4 - 8.8 - 1.5 4.3 - 2.911 Rajasthan - 12.7 10.4 12.3 11.8 - 9.2 4.1 6.9 6.812 Uttarakhand - 1.9 1.3 0.0 1.1 - 0.0 0.0 0.0 0.0All States - 10.6 9.1 8.2 9.5 - 7.3 4.5 3.8 5.6Table 6.8.6 Grade wise repetition rate for Muslims in upper primary stage as on 30th Sep 2008 and 30th Sep 20092008-09 2009-10Sr.StateAverage UpperAverage UpperNoGrade 5 Grade 6 Grade 7 Grade 8Grade 5 Grade 6 Grade 7 Grade 8Primary StagePrimary Stage1 Assam 8.9 16.3 5.4 - 10.1 5.3 4.8 5.5 - 5.22 Bihar - 6.4 3.6 1.9 4.1 - 4.3 2.1 1.2 2.63 Gujarat 4.8 6.2 2.3 - 4.4 10.0 3.8 4.3 - 6.14 Jammu & Kashmir - 6.1 3.9 10.5 6.9 - 1.3 0.9 5.8 2.55 Jharkhand - 14.3 16.0 8.6 13.5 - 12.3 8.2 2.4 8.46 Karnataka - 0.5 0.3 - 0.4 - 0.0 0.1 - 0.17 Kerala 0.5 1.3 1.9 - 1.3 0.7 1.3 0.5 - 0.88 Uttar Pradesh - 0.5 6.1 0.0 2.5 - 1.1 5.7 0.5 2.49 Uttarakhand - 1.8 2.1 0.0 1.1 - 0.1 0.7 0.3 0.310 West Bengal 17.9 10.2 10.7 7.2 12.1 13.2 9.1 6.7 3.4 8.7All States - 6.1 5.2 2.5 5.0 - 3.7 4.2 1.6 3.4202
Table 6.9.1 Grade wise dropout rate for SCs in primary stage as on 30th Sep 2008 and 30th Sep 20092008-09 2009-10Sr.StateAverageAverageNoGrade 1 Grade 2 Grade 3 Grade 4 Grade 5Grade 1 Grade 2 Grade 3 Grade 4 Grade 5Primary StagePrimary Stage1 Andhra Pradesh 1.1 0.7 1.3 1.6 8.2 2.4 1.1 0.1 1.1 0.1 8.7 2.22 Bihar 2.8 3.0 1.8 1.5 7.7 3.1 2.2 3.2 3.7 1.9 7.4 3.43 Delhi 0.5 1.1 0.4 0.3 9.7 2.4 0.2 0.2 0.7 0.1 <strong>21</strong>.1 4.54 Haryana 0.1 0.6 0.7 1.0 9.4 2.1 0.6 0.2 0.4 0.6 6.1 1.45 Himachal Pradesh 0.5 1.1 0.2 0.2 6.3 1.7 0.3 0.7 0.8 0.2 7.9 2.06 Jammu & Kashmir 1.5 1.1 0.5 0.9 2.7 1.4 1.7 0.6 0.6 0.0 4.7 1.67 Karnataka 1.4 1.5 1.7 1.8 6.2 2.4 1.2 1.5 0.5 1.9 5.8 2.38 Madhya Pradesh 1.2 2.7 3.7 1.7 9.9 3.7 2.2 0.7 0.8 0.8 7.4 2.39 Maharashtra 1.1 0.5 0.2 6.5 - 2.0 0.9 1.1 0.3 4.8 - 1.810 Orissa 0.8 0.8 1.3 0.4 11.3 2.8 0.0 0.4 0.4 0.3 6.6 1.511 Punjab 2.8 2.6 2.7 2.1 7.3 3.4 3.5 1.9 3.1 3.1 8.8 4.012 Rajasthan 2.4 2.0 1.9 2.2 10.5 3.3 1.5 1.2 1.5 1.6 5.4 2.113 Tamil Nadu 0.4 0.6 0.5 0.4 10.6 2.7 0.4 0.4 0.7 0.5 5.5 1.614 Uttar Pradesh 1.6 1.1 1.6 1.4 12.7 3.8 1.3 2.2 2.1 1.9 23.6 6.315 Uttarakhand 1.1 1.1 0.7 0.8 7.4 2.1 0.6 0.4 0.5 0.3 3.2 1.016 West Bengal 1.6 2.0 2.0 12.2 - 4.2 1.9 0.9 0.4 6.1 - 2.3All States 1.6 1.6 1.5 2.7 9.3 3.1 1.4 1.4 1.4 2.1 11.7 3.3203
Table 6.9.2 Grade wise dropout rate for STs in primary stage as on 30th Sep 2008 and 30th Sep 2009Sr.2008-09 2009-10StateNoGrade 1 Grade 2 Grade 3 Grade 4 Grade 5 Average Grade 1 Grade 2 Grade 3 Grade 4 Grade 5 Average Primary1 Andhra Pradesh 6.1 4.6 2.5 1.9 11.4 Primary 5.1 Stage 0.9 2.2 2.1 1.8 8.2 Stage 3.02 Assam 1.4 0.0 0.0 12.1 - 3.2 0.6 0.5 0.5 5.6 - 1.73 Chhattisgarh 0.6 0.7 1.6 1.1 10.1 2.1 1.5 0.8 3.0 1.6 15.2 3.74 Gujarat 0.4 0.0 0.5 1.9 - 0.7 0.2 0.5 0.3 1.1 - 0.55 Himachal Pradesh 0.0 0.0 0.0 0.0 2.1 0.5 0.0 0.0 0.0 0.0 3.1 0.66 Jharkhand 5.5 4.6 4.5 4.9 11.5 6.0 3.9 3.5 3.7 3.0 7.3 4.27 Karnataka 4.3 1.4 0.6 2.3 3.7 2.4 2.5 0.0 0.8 1.6 3.9 1.78 Madhya Pradesh 1.6 1.7 1.6 0.7 8.2 2.5 3.0 2.0 1.6 1.5 7.4 3.09 Maharashtra 2.0 0.0 0.0 5.0 - 1.5 1.4 0.2 0.6 2.4 - 1.110 Orissa 1.2 1.6 1.3 0.7 11.8 3.3 0.9 1.0 1.4 0.5 5.1 1.811 Rajasthan 2.6 2.6 5.3 2.2 12.7 4.5 2.7 3.5 1.6 1.8 8.8 3.412 Uttarakhand 0.4 0.4 0.8 0.0 12.6 2.5 0.9 0.0 0.4 0.5 13.0 3.1All States 2.1 1.8 1.9 3.0 8.4 3.2 2.0 1.7 1.8 1.9 6.8 2.6Table 6.9.3 Grade wise dropout rate for Muslims in primary stage as on 30th Sep 2008 and 30th Sep 20092008-09 2009-10Sr.State Grade 1 Grade 2 Grade 3 Grade 4 Grade 5 Average Grade 1 Grade 2 Grade 3 Grade 4 Grade 5 Average PrimaryNoPrimary StageStage1 Assam 1.8 1.3 2.5 8.0 - 3.2 2.6 2.0 2.7 7.2 - 3.52 Bihar 4.5 3.1 3.0 3.6 8.1 4.4 3.6 2.8 2.6 1.6 7.0 3.63 Gujarat 0.4 0.2 0.5 3.5 - 1.3 0.3 0.2 0.4 4.0 - 1.34 Jammu & Kashmir 0.7 0.3 0.3 1.1 4.6 1.5 0.0 0.2 0.4 0.2 3.4 0.75 Jharkhand 2.1 1.9 1.9 2.0 5.9 2.7 1.1 1.6 0.9 0.8 3.4 1.56 Karnataka 0.9 1.0 0.4 1.3 2.3 1.2 1.8 1.4 0.5 1.1 2.9 1.57 Kerala 0.3 0.1 0.0 8.6 - 2.3 0.0 0.0 0.0 17.3 - 4.68 Uttar Pradesh 0.6 0.9 0.4 0.3 4.0 1.1 2.0 1.0 1.1 1.1 8.2 2.69 Uttarakhand 1.1 2.2 0.7 0.4 7.5 2.1 0.1 0.9 0.3 0.7 3.7 1.110 West Bengal 1.9 2.4 2.2 9.0 - 3.5 1.2 1.3 0.8 7.8 - 2.5All States 1.4 1.5 1.2 2.8 4.9 2.2 1.7 1.3 1.1 2.7 7.0 2.6204
Table 6.9.4 Grade wise dropout rate for SCs in upper primary stage as on 30th Sep 2008 and 30th Sep 20092008-09 2009-10Sr. No StateAverage UpperAverage UpperGrade 5 Grade 6 Grade 7 Grade 8Grade 5 Grade 6 Grade 7 Grade 8Primary StagePrimary Stage1 Andhra Pradesh - 1.8 7.5 - 4.9 - 1.7 5.1 - 3.42 Bihar - 1.2 0.6 0.5 0.8 - 2.6 1.8 0.8 1.83 Delhi - 0.0 2.4 0.0 0.9 - 0.0 0.8 0.4 0.44 Haryana - 0.5 0.5 0.6 0.5 - 0.6 0.0 0.3 0.35 Himachal Pradesh - 2.2 1.1 0.8 1.3 - 0.3 0.0 0.2 0.26 Jammu & Kashmir - 1.3 1.6 0.0 1.0 - 1.2 1.1 0.6 1.07 Karnataka - 1.1 11.2 - 5.9 - 3.0 11.0 - 7.18 Madhya Pradesh - 1.6 1.1 0.0 1.0 - 2.4 0.7 0.0 1.29 Maharashtra 0.8 0.0 2.4 - 1.0 0.1 0.0 5.0 - 1.810 Orissa - 2.3 6.7 - 4.6 - 0.7 9.1 - 5.311 Punjab - 0.9 0.6 0.8 0.8 - 1.9 2.0 1.0 1.612 Rajasthan - 2.7 3.7 2.1 2.9 - 2.6 1.7 0.1 1.513 Tamil Nadu - 1.7 1.0 1.0 1.2 - 1.8 0.5 0.6 0.914 Uttar Pradesh - 2.9 3.8 0.3 2.4 - 0.3 1.7 1.4 1.<strong>21</strong>5 Uttarakhand - 1.1 0.9 0.2 0.7 - 0.0 0.3 0.7 0.416 West Bengal 2.3 0.6 0.5 0.6 1.1 0.2 1.2 0.8 0.4 0.7All States - 1.7 3.6 0.6 2.1 - 1.4 3.0 0.8 1.8205
Table 6.9.5 Grade wise dropout rate for STs in upper primary stage as on 30th Sep 2008 and 30th Sep 20092008-09 2009-10Sr.State Grade 5 Grade 6 Grade 7 Grade 8 Average Upper Grade 5 Grade 6 Grade 7 Grade 8 Average UpperNoPrimary StagePrimary Stage1 Andhra Pradesh - 7.2 8.7 - 7.9 - 0.0 1.5 - 0.72 Assam 0.8 1.1 25.0 - 8.8 0.0 0.0 0.5 - 0.23 Chhattisgarh - 2.2 1.4 1.0 1.5 - 1.4 0.8 1.0 1.04 Gujarat 0.4 0.6 8.5 - 3.2 1.2 0.3 8.3 - 3.35 Himachal Pradesh - 1.0 4.1 0.0 1.5 - 0.0 0.3 0.0 0.16 Jharkhand - 1.8 2.6 1.1 1.9 - 2.1 2.0 1.4 1.87 Karnataka - 1.2 8.8 - 4.9 - 1.4 14.6 - 8.68 Madhya Pradesh - 3.5 2.4 0.8 2.4 - 1.7 2.2 2.6 2.19 Maharashtra 0.5 2.1 5.7 - 2.5 1.0 0.0 0.8 - 0.610 Orissa - 2.6 4.2 - 3.4 - 1.5 10.6 - 6.111 Rajasthan - 1.6 2.0 0.8 1.4 - 1.0 2.1 0.4 1.112 Uttarakhand - 1.3 1.3 0.0 0.9 - 0.0 0.0 0.0 0.0All States - 2.2 4.3 0.8 2.7 - 1.3 4.7 1.5 2.7Table 6.9.6 Grade wise dropout rate for Muslims in upper primary stage as on 30th Sep 2008 and 30th Sep 20092008-09 2009-10Sr.State Grade 5 Grade 6 Grade 7 Grade 8 Average Upper Grade 5 Grade 6 Grade 7 Grade 8 Average UpperNoPrimary StagePrimary Stage1 Assam 2.3 4.3 7.3 - 4.6 0.7 2.9 5.1 - 2.82 Bihar - 1.0 1.0 0.0 0.7 - 1.4 0.8 0.5 0.93 Gujarat 0.3 0.1 10.7 - 3.8 0.0 0.5 4.5 - 1.74 Jammu & Kashmir - 1.0 0.6 0.2 0.7 - 0.2 0.0 0.0 0.15 Jharkhand - 1.5 1.5 0.0 1.2 - 0.3 0.6 2.4 0.96 Karnataka - 1.2 15.2 - 8.0 - 1.4 11.1 - 6.37 Kerala 0.3 0.2 6.5 - 2.7 0.3 0.3 10.7 - 3.98 Uttar Pradesh - 3.4 2.7 0.1 2.1 - 2.5 3.4 0.0 1.99 Uttarakhand - 0.1 1.6 0.0 0.5 - 1.0 0.2 0.4 0.610 West Bengal 0.0 0.1 0.4 0.1 0.2 0.0 0.2 0.3 0.0 0.1All States - 2.1 3.9 0.2 2.3 - 1.5 3.2 0.2 1.8206
Table 6.10.1 Cohort dropout rate– SCSCSr. No State YearPrimary(Grade 1-4/5)Elementary(Grade1-7/8)1 Andhra Pradesh2008-09 12.7 20.72009-10 10.9 16.82 Bihar2008-09 19.1 <strong>21</strong>.42009-10 20.5 25.43 Delhi2008-09 11.8 13.92009-10 22.2 23.24 Haryana2008-09 11.8 13.12009-10 7.9 8.75 Himachal Pradesh6 Jammu & Kashmir7 Karnataka8 Madhya Pradesh9 Maharashtra10 Orissa11 Punjab12 Rajasthan13 Tamil Nadu14 Uttar Pradesh15 Uttarakhand16 West BengalAll States2008-09 8.4 12.32009-10 9.8 10.32008-09 6.8 9.82009-10 7.7 10.42008-09 12.1 22.82009-10 10.6 22.92008-09 19.5 <strong>21</strong>.92009-10 12.1 15.12008-09 8.3 11.22009-10 7 11.82008-09 14.9 23.92009-10 7.7 16.92008-09 18.2 <strong>21</strong>.82009-10 20.1 24.42008-09 20.8 30.62009-10 11.7 16.22008-09 12.4 15.72009-10 7.4 10.02008-09 18 23.72009-10 29.4 31.82008-09 10.9 12.82009-10 4.9 5.82008-09 18.7 24.72009-10 10 14.12008-09 16.7 <strong>21</strong>.92009-10 17.8 22.2207
Table 6.10.2 Cohort dropout rate– STSTSr. No State Year Primary(Grade1-4/5)Elementary(Grade1-7/8)1 Andhra Pradesh2008-09 24.8 36.62009-10 14.6 15.92 Assam2008-09 13.6 36.62009-10 7.2 7.73 Chhattisgarh2008-09 14.3 18.42009-10 <strong>21</strong>.2 23.74 Gujarat2008-09 3.1 12.92009-10 2.1 12.15 Himachal Pradesh2008-09 2.2 7.62009-10 3.1 3.46 Jharkhand2008-09 32.3 38.32009-10 22.3 27.37 Karnataka2008-09 11.8 20.62009-10 8.7 23.18 Madhya Pradesh2008-09 16.4 23.92009-10 16.3 22.29 Maharashtra2008-09 7.3 14.92009-10 4.7 6.410 Orissa2008-09 16.3 22.52009-10 8.9 20.311 Rajasthan2008-09 26.2 30.52009-10 18.8 22.012 Uttarakhand2008-09 14 16.32009-10 14.5 14.52008-09 17.7 24.6All States2009-10 14.4 20.8208
Table 6.10.3 Cohort dropout rate– MuslimMuslimSr. No State YearPrimary Elementary(Grade 1-4/5) (Grade1-7/8)1 Assam2008-09 14.2 27.92009-10 15 232 Bihar2008-09 23.3 252009-10 18.7 <strong>21</strong>.13 Gujarat2008-09 4.7 15.52009-10 5 9.94 Jammu & Kashmir2008-09 6.9 8.52009-10 4.3 4.55 Jharkhand2008-09 17.8 22.92009-10 9.3 12.86 Karnataka2008-09 5.7 <strong>21</strong>2009-10 7.5 197 Kerala2008-09 9 15.52009-10 17.5 26.78 Uttar Pradesh2008-09 6.4 12.32009-10 12.8 189 Uttarakhand2008-09 11.6 13.12009-10 5.6 7.110 West Bengal2008-09 17.1 20.62009-10 11.8 14.2All States2008-09 12.2 17.92009-10 13.6 17.9209
Table 6.11.1 Coefficient of internal efficiency – SCSCSr. No State YearPrimary(Grade 1-4/5)Elementary (Grade1-7/8)1 Andhra Pradesh2008-09 85.0 80.42009-10 87.7 84.92 Bihar2008-09 73.4 78.12009-10 71.5 74.33 Delhi2008-09 87.9 89.02009-10 76.8 82.84 Haryana2008-09 84.9 86.12009-10 90.9 92.25 Himachal Pradesh2008-09 90.8 87.82009-10 90.5 92.56 Jammu & Kashmir2008-09 90.0 87.12009-10 89.3 88.37 Karnataka2008-09 89.2 80.72009-10 91.0 80.88 Madhya Pradesh2008-09 76.0 79.22009-10 82.6 84.49 Maharashtra2008-09 90.2 90.72009-10 93.8 91.110 Orissa2008-09 79.4 73.72009-10 87.5 80.811 Punjab2008-09 76.4 75.52009-10 78.4 77.812 Rajasthan2008-09 70.6 66.52009-10 80.9 80.513 Tamil Nadu2008-09 87.3 87.92009-10 92.5 92.514 Uttar Pradesh2008-09 81.9 81.92009-10 72.6 78.015 Uttarakhand2008-09 88.9 90.52009-10 95.0 95.616 West Bengal2008-09 69.6 73.32009-10 79.2 80.82008-09 79.7 80.0All States2009-10 79.5 81.0<strong>21</strong>0
Table 6.11.2 Coefficient of internal efficiency – STSTSr. No State YearPrimary(Grade 1-4/5)Elementary(Grade1-7/8)1 Andhra Pradesh2008-09 78.5 70.72009-10 85.7 87.92 Assam2008-09 83.1 65.82009-10 90.3 92.73 Chhattisgarh2008-09 81.5 81.92009-10 78.2 82.44 Gujarat2008-09 86.5 79.52009-10 87.6 80.95 Himachal Pradesh2008-09 94.4 88.82009-10 96.0 96.56 Jharkhand2008-09 63.9 65.22009-10 73.5 75.17 Karnataka2008-09 91.7 84.72009-10 92.9 80.08 Madhya Pradesh2008-09 71.8 71.32009-10 78.1 77.59 Maharashtra2008-09 86.1 83.32009-10 94.1 94.310 Orissa11 Rajasthan12 UttarakhandAll States2008-09 80.4 77.12009-10 87.0 78.72008-09 68.4 70.82009-10 78.4 80.52008-09 85.7 88.32009-10 84.6 89.82008-09 76.1 75.12009-10 81.9 80.3<strong>21</strong>1
Table 6.11.3 Coefficient of internal efficiency – MuslimSr. No State YearMuslimPrimary (1/4/5) Elementary(1-7/8)1 Assam2008-09 73.9 68.52009-10 77.6 76.62 Bihar2008-09 72.4 78.12009-10 76.5 81.13 Gujarat2008-09 92.2 83.02009-10 91.9 88.04 Jammu & Kashmir2008-09 89.5 89.42009-10 92.0 93.55 Jharkhand2008-09 70.0 71.52009-10 80.0 81.06 Karnataka2008-09 95.0 80.72009-10 94.9 84.57 Kerala2008-09 89.9 87.02009-10 81.4 78.38 Uttar Pradesh2008-09 91.1 88.62009-10 88.6 87.19 Uttarakhand2008-09 89.7 91.52009-10 95.0 95.510 West Bengal2008-09 69.1 76.02009-10 73.9 80.62008-09 83.2 82.3All States2009-10 83.8 84.5<strong>21</strong>2
Table 6.12.1 Average duration of <strong>study</strong> – SCSCSr. No State YearPrimary(Grade 1-4/5)Elementary(Grade1-7/8)1 Andhra Pradesh2008-09 5.3 7.32009-10 5.1 7.12 Bihar2008-09 5.9 9.02009-10 5.9 9.13 Delhi2008-09 5.1 8.22009-10 5.1 8.14 Haryana5 Himachal Pradesh6 Jammu & Kashmir7 Karnataka8 Madhya Pradesh9 Maharashtra10 Orissa11 Punjab12 Rajasthan13 Tamil Nadu14 Uttar Pradesh15 Uttarakhand16 West BengalAll States2008-09 5.2 8.52009-10 5.1 8.22008-09 5.1 8.42009-10 5.0 8.12008-09 5.3 8.72009-10 5.3 8.52008-09 5.1 7.12009-10 5.0 7.12008-09 5.5 8.82009-10 5.5 8.62008-09 4.1 7.22009-10 4.0 7.02008-09 5.5 7.72009-10 5.3 7.42008-09 5.7 9.22009-10 5.4 8.82008-09 5.9 9.42009-10 5.6 8.92008-09 5.1 8.12009-10 5.0 8.12008-09 5.2 8.22009-10 5.0 8.12008-09 5.1 8.22009-10 5.0 8.02008-09 4.7 9.32009-10 4.6 9.12008-09 5.4 8.62009-10 5.3 8.4<strong>21</strong>3
Table 6.12.2 Average duration of <strong>study</strong> – STSTSr. No State Year Primary(Grade 1-4/5)Elementary(Grade1-7/8)1 Andhra Pradesh2008-09 5.3 7.32009-10 5.1 7.12 Assam2008-09 4.2 7.32009-10 4.1 7.23 Chhattisgarh2008-09 5.4 8.62009-10 5.2 8.34 Gujarat2008-09 4.5 7.82009-10 4.5 7.75 Himachal Pradesh2008-09 5.2 8.52009-10 5.0 8.16 Jharkhand2008-09 5.9 9.42009-10 5.7 9.07 Karnataka2008-09 5.1 7.02009-10 5.0 7.18 Madhya Pradesh2008-09 6.0 9.32009-10 5.6 8.99 Maharashtra2008-09 4.4 7.52009-10 4.1 7.<strong>21</strong>0 Orissa11 Rajasthan12 UttarakhandAll States2008-09 5.3 7.52009-10 5.3 7.42008-09 5.8 9.22009-10 5.5 8.72008-09 5.1 8.12009-10 5.1 8.12008-09 5.6 8.92009-10 5.4 8.6<strong>21</strong>4
Table 6.12.3 Average duration of <strong>study</strong> – MuslimMuslimSr. No State YearPrimary(Grade 1-4/5)Elementary(Grade1-7/8)1 Assam2008-09 4.7 8.12009-10 4.5 7.72 Bihar2008-09 5.8 8.92009-10 5.7 8.83 Gujarat2008-09 4.2 7.32009-10 4.1 7.34 Jammu & Kashmir2008-09 5.3 8.52009-10 5.2 8.35 Jharkhand6 Karnataka7 Kerala8 Uttar Pradesh9 Uttarakhand10 West BengalAll States2008-09 6.2 9.52009-10 5.8 9.02008-09 5.0 7.12009-10 5.0 7.02008-09 4.1 7.12009-10 4.0 7.12008-09 5.2 8.32009-10 5.0 8.12008-09 5.1 8.12009-10 5.0 8.02008-09 4.9 9.32009-10 4.8 9.12008-09 5.4 8.62009-10 5.3 8.4<strong>21</strong>5
Table 7.1.1 Reasons for dropping out of school (Primary stage - boys - 2008-09 & 2009-10)SrNo.StatesNumberNeed to helpfamily indomestic workPoverty /EconomicReasonsLack of interestin studiesFacilities/teaching in school notsatisfactoryDistance toschool was aproblem / notconvenientChild’s ownlong illnessFamilymigrated toother place1 Andhra Pradesh 169 30.18 <strong>21</strong>.89 8.28 1.78 4.14 1.78 31.952 Assam 138 36.95 20.29 26.09 1.45 1.45 7.25 6.523 Bihar 1,<strong>21</strong>5 11.93 26.26 37.04 2.80 3.29 7.08 11.604 Chhattisgarh 354 40.68 16.67 14.97 3.95 3.95 5.08 14.695 Delhi 143 26.57 16.08 16.78 6.99 9.09 15.38 9.096 Gujarat 141 26.24 <strong>21</strong>.99 <strong>21</strong>.28 4.96 8.51 2.13 14.897 Haryana 91 36.26 31.87 14.29 2.20 2.20 5.49 7.698 Himachal Pradesh 37 40.55 16.22 10.81 8.11 5.41 10.81 8.119 Jammu & Kashmir 37 48.65 27.03 10.81 5.41 0.00 2.70 5.4110 Jharkhand 934 18.73 33.62 23.13 2.57 2.68 5.67 13.6011 Karnataka 280 27.85 24.64 22.14 3.93 3.57 1.07 16.7912 Kerala 27 22.20 14.81 33.33 3.70 0.00 11.11 14.8113 Madhya Pradesh 278 28.42 17.27 18.71 6.47 3.24 8.27 17.6314 Maharashtra <strong>21</strong>3 25.83 25.35 22.54 3.76 8.92 6.10 7.5115 Orissa 1<strong>21</strong> 18.18 26.45 39.67 1.65 4.13 3.31 6.6116 Punjab 135 20.74 28.15 6.67 13.33 2.22 2.22 26.6717 Rajasthan 357 34.17 28.29 22.69 3.36 3.36 1.40 6.7<strong>21</strong>8 Tamil Nadu 38 13.16 <strong>21</strong>.05 31.58 7.89 0.00 7.89 18.4<strong>21</strong>9 Uttar Pradesh 367 28.33 16.62 18.26 9.81 8.72 7.90 10.3520 Uttarakhand 245 24.89 15.51 13.47 13.47 11.02 9.80 11.84<strong>21</strong> West Bengal 346 31.79 24.57 15.32 6.07 7.51 6.07 8.67All <strong>states</strong> (2008-09) 3,125 24.86 22.75 24.58 3.78 4.77 6.08 13.18All <strong>states</strong> (2009-10) 2,624 24.01 26.94 <strong>21</strong>.38 5.64 4.57 5.72 11.74<strong>21</strong>6
Table 7.1.2 Reasons for dropping out of school (Primary classes - Girls - 2008-09 & 2009-10)Sr.No.StatesNumberNeed tohelpfamily indomesticworkPoverty /EconomicReasonsLack ofinterest instudiesFacilities/teaching in schoolnot satisfactoryDistance toschool wasa problem/ notconvenientChild’s ownlong illnessFamilymigratedto otherplaceNonavailabilityof girlsschool1 Andhra Pradesh 157 28.66 24.84 8.92 3.82 3.82 3.18 24.84 1.27 0.642 Assam 128 28.91 24.22 19.53 3.91 5.47 5.47 4.69 5.47 2.343 Bihar 1,081 16.37 22.29 33.30 3.24 3.24 6.29 14.25 0.74 0.284 Chhattisgarh 236 34.74 16.95 <strong>21</strong>.19 2.54 3.81 1.69 11.86 4.66 2.545 Delhi 328 42.98 12.20 6.40 8.84 6.71 7.32 8.84 5.49 1.226 Gujarat 120 29.16 24.17 17.50 2.50 5.00 3.33 13.33 3.33 1.677 Haryana 83 36.14 25.30 13.25 2.41 6.02 4.82 4.82 1.20 6.028 Himachal Pradesh 25 24.00 20.00 24.00 4.00 4.00 4.00 8.00 8.00 4.009 Jammu & Kashmir 22 40.91 13.64 22.73 0.00 9.09 0.00 13.64 0.00 0.0010 Jharkhand 801 19.23 29.71 25.09 2.50 2.25 7.24 12.73 0.75 0.5011 Karnataka <strong>21</strong>2 31.13 17.45 16.51 6.13 3.77 2.36 15.57 0.47 6.6012 Kerala 17 35.29 17.65 23.53 5.88 11.76 0.00 0.00 5.88 0.0013 Madhya Pradesh 226 23.01 18.58 14.60 5.31 5.31 9.73 16.81 3.98 2.6514 Maharashtra 129 22.49 24.03 19.38 6.98 6.20 8.53 10.08 2.33 0.0015 Orissa 111 20.72 22.52 35.14 7.<strong>21</strong> 0.00 3.60 6.31 2.70 1.8016 Punjab 55 25.45 25.45 16.36 14.55 1.82 0.00 10.91 0.00 5.4517 Rajasthan 264 22.73 23.48 29.17 3.41 2.65 1.14 6.82 1.52 9.0918 Tamil Nadu 32 43.76 15.63 9.38 0.00 12.50 3.13 12.50 3.13 0.0019 Uttar Pradesh 310 19.68 13.23 <strong>21</strong>.29 11.61 11.61 6.77 7.42 7.42 0.9720 Uttarakhand 94 <strong>21</strong>.28 11.70 11.70 13.83 11.70 9.57 8.51 11.70 0.00<strong>21</strong> West Bengal 281 32.03 17.44 8.54 8.19 10.68 6.41 10.32 4.63 1.78All <strong>states</strong> (2008-09) 2,588 25.23 20.56 23.57 4.91 4.48 5.83 11.<strong>21</strong> 2.40 1.82All <strong>states</strong> (2009-10) 2,<strong>21</strong>0 23.62 22.94 19.82 5.07 5.88 5.34 12.35 2.99 1.99No needfor girls to<strong>study</strong><strong>21</strong>7
Table 7.1.3 Reasons for dropping out of school (upper primary stage - boys - 2008-09 & 2009-10)Sr.No.Distance toNeed to help Poverty /Facilities/teachiLack of interestschool was a Child’s ownStatesNumber family in Economicng in school notin studiesproblem / not long illnessdomestic work Reasonssatisfactoryconvenient1 Andhra Pradesh 90 31.11 24.44 11.11 4.44 3.33 2.22 23.33Familymigrated toother place2 Assam 155 40.00 36.77 16.77 0.00 2.58 1.29 2.583 Bihar 199 15.58 27.14 27.14 10.05 3.52 3.52 13.074 Chhattisgarh 163 33.74 25.77 18.40 3.68 3.68 2.45 12.275 Delhi 33 27.27 27.27 24.24 9.09 3.03 6.06 3.036 Gujarat 42 42.86 11.90 38.10 0.00 0.00 7.14 0.007 Haryana 19 <strong>21</strong>.05 5.26 57.89 5.26 5.26 0.00 5.268 Himachal Pradesh 47 29.79 19.15 12.77 10.64 8.51 10.64 8.519 Jammu & Kashmir 63 28.57 20.63 12.70 9.52 4.76 9.52 14.2910 Jharkhand 279 25.81 25.81 19.71 0.36 4.30 2.87 <strong>21</strong>.1511 Karnataka 195 28.20 <strong>21</strong>.54 29.23 3.59 1.54 0.51 15.3812 Kerala 8 25.00 12.50 25.00 12.50 0.00 0.00 25.0013 Madhya Pradesh 184 29.89 22.83 22.83 5.43 5.43 0.00 13.5914 Maharashtra 59 32.20 13.56 33.90 8.47 1.69 5.08 5.0815 Orissa 154 <strong>21</strong>.43 19.48 43.51 1.95 3.25 2.60 7.7916 Punjab 46 36.96 <strong>21</strong>.74 15.22 2.17 4.35 2.17 17.3917 Rajasthan 180 23.89 28.89 33.89 0.56 6.67 1.67 4.4418 Tamil Nadu 86 25.58 33.72 18.60 0.00 4.65 2.33 15.1<strong>21</strong>9 Uttar Pradesh 145 29.66 20.69 15.17 4.83 5.52 10.34 13.7920 Uttarakhand 96 40.63 10.42 15.63 10.42 6.25 4.17 12.50<strong>21</strong> West Bengal 48 18.75 31.25 0.00 12.50 27.08 2.08 8.33All <strong>states</strong> (2008-09) 896 29.46 23.33 22.88 4.35 4.13 4.02 11.83All <strong>states</strong> (2009-10) 1,159 28.22 24.25 23.12 4.23 5.00 3.02 12.17Table 7.1.4 Reasons for Dropping out of school (upper primary stage - girls - 2008-09 & 2009-10)<strong>21</strong>8
Sr.No.StatesNumberNeed tohelpfamily indomesticworkPoverty /EconomicReasonsLack ofinterest instudiesFacilities/teaching inschool notsatisfactoryDistance toschool wasa problem/ notconvenientChild’sown longillnessFamilymigratedto otherplaceNonavailabilityof girlsschool1 Andhra Pradesh 81 24.69 20.99 18.52 4.94 3.70 0.00 22.22 2.47 2.472 Assam 127 38.58 35.43 4.72 0.00 7.87 0.00 4.72 0.79 7.873 Bihar 118 <strong>21</strong>.18 19.49 <strong>21</strong>.19 8.47 2.54 3.39 23.73 0.00 0.004 Chhattisgarh 106 47.17 20.75 20.75 3.77 1.89 0.00 2.83 2.83 0.005 Delhi 27 40.74 14.81 40.74 0.00 0.00 0.00 3.70 0.00 0.00No needfor girls to<strong>study</strong>6 Gujarat 54 46.30 14.81 25.93 0.00 1.85 0.00 0.00 0.00 11.117 Haryana 28 39.29 10.71 42.86 0.00 3.57 0.00 0.00 0.00 3.578 Himachal Pradesh 64 29.69 18.75 20.31 7.81 10.94 1.56 4.69 3.13 3.139 Jammu & Kashmir 23 39.13 13.04 26.09 0.00 4.35 0.00 4.35 13.04 0.0010 Jharkhand 133 29.32 16.54 18.05 2.26 6.77 6.77 20.30 0.00 0.0011 Karnataka 135 24.44 22.22 24.44 2.96 2.96 3.70 14.07 0.74 4.4412 Kerala 9 33.33 11.11 44.44 0.00 0.00 0.00 11.11 0.00 0.0013 Madhya Pradesh 148 24.32 19.59 29.05 4.05 4.73 0.68 14.86 0.00 2.7014 Maharashtra 30 36.67 26.67 16.67 6.67 6.67 0.00 3.33 0.00 3.3315 Orissa 115 <strong>21</strong>.74 20.87 29.57 8.70 0.00 2.61 8.70 0.87 6.9616 Punjab 25 48.00 20.00 8.00 8.00 4.00 0.00 0.00 0.00 12.0017 Rajasthan 120 26.67 23.33 15.00 0.83 3.33 0.83 6.67 0.83 22.5018 Tamil Nadu 75 26.67 38.67 13.33 0.00 8.00 0.00 13.33 0.00 0.0019 Uttar Pradesh 68 19.12 17.65 20.59 5.88 7.35 4.41 5.88 11.76 7.3520 Uttarakhand 23 26.09 8.70 17.39 17.39 0.00 8.70 8.70 13.04 0.00<strong>21</strong> West Bengal 72 36.11 19.44 15.28 2.78 11.11 4.17 1.39 0.00 9.72All <strong>states</strong> (2008-09) 631 30.58 <strong>21</strong>.08 20.76 3.80 3.80 2.06 9.35 1.74 6.81All <strong>states</strong> (2009-10) 777 29.73 22.65 <strong>21</strong>.11 3.35 5.54 1.67 10.42 1.29 4.25<strong>21</strong>9
Table 7.2.1 : Current activity of the dropouts (Primary stage- Boys - 2008-09 & 2009-10)Sr. no State NumberHelping parents/ family inagriculture/ taking care ofcattle/ other occupationalworkHelping parents/family in householdworkWorking toearn moneyNot doinganything, beingidleNot doing anything dueto incapacity to work(like long illness)Activity notknown1 Andhra Pradesh 169 28.40 14.79 8.88 36.09 0.59 11.242 Assam 138 26.81 15.22 34.06 13.04 5.07 5.803 Bihar 1,<strong>21</strong>5 17.04 23.<strong>21</strong> 13.91 31.52 4.20 10.124 Chhattisgarh 354 28.81 31.07 16.38 16.67 1.13 5.935 Delhi 143 15.38 23.78 22.38 <strong>21</strong>.68 1.40 15.386 Gujarat 141 27.66 7.80 20.57 28.37 1.42 14.187 Haryana 91 40.66 18.68 9.89 15.38 2.20 13.198 Himachal Pradesh 37 35.14 13.51 16.22 29.73 2.70 2.709 Jammu & Kashmir 37 32.43 <strong>21</strong>.62 24.32 13.51 2.70 5.4110 Jharkhand 934 22.27 24.41 6.85 23.77 3.75 18.9511 Karnataka 280 18.<strong>21</strong> 22.86 18.93 13.57 6.43 20.0012 Kerala 27 48.15 3.70 25.93 3.70 3.70 14.8113 Madhya Pradesh 278 23.02 16.19 24.10 16.55 0.72 19.4<strong>21</strong>4 Maharashtra <strong>21</strong>3 26.76 15.02 12.<strong>21</strong> 24.88 0.94 20.1915 Orissa 1<strong>21</strong> 19.83 20.66 23.14 22.31 0.83 13.2<strong>21</strong>6 Punjab 135 24.44 17.78 8.89 14.07 3.70 31.1117 Rajasthan 357 34.73 17.93 15.69 14.57 1.40 15.6918 Tamil Nadu 38 23.68 7.89 18.42 28.95 7.89 13.1619 Uttar Pradesh 367 25.61 29.43 20.98 20.44 1.36 2.1820 Uttarakhand 245 30.61 24.08 <strong>21</strong>.63 22.45 0.41 0.82<strong>21</strong> West Bengal 346 25.72 30.06 24.28 14.74 0.58 4.62All States (2008-2009) 3,125 25.12 23.14 16.45 <strong>21</strong>.41 2.59 11.30All States (2009-2010) 2,624 22.71 <strong>21</strong>.80 16.08 23.<strong>21</strong> 2.67 13.53220
Table 7.2.2: Current activity of the dropouts (Primary stage- girls - 2008-09 & 2009-10)Sr. no State NumberHelping parents/ family inagriculture/ taking care ofcattle/ other occupationalworkHelping parents/family inhousehold workWorking toearn moneyNot doinganything, beingidleNot doing anythingdue to incapacity towork (like long illness)Activitynot known1 Andhra Pradesh 157 22.29 31.<strong>21</strong> 8.92 22.93 2.55 12.102 Assam 128 24.22 30.47 26.56 12.50 2.34 3.913 Bihar 1,081 11.01 39.04 8.14 29.23 3.61 8.974 Chhattisgarh 236 29.24 41.53 11.02 8.90 0.42 8.905 Delhi 328 18.29 52.44 10.98 10.06 1.22 7.016 Gujarat 120 9.17 55.00 16.67 2.50 3.33 13.337 Haryana 83 30.12 37.35 7.23 9.64 3.61 12.058 Himachal Pradesh 25 16.00 48.00 24.00 8.00 0.00 4.009 Jammu & Kashmir 22 9.09 68.18 9.09 0.00 0.00 13.6410 Jharkhand 801 <strong>21</strong>.72 33.46 5.24 19.73 3.75 16.1011 Karnataka <strong>21</strong>2 9.43 46.23 15.57 5.66 7.08 16.0412 Kerala 17 5.88 64.71 17.65 11.76 0.00 0.0013 Madhya Pradesh 226 18.14 26.55 26.11 13.27 0.44 15.4914 Maharashtra 129 13.18 38.76 22.48 7.75 1.55 16.2815 Orissa 111 9.01 31.53 25.23 8.11 2.70 23.4<strong>21</strong>6 Punjab 55 10.91 45.45 12.73 9.09 1.82 20.0017 Rajasthan 264 17.80 48.86 11.36 4.92 2.27 14.7718 Tamil Nadu 32 15.63 53.13 12.50 9.38 3.13 6.2519 Uttar Pradesh 310 20.32 34.84 20.65 17.10 4.84 2.2620 Uttarakhand 94 30.85 26.60 <strong>21</strong>.28 19.15 1.06 1.06<strong>21</strong> West Bengal 281 29.89 32.38 17.44 14.59 1.07 4.63All States (2008-2009) 2,588 18.47 41.77 11.75 15.69 2.86 9.47All States (2009-2010) 2,<strong>21</strong>0 17.96 34.34 13.98 17.83 2.85 13.032<strong>21</strong>
Table 7.2.3: Current activity of the dropouts (Upper Primary stage- Boys - 2008-09 & 2009-10)Sr. No State NumberHelping parents/ familyin agriculture/ taking careof cattle/ otheroccupational workHelping parents/family inhousehold workWorking toearn moneyNot doinganything,being idleNot doing anythingdue to incapacity towork (like long illness)Activity notknown1 Andhra Pradesh 90 32.22 <strong>21</strong>.11 14.44 22.22 1.11 8.892 Assam 155 8.39 31.61 51.61 3.87 1.29 3.233 Bihar 199 17.09 41.71 18.09 16.08 1.51 5.534 Chhattisgarh 163 25.77 22.70 20.25 17.18 0.61 13.505 Delhi 33 <strong>21</strong>.<strong>21</strong> 30.30 <strong>21</strong>.<strong>21</strong> 9.09 9.09 9.096 Gujarat 42 40.48 33.33 2.38 7.14 7.14 9.527 Haryana 19 <strong>21</strong>.05 52.63 <strong>21</strong>.05 0.00 5.26 0.008 Himachal Pradesh 47 25.53 34.04 25.53 14.89 0.00 0.009 Jammu & Kashmir 63 28.57 19.05 23.81 15.87 0.00 12.7010 Jharkhand 279 25.09 25.09 9.32 <strong>21</strong>.15 0.72 18.6411 Karnataka 195 17.95 25.64 <strong>21</strong>.03 13.85 3.59 17.9512 Kerala 8 50.00 12.50 12.50 12.50 0.00 12.5013 Madhya Pradesh 184 30.43 19.02 20.11 16.30 2.72 11.4114 Maharashtra 59 20.34 38.98 16.95 13.56 0.00 10.1715 Orissa 154 24.68 20.13 32.47 15.58 0.65 6.4916 Punjab 46 15.22 13.04 13.04 15.22 17.39 26.0917 Rajasthan 180 20.00 26.67 25.56 12.78 1.11 13.8918 Tamil Nadu 86 25.58 23.26 13.95 19.77 0.00 17.4419 Uttar Pradesh 145 20.69 20.69 16.55 24.83 3.45 13.7920 Uttarakhand 96 32.29 20.83 23.96 15.63 0.00 7.29<strong>21</strong> West Bengal 48 47.92 16.67 31.25 2.08 2.08 0.00All States (2008-2009) 896 24.55 31.70 20.65 10.49 1.45 11.16All States (2009-2010) 1,159 22.86 23.64 <strong>21</strong>.48 17.95 2.50 11.56222
Table 7.2.4: Current activity of the dropouts (Upper primary stage- girls - 2008-09 & 2009-10)Sr. No State NumberHelping parents/ family inagriculture/ taking care ofcattle/ otheroccupational workHelping parents/family inhousehold workWorking toearn moneyNot doinganything,being idleNot doing anythingdue to incapacity towork (like long illness)Activity notknown1 Andhra Pradesh 81 22.22 39.51 16.05 12.35 1.23 8.642 Assam 127 1.57 30.71 45.67 7.09 0.00 14.963 Bihar 118 20.34 36.44 15.25 13.56 4.24 10.174 Chhattisgarh 106 33.02 33.02 14.15 15.09 0.00 4.725 Delhi 27 14.81 55.56 18.52 11.11 0.00 0.006 Gujarat 54 51.85 18.52 0.00 3.70 1.85 24.077 Haryana 28 17.86 71.43 3.57 3.57 0.00 3.578 Himachal Pradesh 64 26.56 28.13 15.63 23.44 0.00 6.259 Jammu & Kashmir 23 30.43 17.39 13.04 <strong>21</strong>.74 0.00 17.3910 Jharkhand 133 33.83 36.09 6.02 6.77 4.51 12.7811 Karnataka 135 10.37 48.89 22.22 4.44 6.67 7.4112 Kerala 9 11.11 44.44 33.33 11.11 0.00 0.0013 Madhya Pradesh 148 26.35 47.97 5.41 10.81 0.68 8.7814 Maharashtra 30 33.33 50.00 6.67 6.67 0.00 3.3315 Orissa 115 13.91 39.13 27.83 4.35 2.61 12.1716 Punjab 25 24.00 40.00 4.00 8.00 0.00 24.0017 Rajasthan 120 26.67 48.33 9.17 9.17 0.00 6.6718 Tamil Nadu 75 14.67 60.00 9.33 6.67 1.33 8.0019 Uttar Pradesh 68 29.41 32.35 17.65 14.71 0.00 5.8820 Uttarakhand 23 30.43 26.09 17.39 <strong>21</strong>.74 0.00 4.35<strong>21</strong> West Bengal 72 48.61 33.33 9.72 2.78 1.39 4.17All States (2008-2009)631 25.04 38.99 16.48 9.03 1.74 8.72All States (2009-2010) 777 26.25 38.74 13.90 10.42 1.42 9.27223
Annexure II: Statistical Analysis PlanS.No. Notation ExplanationNotation Used for Estimation for each domain1 ‘i ith district of the state2. ‘j jth block of the selected district3. ‘k kth schools selected in the sampled block/district/ metro cities4 ‘m Metro stratum5 ‘u Urban town stratum6 ‘r Rural stratum6 ‘ua Urban area (metro + urban towns)4. (d ,D) Sample size (TNS) and total districts (for DRS) in a state.5. (b ,B) Sample blocks (TNS) and total blocks (for DRS) in a district6. (s, S) Selected schools (TNS) and total schools( for DRS) in the sampledblock.7. Y Value of the characteristics under <strong>study</strong> at numerator(No. of<strong>Dropout</strong>s)8. X Value of the characteristics at denominator(Total enrolment)Estimation at the state level of metro stratumsSˆ = Estimated value for the stratum …… (1)sYym kk1Y s1m y s = Sample mean for the stratum ……. (2)kk1Using (2), we getYvar( ˆ ) mS<strong>21</strong>*(1)*(1s2 ) (y )ms S s 1k Yk1…… (3)Similarly, for estimation of x characteristicsXˆsSm xkk1s1X s1m xkkUsing (5), we getvar(Xˆms) s<strong>21</strong>*( Using (5) and (2),we get1)*(1)s(xX)2…….(4)…..(5)k ms S s 1k1……. (6)224
CoV (yˆm,xˆm) s<strong>21</strong> 1 1*( )*( )*s S s 1sk1(xkXm)*(ykYm)…(7)Estimation at the level of urban towns stratumSsˆ = estimated value for the i-th district (8)siYuii k1 yikYˆdDdˆu Y uii1= estimated value for the stratum (9)1dY d ˆ1var(u Y uiiYˆu) D<strong>21</strong>*(11ˆ(10)d2 )*( ) ( )ud D d 1Y ui Yi1(11)Similarly, for estimation of x characteristicsSxsˆ (12)siXuii k1ikXˆdDdˆu X uii1(13)1dX d ˆ1var(u X uiiXˆu) D<strong>21</strong>*(11ˆˆ(14)d2 )*( ) ( )d D d 1X ui X ui1(15)d2 1 1 1CoV ( yˆ, xˆ) D *( )*( ) ( ˆ )*( ˆ )u1 Yuui Y u Xui X ud D d i 1(16)Estimation at the level of rural stratumSssijijYˆrijij k1ˆ ybiBi ybijYri1YˆdDdˆijr Y rii11dY d ˆ1r Y riiijk(17)(18)(19)(20)225
var(111d22ˆ ) *( )*( ) (ˆ )r Drd D d 1Y ri Yki1(<strong>21</strong>)YSimilarly, for estimation of x characteristicsSssijijXˆrijij k1ˆ xbiBixbijXri1XˆdDdˆijr X rii1ijk(22)(23)(24)1dX d ˆ1var(r X riiXˆr) D<strong>21</strong>*(11ˆˆ(25)d2 )*( ) ( )d D d 1X ri X ri1(26)d2 1 1 1CoV ( yˆ, xˆ) D *( )*( ) ( ˆ )*( ˆ )r1 Yrri Y r Xri X rd D d i 1(27)Estimates of drop outYˆYˆYˆua m uXˆua Xˆm Xˆuvar( Yˆua)var(Yˆm)var(Yˆu)var( Xˆua) var( Xˆm) var( Xˆu)CoV ( yˆ, ˆua) CoV ( yˆ, ˆm) CoV ( yˆ, ˆu)uaxmxCompute the following using the above values for the Total (combining rural and urban),Yˆ Yˆua YˆrXˆ Xˆua Xˆvar( Yˆ) var(rYˆua) var(Yˆr)ux226
var( Xˆ ) var( Xˆ) var( Xˆua r)CoV ( Xˆ , Yˆ) CoV ( yˆ, ˆua) CoV ( yˆ, ˆr)uaxrxEstimate of dropout rate (say, for Total) is given byYˆRˆ Xˆ227
Annexure III: Tools for Data Collection:DS-1STUDY FOR ASSESSMENT OF STUDENTS’ DROPOUT RATES AT ELEMENTARY LEVEL IN <strong>21</strong>STATESSchool Schedule1. State:_______________________ 2. District:_____________________3. Block: ________________ 4. Village/City/Town:_____________5. Name and address of school:______________________________________________________6. DISE Code of school:7. Area: Rural (1) Urban (2)8. School category: School with Primary classes only (1) School with Upper Primary classes (2)9. Management: Government (1) Local Body (2) Private Aided (3) Private Un-aided (4)10A. Classes taught in the school during: 2008-2009 From class To class10B. Classes taught in the school during: 2009-2010 From class To class11. Give enrolment and students’ attendance by actual headcount on the day of visit to school:Date of visit (dd/mm/yy):EnrolmentNo. of Students PresentClassBoys Girls Total Boys Girls Total(1) (2) (3) (4) (5) (6) (7)IIIIIIIVVVIVIIVIII228
12. Give class-wise total enrolment as on 30 th Sept, 2008. Out of this enrolment, give number ofrepeaters in the same class as on 30 th Sept. 2009, number of promotees in the next class as on 30 thSept. 2009 and remaining number of students who left the school. The same procedure is to befollowed for class-wise enrolment as on 30 th Sept.2009. The values in each cell of the item is to bewritten after compilation from working sheet-1Class Year Item Boys Girls Total SC ST Muslims 1(1) (2) (3) (4) (5) (6) (7) (8) (9)I2008–20091 (a) Total enrolment as on 30 th Sept, 2008 in class I1 (b) Out of 1(a), number of repeaters in class I ason 30 th Sept, 20091 (c) Out of 1(a), number of promotees in class II ason 30 th Sept, 20091 (d) Out of 1(a), number of students who left theschool2 (a) Total enrolment as on 30 th Sept, 2009 in class I2009–20102 (b) Out of 2(a), number of repeaters in class I ason 30 th Sept, 20102 (c) Out of 2(a), number of promotees in class II ason 30 th Sept, 2010IIIII2008–20092009–20102008–20092 (d) Out of 2(a), number of students who left theschool.3 (a) Total enrolment as on 30th Sept, 2008 in classII3 (b) Out of 3(a), number of repeaters in class II ason 30th Sept, 20093 (c) Out of 3(a), number of promotees in class III ason 30th Sept, 20093 (d) Out of 3(a), number of students who left theschool.4 (a) Total enrolment as on 30th Sept, 2009 in classII4 (b) Out of 4(a), number of repeaters in class II ason 30th Sept, 20104 (c) Out of 4(a), number of promotees in class III ason 30th Sept, 20104 (d) Out of 4(a), number of students who left theschool.5 (a) Total enrolment as on 30th Sept, 2008 in classIIII5 (b) Out of 5(a), number of repeaters in class III ason 30th Sept, 20095 (c) Out of 5(a), number of promotees in class IV ason 30th Sept, 20091 The Children who are Muslims if they belong to SC/ST then they should treat as Muslim (MU) in socialcategory.229
Class Year Item Boys Girls Total SC ST Muslims 1(1) (2) (3) (4) (5) (6) (7) (8) (9)5 (d) Out of 5(a), number of students who left theIVVVI2009–20102008–20092009-20102008–20092009–20102008–2009school. 6 (a) Total enrolment as on 30th Sept, 2009 in classIII6 (b) Out of 6(a), number of repeaters in class III ason 30th Sept, 20106 (c) Out of 6(a), number of promotees in class IV ason 30th Sept, 20106 (d) Out of 6(a), number of students who left theschool.7 (a) Total enrolment as on 30th Sept, 2008 in classIV7 (b) Out of 7(a), number of repeaters in class IV ason 30th Sept, 20097 (c) Out of 7 (a) number of promotes in class V ason 30th Sept, 20097 (d) Out of 7(a), number of students who left theschool.8 (a) Total enrolment as on 30th Sept, 2009 in classIV8 (b) Out of 8(a), number of repeaters in class IV ason 30th Sept, 20108 (c) Out of 8(a), number of promotees in class V ason 30th Sept, 2009.8 (d) Out of 8(a), number of students who left theschool.9(a) Total enrolment as on 30th Sept, 2008 in classV9(b) Out of 9(a), number of repeaters in class V ason 30th Sept, 20099(c) Out of 9(a), number of promotees in class VI ason 30th Sept, 20099(d) Out of 7(a), number of students who left theschool.10(a) Total enrolment as on 30th Sept, 2009 in classV10(b) Out of 10(a), number of repeaters in class V ason 30th Sept, 201010(c) Out of 10(a), number of promotees in class VIas on 30th Sept,201010(d) Out of 10(a), number of students who left theschool.11(a) Total enrolment as on 30th Sept, 2008 in classVI11(b) Out of 11(a), number of repeaters in class VIas on 30th Sept, 200911(c) Out of 11(a), number of promotees in class VIIas on 30th Sept, 200911(d) Out of 11(a), number of students who left theschool.200912(a) Total enrolment as on 30th Sept, 2009 in classVI230
Class Year Item Boys Girls Total SC ST Muslims 1(1) (2) (3) (4) (5) (6) (7) (8) (9)– 12(b) Out of 12(a), number of repeaters in class VI2010as on 30th Sept, 2010VII2008–20092009–201012(c) Out of 12(a), number of promotees in class VIIas on 30th Sept, 201012(d) Out of 12(a), number of students who left theschool.13(a) Total enrolment as on 30th Sept, 2008 in classVII13(b) Out of 13(a), number of repeaters in class VIIas on 30th Sept, 200913(c) Out of 13(a), number of promotees in classVIII as on 30th Sept, 200913 (d) Out of 13(a), number of students who left theschool. 14 (a) Total enrolment as on 30th Sept, 2009 inclass VII14(b) Out of 14(a), number of repeaters in class VIIas on 30th Sept, 201014(c) Out of 14(a), number of promotees in classVIII as on 30th Sept, 201014 (d) Out of 14(a) Number of students who left theschool.VIII2008–20092009–201015 (a) Total enrolment as on 30th Sept, 2008 inclass VIII15 (b) Out of 15(a), number of repeaters in class VIIIas on 30th Sept, 200915 (c) Out of 15(a), number of Students passingclass VIII.15 (d) Out of 15(a), number of students who left theschool.16 (a) Total enrolment as on 30th Sept, 2009 inclass VIII16 (b) Out of 16(a), number of repeaters in class VIIIas on 30th Sept, 201016 (c) Out of 16(a), number of students passingclass VIII.16 (d) Out of 16(a), number of students who left theschool.231
13. Give the number of students directly admitted (Lateral Entrants) in class II and above in theacademic year 2009-10 including all those who came on transfer with or without TC from anothergovernment or private recognized school, from EGS schools, AIE Centers, Bridge courses or after<strong>study</strong>ing at home or private tuition or unrecognized school.ClassGive number of students directly admitted under eachcolumn. who came / orBoys Girls Total(1) (2) (3) (4) (5)(a) on transfer with or without TC from recognized school(b) from EGS school/ AIE Center/ Bridge CoursesII(c) from home/private tuition/unrecognized school(d) Total (a+b+c)(e) out of (d), number of students who repeated class II in 2010(f) out of (d), number of students promoted to class III in 2010(a) on transfer with TC or without from recognized school(b) from EGS school/ AIE Center/ Bridge CoursesIII(c) from home/private tuition/unrecognized school(d) Total (a+b+c)(e) out of (d), number of students who repeated class III in 2010(f) out of (d), number of students promoted to class IV in 2010(a) on transfer with TC or without from recognized school(b) from EGS school/ AIE Center/ Bridge CoursesIV(c) from home/private tuition/unrecognized school(d) Total (a+b+c)(e) out of (d), number of students who repeated class IV in 2010(f) out of (d), number of students promoted to class V in 2010(a) on transfer with TC or without from recognized school(b) from EGS school/ AIE Center/ Bridge CoursesV(c) from home/private tuition/unrecognized school(d) Total (a+b+c)(e) out of (d), number of students who repeated class V in 2010(f) out of (d), number of students promoted to class VI in 2010(a) on transfer with TC or without from recognized school(b) from EGS school/ AIE Center/ Bridge CoursesVI(c) from home/private tuition/unrecognized school(d) Total (a+b+c)(e) out of (d), number of students who repeated class VI in 2010(f) out of (d), number of students promoted to class VII in 2010(a) on transfer with TC or without from recognized schoolVII(b) from EGS school/ AIE Center/ Bridge Courses(c) from home/private tuition/unrecognized school232
(d) Total (a+b+c)(e) out of (d), number of students who repeated class VII in 2010(f) out of (d), number of students promoted to class VIII in 2010(a) on transfer with TC or without from recognized school(b) from EGS school/ AIE Center/ Bridge CoursesVIII(c) from home/private tuition/unrecognized school(d) Total (a+b+c)(e) out of (d), number of students who repeated class VIII in 2010(f) Out of (d), number of students passing class VIII.Signature:Signature:Name of Investigator ( ______________________) Name of Supervisor( ___________ )/AuditorMobile:Mobile:Signature:Head teacher’s Name (____________________________________________)Date:Mobile / Phone No.With seal233
DS-2Schedule for Students Who Left the School (school Leavers)Status as on 30 th September 2009 (1) 2010 (2)1. State:_______________________ 2. District:_____________________3. Block: ________________ 4. Village/City/Town: _____________5. Name and address of school:______________________________________________________6._________________________________________________________________________________DISE Code of school:7. Area: Rural (1) Urban (2)8. School category: School with Primary classes only (1) School with Upper Primary classes (2)9. Status as on 30 th September 2009 (1) 2010 (2)10. Give total number of students who left the school as listed in item 1111. Please note down from working sheet the background information (column 2 and 4 to 6) of students wholeft the school during the respective academic session indicated at item 9. Use extra sheet (s), if required,by photocopying page 2 of the schedule. *Information from column 7 to 9 is to be taken from head of thehousehold. For col 3 information to be taken from school admission registerUse following codes for:Column – 4 GenderColumn – 5 – Social GroupOption Code Option Code Option CodeBoy 1 SC 1 Muslim 3Girl 2 ST 2 Others 4If a Muslim child belongs to SC/ST category, he/she should be counted as Muslim child and not as SC / ST ChildColumn 7 – Status as in Item 9 aboveOption Code Option CodeIf the child has shifted to another school in thesame class as repeaterIf the child has shifted to another school in thenext class as promoteeIf the child became a dropout, i.e., not in anyschoolIf status is not known but likely to continueelsewhere1 Status is not known but unlikely to 5continue elsewhere2 Child has expired 63 Status could not be ascertained fromother sources as child migrated to4 another town / villageColumn 8 – Reason for Dropping Out (Only if coded 3 or 5 in column 7, for all other code 99in col. 8 & 9 in col.9)Need to help family in domestic work 01 Child’s own long illness 07Poverty / Economic Reasons 02 Need to take care of sibling 087234
GenderSocial GroupClass inwhichEnrolledStatusReason ofdropping out,If dropoutPresentactivity, if notin any schoolLack of interest in studies 03 Family migrated to other place 09Facilities/teaching in school not satisfactory 04 Non availability of higher level school 10in the vicinityDistance to school was a problem / not 05 No need for girls to <strong>study</strong> 11convenientNon availability of girls school 06 Not applicable (if not a dropout) 99Column 9 – Present ActivityHelping parents/family in agriculture/taking 1 Not doing anything due to incapacity 5care of cattle/other occupational workto work, like long illnessHelping parents/family in household work 2 Activity not known 6Working to earn money 3 Not applicable (Studying in another 9school)Not doing anything, being idle 4Sl. No.Name of school leaverFather/Guardian Name & villagename(1) (2) (3) (4) (5) (6) (7) (8) (9)Signature:Signature:Investigator’s Name ( _________________________) Supervisor’s Name(_________________________________ )Date:Date:Mobile No.Mobile No.235
DS-3Schedule for status of Pass-outs of the Highest Class (VII or lower) in the school1. State:_______________________ 2. District:_____________________3. Block: ________________ 4. Village/City/Town: _____________5. Name and address of school:______________________________________________________6. DISE Code of school:7. Area: Rural (1) Urban (2)8. School category: School with Primary classes only (1) School with Upper Primary classes (2)9.10Status as on 30 th September 2009 (1) 2010 (2)Number of students listed below in item 12.11. Highest Class12. Please note down from working sheet – 1 (for the same year as at item 9) the background information(column 2, 4, 5) and for column 3 from school registers of pass-outs of the highest class of those schoolshaving class VII or lower class in 2009 / 2010 and record their status in 2009 / 2010 in column 6 by visitingchild’s home or other reliable sources. Use extra sheet (s), if required, by photo copying page 2 of theschedule.Use following codes for respective columnsColumn – 4 GenderColumn – 5 – Social GroupOption Code Option Code Option CodeBoy 1 SC 1 Muslim 3Girl 2 ST 2 Others 4If a Muslim child belongs to SC/ST category, he/she should be counted as Muslim child and not as SC / ST ChildColumn 6 –StatusOption Code Option CodeThe child is continuing studies in another school 1 Status not known but likely to continue inanother schoolThe child discontinued studies, i.e., not in any 2 Status not known but unlikely to continueschoolin another school34236
GenderSocialGroupStatusduring nextacademicyearSl.No.Name of the pass-outsFather/guardian name & village name(1) (2) (3) (4) (5) (6)Signature:Signature:Investigator’s Name ( ___________________________ ) Supervisor’s Name ( ____________________________)Date:Mobile No.Date:Mobile No.237