West Bengal Report-IPAI.pdf - Sarva Shiksha Abhiyan
West Bengal Report-IPAI.pdf - Sarva Shiksha Abhiyan
West Bengal Report-IPAI.pdf - Sarva Shiksha Abhiyan

You also want an ePaper? Increase the reach of your titles
YUMPU automatically turns print PDFs into web optimized ePapers that Google loves.
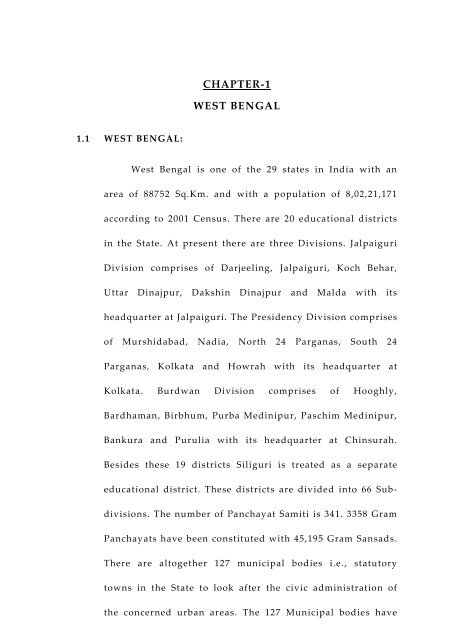
CHAPTER-1WEST BENGAL1.1 WEST BENGAL:<strong>West</strong> <strong>Bengal</strong> is one of the 29 states in India with anarea of 88752 Sq.Km. and with a population of 8,02,21,171according to 2001 Census. There are 20 educational districtsin the State. At present there are three Divisions. JalpaiguriDivision comprises of Darjeeling, Jalpaiguri, Koch Behar,Uttar Dinajpur, Dakshin Dinajpur and Malda with itsheadquarter at Jalpaiguri. The Presidency Division comprisesof Murshidabad, Nadia, North 24 Parganas, South 24Parganas, Kolkata and Howrah with its headquarter atKolkata. Burdwan Division comprises of Hooghly,Bardhaman, Birbhum, Purba Medinipur, Paschim Medinipur,Bankura and Purulia with its headquarter at Chinsurah.Besides these 19 districts Siliguri is treated as a separateeducational district. These districts are divided into 66 Subdivisions.The number of Panchayat Samiti is 341. 3358 GramPanchayats have been constituted with 45,195 Gram Sansads.There are altogether 127 municipal bodies i.e., statutorytowns in the State to look after the civic administration ofthe concerned urban areas. The 127 Municipal bodies have
22,836 wards of the 127 statutory towns. There are 6Municipal Corporations, viz. Kolkata, Howrah,Chandannagar, Durgapur, Asansol and Siliguri; 3 NotifiedAreas, viz. Taherpur, Kooper’s Camp and Gayeshpur, 1cantonment, i.e. Barrackpore Cantonment Board and theremaining 117 statutory towns are functioning asMunicipalities throughout the state.1.2 SARVA SHIKSHA ABHIYAN:<strong>Sarva</strong> <strong>Shiksha</strong> <strong>Abhiyan</strong> (SSA) is a comprehensive andintegrated flagship programme of the Government of India(GOI) to attain Universal Elementary Education (UEE) in thecountry in a mission made. Launched in partnership with theState Governments, SSA aims to provide useful and relevanteducation to all children in the age group of 6-14 years by2010. The goals of the SSA Mission are :a) Enrolment of all children in School, Education GuaranteeCentre, Alternate School, ‘Back-to-School’ camp by 2005.b) Retention of all children till the upper primary stage by 2010.c) Bridging of gender and social category gaps in enrolment,retention and learning.
3d) Ensuring that there is significant enhancement in thelearning achievement levels of children at the primary andupper primary stage.1.3 TERMS OF REFERENCE FOR STUDY BY <strong>IPAI</strong>:Government of India, Ministry of Human ResourceDevelopment, Department of School Education and Literacy,New Delhi vide Ministry’s letter No.15/4/2004/ SSA(PR).EE-15 dated 23 r d September 2008 authorized the Institute ofPublic Auditors of India (<strong>IPAI</strong>), New Delhi to carry outfinancial monitoring and procurement audit relating to SSA,National Programme for Education of Girls at ElementaryLevel (NPEGEL) and Kasturba Gandhi Balika Vidyalaya(KGBV) in all the 35 States/UTs including <strong>West</strong> <strong>Bengal</strong>.1.4 PROFILE OF THE INSTITUTE OF PUBLIC AUDITORS OFINDIA:The Institute of Public Auditors of India (<strong>IPAI</strong>) is aregistered society of professionals registered under theSocieties Registration Act, 1860 (as applicable to NCT ofDelhi). Its main aims and objectives are to :♦Promote education in the disciplines of auditing finance,accounting in public bodies;
4♦Suggest ways for effective accounting and auditing in theCentral and State Governments, Public Enterprises, PublicInstitutions, Government Institutions, Government aidedvoluntary organizations and local bodies;♦Undertake and conduct studies, workshops, consultancy andresearch in these disciplines;♦Organise, finance and maintain schemes for studies and forconduct of professional examinations for the grant ofdiplomas, certificates and awards in these disciplines;♦Promote, plan and assist actively with the Governments andits agencies for development of sound system of accounting,auditing and financial accountability of Panchayati RajInstitutions (PRIs) and Municipalities;and♦Promote the highest standards of professional competenceand practices in disciplines of auditing, accounting andpublic finance.The Comptroller and Auditor General of India is thePatron of the Institute.1.5 METHODOLOGY:A study team was constituted to undertake the study ofSSA programme in the State of <strong>West</strong> <strong>Bengal</strong>. The team visitedthe following Offices/Schools :
5(a) State Project Office (SPO), Salt Lake City, Kolkata;(b) Two District Project Offices (DPO) viz. Murshidabad Districtand South 24-Parganas District;(c) Three Circle Resource Centre (CLRC), namely, Kandi andSadar <strong>West</strong> in Murshidabad District and Diamond HarbourSouth in South 24 Parganas District.(d) ……40…….primary and ……60………Upper Primary Schoolsas in Annexure ……1……. located in Murshidabad and South24-Parganas District.Basic records maintained by the SPO, DPOs, CLRCs,Village Education Committees (VECs), Ward EducationCommittees (WECs) and schools, viz. cash books, pass books,ledgers, stock register household population surveys etc.were scrutinised by the team. Physical verification ofconstruction activities of primary and upper primary schoolswas carried out. Discussions were also held withState/District/CLRCs, VECs, and School level functionariesresponsible for implementation of SSA Programme. Besides,limited interviews based on structured questionnaire withChairman/Members of VECs, WECs Headmasters, Teachers,Parents and students were also carried out.
61.6 The <strong>Report</strong> has been prepared in accordance with themandate given by the client organization and within theoverall policy frame work of reporting laid down by theCentral Council of the Institute. The views expressed in theStudy <strong>Report</strong> are those of <strong>IPAI</strong> only and does not reflect inany manner that of the Indian Audit and AccountsDepartment. The findings of the study on the above basis arecontained and analyzed in the succeeding paragraphs.
71.7 DEMOGRAPHIC AND EDUCATIONAL PROFILEThe demographic and educational profile of the State of <strong>West</strong><strong>Bengal</strong> and Murshidabad and South 24-Parganas Districts aregiven below :Sl.No. Particula rs <strong>West</strong> <strong>Bengal</strong>MurshidabadDistrictSouth 24Parganas District1 Area 88,752sqkm 5324 sq.km. 9,960sq.km.2 Popula tion (a) Male 4,14,87,694 30,04,385 35,64,241(b) Female 3,87,33,477 28,59,332 33,44,7743 Block/Panchayat Samity 341 26 294 Number of Mun icipality 127 7 75 Gram Panchaya t 3358 255 3126 Literary Rates (a) Male 77.02% 60.71% 79.19%(b) Female 59.61% 47.63% 59.01%7 Number of Primary Sch ools(Govt) 49,965 3171 36688 Number of Upper Prima rySch ools9 Number of Tea chers(Govt)9,446 513 794(a) Primary 1,52,503 10,595 11,550(b) Upper Pr imary 79,620 3,979 6,34210 Number of Para Teacher(a) Primary 20,527 3,461 1,615(b) Upper Pr imary 33,825 3,276 2,38311 Number of Children (5+ to8+ age group) 84,25,771 6,49,743 6,45,38612 Number of Childr en (9+ to13+ agegroup)13 Number of enr olled Ch ildren80,46,923 6,55,716 7,87,186(5+ to 8+ age gr oup) 83,06,508 6,39,197 6,29,90614 Number of enr olled Ch ildren(9+ to 13+ age gr oup) 62,43,084 4,02,366 4,92,12115 Number of Villages with outPrimary Sch ool/SSK havingpopulation more than 10 00 969 80 112Source:Census 2001, Annual work Plan & Budget 2008-09 and GISMappingCHAPTER – II
81.8 ORGANISATIONAL SET UP / MANAGEMENT STRUCTURE1.8.1 As per the framework drawn for implementation of SSAProgramme, there would be a Star Mission Authority forUniversal Elementary Education (UEE). The states have to setup the State Implementation Society (SIS). In DPEP states,the existing societies suitably modified would meet theneeds of UEE. The SIS will carry out monitoring andoperational support tasks. The District and Sub-district unitswill be set up by the State.The Government of <strong>West</strong> <strong>Bengal</strong> established on 2 n dFebruary 1995 a registered society named ‘Paschim BanglaRajya Prathamik Siksha Unnayan Sansita’ as an autonomousand independent body for implementation of the <strong>West</strong><strong>Bengal</strong> Elementary Education Project and to function as asocietal mission for bringing about a fundamental change inthe basic education system. The implementation of SSA inthe State was entrusted to this Sansita on 14 March 2002 withsome alterations when the name of SIS was also changed to‘Paschim Banga Rajya Praramvik Siksha Unnayan Sanstha’(PBRPSUS). The name of PBRPSUS was again changed to‘Paschim Banga <strong>Sarva</strong> Siksha Mission’ on 31 October 2006.
9The authorities of the Society are the General Council (GC)and the Executive Committee (EC). The GC is headed by theChief Minister as Chairman with MIC, School EducationDepartment as Vice-Chairman. The EC which administers theaffairs of the Society, is chaired by the Chief Secretary to theState Government. The State Project Office (SPO) is the mostcrucial unit for implementation of the Programme, which haslinks with District and Sub-district level structures, NGOs,State Government, National Bureau and all other concerned.The State Project Office is headed by the State ProjectDirector (SPD). The District Project Office is headed by theZilla Sabhadipati with the District Magistrate authorized tofunction as District Project Director in all districts. However,in case of Darjeeling Gorkha Hill Council (DGHC), anindependent educational District, the Chairman of theCouncil Functions as the Council Project Director, SSA,DGHC. Similarly, in case of Siliguri Mahakuma Parisad(SMP), another independent educational District, theAdditional Executive Officer of SMP holds the chair ofMahakuma SSM Committee and acts as the Project Directorin his Ex-Officio capacity. In Kolkata, the Chairman, District
10Primary School Council, functions as the Chairman, SSMCommittee, Kolkata.At the Sub-district level, there is a Circle ResourceCentre (CLRC), a fully organized academic andadministrative resource Centre of SSA activities. Sub-Inspector of schools of the circle function as Circle ProjectCoordinator (CPC) of the concerned CLRC in addition tohis/her normal duties. Circle is the lowest administrative setup at Sub-district level. The Cluster Resource Centre (CRC)is headed by one CRC Co-ordinator. CRC mainly looks afterthe quality of education within the area and co-ordinates allagencies in the field of primary education under theguidance of CPC.
11ORGANISATIONAL CHARTSTATE IMPLEMENTATION SOCIETYPASCHIM B ANGA SAR VA SIKSHA MISSIONGENER AL COUNCIL HEADED BYHONOURAB LE CHIEF MINISTER (CHAIR MAN)HONOURAB LE MIC, SCHOOL EDUCATION DEPARTMENT(VICE CHAIR MAN) AND CONSISTS OF CHIEF SECRETARY OTHERSECR ETAR IES, OFFICIALS ALONGWITH COMMUNITY REPR ESENTATIVESEXECUTIVE COMMITTEEHEADED B YCHIEF SECR ETARY TO THE STATE GOVERNMENT (CHAIRMAN) ANDCONSISTS OF OTHER SECR ETAR IES ALONG WITH COMMUNITYREPRESENTATIVESSTATE PROJECT OFFICE HEADED B YSTATE PROJECT DIRECTOR (SPD), ADDL. SPD I & II, CONTR OLLER OFFINANCE AND OTHER OFFICERS AND STAFF EXCLUSIVELY FOR THEPROJECTDISTRICT LEVEL IMPLEMENTATION AUTHORITYHEADED B YZILLA SAB HADIPATI (CHAIRMAN), DISTR ICT MAGISTR ATE AS EX-OFFICIODISTRICT PR OJECT DIRECTOR, DISTRICT PROJECT OFFICER, DISTRICTPRIMARY SCHOOL COUNCIL, DISTR ICT EDUCATION OFFICER ANDCOMMUNITY REPRESENTATIVES↓↓↓↓↓CIRCLE LEVEL STR UCTUR ECIRCLE R ESOUR CE CENTR E (CLRC)HEADED B YCIRCLE PR OJECT CO-ORDINATOR (S.I. OF CIRCLE IN EX-OFFICIOCAPACITY) ASSISTED BY TWO R ESOUR CE TEACHERS.CLUSTER LEVEL STRUCTURECLUSTER R ESOURCE CENTR EHEADED B YHEADMASTER OF SCHOOL WORKING AS CO-OR DINATORASSISTED BY ONE R ESOUR CE TEACHERVILLAGE EDUCATION COMMITTEEHEADED B YPANCHAYAT PR ADHAN / PANCHAYAT MEMBER (CHAIR MAN) ANDCONSISTS OF HEAD TEACHER, WARD MEMB ERS AND COMMUNITYREPRESENTATIVES.↓↓↓
121.8.2 Working of the State Implementation Society / District LevelImplementation Authority / Sub-district Level structures.(a) General Council :As per Rule 15 of the Memorandum of Association(MOA) of the SIS, the General Council shall meet at leasttwice in a year. Against this, only one meeting of the G.C.was held during 2005-06 to 2008-09 (December 2009). The lastmeeting was held on 19 April 2005.(b) Executive Committee :Rule 32 of the MOA of the SIS stipulates that theExecutive committee shall meet at least once in every quarterof the year. Against this, the Committee met twice in 2005-06, twice in 2006-07, and once in 2008-09 (upto December2008) on 14-04-2008. No meeting was held in 2007-08.(c) District Level Implementation Authority – (DLIA) SelectedDistricts :Murshidabad – The DLIA shall meet once in a month, andthere should have been 45 meetings during 2005-06 to 2008-09 (December 2008). But it was seen that the Authority met 3times in 2005-06, 5 times in 2006-07, twice in 2007-08 and 4times in 2008-09 (December, 2008).
13South 24 Parganas – Against 45 meetings to be held during2005-06 to 2008-09 (December 2008), DLIA held 14 meetings(3 in 2005-06, 5 each in 2006-07 and 2007-08 and 1 in 2008-09)1.9 POSITION OF STAFF AND OFFICERSThe table below indicates the names and period ofincumbency in the post of State Project Director (SPD),Additional State Project Director (Addl. SPD), Deputy StateProject Director (DSPD) I & II, Controller of Finance andAudit Officer (Internal Audit) in SPO and District ProjectOfficer in Murshidabad and South 24 Parganas Districts :Sl.No.Name From To DuelCharge heldState Project Director1. Shri Joydeb Dasgupta, IAS 01-04-05 05-04-0516-05-05 31-12-052. Shri Debaditya Chakrabor ty, IAS 06-05-05 15-05-05 Pri ncipalSecre tary,EducationDepartme nt3. Shri Santi Bhusan Biswas WBCS (Exe) 01-01-06 11-09-064. Shri Dushyant Nariala, IAS 11-09-06 09-07-08Remarks5. Shri Prabha t Kumar Mishra, IAS 09-07-08 Con tinuingAdditional State Project Director1. Shri Santi Bhusan Biswas WBCS(Exe) 01-04-05 29-02-08 Full Time2. Shri Narendranath Bar man WBCS(Exe) 19-11-08 Full Time Con tinuingDeputy State Project Director1. Md. Syed Nur ul Islam WBCS,DSPD-I 01-04-05 Full Time Con tinuing2. Md. Da birul Isla m WBCS DSPD-II 27-02-06 Full Time Con tinuingControlle r of Finance1. Shri Narayan Chandra Debna th 01-04-05 12-09-06 Full TimeWBA&AS2. Shri Sitanshu Bha ttachar jee WBA&AS 20-10-06 Full Time Con tinuingAudit Officer (Internal Audit)1. Shri Siddhartha Basu, WBA&AS 20-07-07 Full Time Continuing
14Sl.No.Murshidabad DistrictName From To Duel ChargeheldRemarksDistrict Project Director1. Shri Manjuna th Prasad IAS 01-04-05 25-06-06 Distr ictMagistra teMurshida bad2. Shri Subir Kumar Bhadr a, IAS 26-06-06 30-09-08 As a bove3. Md. Pervej Ah med SiddiqueIAS30-09-08 As a bove Con tinuingDistrict Project Office r1. Md. Fakrul Isla m, WBES 23-05-04 31-10-05 Full Time2. Shri Sujit Kumar Maiti WBES 01-11-05 Full Time Con tinuingSouth 24-Pargana sDistrict Project Dire ctor1 Shri Vivek Kumar IAS 01-04-05 01-08-05 Distr ictMagistra teSouth 24-Parganas2. Smt. Roshni Sen IAS 01-08-05 20-04-07 As above3. Smt. Sanghamitra Gh osh IAS 20-04-07 As above Con tinuingDistrict Project Office r1. Md. Rejanul Karim Ta rafdar,WBES01-04-05 Full Time Con tinuingIt would be evident from the above that :(a) Continuity factor, which is vital for implementation of aprogramme was not maintained in respect of Addl. StateProject Director and Controller of Finance. The post ofAdditional State Project Director remained vacant for aperiod of 8 months 18 days.(b) Internal Audit Wing remained unattended for a long time.An Audit Officer (Internal Audit) was posted only in July2007.
15YearThe position of the contractual employees in the SPO as wellas in the selected districts of Murshidabad and South 24 Parganasduring the last 4 years since 2005-06 was as given below:SanctionedpostSPO DPO,Murshidabad DPO, South 24 ParganasIn Vacant Sanctioned In Vacant Sanctioned In Vacantposit ionpost posit ionpost posit ion2 0 0 5 -0 6 7 5 6 5 1 0 3 0 2 8 2 2 8 1 6 1 22 0 0 6 -0 7 7 5 6 5 1 0 3 0 2 7 3 2 8 1 6 1 22 0 0 7 -0 8 7 5 6 5 1 0 3 0 2 9 1 2 8 1 7 1 12 0 0 8 -0 9 7 5 6 3 1 2 3 0 2 8 2 2 8 1 8 1 0The above showed that while the SPO had vacant postsranging between 10 and 12 out of 75 sanctioned posts, the DPO,South 24 Parganas had also vacant posts varying from 10 to 12,representing 35.71 to 42.86 percent of sanctioned posts.44
16CHAPTER-2BUDGET AND ACTUALSANNUAL WORK PLAN AND BUDGET/FUND FLOW2.1 Perspective Plans and Annual Plans –According to Para 19 of the Manual on FinancialManagement and Procurement each SSA district has to prepare aperspective plan upto 2009-2010 based on the data collectedthrough household survey, micro planning exercise etc. Keepingthe perspective plan in view. Annual Work Plan and Budget(AWP&B) is to be prepared every year. Records, however, revealedthat perspective plan was prepared wityhout habitation levelmicro-planning and school mapping. In May 2008, Paschim Banga<strong>Sarva</strong> <strong>Shiksha</strong> Mission (PBSSM) got the Geographical InformationSystem (GIS) Mapping work done by M/s. Riddhi ManagementServices Pvt. Ltd. (RMSP), Kolkata, being recommended by theUnited Nations Children Fund at a total cost of Rs.14.60 lakhs,Though as per agreement RMSP was to perform the workproviding a computerized system with a user friendly interfacewith (i) a drop down facility from the state to district to block topanchayet level showing the precise location of each school, (ii)inclusion of data on out of school children broken down bySC/ST/OBC or minority status, (iii) distribution of literacyespecially female literacy levels at village level (iv) age wisedistribution of child population in a specific habitation, (v)inclusion of relevant socio-economic data, records revealed thatthe firm plotted only 45,309 Primary and 7541 Upper Primaryschools in 342 blocks in 20 districts without conducting the survey
17of child population in a specific habiutation with relevant socioeconomicdata and distrisbution of literacy at village levels as percontract. Incidentally, mention may be made here that <strong>West</strong> <strong>Bengal</strong>Board of Secondary Education incurred expenditure of Rs.6 lakhfor school mapping during 2007-08 but details of such mappingwere not made available to the Survey Team. The SIS could notmake available records justifying school mapping done by RMSPduring 2008-09 which had already been done by WBBSE.2.2 Annual Work Plan & Budget.According to Para 19.2 of the Manual on Financial Managementand Procurement, Annual Plans need to seen as a complement to theperspective plans but the latter was prepared not as per SSA procedurestated above. The AWP & B should be formulated through participatoryplanning process and there should be documentation that the planshave been prepared at the habitation level in participation withcommunity and target groups. During field visit, it was noticed by theStudy Team that the above declared procedure was totally absent downbelow the district level. It was learnt from the VEC/WEC/Schools/SMCsvisited by the Team that concerned sections were not even aware of theabove planning process and they were never assured to prepare orinvolve themselves in the planning/budgeting process. It was furtherreported by them that their repeated requests for inclusion of theirrequirement in the district budget were not taken care of. The fact wasconfirmed by the CLRCs that they were neither asked to submit anyplan/budget for inclusion in the district AWP&B nor, plans submittedby the CLRC were considered for inclusion in the district AWP&B. Eventhe basic requirements, viz, drinking water facilities toilets, girls’separate toilets, bench with desks for primary students, etc., were nottaken care of which would be evident in Chapter-16 on Field visits.
18The AWP&B prepared by DPOs should be transmitted to SPO by1 s t February and by SPO to the Project Approval Board (PAB) by 15 t hMarch. The PAB should approve the AWP&B by 15 t h April.The position showing the submission of AWP&B by the StateMission, approval thereof by PAB and release of the first instalment ofgrant by GOI and receipt thereof by the Mission is given below:AWP&Bfor the yearDate ofsubmission b ySta te MissionDate ofa pproval b yPABDate of receiptof appro vedAWP&B in SPODate of receipt of 1 s tinsta lment re le a sed bySta teGOIGovernment(i n lump su m)2 0 0 5 -0 6 2 5 -0 3 -2 0 05 1 9 -0 7 -2 0 05 2 0 -0 7 -2 0 05 0 5 -0 7 -2 0 05 1 5 -0 7 -2 0 052 0 0 6 -0 7 2 0 -0 3 -2 0 06 2 2 -0 8 -2 0 06 2 8 -0 8 -2 0 06 2 3 -0 6 -2 0 06 0 8 -0 8 -2 0 062 0 0 7 -0 8 0 2 -0 4 -2 0 07 2 2 -0 5 -2 0 07 2 3 -0 7 -2 0 07 0 5 -0 6 -2 0 07 2 5 -0 6 -2 0 072 0 0 8 -0 9 0 3 -0 4 -2 0 08 1 7 -0 6 -2 0 08 2 3 -0 6 -2 0 08 2 7 -0 5 -2 0 08 1 5 -0 7 -2 0 05N.B.: Rele a se of subsequent ins ta lments sta te d in fu nd flowSubmission of AWP&B by the SPO, approval of the same by thePAB and release of first instalments by GOI and State Government needstreamlining so that activities as laid down in AWP&B are taken upwell in time.2.3 BUDGET AND ACTUALSTables below indicate activity wise outlay approved and theexpenditure as incurred against each component for the years 2005-2006to 2008-2009 for the State of <strong>West</strong> <strong>Bengal</strong>:
19Sl.No.Acti vi tyAWPproposed2005-2006Table-1Approvedby PABActuale x penditureDifferenceE x cess+/Shortfall(C -D)Percenta geofE x cess(+ )/Shortfall(C : E)A B C D E FSAS1 New Sch ools (Phy) -- -- -- -- --2 Block Resour ce Cen tre 566.83 477.57 357.24 120.33 25.203 Cluster Resour ce Cen tre 1,203.32 1,062.78 298.82 763.96 71.884 Civil Works 41,218.04 29,188.55 28,454.61 733.94 2.515 Interventions for out of 17.656.74 14,261.42 4,351.00 9,910.42 69.49Sch ool Children6 Free Text Book 15,664.48 5,538.65 4,607.44 931.21 16.817 Inn ovative Activity 926.25 793.01 377.06 415.95 52.458 Interventions for Disa bledChildren 2,564.95 1,282.48 723.79 558.69 43.569 Maintenance Grant 2,913.10 2,023.10 2,119.21 (+)96.11 (+)4.7510 Managemen t & MIS 4,982.46 3,792.64 2,249.25 1,543.39 40.6911 Resear ch & Evaluation 774.26 464.98 327.79 137.19 29.5012 Sch ool Grant 1,150.26 1,138.26 1,054.33 83.93 7.3713 Teachers Grant 1,707.90 1,648.25 1,015.07 633.18 38.4214 Teachers Salary 34,153.32 35,138.68 3,457.92 31,680.76 90.1615 TLE 1,002.00 1,726.75 357.84 1,368.91 79.2816 Teacher Training 7,854.34 5,807.70 1,536.43 4,271.27 73.5417 Commun ity Mobilisation 166.22. 165.91 234.22 (+)68.31 41.1718 SEIMAT 189.00 300.00 --- 300.00 100.00Others --- --- 47.55 (+)47.55 (+)100.00Total 1,34,693.47 1,04,810.73 51,569.57 53,241.16 50.80NPEGEL 760.50 1,133.85 1,456.79 (+)322.94 (+)28.48Grand Total 1,35,453.97 1,05,944.58 53,026.36 52,918.22 49.95(Rupees in lakh)Note : Actual expenditure as audited accounts
20Sl.No.Acti vi tyAWPproposedTable-22006-2007Approvedby PABActuale x penditureDifferenceE x cess+/Shortfall(C -D)Percenta geofE x cess(+ )/Shortfall(C : E)A B C D E FSAS1 Circle Resour ce Cen tre 230.35 236.28 248.23 (+)11.95 5.062 Cluster Resour ce Cen tre 727.32 727.32 576.06 151.26 20.803 Civil Works 70,522.00 72,302.33 54,959.27 17,343.06 23.994 Intervention for out ofsch ool children23,514.22 26,221.14 8,919.30 17,301.84 65.985 Free Text Book 4,666.71 4,666.71 3,138.07 1,528.64 32.766 Inn ovative Activity 975.00 975.00 675.85 299.15 30.687 Interventions for disa bledchildren1,688.39 1,688.39 867.65 820.74 48.618 Maintenance Grant 2,933.65 2,933.65 2,267.50 666.15 22.719 Pr oject Management 6,043.94 6,043.94 5,314.12 729.82 12.0810 Resear ch & Evaluation 783.26 731.82 482.77 249.05 34.0311 Sch ool Grant 1,045.66 1,045.66 1,025.57 20.09 1.9212 Teachers Grant 1,599.69 1,599.69 1,237.77 361.92 22.6213 Teachers Salary 21,537.17 21,537.17 10,674.07 10,863.10 50.4414 VRP Salary 249.31 249.31 -- 249.31 100.0015 Teaching LearningEquipmen t--- --- 265.41 (+)265.41 (+)100.0016 Teachers Training 2,951.77 2,951.77 951.35 2,000.42 67.7717 Commun ity Mobilisation 160.18 160.18 277.23 (+)117.05 (+)73.07Total 1,39,628.62 1,44,070.36 91,880.22 52,190.14 36.22NPEGEL 2,012.40 2,416.99 1,280.87 1,136.12 47.01Grand Total 1,41,641.02 1,46,487.35 93,161.09 53,326.27 36.40(Rupees in lakh)Note : Actual expenditure as audited accounts
21Table-3(Rupees in lakh)Sl.No.Acti vi tyAWPproposed2007-2008Approvedby PABActuale x penditureDifferenceE x cess(+ )Shortfall(C -D)Percenta geofE x cess(+ )/Shortfall(C : E)A B C D E FSAS1 New Sch ools -- -- -- -- --2 Teachers Salary 37,865.19 37,845.70 21,035.93 16,809.77 44.423 Teachers Grant 1,673.33 1,409.00 1,094.59 314.41 22.314 Circle Resour ce Cen tre 729.82 351.05 282.33 68.72 19.585 Cluster Resour ce Cen tre 1,738.88 1,366.35 495.60 870.75 63.736 Teachers Training 2,793.83 2,520.08 1,526.32 993.76 39.437 Interventions for out ofsch ool children15,033.20 7,604.348 Remedial Tea ching 18,902.28 3,634/382,998.35 8,240.37 73.329 Free Text Books 3,904.63 3,671.92 3,334.38 337.54 9.1910 Interventions for CWSN(IED)1,540.86 1,155.65 875.75 279.90 24.2211 Civil Works 95,281.57 68,152.3312 Major Repair s 867.33 853.8359,984.54 9,021.62 13.0713 Teaching LearningEquipmen t1,205.00 800.00 317.95 482.05 60.2614 Maintenance Grant 2,964.00 2,572.66 2,390.25 182.41 7.0915 Sch ool Grant 1,185.60 1,185.60 1,024.51 161.09 13.5916 Resear ch & Evaluation 829.92 829.92 349.28 480.64 57.9117 Managemen t & MIS 5,958.34 5,135/40 3,761.24 1,374.16 26.7618 Inn ovative Activity 2,380.44 999.99 410.79 589.20 58.9219 Commun ity Training 191.93 190.91 207.05 (+)16.14 (+)8.4520 SEIMAT 1,440.72 1,010.32 --- 1,010.32 100.00Total 1,96,486.83 1,41,289.43 1,00,088.86 41,200.57 29.16NPEGEL 1,666.66 1,547.57 212.41 1,335.16 86.27KGBV 1,893.81 1,039.18 424.05 615.13 59.19Grand Total 2,00,047.30 1,43,876.18 1,00,725.32 43,150.86 29.99Noe : Atual expenditure as per audited a ccounts
23From the above tables the following position emerge :(i)PAB approved the annual outlay each year earmarking theamount in AWP&B for each intervention but GOI releasedthe fund in lump without indicating the intervention wiseamount released. Even the State Project Office whilereleasing funds to District Project Offices did not specify theproportionate amount allocable to each intervention withreference to detailed allotment for each intervention vis-à-vistotal allotment approved by PAB. As a result, meaningfulanalysis of the physical and financial achievement comparedto approved outlay could not be made.(ii)Overall shortfall between the approved AWP&B and actualexpenditure during 2005-06, 2006-07 2007-08 and 2008-09(upto September, 2008) in respect of SSA was to the extent of50.80 per cent, 36.22 percent, 29.16 per cent and 77.79 percentrespectively. Overall shortfall in respect of NPEGEL during2006-07, 2007-08 and 2008-09 (9/08) was 47.01 percent, 86.27per cent and 94.10 per cent respectively. During 2005-06,there was excess expenditure to the extent of 28.48 per centin respect of NPEGEL.(iii)During 2005-06, of the total of 17 SSA activities, shortfall inexpenditure compared to approved outlay in respect of 7activities (CRC, Out of School Children, Innovative Activity,Teachers Salary, TLE, Teacher Training and SEIMAT) rangedfrom 52.45 percent to 100.00 per cent. The cent per centshortfall amounting to Rs.300.00 lakh occurred due to nonutilisationof budget allocation in 2003-04 for opening a State
24Institute of Education Management and Training (SIEMAT)till date (December 2008).Theexcess expenditure in respect of NPEGEL duringthe year was 28.48 per cent.(iv)During 2006-07, of the total 17 SSA activities, shortfall inexpenditure vis-à-vis approved outlay in respect of 4activities (out of School Children, Teachers Salary, VRPSalary and Teachers Training) ranged between 50.44 percentand 100.00 per cent. There was expenditure in excess ofbudget allocation in respect of Teaching Learning Equipment(100.00 per cent) and Community Mobilisation (73.07 percent).Shortfall in respect of NPEGEL was 47.01 per cent.(v) During 2007-08, shortfall in expenditure compared toapproved outlay in respect of 6 SSA activities (CRC, out ofschool children and Remedial Teaching, Teaching LearningEquipment, Innovative Activities and SIEMAT) varied from57.91 percent to 100.00 percent), out of 19 activities for whichallocations were made.Shortfall in expenditure in respect of NPEGEL andKGBV during the year was 86.27 percent and 59.19 percentrespectively.(vi) Upto September 2008, the State Mission could utilize 22.21percent, 5.90 percent and 10.44 percent of the approved
25AWP&B allocations for SSA, NPEGEL and KGBV activitiesfor the year 2008-09.(vii) There were differences in expenditure figures as reportedto GOI through quarterly progress reports and asincorporated in the audited accounts of the State Missionfor the years 2005-06, 2006-07 and 2007-08 as shownbelow:Table-5(Rupees in lakh)Appr oved outlay by Expenditure as Expenditure as perYearPABrepor tedAudited Accoun tsSSA NPEGEL SSA NPEGEL SSA NPEGEL2005-06 1,04,810.73 1,133.85 47,718.11 503.40 51,569.57 1,456.792006-07 1,44,070.36 2,416.99 93,934.80 192.27 91,880.22 1,280.872007-08 1,41,289.43 1,547.57 1,01,303.10 422.10 1,00,088.86 212.41It would be seen from the above table that during this three years therewas a wide variation between the expenditure figures reported by themission to PAB and the figures reflected in the approved accounts.2.4 Lapse of Budget Grant :An analysis of AWP&B proposed by the State Mission andapproval thereof by PAB for the years 2005-06 to 2007-08 disclosedthat an amount of Rs.1,19,477.00 lakh of the approved outlaylapsed during the period due to failure of the State Mission toutilize the allotted outlay as detailed below :(Rupees in lakh)As per AWP&BLapsedYearUnspent balance of Spill over approved Amountapproved outlay2005-06 57,092.00 1,801.00 55,291.002006-07 53,131.00 1,257.00 51,874.002007-08 39,986.00 27,674.00 12,312.00Total 1,50,209.00 30,732.00 1,19,477.00
26The above status indicated tardy implementation of SSAProgramme in the State with resultant non-fulfilment of the SSAobjective of UEE within the Plan period. This is also a pointer tolack of co-ordination and proper monitoring of the implementationof SSA Programme.Since time is the essence of successful implementation of theProgramme, the aspects of planning, budgeting and execution ofinterventions needed much closer monitoring by the Authoritiesconcerned.2.5 Selected DistrictsActivity wise approved outlay and expenditure incurredagainst each component for the years 2005-06 to 2008-09 (uptoSeptember, 2008) in respect of the selected districts ofMurshidabad and South 24 Parganas was as under :
27Sl.No.ActivityApp rov edoutlayActua lExpenditureMurshidabadDiffe remceExcess (+ ) /Shortfa l l(B-C )Table- 6Pe rcentage ofExcess (+ ) /Shortfa l l(B:D)App rov edOutlaySouth 24-ParganasActua lExpenditureDiffe remceExcess (+ ) /Shortfa l l(A-C )Pe rcentage ofExcess (+ ) /Shortfa l l(A:D)A B C D E A B C DA SSA1 New School s -- -- -- -- -- -- -- --(Ph y)2 Block Resourc e 2 3 .15 1 5 .30 7 .85 3 3 .91 1 9 .06 7 4 .77 (+ )5 5 .71 (+ )2 9 2 .29C entre3 C l uster3 8 .42 4 6 .09 (+ )7 .67 (+ )1 9 .96 3 8 .41 1 7 .22 2 1 .19 5 5 .17Reso u rceC entre4 C i vil Works 2 ,279.0 0 2 ,262.0 5 1 6 .95 0 .74 2 ,152.0 0 3 ,039.6 0 (+ )8 8 7 .60 (+ )4 1 .255 I nterventi on s 1 ,455.9 1 8 2 .66 1 ,373.2 5 9 4 .32 1 ,065.1 2 6 6 .59 9 9 8 .53 9 3 .75for out o fSchool Children6 Fre e Text B oo k 3 6 0 .80 3 6 0 .60 0 .20 0 .06 4 8 5 .69 4 8 7 .51 (+ )1 .82 (+ )0 .377 I nnovative2 2 .00 3 0 .65 (+ )8 .65 (+ )3 9 .32 5 0 .00 1 7 .71 3 2 .29 6 4 .58Activity8 I nterventi on s5 5 .72 3 8 .47 1 7 .25 3 0 .96 7 7 .75 7 7 .52 0 .23 0 .30for di sa bledchildren9 Ma i ntenance1 5 1 .85 1 5 5 .70 (+ )3 .85 (+ )2 .54 1 8 2 .10 1 7 8 .85 3 .25 1 .78Gra nt1 0 Ma nagement & 2 6 5 .27 2 8 5 .66 (+ )2 0 .39 (+ )7 .69 2 7 9 .71 2 6 7 .60 1 2 .11 4 .33MI S1 1 Research & 3 2 .94 2 1 .41 1 1 .53 3 5 .00 3 8 .20 2 3 .32 1 4 .88 3 8 .95Evalua tion1 2 School Gra nt 8 3 .96 7 3 .08 1 0 .88 1 2 .96 9 8 .80 8 7 .32 1 1 .48 1 1 .621 3 Teachers Gra nt 1 4 7 .62 7 0 .79 7 6 .83 5 2 .05 1 8 1 .32 7 8 .55 1 0 2 .77 5 6 .681 4 Teachers Salary 4 ,874.6 7 2 5 0 .53 4 ,624.1 4 9 4 .86 5 ,288.8 5 -- - 5 ,288.8 5 1 0 0 .001 5 TLE 2 5 .00 2 5 .00 -- -- -- -- -- --1 6 Teacher4 8 0 .97 5 4 .86 4 2 6 .11 8 8 .59 5 5 7 .62 1 1 6 .76 4 4 0 .86 7 9 .06Tra i ning1 7 C ommunity1 3 .99 1 0 .02 3 .97 2 8 .38 1 6 .67 4 8 .20 (+ )3 1 .53 (+ )1 8 9 .14Mobilisa tion1 8 SEIMAT -- -- -- -- -- -- -- --Others -- - 4 .53 (+ ) 4.53 (+ )1 0 0 .00 -- - -- - -- - -- -Total 1 0 ,311 .27 3 ,787.4 0 6 ,523.8 7 6 3 .27 1 0 ,531 .30 4 ,581.5 2 5 ,949.7 8 5 6 .50NPEGEL -- - -- -- - -- - 8 5 .52 9 .59 7 5 .93 8 8 .79Grand Tota l 1 0 ,311 .27 3 ,787.4 0 6 ,523.8 7 6 3 .27 1 0 ,616 .82 4 ,591.1 1 6 ,025.7 1 5 6 .76(Rup ees in lakh )2 0 0 5 -0 6
28Table- 7(Rup ees in lakh )2 0 0 6 -0 7MurshidabadSouth 24-ParganasS l.No.A c t ivit y A p p r ovedoutla yA c t u a lEx p endit u r eD ifferemceEx c ess(+)/S h ortfall( B-C)P ercent a g e ofEx c ess(+)/S h ortfall( B:D)A p p r ovedO u t la yA c t u a lEx p endit u r eD ifferemceEx c ess(+)/S h ortfall( A - B)P ercent a g e ofEx c ess(+)/S h ortfall( A : C )A B C D E A B C DA SSA1 C ircle R esourc e 4 . 6 8 1 3 . 69 ( + ) 9 . 0 1 ( + ) 1 9 2 .5 2 5 . 2 2 6 . 7 9 ( + ) 1 . 5 7 ( + ) 3 0 . 08C entre2 C luster4 5 /32 3 6 . 29 9 . 0 3 1 9 . 92 2 0 . 87 - - 2 0 . 87 1 0 0 .0 0R esource Centre3 C ivi l Works 8 , 1 80 . 00 6 , 5 82 . 85 1 , 5 97 . 15 1 9 . 53 6 , 0 77 . 00 4 , 2 16 . 70 1 , 8 60 . 30 3 0 . 614 Interventions 2 , 6 90 . 41 2 6 . 70 2 6 63 . 71 9 9 . 01 1 , 8 88 . 10 1 2 8 .4 5 1 , 7 59 . 65 9 3 . 20f or out ofS c h ool ch il dren5 F r ee Text Book 3 3 2 .2 4 - - - 3 3 2 .2 4 1 0 0 .0 0 4 2 0 .8 7 4 0 6 .3 3 1 4 . 54 3 . 4 56 Innova t ive5 0 . 00 3 5 . 15 1 4 . 85 2 9 . 70 5 0 . 00 3 4 . 61 1 5 . 39 3 0 . 78A c t ivit y7 Interventions1 1 1 .7 8 8 7 . 59 2 4 . 19 2 1 . 64 8 8 . 35 4 5 . 28 4 3 . 07 4 8 . 75f or disabl edc h ildr en8 M a intenan c e1 8 4 .2 0 1 8 2 .0 1 2 . 1 9 1 . 1 9 2 2 4 .1 0 2 1 9 .8 0 4 . 3 0 1 . 9 2G r a n t9 P r oject3 4 5 .6 3 2 4 1 .5 2 1 0 4 .1 1 3 0 . 12 3 7 8 .6 4 3 6 1 .5 3 1 7 . 11 4 . 5 2M a na g ement1 0 R esearch & 4 8 . 85 1 2 . 53 3 6 . 32 7 4 . 35 5 8 . 27 5 . 2 8 5 2 . 99 9 0 . 94Eva luation1 1 S c h ool Grant 7 5 . 16 7 3 . 26 1 . 9 0 2 . 5 3 8 9 . 64 8 7 . 66 1 . 9 8 2 . 2 11 2 T eachers Grant 1 3 3 .5 7 9 4 . 16 3 9 . 41 2 9 . 51 1 4 6 .9 4 9 3 . 63 5 3 . 31 3 6 . 281 3 T eachers Sala r y 2 , 4 06 . 72 1 , 1 07 . 19 1 , 2 99 . 53 5 4 . 00 1 , 7 67 . 78 8 5 1 .8 9 9 1 5 .8 9 5 1 . 811 4 VRP Sala r y - - - - - - - - - - - - --- - - - - - - - - -1 5 T eaching- - - - - - - - - - - - --- - - - - - - - - -LearningEquipment1 6 T eachers2 4 2 .7 0 8 5 . 06 1 5 7 .6 4 6 4 . 95 2 8 2 .6 9 8 3 . 79 1 9 8 .9 0 7 0 . 36T r a ining1 7 C om m u n it y1 3 . 37 1 0 . 01 3 . 36 2 5 .1 32 1 . 05 ( + ) 4 . 93 ( + ) 3 0 .5 8M obi lisation1 6 . 12T ot a l 1 4 , 86 4 .6 3 8 , 5 88 . 01 6 , 2 76 . 62 4 2 . 23 1 1 , 51 4 .5 9 6 , 5 62 . 79 4 , 9 51 . 80 4 3 . 00NPEGEL - -- - - - - - - -1 1 9 .0 8 4 8 . 22 2 8 . 82-1 6 7 .3 0KGB V - -- - - - - - - - - - - 4 8 . 10 ( + ) 4 8 . 10 ( + ) 1 0 0 .0 0-GRAND TOTA L 1 4 , 86 4 .6 3 8 , 5 88 . 01 6 , 2 76 . 62 4 2 . 23 1 1 , 68 1 .8 9 6 , 7 29 . 97 4 , 9 51 . 92 4 2 . 39
29Table- 8S l .N o .(Rup ees in lakh )2 0 0 7 -0 8M u r s h i d a b a dS o u t h 2 4 - P a r g a n a sA c t u a l D i f f e r e m c e P e r c e nA c t u a l D i f f e r e m c e P e r c e nA c t i v i t y A p p r o v e d E x p e n E x c e s s ( + ) / t a g e o f A p p r o v e d E x p e n E x c e s s ( + ) / t a g e o fo u t l a y d i t u r e S h o r t f a l l E x c e s s ( + ) / O u t l a y d i t u r e S h o r t f a l l E x c e s s ( + ) /( B - C ) S h o r t f a l l( A - B ) S h o r t f a l l( B : D )( S : C )A B C D E A B C DSSAA1 New School s -- -- -- -- -- -- -- --2 Teachers4 ,652.4 6 2 ,622.3 4 2 ,030.1 2 4 3 .64 2 ,885.6 8 1 ,475.1 8 1 ,410.5 0 4 8 .58Salary3 Teachers1 0 9 .34 1 0 7 .93 1 .41 1 .29 1 1 2 .30 1 0 7 .87 4 .43 3 .94Gra nt4 C i rcle2 4 .83 1 1 .50 1 3 .33 5 3 .69 2 7 .70 5 .35 2 2 .35 8 0 .69Reso u rceC entre5 C l uster1 1 3 .72 2 6 .94 8 6 .78 7 6 .31 1 0 5 .85 2 0 .89 8 4 .96 8 0 .26Reso u rceC entre6 Teachers2 1 4 .63 1 9 8 .64 1 5 .99 7 .45 1 8 6 .59 1 7 0 .45 1 6 .14 8 .65Tra i ning7 I nterventi on s 6 3 5 .24for o ut o fSchool1 9 7 .49 7 3 3 .76 7 8 .79 5 2 3 .44 6 7 6 .77 1 5 4 .92 1 8 .63C hildren8 Remedial2 9 6 .01 3 0 8 .25Teaching9 Fre e Text 2 6 2 .51 2 3 4 .32 2 8 .19 1 0 .74 3 3 9 .05 3 7 7 .80 (+ )3 8 .75 (+ )1 1 .43Book1 0 I nterventi on s 5 7 .30 5 5 .06 2 .24 3 .91 4 7 .94 3 3 .64 1 4 .30 2 9 .83forC WSN(IED)1 1 C i vil Works 7 ,249.4 01 2 Ma jor re pairs 4 0 .307 ,256.5 7 3 3 .13 0 .45 6 ,477.9 5 6 ,457.4 5 2 0 .50 0 .321 3 Teaching1 0 0 .00 -- - 1 0 0 .00 1 0 0 .00 -- - -- - -- - -- -LearningEqui pment1 4 Ma i ntenance 1 6 0 .85 1 5 5 .58 5 .27 3 .28 201.70 2 0 1 .70 -- - -- -Gra nt1 5 School Gra nt 7 3 .64 7 3 .18 0 .46 0 .62 88.96 4 4 .49 4 4 .47 4 9 .991 6 Research & 4 7 .87 2 2 .14 2 5 .73 5 3 .75 5 7 .82 5 .16 5 2 .66 9 1 .08Evalua tion1 7 Ma nagement 4 3 5 .92 2 6 5 .81 1 7 0 .11 3 9 .02 3 8 5 .48 1 5 3 .07 2 3 2 .41 6 0 .29& MI S1 8 I nnovative5 0 .00 -- 5 0 .00 1 0 0 .00 5 0 .00 -- - 5 0 .00 1 0 0 .00Activity1 9 C ommunity1 3 .44 8 .93 4 .51 3 3 .56 1 6 .09 2 9 .91 (+ )1 3 .82 (+ )8 5 .89Tra i ning2 0 SIEMAT -- - -- - -- - -- - -- - -- - -- -- -- -Total 1 4 ,537 .46 1 1 ,236 .43 3 ,301.0 3 2 2 .71 1 1 ,814 .80 9 ,759.7 3 2 ,055.0 7 1 7 .39NPEGEL -- - -- - -- - -- - 9 8 .75 3 3 .39 6 5 .36 6 6 .19K GBV -- - -- - -- - -- - 6 2 .19 -- - 6 2 .19 1 0 0 .00Grand Tota l 1 4 ,537 .46 1 1 ,236 .43 3 ,301.0 3 2 2 .71 1 1 ,975 .74 9 ,793.1 2 2 ,182.6 2 1 8 .23
30Table- 9M ur s hida ba dSout h 24-Pa r g a na sS l.No.A c t ivit y A p p r ove doutla yA c t u a lEx p enD it u r e( u p t oNov. 2 0 0 8 )D ifferemceEx c ess(+)/S h ortfall( B-C)P ercent a g e ofEx c ess(+)/S h ortfall( B:D)A p p r ove dO u t la yA c t u a lEx p enD it u r e( u p t oNov. 2 0 0 8 )D ifferemceEx c ess(+)/S h ortfall( A - B)P ercent a g e ofEx c ess(+)/S h ortfall( A : C )A B C D E A B C DSSA1 New S c h ools- - - - - - - - - - - - - - - -O p ening2 T eachers Sala r y 5 , 3 97 . 03 2 , 3 26 . 00 3 , 0 71 . 03 5 6 . 90 3 , 6 67 . 18 1 , 1 90 . 66 2 , 4 76 . 52 6 7 . 533 T eachers Grant 1 0 6 .5 5 1 0 5 .3 8 1 . 1 7 1 . 1 0 1 0 9 .4 5 4 7 . 68 6 1 . 77 5 6 . 444 Blo c k R esour c e 3 3 . 44 3 1 . 73 1 . 7 1 5 . 1 1 4 0 . 46 1 7 . 20 2 3 . 26 5 7 . 49C entre( BRC/UBRC)5 C luster1 3 7 .5 4 1 0 . 08 1 2 7 .4 6 9 2 . 67 1 3 3 .1 0 4 5 . 91 8 7 . 19 6 5 . 51R esource Centre6 T eachers2 5 5 .7 3 2 5 . 94 2 2 9 .7 9 8 9 . 86 2 6 2 .6 8 4 . 2 1 2 5 8 .4 7 9 8 . 40T r a ining7 Interventions 5 , 0 07 . 71f or out ofS c h ool Childr en2 1 . 99 4 , 9 85 . 72 9 9 . 56 2 , 8 74 . 02 7 6 . 46 2 , 7 97 . 56 9 7 . 348 R emedia l- - - - - - - - - - - - - - - - - - - - - - - -T eaching9 F r ee Text Book 1 , 1 60 . 89 7 7 3 .6 0 3 8 7 .2 9 3 3 . 36 1 , 0 60 . 48 8 2 7 .9 0 2 3 2 .5 8 2 1 . 931 0 Interventions1 5 3 .6 6 5 1 . 61 1 0 2 .0 5 6 6 . 41 1 1 8 .2 6 3 2 . 27 8 5 . 99 7 2 . 71f or CWSN(IED)1 1 C ivi l Works 1 , 0 19 . 95 0 . 1 8 1 , 0 19 . 77 9 9 . 98 4 , 3 78 . 05 8 . 5 0 4 , 3 69 . 55 9 9 . 811 2 F u r n it u r e f or- - - - - - - - - - - - - - - - - - - - - - - -G ovt . U P s1 2 T eaching2 0 2 .5 0 4 6 . 50 1 5 6 .0 0 7 7 . 04 125.00 - - - 1 2 5 .0 0 1 0 0 .0 0LearningEquipment1 4 M a intenan c e2 7 6 .3 0 2 7 5 .5 6 0 . 7 4 0 . 2 7 3 3 4 .6 5 3 3 4 .6 5 - - - - - -G r a n t1 5 S c h ool Grant 1 9 4 .4 6 1 9 4 .4 6 - - - - - - 2 3 8 .9 8 2 3 8 .9 8 - - - - - -1 6 R esearch & 4 4 . 21 1 . 2 2 4 2 . 99 6 . 7 6 5 3 . 54 1 . 0 6 5 2 . 48 9 7 . 22Eva luation1 7 M a na g ement & 5 1 3 .9 9 1 1 0 .2 4 4 0 3 .7 5 7 8 . 55 4 8 0 .8 6 1 0 8 .0 4 3 7 2 .8 2 7 7 . 53Q u a lit y1 8 Innova t ive8 5 . 00 2 . 6 2 8 2 . 38 9 6 . 92 8 5 . 00 8 . 8 2 7 6 . 18 8 9 . 62A c t ivit y1 9 C om m u n it y9 . 7 3 - - 9 . 7 3 1 0 0 .0 0 1 0 . 49 - - - 1 0 . 49 1 0 0 .0 0T r a ining2 0 S t a t eC om p onentT ot a l 1 4 , 59 8 .6 9 3 , 9 77 . 11 1 0 , 62 1 .5 8 7 2 . 76 1 3 , 97 2 .2 0 2 , 9 42 . 34 1 1 , 02 9 .8 6 7 8 . 94NGEPEL 9 8 . 79 1 2 . 02 8 6 . 77 8 7 . 83KGB V 7 5 . 93 1 8 . 90 5 7 . 03 7 5 . 14Gr a nd Total 1 4 , 59 8 .6 9 3 , 9 77 . 11 1 0 , 62 1 .5 8 7 2 . 76 1 4 , 14 6 .9 2 2 , 9 73 . 26 1 1 , 17 3 .6 6 7 8 . 98(Rup ees in lakh )2 0 0 8 -0 9
31From the above tables (6-9), it would be seen that –Murshidabad -Out of the approved overall outlay for the SSAactivities for the years 2005-06, 2006-07, 2007-08 and 2008-09 amountingto Rs.10,311.27 lakh, Rs.14,864.63lakh, Rs.14,537.46 lakh andRs,14,598.69 lakh, the District Authorities could not utilize 63.27percent, 42.23 percent, 22.71 percent and 72.76 percent (upto November2008) representing Rs.6,523.87 lakh, Rs.6,276.62 lakh, Rs.3,301.03 lakhand Rs.10,621.58 lakh (upto November 2008) respectively.South 24 Parganas -Against the approved outlay for the years2005-06, 2006-07 and 2007-08 amounting to Rs.10,616.82 lakh,Rs.11,681.89 lakh and Rs.11,975.74 lakh including NPEGEL and KGBVunder utilisation was to the extent of 56.76 percent, 42.39 percent and18.23 percent representing Rs.6,025.71 lakh, Rs.4,951.92 lakh andRs.2,182.62 lakh respectively. Out of the approved outlay for the year2008-09 amounting to Rs.14,146.92 lakh, the DPO could utilize onlyamount to the extent of Rs.2,973.26 lakh upto November 2008representing only 21.02 per cent achievement.The following further points were noticed :(i) Murshidabad - During 2005-06, out of 16 SSA activities forwhich outlay was sanctioned, under utilization in respect of 4activities (out of school children, Teachers Grant, Teachers Salary /and Teacher Training) was between 52.05 percent and 94.86percent.South 24-Parganas - Out of 16 SSA activities, underutilization in respect of 6 activities (out of School Children,Innovative Activity, Cluster Resource Centre, Teachers Grant,Teachers Salary and Teacher Training) ranged between 55.17 percent and 100.00 percent. There was excess expenditure in respect of
324 activities (Block Resource Centre, Civil Works, Free Text Bookand Community Mobilisation) ranging from 0.37 per cent to 292.29per cent.Short utilization of NPEGEL outlay was to the extent of 88.79 percent.(ii) Murshidabad - During 2006-07, under utilization in respect 5SSA activities (out of school children, Free Text Book, Research &evaluation, Teachers Salary and Teachers Training) was between54.00 percent and 100.00 per cent.South 24-Parganas -During 2006-07, shortfall in expenditurein respect of 5 SSA activities (Cluster Resource Centre, Out ofSchool Children, Research & Evaluation, Teachers Salary andTeachers Training) was to the extent of 51.81 per cent to 100.00 percent.(iii) Murshidabad -During 2007-08, out of 18 SSA activities underutilization of approved outlay in respect of 6 activities (CircleResource Centre. Out of School Children, Remedial Teaching,Teaching Learning Equipment, Research and Evaluation andInnovative Activity) was between 53.69 per cent and 100.00 percent.South 24-Parganass -During 2007-08, the District Authoritiescould not utilize approved outlay to the extent of 60.29 percent to100.00 percent in respect of 5 SSA activities (Cluster ResourceCentre, Circle Resource Centre, Research & Evaluation,Management & MIS and Innovative Activity). Shortfall inexpenditure in respect of NPEGEL and KGBV was to the extent of66.19 per cent and 100.00 per cent.
33(iv) Murshidabad - Utilisation of approved outlay during 2008-09(November, 2008) was to the extent of 27.24 percent only.South 24-Parganas -The District Authorities could utilize theapproved outlay for the SSA activities to the extent of 21.06 percent only in 8 months upto November 2008. The utilization forNPEGEL and KGBV was to the extent of 12.17 percent and 24.86 percent respectively.
342.6 FUND FLOW2.6.1FUNDING NORMS :Preparation of District Elementary Education Plans by eachdistrict, appraisal of Plans and financial outlay by the ProjectAppraisal Board (PAB) precede release of fund by the centre.Government of India (GOI) would release fund in two instalmentsin April and September every year subject to certain conditionswhich, inter-alia, included the following :(a) Written commitment by the State Government regardingmeeting its share of SSA outlay;(b) State Government would release its matching contributionwithin 30 days of release of fund by GOI;(c) State Government would maintain its investment inelementary education at a level not less than that in the year1999-2000 and the State share of SSA would be over andabove this level every year; and(d) Second instalment of GOI grant would only be released afterthe previous instalment together with State share had beensubstantially (at least 50 percent) spent as per financialnorms.
352.6.2 FUNDING PATTERN :SSA envisages contribution from GOI vis-à-vis Governmentof <strong>West</strong> <strong>Bengal</strong> in the ratio of 85:15 for the IX Five Year Planperiod upto 2002, 75:25 during X Five Year Plan period upto 2007.During XI Plan, it would be 65:35 for the first two years, i.e., 2007-08 and 2008-09; 60:40 for the 3 r d year, i.e. 2009-10; 55:45 for the 4 t hyear, i.e. 2010-2011 and 50:50 thereafter from 2011-2012 onwards.As stated at serial No.(c) supra, the State Government wasliable to maintain their level of investment in elementaryeducation as in 1999-2000 and the contribution of State share forSSA would be over and above this investment. Both the GOI andState Government released funds directly to the State Mission(SIS), which in turn transferred the funds to the District ProjectOffices (DPOs). The DPOs transferred funds to the Circle ResourceCentres (CLRCs), Cluster Resource Centres (CRCs) and the SchoolManagement Committees (SMCs)/Village Education Committees(VECs).
362.6.3 LEVEL OF INVESTMENT BY STATE GOVERNMENT INELEMENTARY EDUCATION :The PAB while approving the Annual Work Plan of theMission for the years 2005-06 to 2007-08 directed that theGovernment of <strong>West</strong> <strong>Bengal</strong> should maintain its level ofinvestment in elementary education as in 1999-2000 and give thedetails of this to GOI before the release of second instalment.Thus, state share of SSA fund would constitute an additionality tothe budgetary provision reckoned from the year 1999-2000 as perSSA guidelines.The position in this regard for the years 2005-06 to 2007-08 isdetailed below :YearBudget provision/ActualsIncrease ininvestment over1999-2000(Rs. In crore)State share of SSAfund sincereleased1999-2000 1,350.24 -- --2005-2006 2,176.19 825.95 126.602006-2007 2,453.71 1,103.47 203.562007-2008 N.A. -- 483.62The above table indicates that investment level had beenmaintained over and above the figure of Rs.1,350.24 crore of 1999-2000 during subsequent years for which Financial Accountscontaining budget / actuals were available. It may also beobserved, after taking out the figure of State share of SSA, the
37investment would be less by Rs.699.35 crore and Rs.899.91 crore in2005-2006 and 2006-2007 respectively.Still considerable increase in investment was made by theState Government in the above years over the level of investmentof 1999-2000 even if the State share of SSA fund is taken out.2.6.4 FUNDING PROFILE :As already discussed, no perspective plan was available. Thefunding status of the Mission was based on Annual Work Plan andBudget for the years 2005-2006 to 2007-2008 approved by PAB.Against the sanctioned outlay for the years 2005-2006 to2007-2008, GOI released fund to the tune of 66 percent of itsapproved share while fund released by the State Government was73 percent of its share. Thus, net shortfall in release of fund was tothe extent of 32 percent of the sanctioned outlay.Funding profile from 2005-06 to 2007-08 of the Mission wasas under :(Rupees in crore)Approved outlay Annual fund released Short release of fund byYearGOIshareStateshareTotalGOI toMissionState toMissionTotal GOI State Total<strong>Report</strong>edexpenditureProgressiveunspentbalance lyingwith Missionat the end of2005-06 786.09 262.02 1048.11 334.82 126.60 461.42 451.27 135.42 586.69 477.19 (-)15.772006-07 1080.52 360.18 1440.70 610.67 203.56 814.23 469.85 156.62 626.47 909.39 (-)110.932007-08 918.38 494.51 1412.89 897.05 483.62 1380.67 21.33 10.89 32.22 1013.03 256.71Total 2784.99 1116.71 3901.70 1842.54 813.78 2656.32 942.45 302.93 1245.38 2399.61(i) It emerges from the above that due to persistent underutilisationof fund, GOI share to the extent of approved
38annual outlay was not received in any of the year with theresult that the target set out by the PAB in the Annual WorksPlan and Budget had never been achieved. This is amplyindicative of tardy implementation of the SSA Programme inthe State.(ii) During approval of Annual Works Plan and Budget, PABallowed spill over amount of previous years as shown below:(Rupees in Crore)Y e a rAmount of spill Date of sanctionFromTooverby PAB2004-2005 2005-2006 53.55 13-05-20052005-2006 2006-2007 18.01 04-08-20062006-2007 2007-2008 12.57 22-05-20072007-2008 2008-2009 276.74 16-04-2008iii) For the years 2005-2006 to 2007-2008, fund released by theState Government fell short of the sharing ratio (75:25 for theyears 2005-006 and 2006-2007, and 65:35 for the year 2007-2008) by Rs.302.93 crore.iv) The Mission reported excess expenditure of Rs.15.77 croreand Rs.95.22 crore (Total Rs.110.93 crore) over the fundreceived from the Central / State Government respectivelyduring 2005-2006 and 006-2007. Even spill over amountallowed by PAB did not cover the excess expenditurereported.v) Wide variation in figure reported by SPO and that certifiedby the Chartered Accountant (CA):
39Availability of fund and expenditure thereof asreported (by SPO) differ widely from the figure certified (byCA) for the period 2005-2006 and 2006-2007 (while thecertified figure for 2007-2008 was not available till31-12-2008) as would be evident from the following :(Rupees in Crore)2005-2006 2006-2007Particula rsAs per SPO As per CA As per SPO As per CAInflowFund released by:GOI 334.82 314.86 610.67 630.62GOWB 126.60 126.61 203.56 203.56Total 461.42 441.46 814.23 834.18Unspen t balance fr omPrevious years--- 155.22 --- 126.88Bank inter est earned --- 11.07 --- 5.93Misc. Receipts --- --- --- 0.42Total inflow 461.42 607.75 814.23 967.41Outflow 477.19 480.88 909.39 923.05Balance (-)15.77 126.87 (-) 95.16 44.36(a) One instalment (last) of Rs.19.96 crore released and creditedby GOI on 30/31 March 2006 (2005-2006) was included in2006-07 of UC instead of 2005-06.(b) Difference of Rs.1.00 lakh between SPO record and UC of CAin respect of GOWB occurred due to rounding off in 2005-06.(c) Staggered and delayed release of fund (some instalmentseven released at the fag end of March) coupled with lowutilization led to accumulation of fund over the years.Lacuna in reporting / monitoring system resulted incontinuance of such variances in figure.(d) The utilization certificate issued by the CA for the year 2007-08 (as made available to the Study Team in the month of
40December 2008) depicted a Govt. of <strong>West</strong> <strong>Bengal</strong> (GOWB)release of SSA fund (for 2007-2008) as per Rs.2.04 crore andRs.18.13 crore which did not appear in the SPO’s record(furnished to Study Team) as release against PAB approvedbudget for 2007-2008. On verification of records it wasrevealed that the amounts in question were refund againstdiversion of fund made to state plan scheme from SSA fundpertaining to the years 2002-2003 and 2004-2005 respectively.However, the Study Team did not feel it appropriate toaccount for the same as release against PAB approved budgetof 2007-2008 since the amounts were not included in thebudget for 2007-2008 before approval. It is was not found onrecord whether approval of PAB had been taken to accountfor the amounts as spill over.(vi) According to the financing pattern of SSA, Rs.2,784.99 croreand Rs.1,116.71 crore were required to be released by GOIand GOWB respectively as per the Annual Works Plan andBudget of Rs.3,901.70 crore for the years 2005-2006 to 2007-2008. As against this, GOI and State Government releasedRs.1,842.54 crore and Rs.813.78 crore indicating a shortfall ofRs.942.45 crore and Rs.302.93 crore respectively. Shortrelease of fund by the State Government and the consequentcurtailment of the GOI share led to less availability of fundsto the extent of Rs.1,245.38 crore which adversely affectedthe implementation of SSA Programme in the State.(vii) Non-availability of fund as per budget provision in theAnnual Works Plan and Budget coupled with poor utilization
41led to accumulation of huge unspent balances at the end ofeach financial year (2005-06 to 2007-08).2.6.5 Year-wise position of unspent balances for the year 2005-06to 2007-08 was as under :YearUnspent balanceof last yearUnspent balanceof current year(Rupees in crore)Total unspentbalance2005-06 --- (-)15.77 (-)15.772006-07 (-)15.77 (-)95.16 (-)110.932007-08 (-)110.93 367.64 256.712.7 DELAY IN FLOW OF FUNDS :2.7.1 Delay in release of fund by GOI/State Government to SSAMission.The extent of delay in release of fund by GOI and StateGovernment of their respective share to the Mission is reflected inthe table below :
42Table 11Year/Date ofsanctionAmount(Rs.in crore)GOI share State Govt. Share DelaysDate ofreceipt byMissionYear/DateofSanctionAmount(Rs. Incrore)Date ofreceipt byMissionA to B (Day)From date ofsanction byGOI to date ofreceipt byMissionB to D(Day)From date ofreceipt of GOIshare to date ofreceipt of StateshareA B C D A to B B to D2005-200614-06-2005 304.86 05-07-2005 30-06-2005 15.00 15-07-2005 1019-10-2005 101.62 14-11-2005 13213-03-2006 10.00 28-03-2006 28-03-2006 3.33 31-03-2006 15 0330-03-2006 19.96 31-03-2006 28-03-2006 6.65 31-03-2006 01 0Total 334.82 126.602006-200724-05-2006 120.41 23-06-2006 27-07-2006 40.14 08-08-2006 30 4619-09-2006 150.00 13-10-2006 31-10-2006 50.00 22-11-2006 24 4014-11-2006 165.26 01-12-2006 21-12-2006 55.09 12-01-2007 17 4228-02-2007 175.00 08-02-2007 02-03-2007 58.33 13-03-2007 0 33Total 610.67 203.562007-200801-05-2007 200.00 05-06-2007 18-06-2007 100.00 25-06-2007 35 2001-08-2007 129.20 24-09-2007 18-06-2007 100.00 02-08-2007 34 13105-10-2007 108.66 27-11-2007 04-10-2007 129.19 15-10-2007 53 (-)4309-01-2008 200.00 29-01-2008 12-03-2008 14.27 31-03-2008 20 6208-02-2008 259.19 29-02-2008 27-03-2008 139.56 31-03-2008 11 3128-03-2008 0.60 31-03-2008 31Total 897.05 483.62The following position emerges from the above table :(i)In terms of Para 88.1 of MFM&P, GOI was to release fundsonce in April and again in September each year. However,funds were released during 2005-2006 to 2007-2008 in threeto five instalments.Year No. of instalments Date of Receipt by SPO2005-2006 3 instalments 05-07-2005; 28-03-2006 and 31-03-20062006-2007 4 instalments 23-06-2006; 13-10-2006; 01-12-2006 and 08-02-20072007-2008 5 instalments 05-06-2007; 24-08-2007; 27-11-2007; 29-01-2008and 29-02-2008
43Instalments received at the fag end of March could notbe utilized in the year of receipt / release.(ii) As per Para 89.2 of MFM&P, State Government share was tobe released within 30 days of the receipt of the Central share.But the SSA Mission did not receive state share in 9 out of 14cases during the above three yearswithin the stipulatedtime. Delay in release of instalments pertaining to StateGovernment ranged from 1 day to 132 days of receipt ofCentral share.(iii) 2 n d and 4 t h instalments pertaining to State Government sharefor 2007-2008 were received after 131 days and 62 daysrespectively after the receipt of funds from GOI.(iv) During the financial year 2005-2006, 2 n d instalment of StateGovernment share was received by the Mission after 132days from the date of receipt of funds from GOI.(v) During 2005-2006 and 2007-2008 funds were released by GOI/ GOWB in the last week of March and as such these fundswere not available for purposeful utilization within the sameyears.(vi) 3 r d instalment of 2005-2006 pertaining to GOI share and 3 r dand 4 t h instalments of 2005-2006 and 4 t h and 5 t h & 6 t hinstalments of 2007-2008 in respect of State share werereceived on 31 s t March of the respective financial years.
44(vii) Delayed and short release of State Government fund as perSSA sharing arrangements on the part of GOWB came in theway of successful implementation of the Programme.2.7.2 FUND FLOW FROM SIS (SPO) TO DISTRICTSThe position is shown below :Table 12(Rupees in crore)Receipt of fund fromTime takenRelease of fundYear GOI GOWB(Day)Date Amount Date Amount2005-2006 05-07-2005 304.86 06-04-2005 1.54 615-07-2005 15.00 07-04-2005 15.00 714-11-2005 101.62 13-04-2005 29.00 1328-03-2006 10.00 02-05-2005 1.00 3231-03-2006 3.33 03-05-2005 2.00 3331-03-2006 19.96 29-06-2005 17.00 9031-03-2006 6.65 01-07-2005 1.13 9309-08-2005 109.00 3519-09-2005 150.55 7620-09-2005 0.52 7726-10-2005 1.02 11302-12-2005 90.64 1817-12-2005 3.93 3520-01-2006 15.00 6702-03-2006 7.00 10820-03-2006 5.00 12628-03-2006 10.15 1342006-2007 23-06-2006 120.41 15-05-2006 19.00 4508-08-2006 40.14 27-06-2006 72.00 0413-10-2006 150.00 10-07-2006 16.00 1722-11-2006 50.00 17-07-2006 15.00 2201-12-2006 165.26 30-08-2006 23.00 3612-01-2007 55.09 05-10-2006 10.00 10408-02-2007 175.00 09-11-2006 101.50 2713-03-2007 58.33 13-12-2006 190.00 1217-01-2007 60.00 4712-02-2007 25.00 3108-03-2007 153.00 2813-03-2007 35.00 3319-03-2007 23.00 3928-03-2007 12.50 482007-2008 05-06-2007 200.00 09-07-2007 294.00 34
4525-06-2007 100.00 11-09-2007 99.00 4002-08-2007 100.00 12-10-2007 80.00 7824-09-2007 129.19 13-11-2007 176.00 2915-10-2007 129.19 11-12-2007 83.00 1427-11-2007 108.66 12-02-2008 237.00 1427-01-2008 200.00 14-03-2008 268.69 1429-02-2008 259.19 31-03-2008 77.95 3131-03-2008 154.43 31-03-2008 --- ---(i)According to Para 89.3 of MFM&P, State ImplementationSociety (SIS) was required to release funds to the districtswithin 15 days from date of receipt from the GOI and StateGovernment. It was, however, seen, barring a very few cases,grants were not released within the stipulated period of 15days.Delay in receipt of grants ranged between 2 days(10-07-2006) and 119 days (28-03-2006) in no fewer than 27instalments during 2005-2006 to 2007-2008. Thus, thestipulated period was adhered to only in 4 cases.(ii)Since progress of implementation is, inter alia, dependent ontimely and full release of funds to the functionaries, theaspect of fund flow needs much closer monitoring by theauthorities concerned.
462.7.3 Rush of Expenditure in MarchThe extent of funds released by the SIS to districts in themonth of March in the respective years was as follows :(2005-2006) March 2006 Rs. 22.15 crore(2006-2007) March 2007 Rs.223.50 crore(2007-2008) March 2008 Rs.346.65 croreIt was revealed that during 2007-2008, 26.35 per cent(Rs.346.65 crore) of the total released of funds (Rs.1315.65 crore) tothe different districts was made by the SIS in the month of March2008 and 29.60 per cent (Rs.223.50 crore) of the total released fund(Rs.755.00 crore) to the districts during 2006-2007 was made by theSIS in the month of March 2007. Consequently, sizeable amountremained unutilized at the end of the financial year. The release offunds at the fag end of the year did not serve the intendedpurpose.2.7.4 BANK BALANCES HELD BY SPODue to low level of release and utilization of funds asmentioned in Paragraphs 2.6.4(VI) of this report, huge balancesremained unutilized with the State Project Office. Year wiseposition of balance at Bank at the end of the financial year during2005-2006 to 2007-2008 is given below :
47Year endingAmount (Rupees in crore)31 s t March, 2006 23.4131 s t March, 2007 3.9031 s t March, 2008 101.302.7.5 ACCUMULATED UNSPENT BALANCES WITH DISTRICTS:Table below indicates the total fund available at thebeginning of the year 2005-2006, total receipts and paymentsduring 2005-2006 to 2007-2008 and the unspent balances at the endof the year 2007-2008 in respect of each of the 20 districts.
48Table 13(Rupees in lakh)SlNo.Name of distric tsOpeningbala ncea s on 01-0 4 -0 5Fundreceivedfrom SPOa ndinte rnalgenerationduring0 5 -0 6 to0 7 -0 8Tota l funda vaila bleE x penditureduring 0 5 -0 6 to0 7 -0 8Unspenta ccumula te dbala nce as on3 1 -0 3 -0 8% of unspentbala nce totota l funda vaila ble1 Bankura 3 2 0 .23 1 5 2 23 .39 1 5 5 43 .62 1 3 8 00 .45 1 7 4 3 .1 7 1 1 .212 Birbhum 3 2 7 .86 1 1 3 31 .03 1 1 6 58 .89 1 0 3 95 .65 1 2 6 3 .2 4 1 0 .833 Bardhaman 1 1 5 2 .2 5 1 7 0 09 .90 1 8 1 62 .15 1 6 2 70 .51 1 8 9 1 .6 1 1 0 .424 C ooch Be har 2 1 7 .78 1 1 2 44 .87 1 1 4 62 .65 1 0 9 35 .14 3 2 7 .51 7 .605 DGHC 2 0 3 .80 9 0 3 .05 1 1 0 6 .1 3 2 8 8 .62 8 1 7 .51 7 3 .906 Dakshin Dinajpu r 1 5 9 .61 7 5 7 2 .4 7 7 7 3 2 .0 8 5 5 3 9 .8 1 2 1 9 2 .2 7 2 8 .357 K ol a kta 7 8 1 .51 4 6 7 4 .5 9 5 4 5 6 .1 0 4 1 2 9 .1 4 1 3 2 6 .9 6 2 4 .328 Ja l paiguri 2 9 5 .72 1 2 9 22 .19 1 3 2 17 .91 1 0 7 31 .23 2 4 8 6 .6 8 1 8 .819 Ma l dah 8 7 2 .30 1 3 5 28 .26 1 4 4 00 .56 1 2 5 85 .57 1 8 1 4 .9 9 1 2 .601 0 Mu rshidabad 4 2 .39 2 6 5 55 .39 2 6 5 97 .78 2 3 5 02 .76 3 0 9 5 .0 2 1 1 .631 1 Nadia 1 7 0 8 .0 5 2 0 1 63 .34 2 1 8 71 .39 1 9 9 59 .23 1 9 1 2 .1 6 8 .741 2 North 24 Pa rganas 2 0 4 4 .7 4 2 0 4 41 .16 2 2 4 85 .60 2 0 6 07 .24 1 8 7 8 .3 6 8 .351 3 Pu rul i a 3 8 9 .36 8 9 9 2 .5 2 9 3 8 1 .8 8 7 3 9 1 .5 5 1 9 9 0 .3 3 2 1 .211 4 Pu rba Medinipur 1 3 1 2 .3 2 1 2 3 81 .21 1 3 6 93 .53 1 0 9 28 .15 2 7 6 5 .3 8 2 0 .191 5 Pa schim Medinipu r 7 4 8 .98 1 4 1 57 .60 1 4 6 06 .58 1 2 5 51 .71 2 0 5 4 .8 7 1 4 .061 6 Siliguri 1 8 7 .64 3 6 2 1 .9 9 3 8 0 9 .6 3 3 4 5 4 .2 3 3 5 5 .40 9 .321 7 South 24 Pa r ganas 3 6 .83 2 1 8 73 .96 2 1 9 10 .79 2 0 9 76 .15 9 3 4 .64 4 .261 8 Uttar Dinajpu r 6 5 2 .15 8 3 4 0 .5 1 8 9 9 2 .6 6 7 2 7 0 .4 1 1 7 2 2 .2 3 1 9 .151 9 Howra h 4 8 9 .03 1 1 3 21 .98 1 1 8 11 .01 1 0 6 77 .88 1 1 3 6 .1 3 9 .612 0 Hoo ghly 5 6 0 .04 1 2 2 93 .88 1 2 8 53 .92 1 1 9 58 .19 8 9 5 .73 6 .961 2 2 01 .57 2 5 4 55 6 .29 2 6 6 75 7 .86 2 3 3 95 3 .61 3 2 8 04 .24 1 2 .20NPEGEL 3 4 1 .36 2 3 0 9 .3 6 2 6 5 0 .7 2 2 3 1 1 .1 2 3 3 9 ./1 0 1 2 .79K GBV NIL 1 7 3 4 .4 4 1 7 3 4 .4 4 1 4 7 3 .8 4 2 6 0 .60 1 5 .02GRAND TOTAL 1 2 5 42 .93 2 5 8 60 0 .09 2 7 1 14 3 .02 2 3 7 73 8 .57 3 3 4 03 .94 1 2 .31Source: Audited accounts for the years 2005-2006 to 2007-2008.
49It emerges from the above table that :(a) accumulated unspent balance as on 31 s t March, 2008 lying in20 districts was Rs.33,403.94 lakh (SSA : Rs.32,804.2 lakh;NPEGEL : Rs.339.10 lakh and KGBV : Rs.260.60 lakh)representing 12.31 per cent (SSA : 12.29 per cent; NPEGEL :12.79 per cent and KGBV : 15.02 per cent) of the total fundavailable upto 2007-08 (SSA : Rs.266,757.86 lakh; NPEGEL :Rs.2,650.72 lakh and KGBV : Rs.1,734.44 lakh).(b) accumulated unspent balance as on 31 s t March, 2008 wasparticularly heavy in DGHC representing 73.90 percent ofthe fund available. Other districts having substantialbalances were Dakshin Dinajpur : 28.35 per cent; Kolkata :24.32 percent; Jalpaiguri : 18.81 per cent; Purulia : 21.21 percent, Purba Medinipur : 20.19 per cent and Uttar Dinajpur :19.15 per cent.(c) of the total unspent balance ofRs.33,403.94 lakh, Rs.33,396.88lakh was in various banks and Rs.7.06 lakh in cash.(d) The huge accumulation of unspent balances over the years(2005-06 to 2007-08) is indicative of low utilization andpointer to tardy implementation of SSA programmes with theresult of non-fulfilment of the objectives of UEE. During thelast 3 years from 2005-06 to 2007-08, SSA Mission, <strong>West</strong><strong>Bengal</strong>, could achieve only 57.08 percent of the approvedoutlay/target (of activities) as would be evident from thefollowing :Cash and Bank balance held at SPORs.10130.59 lakh
50Cash and Bank Balance held at districtsRs.32804.24Total balance held (SSA) Rs.42934.83 lakh *Total expenditure = (Total fund received bySPO – unspent balance held)= 2656.32 crore (para …..)(-) 429.35 crore *2226.97Total outlay = 3901.70 crore (para )Achievement = 57.08%
512.7.6 FLOW OF FUND FROM SIS TO SELECTED DISTRICTSAND SELECTED DISTRICTS TO CLRCS / SMCS / VECS /WECTable 14(A)DISTRICT : MURSHIDABAD(Rs. In cr ore)Fund received by SISfr om GOI and GOWBFund received byMurshida badDistr ictFund received by Kandi and Sadar <strong>West</strong> CLRC a ndCLRC to SMCS/VECSKandiSadar <strong>West</strong>Date Amoun t Date Amoun t Date Amoun t Date Amoun t2005-06 07-04-05 4.00 222705-07-05 304.86 07-04-05 0.22 instalmen ts 0.253 instalmen ts 0.3215-07-05 15.00 07-07-05 0.05 betweenbetween14-11-05 101.62 11-08-05 9.00 10-05-0505-05-05 to28-03-06 10.00 19-09-05 17.43 to 28-04-0617-04-0631-03-06 19.96 31-10-05 0.2231-03-06 3.33 03-12-05 9.4631-03-06 6.65 20-12-05 0.35461.42 40.73 0.253 0.322006-0723-06-06 120.41 04-07-06 8.002.112.9108-08-06 40.14 18-07-06 2.00303013-10-06 150.00 03-11-06 3.50 instalmen tsinstalmen ts22-11-06 50.00 15-12-06 25.00 betweenbetween01-12-06 165.26 17-01-07 15.00 31-05-06 to01-06-06 to12-01-07 55.09 07-03-07 25.00 10-04-0724-04-0708-02-07 175.00 27-03-07 4.0013-03-07 58.33814.23 82.50 2.11 2.912007-0805-06-07 200.00 02-07-07 28.9225-06-07 100.00 06-09-07 10.00 262.56 262.3602-08-07 100.00 15-11-07 20.00 instalmen tsinstalmen ts24-09-07 129.20 05-02-08 40.00 betweenbetween15-10-07 129.19 10-03-08 31.36 03-07-07 to23-05-07 to27-11-07 108.66 31-03-08 10.00 03-04-0824-07-0829-01-08 200.0029-02-08 259.1931-03-08 153.831380.07 140.28 2.56 2.36
52(B)DISTRICT : SOUTH 24 PARGANAS(Rs. In cr ore)Fund received by SIS fr om GOIand GOWBFund received bySouth 24-ParganasFund receive by CLPC a ndCLRC to SMC/VEC/WECDate Amoun t Date Amoun t2005-06 1818-04-05 5.00 instalmen ts 0.261007-07-05 1.00 between17-08-05 6.00 17-05-0504-10-05 22.751 to 31-03-0606-12-05 10.03301-02-06 2.00046.784 0.2610Position sh own in the la st page(Page No.Mur shida bad)2006-070.162425-05-06 2.501603-07-06 7.00 instalmen ts01-09-06 3.50 between09-11-06 4.00 11-11-06 to20-12-06 22.00 12-10-0724-01-07 10.0012-03-07 15.0064.00 0.16242007-0805-07-07 22.56 100.3212-10-07 20.00 instalmen ts13-11-07 15.00 between10-12-07 8.00 06-09-07 to06-02-08 22.00 24-04-0812-03-08 18.3207-04-08 10.50116.38 0.32(i)It was observed that SIS took at least 19 days to 118 days inreleasing instalments to the selected districts (Murshidabadand 24 Parganas-South) in the year 2005-06. Time taken bythe DPOs (Murshidabad/South 24 Parganas) to release fundsto CLRCs/SMc/VECs ranged between ……28 and 221 days.(ii) The delay in receiving fund by DPOs (District Murshidabadand South 24 Parganas) during 2006-07 (beyond 15 days as
53per MFM&P) ranged between 4 to 39 days. DistrictsMurshidabad/South 24 Parganas delayed release between 13to 214 days.(iii) The delay on the part of the SPO in 2007-08 in releasingfunds to the selected districts (received by the districts)ranged between 3 to 70 days (excluding permissible 15 daysas per MFM&P). Delay in releasing fund by DPOsMurshidabad/South 24 Parganas to the functionaries rangedbetween o1 to 79 days.(iv) SPO was releasing funds to the districts Project Offices onlump sum basis without indicating the activity for which thefunds pertained. The district were however, releasing fundsactivity wise. Funds received from SPO were being releasedby the districts to CLRCs and others in a number ofinstalments.(v)Funds released by SPO/DPOs to the end users/functionariesin the last week of the years sometimes at the end of theyear or even in the following years which did not serve theintended purpose as the work could not be started/executedwithin the financial year.
542.7.7 BANK BALANCES HELD BY THE SELECTED DISTRICTSAs a result of low level of release of fund by the districts(Murshidabad & South 24-Parganas) to the functionaries, andconsequential low utilization vis-à-vis tardy implementation ofSSA activities sizeable balances remained unutilized with thedistrict Project Offices. Year wise position of balance at Bank atthe end of the financial years during 2005-06 and 2007-08 is givenbelow:-Year ending31 s t March, 2006(2005-06)31 s t March, 2007(2006-07)31 s t March, 2008(2007-08)District Murshidabad District South 24 ParganasAmount (Rs. In crore) Amount (Rs. In crore)3.76 1.380.99 1.2730.95 9.342.8 UTILIZATION CERTIFICATES (UC)2.8.1 (i) In terms of para 101.14 of the MFM&P, the StateImplementation Society (SIS) is required to furnish UC to theGOI in the prescribed, format duly authenticated by aChartered Accountant (CA) along with the Annual Statementof Accounts.Utilisation Certificate (UC) is required to be furnishedto the requirement of Central/State Government within 9months of the close of the financial year as per para 101.16ibid.
55Examinations revealed that while UC for the year 2005-06 was submitted to GOI duly authenticated by CA withinthe stipulated time of 9 months, UC for the year 2006-07 wasafter 11 months (28-02-2008) from theclose claim of the financial year 2006-07.UC for the year 2007-08 was not finalized andauthenticated by CA till date.2.8.2 UTILISATION CERTIFICATES FROM DISTRICTS :(ii) In terms of para 93 of the MFM&P advances (funds releasedto the functionaries) referred to in paras 72.1 and 13.1 ibidwould be treated as expenditure for the purpose of reportingprovided details of such advances were kept in the formatgiven in Annexure-X of the Manual. However, the advanceswould continue to remain as advances in the books ofaccounts till utilization certificates/expenditure statementswere received and adjusted in the books of accounts.Scrutiny revealed the huge amount was lyingunadjusted over the years for non-submission/want of UCsfrom concerned functionaries. It was further revealed thatoutstanding civil advances alone constituted Rs.751.08 crore(approx. cumulative) upto the end of the financial year 2006-07.2.8.3 Reasons for discrepencis noticed between figuresincorporated in the districts accounts and that exhibited inthe Ucs issued by CA were not recorded. However this maybe attributed to (i) districrts account being prepared and
56audited earlier than the issue of Ucs and adjustment carriedout subsequently were left out of districts accounts and (ii)non-maintenance of seprate cash book/ accounts in most ofthe schools having NPEGEL Centres and KGBV and clubbingof the accounts of the latter with SSA accounts.2.9 Diversion of SSA FundAs per provision under <strong>Sarva</strong> Siksha <strong>Abhiyan</strong> (SSA) no fundcould be diverted from SSA to any other Programme/ Scheme.However, it was noticed from records that the DistrictMagistrate, Hooghly, ex-officio District Project Director borrowedRs.5 crore in March 2008 (Rs.4 crore) and April 2008 (Rs.1 crore)from SSA fund to make payment of wages at Gram PanchayatLevel under the National Rural Employment Guarantee Scheme(NREG). This was a clear case of diversion of SSA fund. Theamount was, however, refunded in June, 2008.2.10 PRE-PROJECT ACTIVITIESThe SSA Programme was launched in 2000-01. The StateGovernment launched the programme in November 2001. With a view toachieving the objectives of SSA, GOI commenced pre-project activitiesbefore implementing the programme. GOI released funds aggregatingRs.290.15 lakh separately to the State Society at the beginning of theSSA Programme to carry out preparatory activities for micro-planning,household surveys, studies, community mobilization, school-basedactivities, office equipment, training and orientation at all level.Separate accounts for pre-project activities were to be maintained by
57theSociety and unutilized balance together with interest accruedthereon to be refunded to GOI after completion of pre project activities.The position showing sanction and release of fund by GOI,receipt of fund by the Society and disbursement thereof to districts is asgiven below :(Rupees in lakh)YearDate ofsa nctionPu rp o se ofsa nction2 0 0 0 -0 1 1 0 -1 0 -0 0Pr e-p r oject 2000-0 1 Non-DPE Pdistri cts f or PEa nd UPE2 0 0 1 -0 2 1 8 -0 1 -0 2 Pr e-p r oject 2001-0 2 for D PEPphase -I dist ri cts1 8 -0 1 -0 2 Pr e-p r oject 2001-0 2 for K ol kata PEa nd UPE2 2 -0 3 -0 2 Pr e-p r oject 2001-0 2 for D PEPPhase -II dist ri ctsAmountsa nctionedDate ofreceipt bysociet y1 3 2 .00 0 4 -1 2 -0 0Date ofreleasetodistri cts1 4 -1 2 -0 0To1 5 0 93 0 027 5 .01 3 0 -0 7 -0 2 2 6 -0 3 -0 2To1 1 -1 0 -0 21 4 .69 3 0 -0 7 -0 2 Aug ust,2 0 0 26 8 .45 2 2 -0 7 -0 2 2 6 -0 8 -0 2To0 1 -1 1 -0 2Amountrelease dNumbe rofdistri cts1 3 3 .00 * 97 5 .01 51 4 .69 16 8 .45 5Tota l 2 9 0 .15 2 9 0 .15 2 0*Rupe es 1 lakh was released in excess f rom oth er fu n d.The following points emerge from the above table :(i)Rupees 158.15 lakh comprising the last three instalments of fundsthough sanctioned in January 2002 (Rs.89.70 lakh) and March 2002(Rs.68.45 lakh) was released in July 2002, even thoughimplemention of the SSA Programme commenced in the State inNovember, 2001.(ii) Though a grant of Rs.132.00 lakh was received for the non-DPEPdistricts, Rs.133.00 lakh was disbursed to these districts. Rupees1.00 lakh being [money] an excess of approved amount wasreleased to the Bardhaman District for the Kalna Book Fair.
58The Society did not maintain separate accounts for pre-projectactivities. Records showing implementation, monitoring andsupervision of activities were not made available.The position showing funds disbursed to districts, utilizationof funds by districts, refund of unspent balance and payment ofinterest to GOI as available from records, was as under :Table 15(Rupees in lakh)Sl.No.Name of Dist ri ctsFundrelease dExpenditurerep o rtedRefund o funspentbalance toGOIPa yment o fi ntere st t oGOZIRemark sNon-DPEP distric ts 1 3 3 .00 1 1 8 .30 5 .38 NIL1 Hoo ghly 1 6 .82 1 6 .82 NIL NA Ful l utilisa tion2 Nadia 1 6 .20 1 2 .39 3 .81 NIL I ntere st paya ble3 Siliguri 5 .00 5 .00 NIL NA4 Pa schim Medinipu r 1 7 .32 1 6 .63 0 .69 NILFul l utilisa tion5 Pu rba Medinipur 7 .00 7 .00 NIL NA Ful l utilisa tion6 Howra h 1 6 .32 1 6 .32 NIL NA Ful l utilisa tion7 Bardhaman 2 4 .82 2 3 .94 0 .88 NIL I ntere st paya ble8 North 24 Pa rganas 2 0 .20 2 0 .00 NIL NIL Ful l utilisa tion9 Darjeeling G or khaHill Council (DGHC)9 .32 NIL NIL Pri ncipal andI ntere st Pa ya bleDPEP Phase -I Dist ri ct 7 5 .01 4 3 .42 3 1 .59 1 .271 0 Birbhum 1 3 .79 1 3 .79 NIL NA Ful l utilisa tion1 1 Mu rshidabad 1 5 .48 7 .84 7 .64 1 .001 2 C ooch Be har 1 3 .29 4 .71 8 .58 0 .231 3 South 24 Pa r ganas 1 7 .65 1 7 .08 0 .57 0 .041 4 Bankura 1 4 .80 NIL 1 4 .80 NIL I ntere st paya bleDPEP Phase -II Dist ri cts 6 8 .45 2 8 .56 3 9 .89 2 .151 5 Pu rul i a 1 3 .41 1 3 .41 NIL NA Ful l utilisa tion1 6 Ma l dah 1 4 .41 NIL 1 4 .41 2 .091 7 Uttar Dinajpu r 1 3 .21 3 .31 9 .90 NIL I ntere st paya ble1 8 Ja l p[a i gu ri 1 3 .77 1 1 .84 1 .93 0 .061 9 Dakshin Dinajpu r 1 3 .65 NIL 1 3 .65 NIL I ntere st pa ua bleK ol kata – PE and UPE 1 4 .69 1 .69 1 3 .00 0 .212 0 K ol a kta 1 4 .69 1 .69 1 3 .00 0 .21GRAND TOTAL 2 9 1 .15 1 9 1 .97 8 9 .86 3 .63NA = Not ApplicableThe following facts emerges from the above table :(a)of the 20 educational districts, only seven districts (Hooghly,Siliguri, Purba Medinipur, Howrah, North 24 Parganas, Birbhumand Purulia) reported full utilization of funds released (Rs.92.54lakh).
59(b) Nine districts (Nadia, Paschim Medinipur, bardhaman,Murshidabad, Cooch Behar, Uttar Dinajpur, Jalpaiguri and Kolkata)to which Rs.146.43 lakh was disbursed, reported utilization ofRs.99.43 lakh representing 67.90 percent of amount disbursed. Theunutilized amount of Rs.47.00 lakh was refunded to GOI.(c)Three districts (Bankura, Maldah and Dakshin Dinajpur) to whichRs.42.86 lakh was released did not utilize the grant at all for thepurpose of pre-project activities, reasons for which was not onrecord. According to Census 2001, literacy rates in male and femalepopulation in these districts were 63.8 and 49.8, 50.7 and 41.7, and64.5 and 55.1 percent respectively.The entire amount was refunded to GOI.(d) DGHC did neither furnish utilization certificates for Rs.9.32 lakhremitted to it in 2000-01 nor refund the amount along with interesttill date (December, 2008).(e)Interest on unspent balance received from six districts aggregatingRs.3.63 lakh was remitted to GOI during October 2006 and October2008. Interest was not realized for remittance to GOI in respect of 7districts which had unspent balances. The SPD reported (Otober2008) to GOI that due to non-maintenance of separate bank accountfor pre-project activities by some districts the amount of interestcould not be ascertained.The above shows lack of monitoring and supervision onactivities undertaken / were to be undertaken by districts as wellas inadequate financial management and control on the part ofState Mission.CHAPTER-3
60MAINTENANCE OF ACCOUNTS AND AUDIT3.1 ACCOUNTS :Para 101 of MFM & P provides that the sis was responsiblefor maintenance of proper accounts and other relevantrecords as well as preparation of annual accounts comprisingthe receipts and payments accounts andstatement ofliabilities in such a form as may be prescribed by theregistrar of Societies of the State Government in keepingwith the rules in force under the Societies Registration Act,1860 (21 of 1860) subject to the condition that in respect ofgrants from the Central Government, the directions of theCentral Government shall be adhered to. The SPD is to causethe annual accounts of the Society to be preparedimmediately after the close of the financial year and afterapproval by the Executive Committee, shall have theaccounts audited annually by a firm of CharteredAccountants appointed with the approval of ExecutiveCommittee by April every year. The Chartered Accountantshall make available the Audit <strong>Report</strong> by 30 September. Para101.10 of MFM & P provides that audited accounts shall becommunicated to the Executive Committee which shallsubmit a copy of the audit report along with its observationsto the State Government within 15 days of receipt thereof.The State Government shall place these documents before theState Legislature.Para 103 of MFM & P further provided that the Annual <strong>Report</strong> on theworking of the Society and the work undertaken by it during the year
61together with consolidated Annual Financial Statement in format givenin Annex-XVIII, Balance Sheet in Annex-XIX, Income and ExpenditureAccounts in Annex-XX, Receipt and Payment Accounts in Annex-XXIand audited accounts shall be approved by the Executive Committeeand furnished to the GOI and State Government and the members of theSociety. A copy of the Annual <strong>Report</strong> along with audited accounts of theSociety and the Auditors <strong>Report</strong> thereon shall be placed before theGoverning Body at its Annual General Meeting. The Annual <strong>Report</strong>along with the audited accounts of the Society and the Audit <strong>Report</strong>shall be furnished to GOI within 9 months of the close of the financialyear for being placed before the Parliament.The position showing the engagement of Chartered Accounts,submission of Auditors <strong>Report</strong>, approval of audited accounts by EC,approval of Annual <strong>Report</strong> by GC and submission of Annual <strong>Report</strong> andaudited accounts to GOI was as given below.a) Date of appointment ofcharacters of Accountantsb) Date of submissionof Auditors <strong>Report</strong>Due date 2005-06 2006-07 2007-08 2008-09April 19-05-06 07-09-0711-10-07September 27.10.06 08.12.06&22.02.0802.06.08 Not done15.10.08 Nilc) Date of Approval by EC November 20.11.06 10.04.08 Not Done Niltill dated) Date of submission ofNot placed Not placed Not placed NilAnnual <strong>Report</strong> to G.Ce) Date of dispatch of Annual<strong>Report</strong> to GOIDecember 29.12.06 31.12.07 Not Sent NilExcepting the year 2005-06, there had been delays at each stage during 2006-07and 2007-08. Annual <strong>Report</strong>s and audited accounts were not placed before G.C.in any of the years, since AGM of GC was last held in April 2005.
62Further, it was seen that the Annual <strong>Report</strong> and the audited accounts for theyear ending 31 st March 2007 were placed before the EC on 10.04.2008 long afterthese were sent to GOI on 31-12-2007 and again on 17-03-2008.3.2 Persistent comments and observations of Chartered AccountantsPersistent comments and observations of Chartered Accounts on thebasis of their examination of books of accounts and records were asfollows :(i)Uniform accounting heads as prescribed in the Manual were notfollowed by most of the districts. As a results, clubbing of certainexpenditure had been done for the purpose of consolidation.(ii)In most of the districts, civil advances disbursed to schools andothers were recorded separately in the current year (2007-08). Butsince no such details of school-wise records for earlier years weremaintained, school-wise outstanding position of such advancescould not be ascertained in many districts.(iii)Maintenance of utilization certificate register by the district was notproper and as such, UCs received during the period under auditwere taken into consideration for adjustment of civil advances.(iv)In many districts TDS was not deducted properly and deposited intime.(v)Certain clusters/circles maintained the books of accounts underSingle Entry System. Many clusters/circles did not reconcile bankbalance with balance as per cash book.(vi)The internal control procedure including preparation of monthlybank reconciliation statement, trial balance, recording andadjustment of advances and collection of UCs required improvementin some of the districts.
63(vii)In SSM, Darjeeling Gorkha Hill Council, defalcation of fundamounting to Rs.5,14,50,000.00 took place in 2004-05. The matter wassub-judice. The Bank Account (No.C/4-641) with Darjeeling DistrictCentral Co-operative Bank Ltd., Darjeeling Branch remainedinoperative since then.Besides the above, the following further observations were made by theChartered Accountants on the accounts for the year ending 31 March 2008 :(a) Some of the districts did not follow the procedure set for procurement ofassets and consumables.(b) A few districts did not incur expenditure as per budget allocation.(c) Many clusters/circles did not incur expenditure as per specificationgiven by districts.(d) In some districts, advances other than civil advance remainedoutstanding for a considerable period without proper follow-up forrecovery.(e) In some districts, fixed assets registers were not being maintainedproperly.3.3 DEFICIENCIES NOTICED BY STUDY TEAM :The following further deficiencies in maintenance of accounts recordsand preparation of annual accounts were noticed by the Study Team.(i) Formats prescribed in the Manual for preparation of consolidatedBalance Sheet, consolidated Income and Expenditure Account andConsolidated Receipts and Payments Accounts envisaged that thefinancial statements and the accounts in respect of various programmesof SSA, NPEGEL as well as KGBV were to be presented in consolidatedform. The State Mission, however, prepared Balance Sheets, Income andExpenditure Accounts and Receipts and Payments Accounts of SSA,
64NPEGEL and KGBV separately without consolidating the same in onefinancial statement and Accounts.(ii) As per the format for Income and Expenditure Account as in Annexure-XX, funds received from GOI and State Government as well as interestand balances at districts were to be taken as ‘Income’ and expenditureon various interventions to be booked as ‘Expenditure’. However, in theconsolidated Income and Expenditure Accounts for the years ending 31March 2006, 2007 and 2008, expenditure against various interventions(excluding expenditure for civil works) was charged against ‘Interest’and ‘Other Miscellaneous Income’ which were only treated as ‘Income’.Funds released by GOI and State Government were treated CapitalReceipts and credited to ‘Capital Fund’. During the years 2005-06, 2006-07 and 2007-08, ‘Bank Interest’ and ‘Misc. Income’ of Rs.1066.61 lakh,Rs.639.16 lakh and Rs.954.65 lakh respectively were credited to Incomeand Expenditure Accounts for SSA and expenditure on differentinterventions amounting to Rs.23114.97 lakh, Rs.3692.05 lakh andRs.40,104.32 lakh respectively were charged to the accounts whichresulted ‘Excess of Expenditure over Income’ in respective years.Had the grants intended for revenue expenditure been taken to Incomeand Expenditure Accounts, the accounts would have exhibited Excess ofIncome over Expenditure.(iii) Though Para 103.1 of MFM & P required that the Balance Sheet, theReceipt and Payment Account and Income and Expenditure Accountshall be prepared in the prescribed format incorporating the current aswell as the previous years figures, the Balance Sheet and Accountsprepared by the SPO in tabular form did not incorporate the previous
65year’s figures. As a result, current year’s figures could not be comparedwith those of the previous year.(iv) Para 101.13 of Manual ibid requires that a schedule of fixed assets heldby the Society at the end of the financial year shall be appended to theAnnual Statement of Accounts but such Schedule was not prepared andappended to accounts.(v) The State Mission continued to release funds since inception to variousagencies, viz, PBRSSM WBBSE, etc. (Vide Chapter – Para ………) but didnot monitor or verify the end result to ascertain the transparency in theiraccounts. PBRSSM received Rs.29.73 crore in 2005-06 and Rs.5.82 crore in2007-08 from the State Mission for construction of SSK buildings, butdebited the amounts in their Income and Expenditure Accounts of therespective years. The State Mission charged this expenditure under thehead “Project Management”. Expenditure of Rs.35.55 crore (Rs.29.73crore plus Rs.5.82 crore) which should have been booked as ‘CapitalExpenditure’ was treated as ‘Revenue Expenditure’ thereby leaving noscope to verify the location and existence of assets of SSA.(vi) Para 62 of MFM & P provides that the Society should maintain Registerof Assets in the format prescribed for assets acquired wholly orsubstantially out of Government of India grants and Stock Registerseparately for capital goods, consumable and non-consumable articlesand arrange for their physical verification at least once a year. Theseshould be maintained at School, CRC, BRC, DPO and SPO level. Registerof fixed assets and stock register for capital goods were not maintainedat any level. In absence of above register and physical verificationreports, existence, location and value of individual fixed assets andcapital goods was not ascertainable.
66(vii) The Mission did not charge depreciation on fixed assets at applicablerates in pursuance of mercantile system of accounts.(viii) Funds released by GOI and State Government were being deposited insavings accounts of banks and the unspent balances at each levelremained in the savings accounts. Substantial amounts of interest were,thus, being earned on balances lying in banks. Interest so earned wasbeing treated as miscellaneous income and was being added to creditbalance. The functionaries were spending this amount of interest inaddition grants received from GOI and State Government. No specificinstruction appeared as having been issued regarding the specificpurposes for which interest earned was to be utilized or whether thesame was to be adjusted against future budgetary release. Since separatefund was released for each intervention, the functionaries should nothave utilized interest thus earned. The amounts of interest earned by theState Society in respect of SSA accounts were Rs.1,066.60 lakh in 2005-06,Rs.620.15 lakh in 2006-07 and Rs.734.82 lakh in 2007-08.(ix) Discrepancies were noticed between the figures of previous years’closing balances of current liabilities and provisions and the next year’sopening balances of the SSA Accounts as given below(Rupees in Lakh)Year Opening balance Closing Balance Difference2005-06 36,14,87,879.002006-07 20,34,92,260.00 11,03,29,751.57 15,79,95,619.002007-08 5,01,72,443.00 14,56,40,419.41 6,01,57,308.57(x) There were discrepancies between the bank balances as per cash booksof SSA in the State Project Office and those as shown in the BalanceSheets of SSA in respect of the State Project Office as given below :
67(xi)(Rupees)Year Bank Account Closing Balance DifferenceAs per cash book As per BalanceSheet2005-06 CD-100689 with BankofIndia / SB 1980 withCanara Bank2006-07 CD-100689 with BankofIndia /SB 1980 withCanara Bank2007-08 CD-100689 with BankofIndia /SB 1980 withCanara Bank21,29,19,083.142,11,61,451.0023,40,80,534.14 23,40,84,194.14 3,660.003,39,40,586.6351,36,783.003,90,77,369.63 3,90,81,029.63 3,660.0077,47,10,180.6123,82,96,792.001,01,30,06,972.61 1,01,30,10,632.613,660.00(xii) The closing balances of cash in hand and cash at Bank as appeared in theReceipts and Payments accounts and the Balance Sheet of SSA at the endof March 2008 did not include balances lying with the CLRCs and theVEC/WEC/school as was evident from test-check of records of threeCLRCs and schools. Rupees 52.01 lakh remaining at bank accounts of 2CLRCs and 8 VEC/Schools as on 31 March 2008 were not included in theclosing balance at Bank in accounts, SIS evidently due to depictionthereof in the accounts as expenditure during the year.3.4 TREATMENT OF ADVANCE :As laid down in the Manual, the funds released by the SIS to the districtsand Sub-District i.e. CLRC level were initially to be classified asadvances and the same were to be indicated as such in the books ofaccounts and these were to be adjusted based on the utilizationcertificates/expenditure statement received in the SIS of having spent thefunds. The advances, which have not been actually spent should havebeen shown as advances in the Balance Sheet as current assets and not asexpenditure. But the funds released from District units of SIS, <strong>West</strong>
68<strong>Bengal</strong> to CLRCS and school level were shown as expenditure in Incomeand Expenditure of the districts and ultimately in that of SPO, thoughnot utilized in full violating the provision of Manual.As a result of the above accounting treatment of advances, the currentassets representing the unutilized balance lying in Bank accounts ofCLRCS and schools, were understated and excess of expenditure overincome overstated in District Accounts.3.5 NON ASCERTAINMENT OF VALUE OF COMPLETED ASSETS :A sum of Rs.1,45,860.33 lakh was spent upto 30 September, 2008 on CivilWorks. Though 707 NSB, 46,797 ACRs, 209 CLRCs, 356 CRCs, 7149D.W., 7577 toilets, 2483 girls toilets, 266 boundary walls were shown ascompleted, the value of assets created out of Rs.1,45,860.33 lakh wasneither ascertained by SPO/DPOS/CLRCs nor any initiative was taken tolocate the existence of such assets.Maintenance of books, accounts and registersThe position showing the maintenance of books, accounts and registersas were required to be maintained in terms of Para 50 of MEFMAP by S.P.O.and the selected districts of Murshidabad and South 24 Parganas was as under:S.P.O.DPO,DPO,Murshidabad South 24 -Parganas(a) Cash Book Maintained Maintained Maintained(b) Ledger Maintained Maintained Maintained(c) Journal Not Maintained Not Maintained Not Maintained(d) Register for Journal/Magazines/ NewspapersNot Maintained Not Maintained Not Maintained(e) Register of temporaryAdvanceNot Maintained Not Maintained Not Maintained(f) Register of money ordersand bank Drafts received.Not Maintained Not Maintained Not Maintained(g) Cheque Issue Register Not Maintained Not Maintained Not Maintained(h) Register of Remittancespaid into BankNot Maintained Not Maintained Not Maintained(i) Bank pass book Maintained Maintained Maintained(j) Register of money ordersand bank drafts Not Maintained Not Maintained Not Maintaineddispatched
69(k) Bill Register Not Maintained Not Maintained Not Maintained(l) Establishment Register Not Maintained Not Maintained Not Maintained(m) Stock Register Maintained Maintained Maintained(n) Capital Goodsi. Non-Consumable articles Not Maintained Maintained Maintainedii. Consumable articles Not Maintained -DO- Not Maintainediii. Register of works Not Maintained Not Maintained Not Maintained(o) Register of grants ofadvances to mobilizingagencies / NGO/Voluntary agencies(p)Fixed assets register(q)Resister of Investments(r) Classification accounts ofprojects(s) Monthly Accounts ofReceipts and Payments(t) Temporary AdvanceRegisterNot Maintained Not Maintained Not MaintainedNot MaintainedNot MaintainedNot MaintainedNot MaintainedMaintainedimproperlyMaintainedimproperlyMaintainedimproperlyMaintainedimproperlyMaintained improperlyMaintained improperlyMaintained improperlyMaintained improperlyNot Maintainedi. Staff Not Maintained Not Maintained Not Maintainedii. Contractors / SuppliersNot Maintained Not Maintained Not Maintained/VECiii. TA/ DA advance Maintained Maintained Maintained(u) Despatch Register Maintained Maintained MaintainedThe above showed that neither the SPO nor the DPOs listedby the Study Team maintained all accounting records as wererequired to be maintained.Para 62 of Manual ibid provided for maintenance ofRegister of assets in respect of assets acquired wholly orsubstantially out of G01 grants and stock Registers separately forcapital goods, consumable and non-consumable articles at School,CRC, BRC, DPO and SPO level and physical verification thereofat least one in a year. Register of assets and also registers ofcapital goods, consumable and non-consumables were notmaintained either I SPO, 3 CHRCs and 56 schools visited by theStudy Team.Further, barring a few upper Primary Schools, none of 56schools visited maintained a cash book in proper form.3.6 CASH BOOK :
70SPO, Salt Lake AND DPOs, Murshidabad and South 24 Parganas hadmaintained two cash Books for two Bank Accounts operated by them.One Cash Book was maintained in ordinary bound register at both SPOand district Offices. One District Office (Murshidabad) did not recordany page counting certificate of pages contained in the Cash Book underdated signature of DPO / DDO with rubber stamp before opening thesame for recording transactions. Contents of the cash box had not beencounted physically daily or once in a month nor only surprised check ofcash balance was exercised by the HOD / DDO/ Officer-in-charge northe certificate to the effect that “cash balance verified by me and foundto be Rs. ----------------------- (Rupees ------------------------------------------------)on actual count was recorded on the cash book under his/her datedsignature with seal both in SPO / District Offices. Blank pages of the cashbooks of SPO / DPOs were not cancelled under dated signature of theHead of the Office with seal. Each and every entry in the receipt andpayment side of the cash book were not attested by the HOD / DDO insupport of their authenticity for the years 2006-07 & 2007-08 of SPO(Murshidabad & South 24 Parganas) for the years from 2005-06 to 2007-08. “No transaction / No entry” certificate was not noted in the CashBook on a day on which was transaction took place and the balancecarried over to the next day was not attested by the Head of Office /DDO during years for 2006-07 & 2007-08 for SPO and for Districts from2005-06 to 2007-08.3.7 Maintenance of accounts records at schoolsVisit by the Study Team in 56 schools in Murshidabad and South 24Parganas districts disclosed the following position :
711. As per the provision of MFM & P, the double entry method ofaccounting based on mercantile system shall be followed under SSA.The schools visited did not keep accounts under double entry system.Most of the schools did not maintain a cash book in proper form. Noneof the schools had an idea of an asset register. Not a single schoolprepared a Receipt and Payment Account for a particular year.2. One single bank accounts was opened in the name of individual VEC /WEC having more than one schools under its jurisdiction. As anindividual school did not have a separate bank account, it was difficultfor the school to transact transactions in respect of fund allotted to it aswell as keep accounts thereof.3. Funds released to schools for specific purposes were depleted due bankcharges deducted by Nationalised Banks. On test-check of 10 schools, it wasnoticed that Rs.15,056.00 had been deducted by bank on account of bankcharges.4. Stock registers for articles and TLM were not maintained in schools.5. The members of the VEC/ WEC did not have training / guidelines inrespect of school management and keeping books of accounts.6. Vouchers in support of expenditure incurred were kept by schools inloose form.7. The schools were to exhibit inter-alia grant received and expenditure incurredin a year in the display boards for the sake of transparency. None of 56 schoolsvisited displayed the financial position.
728. Most of the schools visited had vague idea regarding the Deed of Land /property belonging to schools. None could show the title deeds to the StudyTeam.Maintenance of AccountsMaintenance and repair of school building :Cumulative expenditure of Rs.763.76 lakh incurred onmaintenance and repair of Primary and Upper Primary Schoolbuildings upto 30 t h September, 2008 was not segregated yearwiseduring the period prior to 2005-06 to 2007-08 for debiting it underthe repair in the Income & Expenditure Account.Selected Districts :It was noticed that in the accounts of the districts, theentire maintenance grants received during the period from 2005-06 to 2007-08 (vide para chapter ) were debited toIncome and Expenditure Accounts for the respective years insteadof ascertaining the actual expenditure incurred towards repairand debiting it to Income and Expenditure Account. For example,a sum of Rs.182 lakh was debited to Income and ExpenditureAccount for the year 2006-07 under the head “Maintenance grant”instead of debiting actual expenditure of Rs.0.60 lakh incurredtowards repair of 10 Primacy Schools Buildings.Similarly Rs.219.80 lakh on account of maintenance grantwas debited in the Income and Expenditure Account of South 24
73Parganas District in the year 2006-07 instead of debiting actualexpenditure of Rs.5.55 lakh incurred in 2006-07 for repair of 78school building in the Income Expenditure Account for the year2006-07 under the head maintenance and repair.3.7 SCHOOL ACCOUNTINGa) Jibanti Primary School received Rs.1,70,000.00 on 29-01-07 andRs.1,85,000.00 on 31-03-08 from Kandi CLRC, Murshidabad District forconstruction of two additional classrooms and the amounts were lyingat VEC level without any utilization till date (December, 2008) due tonon-approval of the new VEC formed on 19-08-08. Those amounts wereshown in the District accounts as expenditure.b) As per Receipts and Payments Account of Purenderpur High Madrasa(upper primary) under Kandi CLRC Murshidabad District, all fundsreceived from CLRC were shown as expenditure during 2007-08although a sum of Rs.37,836 including Rs.2500.00 being school grant waslying unspent as on 31-03-08.c) In Khidderpur Primary School of Murshidabad District, out of schoolgrant of Rs.4,000/- received for the years 2007-08 and 2008-09 at the rateof Rs.2000 per year, a sum of Rs.1000.00 in each year was kept unspentfor Book Bank of the school as per advice of Kandi CLRC thoughutilization certificate) was furnished for the full amount of school grantreceived.
74d) Rs.40,000.00 being computer grant for 2005-06 was not taken byDiamond Harbour Municipality for school under the Municipality andthe amount was lying at CLRC level till date (January 2009).e) School grant, maintenance grant and TLM grant for Rs.8500.00disbursed to Kali Sankarpur F. P. School on 16/2/07 and that forRs.10,000.00 to Diamond Harbour Girls Jr. Basic School disbursed on16/9/07 respectively refunded by the schools on 31-03-08 and the samewere lying in the Bank A/C of Diamond Harbour (South) CLRC till date(January 2009). Though the amounts were shown as having been spentduring 2007-08.f) Dhanberia Free Primary School of South 24 Parganas District could notvouchers Rs.3,37,250.00 due to transfer of Head teacher. School grantproduce (Rs.5,000.00), Maintenance grant (Rs.7,500.00) and ACR grant(Rs.1,85,000.00) received on 15-11-07 and 03-04-08 respectively were notexpended till date (January, 2009) due to non formation of new WEC.g) Sukanta Smriti Primary school of South 24 Parganas utilized forRs.1,515.00 on 31.01.07 from school grant for the purpose of Middaymeals and Rs.1,000.00 on 23.10.08 for District Sports from school grantwhich. Rs.1,85,000.00 received on 30-04-08 for ACR was not admissible(January 2009).h) Cash Books in Upper Primary Schools were being closed monthlyinstead of daily. Each entry in the Cash Book was not being attested bythe DDO / Secretary in terms of para 77.7 of MFMP.i) Physical verification of cash in hand was not conducted even for a dayupper Primary School level in terms of Para 78 of MFMP.
75j) No Bank reconciliation was done by any of the schools/VECs/WECvisited by the Team.3.8 STAFFING STRUCTURE OF ACCOUNTS WING :The State Project Office was having one Controller of Finance, One FinanceAnd Accounts Officer, four Accountants, one Cashier-cum-Accountant, OneAudit Officer and one Project Management Information Service, Finance, inposition in the Accounts Department. In the District Project Offices,Murshidabad and South 24 Parganas, there were one Finance Officer, oneAccountant and one Cashier in position in each district. In the Accounts Cell ofSPO, all the officials were engaged either in deputation or on contract basis. Allthe officials of DPO, Murshidabad and DPO, South 24 parganas, werepreviously of DPEP and were working both for DPEP and SSA. Some of theofficials of SPO were having accounting background. However, orientationtraining of official on accounting stipulated in Para 84.1 of the Manual, was notimparted. At the CLRCs and school level, there were no qualified accountants.3.9 AUDIT BY COMPROLLER AND AUDITOR GENERAL OF INDIAIn terms of Para 102 of MFM & P, the accounts of the State Society was subjectto the provisions of Comptroller and Auditor General of India (Duties, Powerand Conditions of Device) as amended from time to time. Accordingly, oneperformance audit on SSA activities for the years 2001 to 2005 was conducted(December 2005 to February 2006) by the representatives of the Comptrollerand Auditor General of India and the report was sent to Government / SISinJune 2006 by the Principal Accountant General (Audit), <strong>West</strong> <strong>Bengal</strong>. Reply tothe audit observations was not furnished by the State Mission / Government(December 2008).
763.10 INTERNAL AUDIT :In terms of para 100 of MFP&P, the State Society shouldintroduce proper internal audit system and strengthen internalchecks and the in-house internal audit system to ensure properutilization of funds approved/received from Government.In accordance with the provisions of MFM&P, a separate InternalAudit Wing came into being at the SPO from July 2007 with one AuditOfficer belonging to the <strong>West</strong> <strong>Bengal</strong> Audit and Accounts Departmentand one Assistant Audit Officer on contractual basis. Till May 2008, theTeam conducted internal audit of accounts, procurement procedure,fund utilization, status of UC collection in selected schools, CLRCs,DPOs in seven out of twenty educational districts. The Internal AuditWing developed separate internal audit modules for use duringinternal audit and reporting.The position of internal audit was as given below:Name of unit Numbe r of unit Audit completed (NO) Period coveredSPO 1 1 2007-08DPO 20 7 2006-08CLRC 713 23 2006-2008VEC/SMS 45,209 24 2006-2008The above table disclosed a negligible coverage under internalaudit. Audit was not done after May 2008. In July 2008, a process toappoint a firm Chartered Accountant as Internal Auditors was initiated.The appointment was not done till December 2008. Hence, the aspect ofinternal control through Internal Audit remained unattended in theState Mission since inception.The reports of Internal Auditors had never been placed before theExecutive Committee though required vide para 100.10
773.11 Study by IPALIPAL conducted a ‘Study on Monitoring the Financial Aspectsrelating to <strong>Sarva</strong> <strong>Shiksha</strong> <strong>Abhiyan</strong> in <strong>West</strong> <strong>Bengal</strong>’ pertaining to theperiod 2002-03 to 2004-05 and submitted the <strong>Report</strong> to GOI/stateGovernment in August 2005. Compliance to the observationsincorporated in the <strong>Report</strong> was not made available to the Study Team.
78CHAPTER-4SCHOOLS, TEACHERS, STUDENTS, EDUCATION GUARANTEESCHEME, ALTERNATIVE AND INNOVATIVE EDUCATIONETC.4.1 SCHOOLSAccording to the Annual <strong>Report</strong> of PBRPSUS for the year2004-2005, the number of Government Primary and upperPrimary Schools in the state was 50,255 and 11,440 withenrolment of 76,22,983 and 52,47,509 students respectively.Following new Upper Primary Schools were approved to be openedby the PAB :Approved b y PAB Annual Target Cumula ti ve Tota l Targe tAWP&B 2007-2 0 0 8 1 ,600 1 ,600AWP&B 2008-2 0 0 9 3 ,300 4 ,900Against the annual target for 2007-2008, 186 newschools were opened (September 2008). New Upper PrimarySchools approved by PAB for 2008-2009 are yet to be opened(December, 2008).As per the AWP&B for the year 2008-2009, total numberof Government Primary and Upper Primary Schools as on 31 s tMarch 2008 was 49,965 and 9,446 respectively with enrolmentof 66,04,355 and 56,72,929 respectively.
794.2 As per para 1.19.10 of the ‘Framework for Implementation ofTable 16SSA’ there should be one Primary School for every twoUpper Primary Schools. As against this 2:1 ratio, the statehad a wide gap of upper Primary Schools ranging from15,352 in 2005-06 to 15,537 in 2007-08 as shown below :YearActua l numb erof P ri marySchool sNumbe r ofUppe r Pri marySchool s requi reda s pe r 2:1 ra tioActua l numb erof Upp erPri ma ry School sGap of Up pe rPri ma ry School s(3 -4 )(1 ) (2 ) (3 ) (4 ) (5 )2 0 0 5 -2 00 6 5 0 ,255 2 5 ,128 1 1 ,440 1 3 ,6882 0 0 6 -2 00 7 4 9 ,898 2 4 ,949 9 ,382 1 5 ,5672 0 0 7 -2 00 8 4 9 ,965 2 4 ,983 9 ,446 1 5 ,537Source : AWP&B for the years 2006-2007 to 2008-2009The above table indicates the wide gap betweenPrimary and Upper Primary Schools registering an increaseof 11.90 per cent in 2007-2008 over 2005-2006.4.3 SCHOOLEES HABITATIONS :As per GIS Mapping, out of 45,195 villages in theStates, 969 villages having more than 1,000 population hadno primary school/SSK. In Murshidabad and South 24-Parganas districts 80 and 112 such villages were withoutschooling facilities.4.4 DISTANCE OF SCHOOLS FROM HABITATIONS :As per norms for interventions under SSA,schools/alternative schooling facilities should be within onekilometer of every habitation. [But records of the DistrictOffice/CLRC/Schools disclose that there were…………
80primary and upper primary schools where most of thestudents used to come from a distance of kilometers].School Efficiency Study (2008) conducted by theMission covering 2,461 primary School scattered over 17Educational Districts revealed that 1.82 per cent of the childpopulation were not enrolled in schools due to nonavailabilityof upper Primary Schools within 3 kilometres.Further, in meeting held on 16 April, 2008 PAB commentedout of 1.27 lakh habitations, only 28,000 habitations had aupper Primary School within 3 kilometres which representednearly 30 percent coverage.4.6 INFRASTRUCTURE FACILITY IN GOVERNMENTPRIMARY SCHOOLSThe infrastructure facilities in the Government PrimarySchools during the years 2005-2006 to 2007-2008 were as under :YearOneteacherschoolsTwoteacherschoolsBuildinglessschoolsNo. of oneroomschoolsNo. of tworoomschools2005-2006 3,023 17,255 288 8,871 13,6162006-2007 1,859 13,992 129 6,815 13,5622007-2008 1,697 NA NA NA NASource : AWP&B for 2006-07 to 2008-094.7 DRINKING WATER AND TOILET FACILITY INGOVERNMENT PRIMARY AND UPPER PRIMARYSCHOOLS :The position showing drinking and toilet facilities inGovernment Primary and Upper Primary Schools during 2005-2006top 2007-2008 was as given below :
81YearTable 17No.of school shaving DWfa cilityPri ma ry Uppe rPri ma ryNo.of school s nothaving DWfa cilityPri ma ry Uppe rPri ma ryNo.of school shaving toi l etsPri ma ryUppe rPri ma ryNo.of school s nothaving toi l etsPri ma ryUppe rPri ma ryNo.of school s nothaving sepa ra tetoi l et Girl sPri ma ry Uppe rPri ma ry2 0 0 5 -0 6 4 2 ,638 1 0 ,947 7 ,617 4 9 3 3 4 ,128 7 ,701 1 6 ,127 3 ,739 NA NA2 0 0 6 -0 7 4 3 ,464 8 ,980 6 ,285 3 8 2 3 9 ,556 8 ,845 1 0 ,342 5 3 7 NA NA2 0 0 7 -0 8 4 3 ,316 9 ,268 5 ,145 1 7 8 4 3 ,530 6 ,435 5 ,971 3 4 5 2 8 ,146 8 8 1Source: AWP&B f or the years 2006 -0 7 to 2008-0 9On analysis of the above, it would be evident that during2007-08 drinking water, toilet and separate toilet for girls werenot provided to 10.30 per cent primary, 1.88 percent upperprimary schools, 11.95 percent primary and 3.65 percent and 9.33percent upper primary schools.Further, there were 42,499 primary and 1,804upperprimary schools in the State during 2007-08 without electricityrepresenting 85.06 percent and 19.10 of total Govt. schools inexistence.Selected districts :Murshidabad - During 2007-08, 5.70 per cent, 8.51 percentand 62.41 per cent Primary Government schools did not havedrinking water, toilet and separate toilet facility for girls, 12.67per cent upper primary schools did not have separate toilet forgirls.South 24-Parganas- During 2007-08, 6.30 per cent, 14.18 percent and 6.11 per cent Government primary schools did not havedrinking water, toilet and separate toilet for girls. Further, 2.39per cent and 7.43 per cent of upper primary school did not havedrinking water and separate toilet for girls.
824.8 STUDENTS :4.8.1 Primary EducationThe population of children in the age group 5+ to 8+ withoverall enrolment in each year during the period from 2005-06 to2007-08 was as given below :Table 18Year Popula t ion Tota le nrolmentNete nrolmentGERNERThosele ft ou t(percent)E nrolmentina lte rnati veschools2 0 0 5 -0 6 9 4 ,41,6 5 6 1 ,10,21 ,585 9 2 ,55,7 0 7 1 1 6 .73 9 8 .03 1 9 .92 1 4 ,99,4 9 52 0 0 6 -0 7 8 7 ,14,6 6 6 9 9 ,35,8 1 2 8 1 ,31,0 4 3 1 1 4 .01 9 3 ,30 1 5 .56 1 5 ,61,6 4 32 0 0 7 -0 8 8 4 ,25,7 7 1 9 7 ,78,2 5 5 8 3 ,06,5 0 8 1 1 6 .05 9 8 .58 1 5 .64 1 5 ,59,9 4 3Source: AWP&B for the years 2006-07 to 2008-094.8.2 UPPER PRIMARY EDUCATIONYearThe year-wise population of children in the age group9+ to 13+ with overall enrolment in Upper Primary Schoolsduring 2005-06 to 2007-2008 was as given below :Table 19ChildrenPopula t ionTota le nrolmentNete nrolmentGERNERThosele ft ou t(percent)E nrolmentina lte rnati veschools2 0 0 5 -0 6 9 1 ,65,1 8 1 7 6 ,69,4 1 8 7 2 ,16,6 0 8 8 3 .68 7 8 .74 2 9 .70 2 ,09,36 02 0 0 6 -0 7 8 1 ,45,8 6 9 7 7 ,31,4 1 2 7 3 ,71,8 9 1 9 4 .91 9 0 .50 NA 2 ,85,00 62 0 0 7 -0 8 8 0 ,46,9 2 3 7 1 ,17,9 4 6 6 2 ,43,0 8 4 8 8 .46 7 7 .98 3 1 3 ,42,09 7Source : AW&B for the years 2006-07 to 2008-09The above tables disclosed that with gradual decreasein child population in the 5+ to 9+ age group from 94,41,656to 84,25,771 in 2007-08, overall net enrolment of studentsdecreased from 92,55,707 to 83,06,508 in the correspondingyears. However, the NER which was 98.03 in 2005-06declined sharply to 93.30 in 2006-07 and then increased to
8398.58 in 2007-08. Further, the percentage of left out childrenvaried between 19.92 in 15.64 in 2007-08.The percentage of GER and NER in respect of upperprimary education was 83.68 and 78.74 in 2005-2006. The ratioimproved significantly to 94.91 per cent and 90.50 per cent in2006-2007 and then decreased to 88.46 percent and 77.58 per centin 2007-2008. The left out rate also increased from 29.70 per centin 2005-2006 to 31.00 per cent in 2007-2008.4.9 TEACHERS4.9.1 Teachers in PositionThere were 1,52,503 teachers in position in PrimarySchools run by Government / District Primary School Counciland 79,620 teachers in position in Government upperPrimary Schools during 2007-08. besides, 25,781 and 3,825para teachers were in position in Primary and Upper PrimarySchools during the year.4.9.2 Posting of TeachersFinancial norms of SSA for the intervention Teachersprovided for one teacher for every 40 students in the primary andthe Upper Primary Schools. At least two teachers in a PrimarySchool and one teacher for every class in the Upper PrimarySchool was also prescribed therein. The following position was,however, noticed by the Study Team in Government Primary andupper Primary Schools of the state as a whole and in the selecteddistricts of Murshidabad and South 24-Parganas.
84Position of teachers in relation to number of studentsenrolled in Government school during 2007-2008:Table 20Numbe r ofstud entsenrol l ed inGovernme ntSchool sRequi rednumbe r ofteachersa s pe rnorm(1 :40)Teacherplusreg ul a rI n posi tionPa rateacherTotalPu pil teacherRatio (PTR )Teacherplusreg ul a rTeacheri ncludingparateacher<strong>West</strong> <strong>Bengal</strong>Pri ma ry 6 6 ,04,3 5 5 1 ,65,10 9 1 ,52,50 3 2 0 ,527 1 ,73,03 0 4 3 ,301 3 8 .16:1Uppe r Pri mary 5 6 ,72,9 2 9 1 ,41,82 3 7 9 ,620 3 3 ,825 1 ,13,44 5 7 1 2 5 :1 5 0 .00:1Murshidabad Distr ictPri ma ry 6 ,24,38 4 1 5 ,610 1 0 ,595 3 ,461 1 4 ,056 5 8 .93:1 4 4 .42:1Uppe r Pri mary 4 ,62,88 8 1 1 ,572 3 ,979 3 ,276 7 ,255 1 1 6 .33 :1 6 3 .80:1South 24-ParganasPri ma ry 6 ,12,09 1 1 5 ,302 1 1 ,550 1 ,615 1 3 ,165 5 2 .99:1 4 6 .49:1Uppe r Pri mary 4 ,86,95 0 1 2 ,174 6 ,342 2 ,383 8 ,725 7 6 .78:1 5 5 .81:1Source : AWP&B for the year 2008-2009The above table showed that though the overall. PTR inrespect of Primary Education in the State as a whole waswithin norm prescribed for SSA (38.16:1), the ratio in respectof Murshidabad and South 24 Parganas was 44.49:1 and55.81:1, much higher than the stipulated norm. PTR inrespect of Upper Primary Education remained much higherthe norm in the State (50.00:1) and in Murshidabad (63.80:1)and South 24 Paganas (55.81:1).4.9.3 Sanction and recruitment of teachers and para teachersunder SSAUpto 2005-06, PAB approved 73,135 teachers (Regular:10,344 and Para: 62,791). During 2006-07, PAB approved14,201 regular teachers for upper primary schools. PABapproved 4,800 regular teacher for new upper primaryschools in 2007-08 and 9,900 regular teachers or new Ups and2.900 VRPs in 2008-09.
85The position showing targets and achievement in recruitmentof teachers upto September, 2008 is given below :PrimaryTarget Achie vement ShortfallRegul a r 1 0 ,344 Nil 1 0 ,344Pa ra 2 5 ,781 2 1 ,562 4 ,219Upper PrimaryRegul a r 1 4 ,201 1 0 ,157 4 ,044Regul a r for new school s 1 4 ,700 Nil 1 4 ,700Pa ra 3 7 ,010 3 3 ,451 3 ,559VRP 2 ,900 3 ,000 (+ )1 0 0Delay in recruitment of regular teachers was attributedto a Court case on recruitment of such teachers. Thoughthere was no restriction on engagement of para teachers,7,778 para teachers were not engaged (September 2008).4.9.5 Financial targets vis-à-vis achievementsThe financial targets and achievement in respect of teacherssalary there against as per audited accounts during the last fouryears upto 2008-09 (September 2008) was as under :Target Achie vement Shortfall Percenta ge of Achie vement(Rup ees in lakh )2 0 0 5 -2 00 6 3 5 ,138 .68 3 ,457.9 2 3 1 ,680 .76 9 .842 0 0 6 -2 00 7 2 1 ,786 .49 1 0 ,674 .07 1 1 ,112 .42 4 8 .992 0 0 7 -2 00 8 3 7 ,845 .70 2 1 ,035 .93 1 6 ,809 .77 5 5 .582 0 0 8 -2 00 9 4 4 ,285 .60 *10,685.6 1 2 7 ,475 .83 2 4 .13(Se ptemb er,2 0 0 8 )* Pr ovisional4.9.6 Position of trained and untrained teachersThe position of trained and untrained teachersincluding para teacher in Government primary and upperprimary schools as on 31 s t March 2007 was as given below.
86Table 21ParticularsTotal member ofteachers includingpara teachersin positionNumber of Trainedteachers includingpara teacher(B – D )No. of untrainedteachers includingpara teachersA B C DPrimary EducationState 1,75,535 1,58,683 16,952Murshidabad District 14,626 14,626 NilSouth 24 Parganas District 13,383 13,365 18Upper Primary EducationState 1,04,482 98,866 5,616Murshidabad District 7,206 7,205 1South 24 Parganas District 8,710 8,706 4Source : AWPDB for the Year2007 -08The above table indicates 16952 Primary Teacher and5616 upper Primary Teacher remained untrained as on 31 s tMarch 2007.The position of trained and untrained Teachers(including para Teacher) as on 31 s t March 2008 was notavailable.4.10 Teachers Training and its impact :Teachers Training is provided to teachers ofGovernment Schools, Government Aided Schools,Cantonment and Municipal Corporation Schools, aidedMadrasas as per norm stipulated in para 32 of MFM&P. Inorder to fully orient the teachers in the goal philosophy ofUEE/SSA and to constantly upgrade their knowledge andskills, regular training has to be provided to all the teachers.The state Mission developed a continuous uninterruptedtraining schedule for both the permanent and para teachersthrough cascade mode down the line of CLRc/CRC level
87through which teachers could develop their attitude,behavioral pattern and mentality towards quality educationof children coming from all corners of society with equality.The CLRC being the nodal centre for SSA was bestowed withthe major role in teacher training starting fromsubject/content based training to Girls Education or focus onother Social Category/Children with special needs oraddressing the regional/local specific needs andrequirements. The States Mission, however, admitted that theexisting intensive and uninterrupted training schedules hadimmense scope for improvement in respect of equality,enhancement of learning levels, etc.4.10.1 Types of trainingTraining to primary and upper primary school teacherswas imparted according to syllabus of <strong>West</strong> <strong>Bengal</strong> Board ofPrimary Education and <strong>West</strong> <strong>Bengal</strong> Board of SecondaryEducation.4.10.2 Process/Mode of trainingTeachers were imparted training through cascade mode –SRG (State Resource Group) / SLRO (State Level ResourceOrganisation) in case of IED only ⇒ DRG (District ResourceGroup) ⇒ KRP (Key Resource Persons) ⇒ RP (Resource Person) ⇒Teacher Training at base level.4.10.3 Subject and Focus area of trainingTraining to primary and upper primary school teachers wasprovided training on specified focus areas on SSUU, TLMParibesh Parichiti and English while upper primary school
88teachers were trained on Physical Science, Life Science, History,Geography, CCE and Grading having specified focus areas.SSUU = Samanwita Sikhan Unnayane Uttaran4.10.4 Category of TrainingThe table below shows the category of teachers trainings aswell as targets vis-à-vis achievements during 2005-06 to 2007-2008.Table 22P r i m a r y E d u c a t i o nI n s e r v i c ec o u r s eN o . o ft e a c h e r s1 0 d a y s T r a i n i n gd a y sO r i e n t a t i o nf o r f r e s h l yt r a i n e dr e c r u i t s 2 0d a y sR e f r e s hC o u r s e f o ru n t r a i n e dt e a c h e r s 6 0d a y sN o . o ft e a c h e r sT r a i n i n gd a y sN o . o fT e a c h e r sT r a i n i n gd a y sT a r g e t2 0 0 5 - 2 0 0 6 2 0 0 6 - 2 0 0 7 2 0 0 7 - 2 0 0 8A c h i e -v e m e n t% a g e o fa c h i e v em e n tT a r g e tA c h i e -v e m e n t% a g e o fa c h i e v em e n tT a r g e tA c h i e -v e m e n t% a g e o fa c h i e v em e n t- - - - - - - - - 1 2 3 6 6 3 1 0 9 9 8 1 8 8 . 9 4 1 6 0 6 0 4 1 5 0 3 3 1 9 3 . 6 0- - - - - - - - - 1 2 3 6 6 3 0 8 2 7 3 2 1 6 6 . 9 0 1 6 0 6 0 4 0 1 2 0 2 3 9 0 7 4 . 8 7- - -- - -- - -- - -- - -- - -- - -- - -- - -- - -- - -- - -5 4 7 8 31 0 9 5 6 6 0- - -- - -1 5 8 4 11 1 6 4 0 3- - -- - -2 8 . 9 21 0 . 6 2- - -- - -2 5 7 8 15 1 5 6 2 0- - -- - -2 0 2 7 22 9 9 0 0 7- - -- - -7 8 . 6 35 7 . 9 9- - -- - -U p p e r P r i m a r yE d u c a t i o nI n s e r v i c ec o u r s eN o . o ft e a c h e r s1 0 d a y s T r a i n i n gd a y sO r i e n t a t i o nf o r f r e s h l yt r a i n e dr e c r u i t s 2 0d a y sR e f r e s hC o u r s e f o ru n t r a i n e dt e a c h e r s 6 0d a y sN o . o ft e a c h e r sT r a i n i n gd a y sN o . o fT e a c h e r sT r a i n i n gd a y s1 4 8 1 5 8 1 1 9 6 6 6 8 0 . 7 7 8 2 6 9 7 6 9 6 5 9 8 4 . 1 9 7 3 8 2 6 6 6 9 2 5 9 0 . 6 51 4 8 1 5 8 0 9 0 2 3 3 4 6 0 . 9 0 8 2 6 9 7 0 3 8 1 8 9 9 4 6 . 1 8 7 3 8 2 6 0 5 6 0 3 3 3 7 5 . 9 08 5 6 8 22 5 7 0 4 6 07 0 7 4 54 2 4 4 7 0 0- - -- - -- - -- - -- - -- - -5 2 8 7 81 0 5 7 5 6 0- - -2 2 5 5 51 7 6 7 3 6- - -4 2 . 6 51 6 . 7 1- - -3 7 . 0 1 07 4 0 2 0 0- - -2 9 0 1 12 8 3 9 3 9- - -- - -- - -- - -- - -- - -- - -Note : I n case o f 2 0 0 5 -0 6 , the fi g ure s i nclud e b oth p ri mary a nd up per p ri mary, 2 0 0 6 -2 0 0 7Distri ct Rep o rt for 2006-2 00 7 and AWP&B for informa tion fur nished by S. P.O.Source : 2006-2 0 07 District <strong>Report</strong> for 2006-2 0 0 7- - -7 8 . 3 93 8 . 3 6- - -- - -The above shows that the percentage of primary and upperprimary teachers imparted inhouse 10 days training vis-à-vistargets ranged between 84.19 percent and 93.60 percent during
892006-2007 and 2007-08. However, in terms of training daysachievement ranged between 46.18 percent and 75.00 per cent.Similarly, achievement against targets for orientation for freshlytrained recruits for 20 days in terms of training days varied from10.62 percent to 57.99 percent both for primary and upper primaryteachers during 2006-07 and 2007-08. Refresher courses foruntrained teachers were not conducted in any of the years.4.10.5 The overall financial targets and achievements in respectTeachers’ Training during the period from 2005-06 to 2007-08were as follows :Table 23(Rs. in Lakhs)Targets Achievement Shortfall Percentage of achievements2005-2006 5,807.70 1,536.43 4,271.27 26.462006-2007 2,951.77 951.35 2,000.42 32.232007-2008 2,520.08 1,526.32 993.76 60.57The above tables disclosed that though overall physicaland financial achievement against targets improvedgradually over the years, the intervention needed furtherattention so that in-house training and refresher course for60 days were given to all the untrained teachers.
904.11 STATE COUNCIL OF EDUCATIONAL RESEARCH ANDTRAINING(SCERT)SCERT in an quality enhancement set upunder thedepartment of School Education with the aim of carrying outtraining and research in different areas o school education. Itplans, conducted and monitors all types ofteachers trainingprogramme, research and study, pedagogical activities, capacitybuilding of CPCs and inspecting officers, etc.SCERT, in convergence with different institutions, workedtodevelop capacity of Resource Group at different levels :STATE RESOURCE GROUP (SRGs)DIETS AND DISTRICT RESOURCE GROUP (DRGs)CIRCLE / CLUSTER LEVELRESOURCE PERSONS (SHIKSA BANDHUS)TEACHERSDuring 2006-07, SCERT took up activities such a s trainingof <strong>Shiksha</strong> Samprasaraks /Samprasarikas of MSKs ,varioussurveys on availability of educationfacilities in selected areas,assessment of educationalneeds of SC/ST children in selectedblocks, out of school children, development of manual onactivitybased mathematics and science teaching and alsodevelopment of a manual on Inclusive Educations for teachers andcommunity in the contextof UEE and strategies for awarenessdevelopment, etc. Out of 19 DIETs sanctioned,6 DIETs startedfunctioning from 2004 and 10 from 2006.Each of the DIETs was to have seven branches –
911. Pre-service Teachers Education2. Work Experience3. District Resource Unit for Adult Education and Non-formalEducation.4. In-service Programme, Field interaction and Innovation CoordinationBranch ;5. Curricular ,Material and Evaluation Branch ;6. Educational Branch ; and7. Planning and Management.Out of seven branches, work experience and resourceunitfor AdultEducation and Non-Formal Education were notfunctioning in any of the DIETs. Further activity wise andyearwise performance were not made available to Audit.4.12 OUT OF SCHOOL CHILDRENWith a view to attaining Universal ElementaryEducation in the Country in a mission mode, SSA set one ofits main targets to bring all children in school. EducationalGuarantee Centre, Alternative School. ‘Back to School’ Campby 2003. The objective was not achieved. As per records ofthe State Mission, the number of out of school children ineach year during 2004-2005 to 2007-2008 was as under :Table 24Year5+ To 8+ 9+ To 13+ 5+ To 13+Boys Girls Total Boys Girls Total Boys Girls Total2004-05 93,245 95,604 188,849 337,849 370,232 708,081 431,094 465,836 896,9302005-06 NA NA 185,949 NA NA 478,499 NA NA 664,4482006-07 305,036 278,587 583,623 423,447 350,531 773,978 728,483 629,118 13,57,6012007-08 63,754 60,370 124,124 171,958 160,133 332,091 235,712 220,503 4,56,215
92Child Census-2006, was conducted through HouseholdSurvey as per instruction of MHRD. GOI disclosed (2006-07) a totalnumber of 13,57,601 out of school children belonging to differentcommunities as under:-10:15+ to 8+9+ to 13+TotalTotalSC ST Minority Othe rs SC ST Minority Othe rs583,623 137,636 33,814 206,458 205,715 773,978 186,605 47,549 257,064 282,760As per the AWP&B for the year 2008-09, the State a had totalnumber of 4,56,215 out of school children in the age group 5+ to13+ showing a decrease of 9,01,386 children over the previous year(13,57,601). However, as per figures contained in the AWP&B,there should have been 19,23,102 out of school children as workedout below:AWP&ByearChild population(5+ to 13+)Not enrolmentoverall, i.e., includingprivate and all typesof schools (innumber)Out of schoolchildren2007-2008 1,68,60,535 1,55,02,934 13,57,6012008-2009 1,64,72,694 1,45,49,592 19,23,102Thus, there should have an increase in the number of out ofschool children by 5,65,501 (19,23,102 – 13,57,601) in the AWP&Byear 2008-09 in place of decrease in number by 9,01,386. Further,documentary evidence in support of reduction in number showingenrolment informal and non-formal school could not be furnishedto the Study Team.Interventions for out of school children provide for specificstrategies to bring these children into the educational system
93through Education Guarantee Scheme (EGS) and Alternative ofInnovative Education were as under :(a)Setting up schools in school-less habitations (EGS);(b)Interventions for mainstreaming of ‘out of school children’,viz., bridge courses, back to school camps, etc. (AIE);(c)Strategies for very specific, difficult groups who cannot bemainstreamed.4.12.1 Status of Government run EGS Component :The table below shows the position of number of SSKs,MSKs, SSPs, Sahayikas and learners during the last three yearsupto 2007-2008 :Table 25YearEGStype upgra dedNo.ofSSKSSKs (i ncludingSSKs)No.ofSahayikasEnrol mentNo. ofMSKsMSKsNo.of Samp rasa ra kEnrol mentNo. ofMSKsSSPsNo.ofSamprasa ra kEnrol ment2 0 0 5 -0 6 1 6 079 4 1 ,893 1 4 ,25,9 5 9 1 ,593 6 ,198 2 ,09,36 0 1 ,066 2 ,132 7 3 ,5362 0 0 6 -0 7 1 6 054 4 4 ,426 1 4 ,88,1 0 7 1 ,752 8 ,160 2 ,85,00 6 1 ,066 2 ,132 7 3 ,5362 0 0 7 -0 8 1 6 005 4 5 ,612 1 4 ,94,1 5 0 1 ,803 9 ,460 3 ,42,09 7 1 ,067 2 ,124 7 3 ,793(S ou rce: AW P&B for 2006-2 0 0 7 to 2008 -2 0 09 )It would be evident from the above table that EGS schoolswere functioning in 16005 centres at Primary level operated by thePanchayat and Rural Development Department under the nameSSK reaching 1494 150 learners in grade I-IV during 2007-08registering an increase of 68191 learners from 2005-06. At theupper Primary level, a similar model of alternative schooling was
94also offered by P&RDD, NSK which reached 342097 learners, anincrease of 132737 students from 2005-06 through 1803 permanentcentres. However enrolment under SSP remained static withenrolment of 73793 children.SSKs and MSKs received financial support from the StateMission in 2005-06 and 2006-07. Since 2007-08 these were beingfunded entirely through the state budget. This reflected a decisionby the State Government not to upgrade these centres to regularschools. During visit to selected districts, it was noticed seriousovercrowding, poor infrastructure (classroom, furniture, toiletsetc.) lack of teaching and learning materials etc. which wasadversely affecting the quality of learning.Mention may be made here that the State Mission agreedJanuary 2008 with the Join Review Mission that a comparativestudy of a representative sample of students’ performance inClass-II and III external examinations between regular and SSKschools to assess the quality would be undertaken. But no suchstudy was conducted (January, 2009).4.12.2 Selected districts :The position showing the number of EGS type SSKs, MSKsand SSPs along with enrolment therein in the selected districts ofMurshidabad and South 24-Parganas during the last three yearsupto 2007-08 was as given in the table below:
95Table 26MurshidabadYearN u m b e rSSKs MSKs SSPN o . o fS a h a y i k a s E n r o l m e n t N u m b e rN o . o fS a h a y i k a s E n r o l m e n t N u m b e rN o . o fS a h a y i k a sE n r o l m e n t2 0 0 5 -0 6 1 2 2 0 3 ,604 1 ,33,68 6 1 1 1 5 1 9 NA NA NA NA2 0 0 6 -0 7 5 8 2 1 ,96,25 3 1 7 9 2 9 ,891 9 2 1 8 4 7 ,0662 0 0 7 -0 8 1 5 7 9 5 ,651 2 ,03,21 3 1 9 0 9 6 3 3 8 ,747 9 2 1 8 4 7 ,066South 24-Pargana sYearN u m b e rSSKs MSKs SSPN o . o fS a h a y i k a s E n r o l m e n t N u m b e rN o . o fS a h a y i k a s E n r o l m e n t N u m b e rN o . o fS a h a y i k a sE n r o l m e n t2 0 0 5 -0 6 9 2 9 2 ,681 9 5 ,963 6 3 1 1 3 NA NA NA NA2 0 0 6 -0 7 1 2 1 5 1 ,43,25 5 6 9 1 2 ,299 3 1 1 ,5912 0 0 7 -0 8 1 2 1 3 4 ,028 1 ,40,98 0 6 9 3 8 9 1 4 ,430 3 1 6 2 1 ,591Though the number of enrolment in SSKs Murshidabad andSouth 24-Parganas district increased from 133686 in 2005-06 to203213 in 203,213 and from 95963 in 2005-06 to 140980 in 2007-08respectively the number of enrolment in MSKs and SSP in both, thedistricts did not increase significantly compared to SSK children.Besides the quality of education imparted was never assessedeither by the DPO or the State Mission.As per the School Efficiency Study COHORT 2005 in SSKs inMurshidabad District the overall completion and wastage rate ofthe SSKs was :CRF RE DO Migration30.04% 23.29% 34.43% 12.14%
96The overall completion, Repeater, Dropout and Migrationrate of MSKs in Murshidabad as per a study conducted in 2006-07was :CRF RE DO Migration41.67% 9.79% 39.62% 8.92%Similarly, COHORT 2006 in SSKs in the South 24 ParganasDistrict was :CRF RE DO Migration34.74% 33.1% 24.26% 7.9%No action was taken to reduce the completion rate in fouryears, dropout and repetition.4.12.3 Status of Bridge Course CentreBridge Course programme aims mainly for thosechildren who dropped out from formed schooling system orchildren who never enrolled in any school. After successfulcompletion of the curriculum. These children would bemainstreamed either on formal schools or within thealternative schooling system.
97The position of Bridge Course centres and learners duringthe years 2005-06 to 2007-08 was as given below:Table 27ParticularsNo.ofCentres2005-06 2006-07 2007-08No.oflearnersNo.ofCentresNo.oflearnersNo.ofCentresNo.oflearnersBridge Course Primary level 2504 70,266 2,754 71,084 2,550 59,736Bridge Course UpperPrimary level1,091 30,762 1,198 22,863 1,373 35,3414.12.4 Meanstreaming status of Bridge CourseParticula rsBridge CoursePrimary LevelBridge CourseUpper Pr imaryLevelMainstreaming sta tus of B ridge Course(2 0 0 6 -0 7 ) from 2005-0 6No.ofcentresNo.ofL e a rnersNo.ofle a rnersm a instreamedMainstreaming sta tus of B ridge Course(2 0 0 7 -0 8 ) from 2006-0 7No.ofcentresNo.ofL e a rnersNo.of le a rnersm a instreamed2,209 60,819 26,361 2,754 71,084 37,3661,011 25,880 15,477 1,198 22,863 6,734(Source ; AWP&B for the years 2005-06 to 2008-09)It would be evident from the above table that 37.51 per cent of thechildren in 2005-06 were mainstreamed in primary level and 50.31per cent in Upper Primary level in 2006-07. Similarly 62.55 percentof children in Primary level and 19.05 per cent in Upper Primarylevel in 2006-07 were mainstreamed in 2007-08. This reflects poorperformance in a mainstreaming particularly of upper Primarychildren.
984.12.5 BRIDGE COURSE CENTRES ( BCC) RUN BY NGOFORALTERNATIVE INNOVATIVE EDUCATION SCHEME (AIE)MURSHIDABAD DISTRICTPBSSM approved (2007-08) appointment of two NongovernmentOrganisation (NGOs), Nawda Vivekananda WelfareOrganisation (NVWO) and Domkal Vikash Kendra (DVK) for 15458and 6593 Primary and Upper Primary learners under AIE schemerespectively. A sum of Rs.59,24 laks and Rs.25.02 lakh wereallotted for NVWO and DVK respectively for the period fromJanuary 2008 to March 2008.Para 1.20.4 of the MOFMAP envisagesselection of NGObased on among others, (i) proven track record on similarassignment (ii) a liquate number of experienced field staffconversant with the local culture and language and the socioeconomicdimensions of the beneficiary groups and (iii) facilitiesto maintain separately records and accounting and auditing offunds allocated for the assignment but no document evidencingfulfillment of the criteria would be shown to the study Team.Besides no MOU with terms of reference regardingimplementation, academic support and monitoring, release of fundetc. between the District Project office and the NGOs was signed
99in terms of Para 3.26.12 of the SSA FRANEWORK FORIMPLEMENTATION.District Project officer stated ( August 2007) to the NGOsthat centres would run for 6 months and it should be ensured thatall children would be main streamed in the Academic Session2008-09 positively. Records revealed that NVWF and DVKmainstreamed only 7476 children out of 15458 children in 435BCCsand 3321 out of 6593 children in 217BCCs respectively till August2008. The performance of the NGOs being not satisfactory, all theBCCs run by the NGOs wire closed form 1 s t September 2008.Rs.29.62 laks and Rs.12.51 lakhs representing 50 per cent of theallotted fund were paid directly to NVWF and DBK respectively on12 t h March, 2008. The balance amount given to respective CLRCsremained unpaid ( December 20080 as per records of DPO.Thus the objective to see the AIE as integral to the quest ofUEE did not come into fraction for improper selection of NGOs inviolation the terms and conditions of SSA.South 24 Parganas :As per the Child Census 2006, there were 1,58,888 out ofschool children in the district ( 5+ to 8+ : 71,868 and 9+ to 13+ :
10087,020) with a view to enrolling them in schools, BhartiSunischitkoram Karmasuchi 2007 was organised between May toAugust 2007 and enrolled 56,388 children in primary and 5,916children in upper primary levels learning 49,584 children ( 5+ to 8+: 15,480 and 9+ to 13+ : 34,104 ) to be enrolled of these 49,584children 17,775 children were covered in 414 bridge course centresin the district, during November 2007 to March 2008. Thus, as on31 March 2008, the district had 31,809 but of school children ( 5+ to8+ : 3,704 and 9+ to 13+ : 28,109) . As per report of the district,during 2008-2009 (upto December 2008) another 14,848 childrenwere enrolled in upper primary schools. Hence in December 2008,there remained 16,961 out of school children (5+ to 8+ : 3,704 and9+ to 13+ : 13,257 ) in the district.The role of bridge course centres in enrolling and mainstreamingout of school children was as under :Primary Bridge Course CentresYear No. of Centres Enrolment No .of learners main streamed2005-06 148 7,254 5,0002006-07 319 11,033 10,7192007-08 414 17,775 NASource : AWPTB for 2007-08 and 2008-09 and DPO, South 24 Parganas.
101The picture of budgeted expenditure and actual expenditure incurred by thedistrict was as under :BudgetaryYearActual expenditure(Rupees in Lakh)Percentage of achievement(Rupees in Lakh)2006-07 95.92 31.78 33.132007-08 504.00 193.20 38.33Hence, in terms of financial achievement the district fell far short of target.4.12.6 Rabindra Mukta Vidyalaya (RMV) :Rabindra Mukta Vidyalaya (RMV) is the name of the StateOpen School System. Initially, RMV used to provide a scope tocandidates who had completed school education at least uptoClass VIII and dropped out, to prepare for a public examination ofschool final standard and appear for the examination for attaininga qualification equivalent to school final (Madhyamik). RMVopened up learning centres in various schools with permissionfrom concerned managing committee and organized classes there.4.12.7 Overall progress of RMV during the last four years uptoTable 282008-09 (upto September 2008) was as under :YearNo. ofdistr ictscoveredNo.ofcentresa pprovedNo. of centres run ning No. of le a rners No. of Communit y TutorsSta teMurshidabadSouth 24ParganasSta teMurshidabadSouth 24ParganasSta teMurshidabadSouth 24Parganas2 0 0 5 -0 6 1 3 1 2 3 3 8 2 3 6 3 9 8 3 4 ,632 3 ,348 4 ,474 1 ,344 1 2 6 1 9 62 0 0 6 -0 7 1 1 1 2 3 3 7 5 4 6 4 1 1 3 4 0 ,085 3 ,393 6 ,666 1 ,333 1 2 1 1 9 62 0 0 7 -0 8 1 4 1 2 3 3 7 9 5 6 4 1 0 9 4 8 ,198 5 ,245 7 ,115 1 ,690 1 3 9 2 7 02 0 0 8 -0 9 1 5 1 2 3 3 7 8 8 6 6 1 0 6 4 9 ,267 5 ,049 8 ,091 1 ,715 1 6 0 2 6 8South : AWP&B for 2006-07 to 2008-09
102Out of 1,233 Study Centres approved to be opened by RBV,till December 2008, only 788 centres were functioning. InMurshidabad and South 24 Parganas, out of 92 and 192 centresapproved to be opened, only 66 and 106 centres were running.4.12.8 Physical and financial targets in respect of the interventionTable 29of out of school children as were approved by PAB for theyears 2005-06 to 2008-09 and the extend of achievementthereof by the State Mission were as given below:2005-2006(Rupees In lakh)App rov ed Outlay Achievement Pe rcentage o fa chievementPhysi cal(No. ofchildren)FinancialPhysi cal(No. ofchildren)FinancialPhysi cal(No. ofchildren)FinancialEGS Centre (P) SSK 7 ,73,54 0 6 ,336.4 3 7 ,16,87 9 2 ,509.7 9 9 2 .68 3 8 .40EGS Centre (U P ) MSK 5 0 ,302 6 0 3 .61 -- -- -- --Bri dge C ou rs e (P) 1 ,29,90 4 1 ,097.6 9 9 2 ,881 2 7 ,74 7 1 .50 2 5 .30Remedial Teaching 9 ,75,50 7 9 7 5 .50 5 ,86,39 4 2 1 8 .19 6 0 .11 2 2 .37Resi dential Camp -- 9 7 5 .50 -- -- -- --I nnovative Schem es (RMV) 9 1 ,492 1 ,097.9 2Other (Bri dge Cour se ) UP 3 ,29,18 9 3 ,950.2 7 2 4 ,151 1 0 3 .12 7 .34 2 .61Tota l 2 0 ,59,9 3 4 1 5 ,036 .92 1 4 ,20,3 0 5 3 ,108.8 4 6 8 .95 2 0 .672006-2007App rov ed Outlay Achievement Pe rcentage o fa chievementPhysi cal(No. ofchildren)FinancialPhysi cal(No. ofchildren)FinancialPhysi cal(No. ofchildren)FinancialEGS (P) 1 7 ,37,2 0 2 1 4 ,679 .36 9 ,31,42 1 1 2 ,821 .38 5 3 .67 8 7 .34Bri dge C ou rs e (Resi dential) 3 5 0 2 3 .80 7 6 7 .70 2 1 .71 3 2 .35Bri dge C ou r se (Non- 4 ,06,67 0 4 ,409.5 0 3 9 3 2 1 2 9 .36 0 .97 2 .93Resi dential)Remedial Teaching 6 ,60,68 3 3 ,700.7 0 1 ,714 1 6 3 .26 0 .26 4 .41Others 2 ,94,61 2 3 ,407.7 9 1 5 ,861 1 2 7 /4 4 5 .38 3 .74Tota l 1 4 ,99,5 1 7 2 6 ,221 .15 9 ,54,00 4 1 3 ,149 .14 6 3 .62
1032007-2008App rov ed Outlay Achievement Pe rcentage o fa chievementPhysi cal(No. ofchildren)FinancialPhysi cal(No. ofchildren)FinancialPhysi cal(No. ofchildren)FinancialEGS (P) 9 ,608 1 4 7 .48 1 ,801 4 6 1 .48 1 8 .74 3 1 2 .91EGS (U P) -- -- -- 5 7 .67 -- --Resi dential Bri dge C ou r se 5 .500 3 7 4 .00 7 3 2 .95 9 .13 8 .81Non-Resi dential Bri d ge 3 ,06,97 2 4 ,712.0 2 4 ,152 6 6 7 .38 1 .35 1 4 .16cou rs e (P + UP)Remedial Teaching 7 ,26,87 6 3 ,634.3 8 1 ,325.8 0 3 6 .48AIE Centre 6 5 ,129 9 9 9 .73 0 .15 0 .02Others (RMV) 8 9 ,323 1 ,371.1 1 6 ,798 7 5 0 .94 7 .61 5 4 .77Tota l 1 2 ,03,4 0 8 1 2 ,238 .72 1 2 ,758 3 ,296.3 7 1 .06 2 6 .932008-2009App rov ed Outlay Achievement Pe rcentage o fa chievementPhysi cal(No. ofchildren)Financial(up toNov.08)Physi cal(No. ofchildren)Financial(up toNov.08)Physi cal(No. ofchildren)FinancialNRBC (6 months)1 ,42,478 1 ,094.2 3NRBC ( 1year) 1 ,32,83 3 2 ,656.6 6 3 3 .68 1 .27Resi dential Bri dge C o u rs e (1 1 7 ,328 1 ,386.2 4 4 .16 0 .30year)EGS (P) SSK 1 4 ,94,1 5 0 2 2 ,035 .20 5 ,565.5 5 2 4 .27EGS (U P) MSK 3 ,42,09 7 1 0 ,126 .07 2 ,457.4 5 2 4 .27RBC (6 month s) 2 0 0 7 .00Urban Depri ved children 3 8 ,770 5 9 5 .12 1 3 8 .16 2 3 .22Ma dra sa / Ma ktab 4 ,762 7 3 .10AIE Centre (Harde st t o reachC hildren in Porta ren ) 3 3 ,900 6 7 8 .00 0 .28 0 .04Others (RMV) 8 0 .523 1 ,207.8 4 1 6 7 .25 1 3 .85Tota l 2 2 ,78,0 4 1 4 0 ,759 .46 8 ,457.2 9 2 0 .75It would be evident seen from the above tables that thepercentage of achievement against financial targets was 20.67 in2005-06, 50.15 in 2006-07, 26.93 in 2007-08 and 20.67 in 2008-09(upto September, 2008). Achievements against physical targetswere 68.95 percent, 63.62 percent, 1.06 percent 2005-06, 2006-07and 2007-08 respectively. Achievement in 2007-08 as per thequarterly progress report was abnormally low.The financial targets vis-à-vis achievements in respect of outof school children for the selected districts of Murshidabad andSouth 24-Parganas since 2005-06 onwards were as given below :
104Table 302005-06 2006-07 2007-08 2008-09 (Nov.08)Mu rshidabadSouth 24Pa rganasMu rshidabadSouth 24Pa rganasMu rshidabadSouth 24Pa rganasMu rshidabadSouth 24Pa rganasTarget 1,455.91 1,605.12 2,690.41 1,888.10 931.25 831.69 5,007.71 2,874.02Achievemen t 82.66 59.19 26.70 128.46 197.49 676.77 21.99 76.46Percen tageofachievement5.68 5.56 1.00 6.80 21.21 81.37 0.44 2.66The above table disclosed that excepting the achievement inSouth 24 Parganas District in 2007-08 (81.37 per cent),achievements against targets in 2005-06 to 2007-08 were negligiblein both the selected districts. Further, during the first eightmonths upto November 2008, Murshidabad District could spend0.44 percent and South 24 Parganas 2.66 per cent of the approvedoutlay for the year 2008-09.4.13 INCLUSIVE EDUCATION FOR CHILDREN WITH SPECIALNEEDSSSA ensures that every child with special needs (CWSN),irrespective of kind, category and degree of disability, is providedmeaningful and quality education. Hence SSA has adopted a zerorejection policy which means that no child having special needsshould be deprived of the right of education.Table below depicts CWSN identified, physical and financialtargets and achievements on enrolment in schools and such
105children not enrolled during the period from 2005-06 to 2008-09(till September 2008):Table 31CWSN identifiedYear New PreviousyearTotalTargets approved byPABPhysical(forEnrolment)Financial(Rs.inlakh)AchievementEnrolmentof CWSN% oftarget)Number ofChildrenidentified butnot enrolledFinancial(Rs. Inlakh)% ofCol.VI(i) (ii) (iii) (iv) (v) (vi) (vii) (viii) (ix) (x) (xi) (xii)2005-06 -- -- -- 213746 1282.48 97570 (45.65) 116176 (54.35) 625.97 (48.80)2006-07 49143 116176 165319 140699 1688.39 116623 (82.89) 48696 (29.45) 674.86 (39.97)2007-08 142748 48696 191444 128405 1154.65 125624 (97.83) 65820 (34.38) 874.08 (75.70)2008-09(uptoSept.08)133851 65820 199671 199671 1797.03 10126 (5.08) 187545 (94.92) 123.15 (6.85)Note: (a) Figure at Col.(iii) taken from Col. ix(b) During 2005-2006, figure at Col. ix ascertained deducting figure at Col.(vii)from Col. (v) noticing discrepancy in respect of number identified, 147280 being lowerthan the target (213746). In subsequent years, number of children identified but notenrolled (fig. at Col.ix) ascertained deducting actual enrolment (col.vii) from totalnumber identified (Col..iv).A large number of CWSN identified ranging from 29.45 percent to 54.35 per cent were deprived of the right of enrolmentduring the period from 20-05-06 to 2007-08 despite availability offund. The extent of fund utilized for this intervention ranged from39.97 per cent to 75.70 per cent during the same period.During 2005-06, 45.65 per cent of the target was achieved.Even targets fixed on the lower side, viz. 85.10 per cent and 67.07per cent of the identified children in 2006-07 and 2007-08respectively could not be fully achieved. During 2008-09 (upto
106September 2008) only 5.08% of the targets was achieved withutilization of fund to the extent of 6.85%.Though 196 Non-Governmental Organisations (NGOs)(named as District Level Resource Organisation or DLRO) areinvolved with the implementation of the IED programme at grassroot level and state level also, appropriate action was not taken bycontinuous monitoring of the work being executed by DLRO at thestate or district level so as to find out the actual reasons of shortfull, stated at (a) & (b) supra and translate the SSA objective intoreality. This would be evident from the manner of selection ofNGOs and their functioning found in selective study ofMurshidabad District in para 4.13.2Till 31 s t March, 2007-08 34707 numbering different types ofaids and appliances were supplied to the CWSN. This isinadequate compared to 128405 such children enrolled in schools46421 ramps were built till march 2008 covering more than 70 percent of all elementary schools.
1074.13.1 MURSHIDABAD DISTRICTNon-Government Organisation (NGO) had been given theresponsibility to implement the Integrated Education for DisabledChildren (IED) activities at grass root level to reach out the goal ofuniversalisation of enrolment retention and quality education ofthe disabled children.4.13.2 Engagement of NGO, without contract.As per para 3.26.12 of the SSA FRAMEWORK FORIMPLEMENTATION an MOU would be signed by the StateImplementing Society (SIS) and NGO which would clearly state theterms of reference regarding implementation, academic supportand monitoring, release of fund to the NGO etc. It was however,noticed that no MOU was signed by the SIS and seven NGOs, (alsocalled District Level Resource Organisation – DLRO) althoughsuch NGOs were working in ten units during the period understudy (2005-06 to 2008-09). The study Team raised an enquiry(December 2008) as to how payment of Rs.231.10 lakh was made toNGOs during the period from 2005-06 to 2008-09 (till November,2008) in the absence of any contract but no reply was received(January, 2009).
1084.13.3 The table below depicts the targets and achievementsin respect of CWSN during the period from 2005-06 to 2008-09 (upto November, 2008):Table 32YearTarget Physi calC WSNi dentifi ed forenrol mentNewPr eviousyearTotalFinancial(Rs.inl a kh)a ppr ovedoutlayAchievementPhysi calEnrol mentof CWSN% ofTargeti .e.C ol .ivNumbe rofchildreni dentifi edbut notenrol l edExpenditure(Rs. Inl a kh)(% ofC ol .v)(i ) (i i) (i ii ) (iv ) (v) (vi ) (vi i ) (vi i i) (ix ) (x )( C o l . V I -C o o . i v )2 0 0 5 -0 6 1 1 0 94 - 1 1 0 94 5 5 .72 1 0 2 72 (9 2 .59) 8 2 2 3 8 .47 (6 9 .04)2 0 0 6 -0 7 1 1 1 79 8 2 2 1 2 0 01 1 1 1 .78 1 1 1 76 (9 3 .12) 8 2 5 8 7 .74 (7 8 .49)2 0 0 7 -0 8 1 3 3 28 8 2 5 1 4 1 53 5 7 .30 1 0 2 72 (7 2 .58) 3 8 8 1 5 3 .28 (9 2 .98)2 0 0 8 -0 9 NA 1 5 3 .66 NA 5 1 .61 (3 3 .58)(up toNovembe rSource : AWP&B 8 District Accounts2 0 0 8 )The above table indicates the following position :(i)The number of children identified but not enrolled increasedfrom 822 in 2005-06 to 3881 in 2007-08. The percentage ofenrolment of children compared to target decreased from92.59 in 2005-06 to 72.58 in 2007-08.(ii) During 2006-07 the budget estimate for 12001 children wasRs.111.78 lakh which was not only higher compared toRs.55.72 lakh for 11094 children in 2005-06 but foundirrational compared to Rs.57.30 lakh for 14153 children in
1092007-08. Reasons for such abnormal variation in estimate for2006-07 compared to 2007-08 were not recorded.(iii) Expenditure incurred to the tune of Rs.87.74 lakhrepresenting 78.49 per cent of approved outlay for enrolmentof 11,176 children (@ Rs.785.07 per child) in 2006-07 wasfound inconsistent and abnormal compared with amount ofRs.53.28 lakh, representing 92.98 per cent of approved outlayspent for enrolment of 10272 children (@ Rs.518.69 per child)in 2007-08. This also negates the logic of increased in costwith the progress of time in the context of the increase inprice index prevailing in the country.Reasons for abnormal expenditure in 2006-07 beingRs.266.38 higher per child than 2007-08 were not recordedfor analysis and ultimate ascertainment of areas of suchexpenditure.(iv) Records showing year wise, formal/non-formal school wiseclass wise enrolment and disability wise breack up of IEDchildren during 2005-06 to 2007-08 vis-à-vis number ofidentified in each could not be shown to the study team.
110During 2008-09 (upto November 2008), though 33.58 per centof the budget estimate was spent, the number of CWSN assessedand enrolled could not be furnished to the Study Team (December,2008)The fact stated above, however, would not exhibit the actualperformance of IED activities in the district.Records available of 205 schools under 41 CLRC, pertainingto 2006-07 revealed the actual performance as follows :4.13.4 Gender wise Enrolment status of Normal andDisabled Children for the Session: 2006-07Total Children Normal Children Disabled ChildrenBoys Girls Boys Girls Boys GirlsTotal27659 26859 26900 26303 759 556 131597.26% 97.93% 2.74% 2.07%The table shows that the enrolment rate of boys amongnormal children was comparatively lower than the girls. But theenrolment rate of girls among disabled children was comparativelylower than the boys. However no records were available indicatingwhether the number of disabled girls in the schools concerned waslower than the boys or a part of disabled girls had not beenadmitted in schools.
1114.13.5 Overall yearly promotionThe overall yearly promotion status of 1227 one of 1315Disabled Children in 2006-07 as noticed from records was asfollows :Enrolment Promotion Drop out Repeaters1227 984 39 20480.20% 3.18% 16.62%It would be evident from the above table that promotion ratein different grades of disabled children was 80.20 percentandwastage rate was 19.80 percent. Though the yearly promotion ratewas encouraging, but neither the reasons for such wastage wereanalysed nor the related documents were available to examine thereasons for the gap between drop out and Repeaters which was13.44 per cent.Records of promotion, drop out etc. of the remaining 88disabled children were not available.
11214.13.6 The following table depicts caste wise yearlypromotion status of 1227 disabled children in 2006-07.Enrolment Promotion Dropout RepeatersSC ST MI OTH SC ST MI OTH SC ST MI OTH SC ST MI OTH122 -- 995 110 97 -- 797 90 6 -- 31 4 19 -- 167 1679.5% 80% 81.81% 4.91% 3% 3.63% 15.57% 16.78% 14.54%It would be evident from the above table that the promotionrate of SC children was comparatively lower than the other castes,the promotion rate of minority children was lower than the generalchildren but higher than the SC children. The drop out rate amongSC children was higher than the General Children but therepeaters among minority children were higher than the otherchildren. This aspect warrants remedial measures by the SIS.4.13.7 Transition pattern of IED children from Primary to UpperPrimaryRecords revealed that out of 1097 disabled childrenidentified from 205 primary schools, the existence of such childrenin Class-IV was only 255. The transition pattern of 255 childrenduring 2006-07 was as follows :No. ofChildrenSexChildren passedin the Exam ofClass-IVPromoted Childrenadmitted in Class-VIf admitted what type ofSchoolMale Female Yes No Yes No Govt. Non Govt Other255 151 104 238 17 194 44 184 -- 1059.22% 40.78% 93.33% 6.67% 81.51% 18.47% 94.85% -- 5.15
113The following position emerges from the above :(i) The transition status from Class-I to IV, being 255 out of 1097student, was only 23.25 percent.(ii) 93.33 per cent (238) of 255 children were promoted fromClass-IV and 81.51 per cent of re promoted children wereadmitted to Class-V and 18.49 per cent were not admittedreasons for which were not on record.Thus, the very low transition rate from Class-I to IV, failureof 6.67 per cent of the candidates to pass Class-IV examination andnon admission of 18.47 per cent of the promoted childrenpromoted from class IV to V require immediate action by the SIS toreach out the goal of universalisation of enrolment retention andquality education of the disabled children.4.13.8 Role of Special Educatoractivities.The special educators are the main arms to implement IEDThe educational qualification and training status of 36special educators of the districts are as follows :
114Educational QualificationTraining takenHS Gradua tion Post Gradua tion MR VH VI HI02 28 06 17 04 05 105.55% 77.77% 16.66% 47.22% 11.11% 13.88% 27.77%It would be evident from the above that most of the specialeducators are graduates and only 16.66 per cent are postgraduates. Despite different categories of disabled childrencontinuing their education in schools, 47.22 per cent of the specialeducator were trained in Monthly Retardation. No action wastaken to train them in other categories viz. Vision……(VH), VisionImpaired (VI), Hearing Impaired (HI) etc., so as to ensure specialsupport to teachers and children properly.Records also revealed that 36 special educator submitted 205school visit reports in each month in 2007-08. It was noticed thatonly 58.33 per cent of special educators observed the class roomtransactions and teaching learning process in schools.The study team observed that there was no provision ofattendance by special educators working in the CLRCS. The fieldwork and family counseling work was being done by sucheducators without any consultation with CPC. Hence CPCs werenot fully clear about the performance of special educators’activities.
115SIS may ensure that proper plan is made by the specialeducators in consultation with the CPCs for school visit and familycounseling so that their performance may be evaluated withreference to the targets for improving the achievement level of IEDchildren.4.13.9 Appointment of NGOs (District Level ResourceOrganisation).As per AWP&B 2008-09 there was a provision forappointment of 16 new DLRo, and 4 Special Educators forsuccessful implementation of zero rejection policy considering thefact that only 7 NGOs were engaged in 10 units in the district with26 blocks. But the District authority did not take any action toappoint 16 DLROs till the date of visit by the Study Team(December, 2008).4.13.10 SOUTH 24 PARGANAS DISTRICTThe table below indicates the targets and achievements ofCWSN in the district during the period from 2005-06 to 2008-09(upto November, 2008).
116Table 33YearTarget Physi calC WSNi dentifi ed forenrol mentNewPr eviousyearFinancial(Rs. in lakh)TotalApp rov edoutlayPhysi calEnrol mentof CWSNAchievement% ofTargeta tC ol .ivNumbe rof CWSNi dentifi edbut notenrol l ed(col .ivcol.vi)Expenditure(Rs. inl a kh)% of Expenditureto col .v(i ) (i i ) (i i i ) (i v) (v) (vi) (vii) (viii) (i x ) (x)2 0 0 5 -2 00 6 8 4 0 3 -- 8 4 0 3 7 7 .75 7 2 6 2 8 6 .42 1 1 4 1 7 7 .52 9 9 .702 0 0 6 -2 00 7 8 2 8 9 1 1 4 1 9 4 3 0 8 8 3 5 8 5 0 0 9 0 .14 9 3 0 4 5 .28 5 1 .252 0 0 7 -2 00 8 1 1 5 14 9 3 0 1 2 4 44 4 7 .94 1 1 3 46 9 1 .18 1 0 9 8 3 3 .64 7 0 .17*2008-2 0 09 1 1 5 46 1 0 9 8 1 2 6 44 1 1 8 .26 1 1 3 46 9 1 .18 1 2 9 8 3 2 .27 2 7 .29* Note: Physical and Financial achievement upto November, 2008Source:District Project Office record.The following picture emerges from the above table :(i) The budget estimates prepared for enrolment of (a) 8403children at Rs.77.75 lakh (Rs.925.26 per child) in 2005-2006and (b) 9430 children at Rs.88.35 lakh (Rs.936.90 per child) in2006-2007 were found abnormal and inconsistent with theestimate of Rs.47.94 lakh for 12444 children (Rs.385.24 perchild) in 2007-2008. Again the estimate prepared for 12644children at Rs.118.26 lakh (Rs.935.30 per child) 2008-2009 wasfound 146.68 per cent more than the estimate of 12444 childrenin 2007-2008. Reasons for such abnormal variations inestimates were not recorded.
117(ii)Expenditures incurred to the tune of (a) Rs.77.52 lakh being99.70 per cent of the estimate for enrolment of 7262 children(Rs.1067.47 per child) in 2005-2006 (b) Rs.45.28 lakh being51.25 per cent of the estimate for enrolment of 8500 children(Rs.532.70 per child) in 2006-2007 are pointer to the fact ofspending of Rs.32.24 lakh less in 2006-2007 with enrolment of1238 more children than 2005-2006. However, suchinconsistency in the scale of expenditure and enrolmentwould prove abnormal when compared to Rs.33.64 lakhbeing 70.17 per cent of the estimate spent for enrolment of11346 children (Rs.296.49 per child) in 2007-2008. This bringsinto focus that in 2007-2008, 4084 and 2846 more childrenwere enrolled with less expenditure of Rs.43.88 lakh andRs.11.64 lakh compared to 2005-2006 and 2006-2007respectively. Even the expenditure incurred in 2008-2009 tothe extent Rs.32.27 lakh (upto November, 2008) for enrolmentof 11346 students (Rs.284.41 per child) almost in consonancewith the physical an a financial achievement in 2007-2008revealed wide disparity in terms of lesser enrolment andmore expenditure in 2005-2006 and 2006-2007 respectively.
118The circumstances attributable to the abnormalvariation in expenditure could not be stated with relevantrecords and documents.(iii)The enrolment of CWSN increased from 7262 in 2005-2006 to11346 in 2008-2009 (till November, 2008) but the number ofidentified children not enrolled though marginally decreasedfrom 1141 in 2005-2006 to 930 in 2006-2007 increased to 1298in 2008-09 (till November, 2008).(iv)Besides above, records showing, formal/non-formal schoolwise, class wise enrolment and disability wise break-up of allIED children during 2005-2006 to 2008-2009 (till November,2008) vis-à-vis the number of identification in each such yearcould not be shown to the Study Team.4.13.11 Performance of CWSNRecords of classwise promotion drop out etc. of CWSN andtransition pattern of IED children from Primary to Upper Primarywere not made available to the Study Team.4.13.12 Engagement of District Level Resource Organsiation(DLRO)
119No report, from each of the 10 DLRO their 44 SpecialEducators performance year wise vis-à-vis fund allocated forthe assignment during the period from 2005-2006 to 2008-2009 (till November, 2008) was made available.4.13.13 Special EducationNo records showing educational qualification and trainingstatus in respect of different categories of disabilities of SpecialEducators deployed by DLROs in 51 circle level Resource Centres(CLRCs) were made available. Further the Study Team observedthat Special Educators were not submitting any monthly/quarterly/six monthly/annual plan to the Circle Project co-ordinators.4.14 EDUCATION OF SATISFACTORY QUALITYOne of the main objectives of SSA is to focus on elementaryeducation of satisfactory quality with emphasis on education ofsatisfactory quality with emphasis on education for life.According to Education Development Index (EDI)ranking bythe National University of Educational Planning andAdministration (NUEPA), <strong>West</strong> <strong>Bengal</strong> stood 32 n d in 2005-06 and33 r d in 2006-07 due mainly to adverse Primary : Upper Primaryratio, primary teachers’ vacancies, absence of child -friendlyatmosphere in almost all the school visited and socio-economic
120conditions, etc. Records revealed that less than 20% students got60 percent or marks in the State.4.14.2 Key indicators making to retention and quality educationAn initiativewas taken by the State Mission to assess thestatus in school of relation to achievement of learners throughcalculation of drop out rate, completion rates in 4 years (CRF)and repeaters of enrolled students CHORT Study was used inselected primary schools distributed throughout the statecovering 4,43,857students. Similar study was undertaken inselected 5,238 upper schools in the state covering 6.45,906students. The outcome was as under(a) Gender wise drop out rate ( in percent)PrimaryUpper PrimaryBoys Girls Total Boys Girls TotalState 16.61 14.90 15.78 31.22 30.75 31.00Murshida bad 14.77 11.39 13.12 33.34 34.16 33.73South 24 24Parganas 22.67 18.94 20.53 36.33 33.83 35.15Nearly, one-fifth of children of primary and one-third at the supperupper primary dropped out.
121(b) Completion rate in 4 years (in percent)PrimaryOverall % completion in 4yearsUpper PrimaryOverall % completion in 4yearsCRF Boys Girls CRF Boys GirlsState 57 56.90 59.06 37.63 37.90 37.31Murshida bad 58.71 56.63 60.90 32.11 32.65 31.53South 24 24Parganas 48.43 46.89 50.01 33.61 33.63 33.58The above showed that about 50% children at primary level and onethirdat upper primary level complete 4 years schooling.(c) Overall Repetition Rate ( in percent)PrimaryUpper PrimaryCRF Boys Girls CRF Boys GirlsState 29.87 29.42 29.65 48.04 50.33 49.11Murshida bad 30.99 29.61 30.31 52.87 55.10 53.95South 24 24Parganas 41.54 40.62 41.09 59.10 52.09 50.51As it is evident from the above about 40 per cent children atprimary and about half the children in Upper primary repeatschooling.4.14.2 Students Assessment at Primary LevelContinuous evaluation was done in the school covering allenrolled students during class room transaction by teachers.Besides, Parbic Mulyayan Panghi prepared and this “Panghi”shared with parents and local communities.Besides –external evaluation was conducted for learners atthe end of the Class II by District Primary School Council.
122Diagnostic Achievement Test (DAT) was conducted covering 2001-05 for assessing performance of learner of Class IV. Result ofDAT revealed the following position :PrimaryPassed fr om Class IV withmore than 60% marks (inpercent)Upper PrimaryPassed fr om Class IV( in per cen t)CRF Boys Girls CRF Boys GirlsState 43.56 42.49 43.02 94.61 94.97 94.79Murshida bad 44.21 42.52 43.45 95.20 95.07 95.14South 24 24Parganas 48.27 47.81 48.03 92.13 94.40 93.29The above table show that nearly half the children scored more than 60percent marks at Class IV test and about 93.29 percent passed outfrom class IV.4.14.3 Performance of students of Class-VIII as per COHORT 2000-2004 as under:Passed from Cla ss-VIII with more than 60%marksBoys Girls %passed with more tha n60% marksPassed from Cla ss-VIIIBoys Girls %passedState 15.52 12.92 14.22 79.49 77.31 78.40Murshida bad 12.50 9.66 11.06 78.39 74.23 76.2424-Parganas 16.84 13.97 15.39 81.46 79.45 80.44In case of upper primary 78.40 present students passed fromClass-VIII and 14.22 percent only obtained more than 60 per centmarks. In case of Murshidabad only 11.06 percent students scoredmore than 60 percent marks, girls scoring 60 per cent or moremarks was only 9.66 percent. Special counseling for grown ups,workshop with mothers, remedial coaching for learners were feltnecessary for improving the situation of girl students particularly.
123With a view to improving the situation, the State Missionattempted to take measures for improving the quality levelperformance of teachers, the students and society by way ofproviding training to teachers, rationalization of teachersdeployment and promoting teacher accountability.Positive changes in the classroom was attempted byrenewing text books, developing graded work books and basalreaders, teacher recruitment establishing academic resourcesupport and seeking community performance.Action was also taken to adopt the practice of continuousand comprehensive evaluation supplemented by repeated practiceof cash exercise by the teachers to assess requirement of learnersand provide remedial teaching to slow learners.4.14.4 Teachers Training :As per records of the State Mission, position of training ofboth regular and para teachers in number of trainee days was asunder :
124YearTarget10 days regula r teacher training 20 days para tea cher tra iningAchievementPercentage ofachievement Target AchievementPercentageofachievement2006-07 23,42,000 13,56,859 57.91 24,15,100 3,00,174 12.432007-08 23,44,300 17,62,723 75.02 12,55,920 5,82,946 46.42The above showed that targets could not be achieved in any year,particularly achievement against target of para teachers training wasmiserable low.Impact of training to teachers was not evaluated so far.4.14.5 Deployment of teachers :Despite orders of the State Government regarding deployment ofteachers exclusively for teaching jobs issued in March 2007, teacherswere continued to be engaged for non-teaching jobs during teachingdays.Though there are four classes in primary schools, there were asizeable number of schools having only one/two teachers as under :YearNo.ofschoolsOne Tea cher and Two Teachers Prima ry SchoolsNo.of oneteacherschoolsNo.of twoteachersschoolsOne teacherschoolsTwo teacherschools2006-07 49,898 1,859 13,992 3.72 28.042007-08 49,965 NA NA NA NAAbout 3.72 per cent and 28.44 percent primary schools in thestate were functioning with one teacher and two teachers only,though multigrade teaching was practiced there. This made itdifficult for the teacher to undertake diverse activities forchildren.
1254.14.6 Pupil-Teacher Ratio and School Teacher Ratio :The School Teacher Ratio and adverset PTR in both primaryand upper primary education seriously affected the quality ofeducation. The ratio in primary and upper primary Governmentschools during 2007-08 was as under :PTR includingpara-tea chersPrimarySch ool-Teach erRatioPTR includingpara-tea cherUpper Pr imarySch ool TeacherRatioState 38.17 3.05 50.01 12.01Murshida bad 44.42 3.34 63.80 14.14South 24-Parganas46.49 3.15 55.81 10.99The above showed that PTR in primary schools in the twodistricts and the overall PTR in upper primary schools in the Stateand the two districts were particularly adverse.4.14.7 Teacher Accountability :In the existing system, the entire educational bureaucracybosses over the teacher. The position could be improved iofconditions such as teacher autonomy, regular academic support,satisfactory working condition, fair recruitment, appropriate PTR,elimination of non-teaching work and regular pupil evaluation,etc. could be ensured.4.14.8 Regular pupil assessment system :Continuous and Comprehensive Evaluation (CCE) is anintegral part of quality education. CCE was introduced in primaryschools. Moreover, two State Level External Evaluations calledDiagnostic Achievement Test (DAT) were also being taken at the
126end of Classes-II and IV. However, it was observed the after thetest at Class-IV, children moved to Class-V in secondary schoolsand were not available for remedial teaching.
127CHAPTER-55.1 SCHOOL GRANT :Para 30 of MFM&P snvisages that school grant would begiven to all Government and Government-aided/Cantonment/Municipal Corporation primary and upper primary schools andaided Madrasas provided that they fulfilled certain eligibilitycriteria. Financial norms of SSA prescribed that school grantamounting to Rs.2000/- per year per primary 1 upper primaryschools was admissible for replacement of non functional schoolequipment. Para 30.2 of MFM&P further provides that librarybooks for schools could also be provided from this grant. For thepurpose of eligibility for school grant, each primary and upperprimary school was to be treated as separate school even if theywere functioning from the same premises. For the year 2008-2009,PAB sanctioned Rs.5000/- per primary and Rs.7000/- per upperprimary school as school grant.The position showing physical and financial targets vis-à-visachievements in respect of school grant for the years 2005-2006 to2008-2009 (November 2008) was as given below :
128Table 34(Rs. in lakh)PrimaryPhysi calNo. ofschool2 0 0 5 -2 00 6 2 0 0 6 -2 00 7 2 0 0 7 -2 00 8 2 0 0 8 -0 9 (Sept.08)FinancialPhysi calNo. ofschoolFinancialPhysi calNo. ofschoolFinancialPhysi calNo. ofschoolFinancialTarget 4 3 3 26 8 4 6 .52 4 0 8 43 8 1 6 .86 4 9 8 98 9 9 7 .96 4 9 9 65 2 4 9 8 .2 5Achievement 4 0 0 84 7 6 1 .55 3 2 1 80 8 6 4 .20 2 9 4 36 9 4 2 .96 2 6 3 19 1 6 6 6 .3 9Pe rcentage o fshort fa l l7 .48 1 0 .04 2 .12 (+ ) 5.48 4 1 .01 5 .51 4 7 .32 3 3 .30UpperPrimaryTarget 1 3 5 87 2 7 1 .74 1 1 4 40 2 2 8 .80 9 3 8 2 1 8 7 .64 9 4 5 1 6 6 1 .57Achievement 1 3 0 35 2 3 1 .72 1 0 5 94 4 1 8 .29 5 6 1 5 1 8 7 .64 3 9 2 7 2 7 4 .94Pe rcentage o fshort fa l l4 .06 1 8 .39 7 .40 (+ )8 2 .82 4 0 .15 -- - 5 8 .45 5 8 .44Sele cte d Distr ictsPrimaryTarget 3 0 4 8 6 8 .16 3 1 7 1 6 3 .42 3 1 6 9 6 3 .38 3 7 7 1 1 5 8 .55Achievement 3 1 5 8 6 3 .16 3 1 7 1 6 3 .02 3 1 6 9 6 2 .98 3 7 7 1 1 5 8 .55Pe rcentage o fshort fa l l(+ )3 .61 7 .34 -- 0 .63 -- 0 .63 -- --UpperPrimaryTarget 7 9 0 1 5 .80 5 8 7 1 1 .74 5 1 3 1 0 .26 5 1 3 3 5 .91Achievement 4 9 6 9 .92 5 1 3 1 0 .24 5 1 3 1 0 .26 5 1 3 3 5 .91Pe rcentage o fshort fa l l3 7 .22 3 7 .22 1 2 .61 1 2 .78 -- -- -- --South 24-ParganasPrimaryTarget 3 9 6 3 7 9 .26 3 6 7 0 7 3 .40 3 6 5 6 7 3 .12 3 6 6 8 1 8 3 .40Achievement 3 5 7 7 7 1 .54 3 5 9 9 7 1 .98 3 6 5 7 3 6 .57 3 6 6 8 1 8 3 .40Pe rcentage o fshort fa l l9 .74 9 .74 1 .93 1 .93 -- 4 9 .99 -- --UpperPrimaryTarget 9 7 7 1 9 .54 8 1 2 1 6 .24 7 9 2 1 5 .84 7 9 4 5 5 .58Achievement 7 8 9 1 5 .78 7 8 4 1 5 .68 7 9 2 7 .92 7 9 4 5 5 .58Pe rcentage o fshort fa l l1 9 .24 1 9 .24 3 .49 3 .49 -- 5 0 .00 -- --The above table depicts that as against 50,255 primary and11,440 upper primary schools in 2005-06 and 49,898 primary and9,382 upper primary schools in 2006-07, the State Mission claimedand obtained school grant for 43,326 primary and 13,587 upperprimary schools in 2005-06 and 40,843 primary and 11,440 upperprimary schools in 2006-07. Hence, the grant was obtained for less
129number of primary schools, it was obtained in excess for 2,147 and2,058 upper primary schools which did not exist during 2005-2006and 2006-2007 as per records of the Mission.Achievements (as per the quarterly progress report in formAnnexure IX vide Para 92.1 of MFM&P) against physical targets in2005-2006, 2006-2007, 2007-2008 and 2008-2009 (upto September,2008) fell short by 7.48 percent, 2.12 per cent, 41.01 percent and47.32 percent respectively in respect of primary schools. Shortfallin financial achievements during these years was 10.04 percent,(+)5.48 percnet, 5.51 percent and 33.30 percent respectively.Shortfall in utilization of school grant for upper primaryschools both physical and financial was 4.06 per cent and 18.39 percent in 2005-2006, 7.40 per cent and (+) 82.82 per cent in 2006-2007and 58.45 per cent and 58.44 percent in 2008-09 (upto September,2008).Selected Districted:Murshidabad – The DPO could not utilize the grant as per thebudget provisions in respect of upper primary schools during2005-2006 and 2006-2007 to the extent of 37.22 percent and 12.61per cent (financial).
130South 24-Parganas -Shortfall in utilization of the grant inrespect of primary and upper primary schools was 49.99 per centand 50.00 per cent in 2007-2008. It was, however seen that the DPOpurchased books [for Link Library Programme] costing Rs.33.00lakh for primary and Rs.5.74 lakh for upper primary schools out ofschool grant for the year. Grants were to be utilized by the enduser during the year for which the grant was meant for wasachieved within the financial year and utilization certificatessubmitted within the date fixed therefore. Scrutiny of records ofthe Diamond Harbour South Circle Office disclosed that grants fora year were belatedly released in the succeeding financial yearthereby frustrating the purpose of the grant.Table 35Date ofreceipt o fgra nt inC LRCNo.ofschoolfor whichgra ntreceivedAmountreceivedDate ofpayment ofVEC/WEC(Rs. in lakh)No. ofschool sAmountpaid2 0 0 5 -0 6Pri ma ry 2 8 -0 9 -2 0 05 7 7 1 .54 1 2 -0 4 -2 0 06 7 7 1 .54Uppe r Pri mary 2 8 -0 9 -2 0 05 2 1 0 .42 0 5 -0 5 -2 0 06 2 1 0 .422 0 0 6 -0 7Pri ma ry 2 8 -0 8 -2 0 06 7 8 1 .56 1 6 -0 2 -2 0 07 7 5 1 .50Uppe r Pri mary 2 8 -0 6 -2 0 06 2 1 0 .42 0 9 -0 4 -2 0 07 2 1 0 .422 0 0 7 -0 8Pri ma ry 2 6 -0 3 -2 0 08 7 9 0 .79 2 4 -0 7 -2 0 08 7 9 0 .79Uppe r Pri mary 2 6 -0 3 -2 0 08 2 1 0 .21 3 0 -0 4 -2 0 08 2 1 0 .212 0 0 8 -0 9Pri ma ry 0 5 -0 8 -2 0 06 7 8 3 .95 2 9 -0 9 -2 0 08 7 9 3 .95Uppe r Pri mary 3 0 -0 7 -2 0 06 2 1 1 .47 2 0 -1 1 -2 0 08 2 1 1 .47The above table clearly depicts that excepting for the year2008-2009, grants were disbursed after 34 to 285 days from thedate of receipt by CLRC.
1315.2 TEACHER GRANT :Financial norms of SSA read with para 31 of MFM&Pprovided that grant at the rate of Rs.500/- per year per teachercould be given, subject to certain conditions, to teachers inposition of Government, Government aided, Cantonment/Municipal Corporation primary and upper primary schools andMadrassas. Teachers were required to purchase teaching learningmaterials from this grant for teaching children in classes. Thesematerials were to be properly kept in school and a register of suchmaterials was required to be maintained.The overall position of budget outlay for the State in respectof teachers Grant for the years 2005-06 to 2008-09 and actualachievement there against as per the quarterly progress reportswas as given below :
132TABLE-1Table 36(Rs. In lakh)2005-06 2006-07 2007-08 2008-09 (Sept.08)Physi cal(No. ofteachers)Financial Physi cal(No. ofteachers)Financial Physi cal(No. ofteachers)Financial Physi cal(No. ofteachers)FinancialPrimaryTarget 1,78,325 891.66 1,78,446 892.23 1,77,398 886.59 1,73,030 865.15Achievemen t 62,372 474.24 1,06,372 1,051.57 96,428 818.92 71,907 384.00%age ofshor tfall65.02 46.81 40.39 (+)17.86 45.64 7.63 58.44 55.61Upper Pr imaryTarget 1,51,309 756.59 1,41,492 707.46 1,04,482 522,41 1,13,445 567.22Achievemen t 55,988 434.24 88,004 781.11 43,661 512.29 38,557 192.55%age ofshor tfall62.72 42.61 37.80 (+)10.41 58.21 1.94 66.01 66.05Selected Dist ri ctsMu rshidabad(Rs. In lakh)2005-06 2006-07 2007-08 2008-09 (Sept.08)Physi cal(No. ofteachers)Financial Physi cal(No. ofteachers)Financial Physi cal(No. ofteachers)Financial Physi cal(No. ofteachers)FinancialPrimaryTarget 18,009 90.05 16,120 80.60 14.662 73.31 14,056 70.28Achievemen t 11,327 56.68 13,312 65.92 14,588 72.18 13,822 69.11%age ofshor tfall37.10 37.06 17.42 18.21 0.50 1.54 1.66 1.66Upper Pr imaryTarget 11,514 57.57 10,593 52.96 7,206 36.03 7,255 36.27Achievemen t 2,822 14.11 5,704 28.24 7,193 35.74 7,255 36.27%age ofshor tfall75.49 75.49 46.15 46.68 0.18 0.80 -- --Selected Dist ri ctsSouth 24-Pa rganas(Rs. In lakh)2005-06 2006-07 2007-08 2008-09 (Sept.08)Physi cal(No. ofteachers)Financial Physi cal(No. ofteachers)Financial Physi cal(No. ofteachers)Financial Physi cal(No. ofteachers)FinancialPrimaryTarget 22,031 110.16 16,718 83.59 13,750 68,75 13,165 85,82Achievemen t 9,225 45.62 8,900 20.21 13,165 65,64 5,159 25.79%age ofshor tfall58.13 58.59 46.76 39.93 4.25 4.52 60.81 69.95Upper Pr imaryTarget 14,231 71.16 12,670 63.35 8,710 43.55 8,725 43.62Achievemen t 6,584 32.92 6,584 43.43 8,445 42.22 4,377 21.88%age ofshor tfall53.73 53.74 48.03 31.44 3.04 3.05 49.83 49.84
133The above Table No. disclosed shortfall in achievements againstphysical targets in respect of Primary school teachers was 65.02percent in 2005-06, 40.39 percent in 2006-07, 45.64 percent in 2007-08 and 58.44 in 2008-09 (upto September, 2008) Short fall inachievements against financial targets was however, 46.81 percent,(+) 17.86 percent 7.63 per and 5.61 percent in these years.Shortfall in physical achievements against targets in respectof upper primary schools teachers were was 62.72 per cent in 2005-2006, 37.80 percent in 2006-07, 58.21 per cent in 2007-2008 and66.01 in 2008-2009 (upto September 2008). Short fall inachievements of financial targets was 42.61 percent. (+) 10.41percent, 1.94 and 66.05 percent respectively during these years.It was, however, noticed that there had been mismatchbetween financial and physical targets, reasons for which were noton record.Selected DistrictsMurshidabadAchievements against targets (both physical and financial) in2005-06 were 62.90 per cent and 62.94 per cent and in 2006-07,82.58 per cent and 81.79 percent in respect of primary education.In respect of upper primary education, achievements (bothphysical and financial) were 24.51 per cent and 24.51 in 2005-06and 53.85 percent and 53.32 percent only in 2006-07. As a result,6,682 and 2,808 primary school teachers and 8,692 and 4,889 upper
134primary school teachers were not paid the grant during theseyears. However, the performance in 2007-08 and 2008-09 (uptoSeptember 2008) in proved considerably with practically noshortfall.South 24-ParganasDuring 2005-06, 12,806 primary and 7,647 upper primaryschool teachers and during 2006-07, 7,818 primary and 6,086 upperprimary school teachers were not paid the teachers grant. Recordsof the DPO disclosed that instead of paying the teachers grant to3,657 primary school teachers during 2007-08, the DPO procured3,657 sets of micro microscopes at the rate of Rs.495/- eachamounting to Rs.18.10 lakh and distributed the same to as manyschools. Utility of these microscope as TLM in primary schoolscould not be justified vide para No. chapter .Detailed scrutiny of records of one Circle Resource Centre(Diamond Harbour South) disclosed that grants for 2007-08 werebelatedly released in the subsequent financial year as detailedbelow:(Rs. in lakh)
135FinancialYearDate ofreceipt ofcheque inCLRCNo. ofSchools forwhichgrantreceivedAmountreceivedDate ofpayment toSchoolAmountpaid2005-06 27-12-2005 98 1.80 05-05-2006 1.372006-07 28-09-2006 99 1.82 09-04-2007 2.082007-08 13-03-2008 100 1.98 08-09-2008 1.912008-09(tillDecember,2008)29-10-2008 100 2.41 --- ---The above table depicts the lack of seriousness of the CLRCand absence of financial management of the DPO towardsutilization of grants at the bottom level.During visit of 56 schools in two districts it was noticed thatno stock register for TLM was maintained.
136CHAPTER-66.1 MAINTENANCE GRANTPara 27 of MFM&P provided that grant for maintenance andrepair of school building would be provided only to Governmentprimary and upper primary schools having own building onreceipt of specific proposal from the school committee and afterensuring community contribution. Schools having upto threeclassrooms would be eligible for maintenance grant upto amaximum of Rs.4,000/- per school per year. While schools havingmore than three classrooms would get a maximum of Rs.7,500/- perschool per year subject to the condition that the overall eligibilityfor the district would be Rs.5,000/- per school per year.Headmasters room and office room would not count as classroomsfor the purpose. While considering the AWP&B for the year 2008-09, PAB decided (16 April 2008) that maintenance grant would beprovided through school management committee/VEC uptoRs.5,000/- per school per year in respect of schools having uptothree classrooms and schools having more than three classroomswould get upto a maximum of Rs.10,000/- per school per year,subject to the condition that the overall eligibility for the districtwould be Rs.7,500/- per school.
137The table given below depicted the overall position ofutilization of maintenance grant during the years 2005-06 to 2008-09 (November 2008) as per records of the S.P.O.:Table 37(Rs. in lakh)Physi cal(No. ofschool s )2 0 0 5 -0 6 2 0 0 6 -0 7 2 0 0 7 -0 8 2 0 0 8 -0 9 (Sept.08)FinancialPhysi cal(No. ofschool s )FinancialPhysi cal(No. ofschool s )FinancialPhysi cal(No. ofschool s )FinancialNo.of school swith bui l ding 6 1 ,407 5 9 ,151 5 9 ,411Target 4 0 ,462 2 ,023.1 0 5 8 ,673 2 ,933.6 5 5 1 ,844 2 ,572.6 6 5 9 ,416 4 ,289.2 9Achievement 3 6 ,866 1 ,826.8 4 5 0 ,560 2 ,543.6 1 3 0 ,372 2 ,300.9 4 2 2 ,863 1 ,924.7 3Pe rcentage o fshort fa l l 8 .89 9 .70 1 3 .83 1 3 .30 4 1 .42 1 0 .56 6 1 .52 5 5 .13Sele cte dDistr ictsMurshid abadNo.of school swith bui l ding 3 ,682 3 ,664 3 ,684Target 3 ,037 1 5 1 .85 3 ,684 1 8 4 .29 3 ,217 1 6 0 .85 3 ,684 2 7 6 .30Achievement 3 ,627 1 5 5 .70 3 ,684 1 8 2 .01 3 ,649 1 5 5 .58 NA 2 7 5 .56%age of short fa l l (+ )1 9 .43 (+ )2 .54 -- - 0 .06 (+ )1 3 .43 3 .28 -- - 0 .27Sou th 24-ParganasNo.of school swith bui l ding 4 ,444 4 ,448 4 ,462Target 3 ,642 1 8 2 .10 4 ,482 2 2 4 .10 4 ,034 2 0 1 .70 4 ,462 3 3 4 .65Achievement 3 ,577 1 7 8 .85 4 ,396 2 1 9 .80 4 ,034 2 0 1 .70 4 ,462 3 3 4 .65%age of short fa l l 2 9 .24 1 .78 1 .92 1 .92 -- - -- - -- - -- -The following facts emerged from the above table –(a) Though the State had 61,407, 59,151, and 59,411 Government /Government aid primary and upper primary schools buildingsin 2005-06, 2006-07 and 2007-08, The State Mission claimedand obtained maintenance grant for 40,462, 58,673 and 51,844schools these years. Again, shortfall in achievements againstfinancial targets during these yeas was 9.70 per cent, 13.30 percent and 10.56 per cent respectively. The State Mission could
138disburse 44.87 per cent of the maintenance grant for the year2008-2009 upto September, 2008.(b) PAB approved maintenance grant at the average unit cost ofRs.5,000/- / Rs.7,500/- per school per year, overall eligibilitylimit per district. While sanctioning the grant to the VECs /WECs. The District Authorities also limited the amount tooverall district limit without any reference to number ofclasses a school had.(c) The DPO, Murshidabad paid Rs.3.85 lakh in exceeds of theapproved budget for the year 2005-06.(d) The DPO, South 24 Parganas sanctioned grant in respect of3,577 primary schools amounting to Rs.178.85 lakh though hehad the fund for 3,642 schools amounting to Rs.182.10 lakh.The following further points were noticed during scrutinyof records of CLRC, Diamond Harbour, South.
139(i) Delay in disbursement of grant to WECs/VECs as under :Date of Receipt Date of disbursement E x te nt of Dela yPrimaryUpperPrimaryPrimaryUpperPrimaryPrimaryUpper Primary(in days )2 0 0 5 -0 6 2 8 -0 9 -0 5 -- 1 2 -0 4 -0 6 -- 1 9 5 --2 0 0 6 -0 7 2 8 -0 9 -0 6 2 8 -0 2 -0 8 1 6 -0 2 -0 7 0 9 -0 4 -0 7 1 4 0 2 8 22 0 0 7 -0 8 1 4 -0 3 -0 8 2 9 -0 2 -0 8 2 4 -0 7 -0 8 3 0 -0 4 -0 8 1 3 3 6 02 0 -0 7 -0 8 2 9 -0 7 -0 8 2 9 -0 9 -0 8 2 0 -1 1 -0 8 6 0 1 1 3Thus, there were delays ranging between 60 to 282 days indisbursing the amount to the WEC/VECs for utilization. Further,since the grant was not released within the financial year,utilization thereof within the year and submission of utilization asprovided in MFM&D did not arise.
140CHAPTER-77.1 Maintenance and repair of School buildingPara 27.1 of FMAP states that specific proposal by the schoolcommittee and community contribution should be ensured. Butduring visit to schools in two selected districts, viz. Murshidabadand South 24-Parganas it was noticed that neither such proposalwas submitted by the school committee concerned to the DistrictProject Office through CLRC nor any community contribution wasensured.Nature of workCumula ti veta rgeta pproved byPAB upto3 0 -0 9 -0 8WorkbegunWorkcomple te dThe following table depicts the progress made on majorrepair of school buildings for the period from 20-01-2002 to 2008-09 (till 30 t h September, 2008) under SSA in the state :Table 38Work-inprogressWork notta ken upPercenta geof worknot ta kenupMa jor re pair 4 5 9 5 1 8 9 9 3 8 7 1 5 1 2 2 6 9 6 5 8 .67C umul a tive app rov edoutlay upt o 30-0 9 -0 8Financia l ta rge t and achie vementRs.in lakhExpenditure Spill over Pe rcentage o f spilloverMa jor re pair 2 1 4 4 .6 2 7 6 3 .76 1 ,380.8 6 6 4 .39RemarksBreakup ofPri ma ry andupp erPri ma rySchool s werenot on record
141The following pictures emerges from the above table :(i)As per para 27.2 of FMAP though there is no distinctionbetween major or minor repairs and all repairs andmaintenance should be carried out within Rs.5000/- per year,detailed particulars of estimate of each school district wiseand year wise earmarked for repair were not made availablefor scrutiny of expenditure of Rs.763.76 lakh till September,2008 school wise and year wise against the estimate ofRs.2144.62 lakh.(ii) Out of the cumulative target for repair of 4595, work on 1899schools commenced of which 387 were completed and workon 1512 schools was in progress since 2001-02. The remainingschools numbering 2696 representing 58.67 per cent of thetarget approved by PAB were not taken up. As a resultRs.1380.86 lakh representing 64.39 per cent of the cumulativeapproved outlay of Rs.2144.62 lakh remained idle till 30 t hSeptember 2008. This highlights extremely low completion ofrepair work which was mainly due to (a) no initiationprocess to select suppliers of materials by VEC,/WEC, untilfunds are deposited in VEC accounts, (b) absence of regularmonitoring of the work by the engineering wing of the
142District Project Office through CLRC, and junior engineersattached to more than 2/3 circles at the sites who supervisethe work.(iii)Para 27.6 of FMAP envisages that Primary Schools and UpperPrimary Schools would be treated as separate schools for thepurpose of the maintenance grant. But no break-up of theestimates for repair of 1899 Primary and upper PrimarySchools and expenditure incurred (Rs.736.76 lakh) on eachsuch school during the period from 2001-02 to 2008-09 (tillSeptember 2008) was made available to the study Team. Assuch, the Study Team could not ascertain whether all repairsand maintenance were carried out within Rs.5000/- per yearin terms of para 27.2 of the FMAP.7.2 Murshidabad District :During the period 2005-06 and 2006-07, no budget estimateswere prepared for repair work for approval by the PAB.The following table indicates the physical, financial targetsand achievements of repair work in 2007-08 :
143Table 39(Rs. In lakh)I temAWP &Ba pprovedta rgetWorkta kenupPhysicalWorkcomple te d% ofa chie vem e ntBala ncenotcomple te d(col. ii i -col.iv)Funda pprovedFinancia l% ofCol. vi i)(I) (II ) (III ) (IV ) (V) (VI ) (VII ) (VII I) (IX) (X)Spil lover% ofspil loverRepair(P ri mary )5 7 5 7 1 0 1 7 .54 4 7 2 7 .68 0 .60(2 .17)2 7 .08 9 7 .83Repair(Up perPri ma ry)2 6 2 6 5 1 9 .23 2 1 *12.62 -- 1 2 .62 1 0 0Note: *Utilisation Certificate could not be shown to the StudyTeam(December, 2008)It would be evident from the above that only 17.54 per centand 19.20 per cent of the target for repair of primary and upperPrimary school buildings could be achieved within 31 s t March 2008Out of 47 Primary School buildings repair work of whichremained incomplete till the date of visit to the District(December, 2008), work in respect of 31 buildings was not startedand records and accounts of work relating to remaining 16buildings were not made available. Non utilization of 97.83%(Rs.27.08 lakh) of the allotted fund (Rs.27.68 lakh) was a sequel toextremely low physical performance.Similarly out of 21 Upper Primary School building meant forrepair remaining incomplete (December, 2008), work on 12buildings was not commenced and relevant records of the work ofthe remaining 9 buildings were not made available (December,
1442008). The District Project Office could not furnish any account ofexpenditure incurred for completion of the repair work on (a) 5out of 26 upper primary school buildings and (b) 9 such buildingsbeing in progress so as to ensure whether the repairs were beingcarried out within the prescribed Rs.5000/- per school per year.7.3 South 24 Parganas District :Budget for repair work relating to the period 2005-06 and2006-07 was not prepared reasons for which were not on record.The following table indicates the physical, financial targetsand achievements of repair work pertaining to 2007-08 and 2008-09(till December, 2008) :Table 40(Rs. In lakh)I temAWP &Ba pprovedta rgetWorkta kenupPhysicalWorkcomple te d% ofa chie vem e ntBala ncenotcomple te d(col. ii i -col.iv)Funda pprovedFinancia lE x penditure(% ofCol. vi i)(I) (II ) (III ) (IV ) (V) (VI ) (VII ) (VII I) (IX) (X)Spil lover% ofspil loverMa jor R epair 1 9 6 1 9 6 7 8 3 0 .79 1 1 8 7 1 .35 5 .55(7 .78)6 5 .80 9 2 .22Note:No break-up of Primary & Upper Primary Schools was onrecord.The above table depicts 39.79 per cent (78 Nos.) physicalachievement against the target (196 Nos.) set out with expenditureof Rs.5.55 lakh only being 7.78 per cent of theapproved outlay(Rs.71.35 lakh). The mismatch between utilized fund (7.78 percent) and work executed (39.79 per cent) could not be ascertainedin the absence of any accountal of expenditure on repair school
145wise concerned either at the CLRC level or District level and alsoit could not be examined whether the scale of expenditure waswithin the prescribed limit of Rs.5000/- per school per year.Records also revealed that out of the balance repair work on118 schools, work in respect of 71 schools was not started(December 2008) and the accounts of the repair work of theremaining 47 schools stated (January, 2009) to be in progress werenot made available.Apart from the above, it was noticed that Rs.65.55 lakh wasallotted for repair of 195 schools being approved by PAB in the AWP&B for 2008-09 but to work was executed tillDecember, 2008.Reasons for non-execution of the work were not stated to theStudy Team.
146CHAPTER-88.1 FREE TEST BOOKSAt primary level free Text Books are distributed to all enrolledstudents from class I-V from Government exchequer of the stateSSA norms provide for distribution of free Text Book to all girls/SC/ST children at primary and upper primary level within an upperceiling of Rs.150 per child per annum upto 2007-08 and thereafter @Rs.250 per student per year to all students.Year-wise budget expenditure on free text book from SSAfund during 2005-2007 is indicated in table below :-(Rs. in lakh)Year Approved AWP&B Expenditure C/O of utilization2005-06 5538.65 4190.67 75.662006-07 4666.71 3138.07 67.242007-08 3671.92 3334.41 90.80Reasons for non-utilisation of the grant to the extent of 24.34 percent, 32.76 per cent and 9.20 per cent during 2006-07 and 2007-08 withreference to school wise distribution to children during the respectiveperiod were not on record.District wise statement of expenditure furnished by SPO revealedthat during 2005-06 no fund was released to Kolkata, Malda &Darjeeling Gorkha Hill Council(D.G.H.C.). Similarly during 2006-07no amount was released to Murshidabad, Jalpaiguri and D.G.H.C. andin 2007-08 no fund was released to Dakshin Dinajpur and D.G.H.C.for procurement and distribution of free text books. It was observedthat SPO did not release intervention-wise fund to the district. As aresult the focus group children of the above district were deprived ofthe intended benefits.
1478.3 Murshidabad District.In Murshidabaddistrict visited by Study team it was noticedthat during 2006-07, There was a provision of 332.24lakh in theDistrict Budget for procurement of free Text Books. Despitetheprovision in the Budget, no fund was released, reasons for which werenot on record. During 2005-06 and 2007-08 there were budgetprovision of Rs.360.80 lakh and 262.51 lakh respectively forprocurement and distribution of text books. D.P.O. office allottedRs.360.60 lakh in 2005-06and 234.32 lakh in 2007-08 to differentschools for this purpose. But the school authorities, instead ofprocuring books, disbursed cash at the prescribed rates to the students.District Project office did not maintain any account of cash distributionto the students for which total amount actually spent by each schoolcould not be ascertained.8.3 South 24 Parganas DistrictIn the schools visited in the districtit was noticed that theschool authority procured text books from the Publisher/BookSellers out of the funds allotted by the District Project Office anddistributed the same to the students with the provision of returnof books after the session was over for reissue of the same in thenext year. In cases where books were already purchased by thestudents cash at the prescribed rates was reimbursed. Budgetestimates of the District were Rs.485.69 lakh, Rs.420.86 lakh and339.05 lakh during the year 2005-06, 2006-07 and 2007-08respectively.
148But in absence of any account of expenditure schoolwise, thetotal amount spent for procurement and distribution of bookscould not be ascertained.
149CHAPTER-99.1 CIVIL WORKS :Provision regarding Civil Works, Maintenance and Repair ofSchool Buildings and Financial norms thereof are containedin para 26 and 7 respectively of MFM&P. The main contentsof these norms are as under :(i)Civil Works like school buildings, additional class rooms(ACR), toilets, drinking water facilities, boundary walls,BRC/CRC buildings etc. are to be taken up under SSA.(ii)Works like office buildings for SPO/DPO, playgrounds,EGS/AIE Centres are not to be taken up under SSA.(iii)PAB has fixed an average unit cost of Rs.0.20 lakh andRs.0.15 lakh for toilets and drinking water facilitiesrespectively.(iv)Funds on civil works shall not exceed the ceiling of 33 percent of the entire project cost.(v)Cost of construction of BRC and CRC building in any districtshould not exceed 5 percent of the overall projectedexpenditure under the programme in any year.(vi)Engagement of contractors is not allowed except for theconstruction of multistory schools.(vii) School Management Committee (SMC)/VEC/Gram PanchayatCommittee on education will carry out civil works through atransparent system of account keeping(viii) Unit cost not specifically mentioned in the SSA norms shouldbe as per PWD/State schedule of rules.9.2 Mechanism for implementation of civil work.
150The Village Education Committee (VEC)/Ward EducationCommittee (WEC)/ School Management committee (SMC) is theimplementing body of civil work. The village constructioncommittee/ward construction committee (VCC/WCC) a body offive members, get the work done at site with the technical andother guidance of CLRC/Field Engineers.During visits to schools in Murshidabad and South 24-Parganas Districts, it was noticed all the members of theVEC/WEC/SMC are non-technical persons. Besides, one FieldEngineer in the category of Sub-Assistant Engineer is attached tomore than 2/3 circles and each circle has 100 or more Primary andupper Primary Schools. As such the Field Engineer is not in aposition to supervise the work in its entirety for which even aftercompletion of work, utilization certificate issued by the VECremains pending due to non-approval by the former. For instance,in Dakshin Dinajpur Maddhusudan Primary School, NamkhanaCircle in South 24 Parganas 1ACR was completed on 08-12-2008 ata cost of Rs.214772 against the sanctioned amount of Rs.1,85,000/-and the VEC issued the completion certificate on 08-12-2008 butthe Field Engineer neither recorded his technical opinion forexcess expenditure of Rs.29772/- compared to the actual fundallotted nor signed the completion certificate till the date of visitby the Study Team (January 2009) for which the U.C. remainedpending.Apart from the above, there is no system of regularmonitoring of the construction work at site either by theengineering wing of the SIS or by the District Project Office (DPO).Neither the SIS nor the DPO could furnish any accounts of actual
151expenditure on all civil works exhibiting ‘Assets’ created andwork-in-progress to the Study Team.9.3 Overall Progress of Civil Work(A)Physical ProgressThe following table indicates the progress made on civilworks for the years 2001-02 to 2008-09 (till 30 t h September, 2009)under SSA in the state:TABLE-4 1T y p e o f c o n s t r u ct i o nN e w S c h o o l b u i l d i n g( p r i m a r y ) ( N S B )C u m ul a t i v e t a r g e ta p p r o v e d b yP A B u p t o3 0 - 0 9 - 0 8W o r kb e g u nW o r kC o m p l et e dW o r kI np r o g r e s sW o rk n o tt a k e nu pP e r c e nt a g e o fW o r kn o tt a k e n u pR e m a r k s1 1 2 4 9 9 6 7 0 7 2 8 9 1 2 8 1 1 . 3 9 3 3 0 0 t a r g e t f o r2 0 0 8 - 0 9N S B ( U p p e r P r i m a r y ) 3 3 0 0 - - - - - - 3 3 0 0 1 0 0A d d i t i o n a l C l a s s 1 1 9 7 7 2 1 0 2 8 3 2 4 6 7 9 7 5 6 0 3 5 1 6 9 4 0 1 4 . 1 5r o o m ( A C R )C L R C 2 4 8 * 2 8 6 2 0 9 7 7 * R e a s o n s w i t hd e t a i l s o fe x c e s s 3 8w o r k s n o t o nr e c o r dC R C 2 7 3 4 2 4 8 4 3 5 6 2 1 2 8 2 5 0 9 . 1 0D r i n k i n g W a t e r ( D W ) 9 2 5 2 8 3 9 0 7 1 4 9 1 2 4 1 8 6 2 * 9 . 3 2 * N o t a r g e t w a sf i x e d f o r 0 7 - 0 9T o i l e t 8 9 1 8 8 8 2 8 7 5 7 7 1 2 5 1 9 0 1G i r l s ’ T o i l e t 7 8 0 1 5 8 4 8 2 4 8 3 3 3 6 5 1 9 5 3 2 5 . 0 4B o u n d a r y W a l l ( B W ) 1 7 5 3 3 6 3 2 6 6 9 7 1 3 9 0 7 9 . 2 9
152TABLE-4 2Financial ProgressActivityApp rov edfund(Rs. In lacs)(f ro m 2005-0 6 to 2008-0 98 (upt o 30-0 9 -0 8 )Expenditure Spill over %age ofspill overRemark sNSC ( Pri ma ry_ 2 6 8 3 .0 2 3 2 4 8 .8 3 *(- )5 6 5 .81 *Details of excessexpenditure not onrec ordACR 1 9 6 51 8 .91 1 3 5 62 6 .48 6 0 8 92 .43 3 1C LRC 5 0 0 .10 1 0 4 9 .4 5 *(- )5 4 9 .35C RC 5 8 8 7 .5 5 2 6 0 7 .0 3 3 2 8 0 .5 2 5 5 .72DW 1 1 5 3 .2 8 5 0 9 .86 6 4 3 .42 5 5 .79BW 1 6 6 8 .0 3 3 4 0 .00 1 3 2 8 .0 3 7 9 .60Girl s’ Toi l et 2 6 2 6 .3 5 1 4 .17 2 6 1 2 .1 8 9 9 .46Upg ra dation of SSK 3 3 0 .29 3 3 0 .29 -- --Fu rniture for UPs 1 0 0 .00 8 0 .00 2 0 .00 2 0 .00 Fund pr ovided in2 0 0 8 -0 9 without anyPhysi cal targetToi l ets & Uri nals 1 2 6 3 .9 5 2 0 5 4 .2 2 *(- )7 9 0 .27Tota l 2 1 2 73 1 .48 1 4 5 86 0 .33 6 6 8 71 .15 3 1 .43PhysicalFrom the above tables, the following position emerges:(i)No work for completion of 3300 new Upper Primary Schoolswas taken up (30-09-08) though target for this interventionwas fixed in AWP&B for 2008-09 as stated in Para B infra.(ii)The target for completion of the work of Toilets was mostlyachieved but over 25 per cent of Girls’ Toilets was not takenup.(iii) 862 cases of Drinking Water (DW) approved upto 2006-07were not started. No fresh target for DW was fixed for 2007-08.(iv)79.29 percent of the work on Boundary Wall (BW) was nottaken up (30-09-2008).(B) Further, year wise records available for 2007-08 and 2008-09revealed the following position regarding achievement vis-àvistarget :-
153(C)TABLE-4 3YearTypeofC onstructionTargetApp rov edby PABduri n g theyearWor kbegu nWor kC ompleted(%age )2 0 0 7 -0 8 ACR 3 3 2 22 3 0 5 43 8 3 1 2(2 5 .02)C LRC 2 0 2 0 1(5 )C RC 7 7 4 7 4 9 3 2 3(4 1 .73)Girl s’ Toi l et 6 5 0 8 5 8 2 6 2 4 8 3(3 8 .15)Wor k inpr og re ssWor k nottaken up%age ofwor k nottaken up2 2 2 31 2 6 7 9 8 .061 9 --4 2 6 2 5 3 .233 3 4 3 6 8 2 1 0 .482 0 0 8 -0 9 NSB (UP) 3 3 0 0 NIL NIL NIL 3 3 0 0 1 0 0ACR 9 5 4 3 1 5 0 5 NIL 1 5 0 5 8 0 3 8 8 4 .23C LRC 1 1 3 NIL 3 8 7 2 .73Toi l et 4 3 2 NIL NIL NIL 4 3 2 1 0 0Girl s’ Toi l et 1 2 9 3 2 2 Nil 2 2 1 2 7 1 9 8 .30Boun dary Wall 1 3 3 7 5 NIL 5 1 3 3 2 9 9 .62It emerges from the above that against the annual targets,work in respect of 4 interventions was completed to the extent of 5percent to 41.73 per cent in 2007-08 and no work was completed in2008-09 (till September, 2008) evidenced by the fact that 72.73percent to 100 per cent of 7 interventions was not commenced tillSeptember 2008.(C)(i)Financial ProgressOut of total outlay of Rs.2,12,731.48 lakh approved by thePAB during the period from 2005-06 to 2008-09 (upto30-09-2008), PBSSM incurred expenditure of Rs.1,45,860.33lakh leaving a spill over of Rs.66,871.15 lakh. Thus, thepercentage of shortfall in expenditure compared to theapproved outlay worked out to 31.43.(Table-II).(ii)Though excess expenditure was incurred to the extent ofRs.565.81 lakh on NSB (Primary) and Rs.790.27 lakh onToilets of Urinals, excess work was not executed. Excess
154expenditure of Rs.549.35 lakh was incurred on CLRC inrespect of which 38 items of excess works were executed.Reasons for such excess expenditure quantified by actualwork done could not be explained to the Study Team (Table-II)(iii)Percentage of ‘spill over’ compared to approved outlayranged from 20 per cent to 99.46 per cent. This was due toabsence of infrastructural facilities marked by conspicuousinadequacy of technical experts as discussed with the ChiefEngineering Advisor of the Mission.(iv) As against Rs.100 lakh approved in AWP&B for 2008-09towards procurement of furniture for UP)S, no physicaltarget was fixed. Though Rs.80 lakh was spent during theyear, PBSM could not furnish detailed particulars offurniture purchased for upper Primary Schools with name ofsuch school districtwise.9.4 Pending Civil Work :As per Minutes of 87 t h meeting with PAB held on 4 t hAugust 2006, it was decided that all pending works upto2005-06 were to be completed by 31 s t December, 2006. TheMission having not completed such work within 31-12-2006,it was again reiterated in the 99 t h Meeting of PAB held on22 n d May, 2007 for completion of the work. The Missioncommitted in the meeting with PAB on 16-04-2008) tocomplete all pending work as on June 2007 by December,2008.The Mission could not furnish any report indicatingyearwise analysis of pending work vis-à-vis each item of
155Table 44Activitywork approved in AWP&B from 2001-2002 to 2007-08.However, upon analysis of the records made available, theposition of pending work upto 2006-2007 was ascertained asfollowing:C umul a tive pending up to2 0 0 6 -0 7I nPr og re s sNottakenupTotalTargeta s pe rAWP&B2 0 0 7 -0 8 2 0 0 8 -0 9I nPr og re s sWor knottakenupTotalpendingwor kTarget a s pe rAWP&BNSB 1 0 0 1 4 5 2 4 5 NIL NIL -- -- 3 3 0 0 (new s a n c t i o n)ACR 4 6 9 2 6 4 1 8 1 1 1 10 3 3 2 22 2 2 2 31 2 6 7 9 2 4 9 10 9 5 4 3C RC 5 3 6 2 2 4 7 6 0 7 7 4 4 2 6 2 5 4 5 1 NILDW 3 6 9 1 0 4 6 1 4 1 5 NIL -- -- -- NILToi l et 3 4 0 5 6 7 9 0 7 NIL -- -- -- 4 3 2Girl s’ Toi l et No work sh own 6 5 0 8 3 3 4 3 6 8 2 4 0 2 5 1 2 9 3The above table reveals the following picture :(i)The work relating to NSB remained pending to the extent of245 as on 31-12-2007 which was not included in the Budget 2007-2009. Against 24910 pending work of ACR as on 31-03-2008, only9543 work were approved in 2008-09. Similarly against 4025pending Girls’ toilet as on 31-03-2008, only 1293 numbers wereapproved in 2008-09. The expenditure incurred on abandonedwork-in-progress upto 2007-08 of NSB, ACR, Girls’ Toilet & DWnot included in the Approved AWP&B for 2008-2009 could not befurnished with reasons for non-inclusion of at least the Work-inprogressupto 2007-08.9.5 Status of Civil work in Murshidabad DistrictThe table below indicates the physical, financial targets andachievements of Civil work during the period from 2005-06 to2007-08 :
156Table 45(Rs. In lakh)2 0 0 5 -2 00 6Type o fI nstructionTargeta pprovedby PABWorkta kenupPhysicalWorkcomple te don 31-1 0 -0 8% ofa chie vem e ntBala nce)ApprovedOutla yFinancia lE x penditure% ofCol. vi i)(I) (II ) (III ) (IV ) (V) (VI ) (VII ) (VII I) (IX) (X)Spil lover% ofspil loverNSB(P ) 1 2 1 2 1 1 9 1 .66 1 4 8 3 2(6 6 .7)ACR (P) 9 0 0 8 8 9 8 8 1 8 8 .19 8 1 5 1 1 .0 3 1 4 7 9(9 7 .86)ACR (UP) 3 0 0 3 0 0 3 0 0 1 0 0 - 5 1 5 .10 4 6 7 .50(9 0 .76)DW(P ) 1 0 0 9 3 9 3 9 3 7 1 4 .88 1 3 .44(9 0 .33)Toi l et (P)Toi l et (U P )5 0 0 1 8 63 1 11 8 43 1 09 8 .80 6 6 5 .101 0 8 .855 8 .14(8 9 .2)1 0 1 .851 6 3 3 .33 2 .03 2 .144 7 .60 9 .241 .44 9 .67771 0 .756 .432 0 0 6 -2 00 7Type o fI nstructionTargeta pprovedby PABWorkta kenupPhysicalWorkcomple te don3 1 -1 0 -0 8% ofa chie vem e ntBala nce)ApprovedOutla y(Rs. In lakh)Financia lE x penditure% ofCol. vi i)(I) (II ) (III ) (IV ) (V) (VI ) (VII ) (VII I) (IX) (X)*NSB 1 5 3 2 1 .33 1 3 1 2 1 2 1 0 0ACR(P) 3 0 0 0 2 4 8 7 2 4 0 2 8 0 .60 5 9 8 4 2 2 7 .9 0 3 9 1 3 .4 0 3 1 4 .50 7 .43(9 2 .57)ACR(UP) 1 6 6 0 1 2 5 1 1 2 3 1 7 6 .90 3 6 9 2 1 2 6 .7 0 1 9 5 6 .7 0 1 7 0 8(9 2 )C RC 1 5 0 1 3 5 9 1 6 0 .60 5 9 2 7 0 .00 1 3 8(5 1 .11)1 3 2 4 8 .80Spil lover% ofspil lover2 0 0 7 -2 00 8Type o fI nstructionTargeta pprovedby PABWorkta kenupPhysicalWorkcomple te don 31-1 0 -0 8% ofa chie vem e ntBala nce)ApprovedOutla y(Rs. In lakh)Financia lE x penditure% ofCol. vi i)(I) (II ) (III ) (IV ) (V) (VI ) (VII ) (VII I) (IX) (X)ACR (P) 2 1 8 1 2 1 8 1 5 0 3 2 3 .06 1 6 7 8 4 0 3 4 .8 5 4 8 6 .55 3 5 4 8 .3 0 8 8(1 2 )ACR (UP) 1 0 4 3 1 0 4 3 4 3 8 4 1 .70 6 0 5 1 9 2 9 .5 5 1 6 6 .50 1 7 6 3 .0 5 9 1 .37(8 .63)Toi l et (P) 2 0 0 2 0 0 4 1 2 0 .50 1 5 9 6 0 .00 1 .80 5 8 .20 9 7(3 )Toi l et (U P ) 5 0 5 0 8 1 6 4 2 1 5 0 .30 1 4 .70 9 8(2 )C RC 5 0 5 0 1 7 3 4 3 3 1 0 0 1 2 8 8 8 8(1 2 )ACR forNew UP6 0 0 6 0 0 Nil 0 6 0 0 1 1 1 0 .0 0 -- 1 1 1 0 .0 0 1 0 0Spil lover% ofspil lover
157The following position emerges from the above table :(i)None of the different items of work could be completedbefore 30 t h September 2008. Even on this date percentage ofspill over amount ranged from 2.14 per cent to 33.3 per cent,7.43 to 100 per cent and 88 to 100 per cent in 2005-06, 2006-07and 2007-08 respectively.(ii)During 2006-07, out of 15 new schools buildings, approved,only 3 schools were taken up and 2 were completed in 2008-09 but no utilization certificate was submitted.(iii)Besides as per AWP&B for 2008-09 an amount of Rs.1019.95lakh was approved for construction of 205 NSB(P), 75 Toilets(P) 40 Toilets (UP) and repair of 154 Primary and 33 UpperPrimary Schools. But as discussed with the District ProjectOffier (DPO) no fund was released by the DPO on the groundthat formation of new VEC was not completed. As aconsequence no work could be commenced (December 2008).The ground of the DPO was not tenable since the Districtauthority in consultation with the SIS and the existing VECcould have commenced the work.The above fact and figures point out poor performanceof civil work adversely affecting the objective of SSA. Therewas no system of monetaring the civil work to ensurecompletion of the work within the scheduled time.9.6 Status of Civil work in South 24 ParganasThe Table below indicates the status of Civil work in South24 Parganas District during 2005-08 :(Rs. In lakh)
1582 0 0 5 -2 00 6Type o fI nstructionTargeta pprovedby PABWorkta kenupPhysicalWorkcomple te don 31-1 0 -0 8% ofa chie vem e ntBala nce)ApprovedOutla yFinancia lE x penditure% ofCol. vi i)(I) (II ) (III ) (IV ) (V) (VI ) (VII ) (VII I) (IX) (X)Spil lover% ofspil loverNSB(P )ACR2 81 2 0 02 61 6 8 61 91 6 7 96 7 .85Excess9Excess4 7 91 0 4 .002 8 6 6 .2 07 8 .80(7 5 .78)2 4 3 9 .8 1(8 5 .13)2 5 .204 2 6 .392 4 .231 4 .872 0 0 6 -2 00 7Type o fI nstructionTargeta pprovedby PABWorkta kenupPhysicalWorkcomple te don 31-1 0 -0 8% ofa chie vem e ntBala nce)ApprovedOutla y(Rs. In lakh)Financia lE x penditure% ofCol. vi i)(I) (II ) (III ) (IV ) (V) (VI ) (VII ) (VII I) (IX) (X)Spil lover% ofspil loverACR 3 5 0 0 2 4 9 9 2 2 0 9 6 2 .22 1 3 4 1 4 2 4 8 .3 0 2 8 9 8 .9 8(6 8 .29)1 3 4 9 .3 2 3 1 .762 0 0 7 -2 00 8Type o fI nstructionTargeta pprovedby PABWorkta kenupPhysicalWorkcomple te don 31-1 0 -0 8% ofa chie vem e ntBala nce)ApprovedOutla y(Rs. In lakh)Financia lE x penditure% ofCol. vi i)(I) (II ) (III ) (IV ) (V) (VI ) (VII ) (VII I) (IX) (X)Spil lover% ofspil loverACR 3 4 1 6 3 4 1 6 1 6 3 5 4 7 .86 1 7 8 1 6 3 1 9 .6 0 2 9 1 5 .7 0(4 6 .14)3 4 0 3 .9 0 5 3 .86Girl s t oi l ets 1 5 0 1 5 0 6 7 4 4 .66 8 3 4 5 .00 3 .04(6 .76)4 1 .96 9 3 .24The following position emerges from the above table :(i)During 2005-06, 9 New School buildings (Primary) could notbe completed till 31-10-2008. However 479 excess ACRs wereconstructed within 31-10-2008 incurring 85.13 per centexpenditure of the total outlay.
159(ii)During 2006-07, 2209 ACR1 against the target (3550 Nos.)were constructed during 2008-09 with an expenditure to theextent of 68.24 per cent of the total outlay.(iii)During 2007-08, construction of ACRs and Girls toiletscompleted as on 31-10-2008 ranged between 44.66 per centand 47.86 per cent.There was no proper monitoring system at the Statelevel and district level to supervise the execution of civilwork and ensure completion of the work within the targetdate for achieving the objective of SSA.(iv)Besides during 2008-09, an amount of Rs.43.36 crore wasapproved by PAB for completion of 250 NSB (UP), 1524 ACR,150 Girls’ toilets, 50 boundary walls and major repair of 195school buildings. But during discussion with the DPO andthe Engineer concerned, (December 2008) it was learnt thatno fund was released to commence the work due to nonformation new VECs which however started functioningfrom August 2008. The ground was however, not tenablesince the District Authority in consultation with the SIScould have started the work through the previous VECs, toattain the goal of SSA.9.7 Construction of School building for Sishu <strong>Shiksha</strong> Kendra(SSK)Government of India sanctioned an outlay of Rs.60 crores inthe Annual Work Plan and Budget for 2005-06 for construction of3000 upgraded SSK building. The State Implementation Society
160(SIS) released lump sum of Rs.60 crore to the Paschim Banga RajyaSishu Siksha Mission (PBRSSM) during 2005-06 (Rs.57.63 crore)and 2006-07 (Rs.2.37 crore) without prescribing a time limit forcompletion of the work. Records revealed that there was nomonitoring of the work by the State Society. PBRSSM did notsubmit any Utilisation Certificate till 2007-08. The Director ofPBRSSM intimated the SIS in July 2008 that 2547 buildings againstthe target of 3000 were completed with an expenditure of Rs.51.60crore incurred upto 25 t h July 2008. However, PBRSSM did notintimate the expenditure incurred on work-in-progress comprising133 buildings constructed upto ground level, 53 nos. upto plinthlevel, 43 nos. upto lintal level, 89 nos. upto roof level, 48 nos. uptoroof casting level and 86 buildings stated to be completed soon.Construction of 1 building was not taken up. Further PBRSSM didnot intimate the location of 2547 SSKs completed and 452 nos.under construction ensuring that there was no primary schoolwithin 1 Km from the SSKs which parameter was fixed by theDepartment of Panchayats and Rural Development, Government of<strong>West</strong> <strong>Bengal</strong> in March 2003. No record was made available to theStudy Team indicating whether the said criteria was adhered towith reference to location of SSKs and primary schools concernedbefore releasing the fund to PBRSSM. This again is a pointer to theabsence of the system of monitoring and poor MIS. Apart from theabove, no record was made available indicating whether 2547 SSKsstarted functioning and how many children were inducted.Besides, Darjeeling Gorkha Hill Council (DGHC) was not in aposition to utilize SSA fund of Rs.1.36 crore provided by PBRSSMfor construction of 68 SSKs which were diverted to Siliguri (10)
161Uttar Dinajpur (30) and Nadia (28). But construction of these SSKbuildings was not taken up since sites were not identified.Thus it would be evident from the above that a sum ofRs.8.40 crore (Rs.60 crore – Rs.51.60 crore) was lying with thePBRSSM since 2005-06 and even after efflux ion of about threeyears, the purpose for which the fund was released was notachieved resulting in non-attainment of the goal of SSA.CHAPTER-1010.1 Purchase ProcedurePROCUREMENT<strong>West</strong> <strong>Bengal</strong> SSA State Missin had not ground any specificprocurement procedure for the purchase of stores items andacquisition of assets. In the absence of any such laid down systemfor procurement of stores, the state Mission authority followed thepurchase procedure contained in the Manual on FinancialManagement and Procurement (MFM&P). But in realityinstructions/procedure outlined in the Manual Vide para 117 ibidwere not meticulously followed. The points noticed in the courseof study are mentioned as under :10.2 COMPUTER AIDED LEARNING
162It was revealed from records that budgetary provisionsunder SSA for CAL were being made in the district Annual WorkPlant & Budget (AWP&B) since 2004-05-indicating introduction ofcomputer Aided Learning in upper Primary schools (UPS) underSSA since then (2004-05), Based on district AWP&B, ProjectApproval Board (PAB) accorded approval for funds againstdifferent interventionsunder SSA. However, State Project Officedid not release fund to district intervention wise and insteadreleased lump sum in installments. :In the year 2004-05, PAB accorded for the first time approvalof Rs.283.00 lakh for the innovative activity - “Computer AidedLearning (CAL)” under SSA in <strong>West</strong> <strong>Bengal</strong> State Mission.Against Rs.283.00 approved Mission incurred Rs.60.00 lakh only in theintervention without indicating in the available records , the numberand name of districts and /or school s covered under CAL programmeby the above amount. However, status of CAL programme under SSAfor the years 2005-06 to 2007-08 is detailed hereunder :Y e a r P h y s i c a l F i n a n c i a l ( R s . i n l a k h ) A c t u a l a sp e r A / c s .P A B a p p r o v a l F u n dA c h i e v e m e n tT a r g e tA c h i e v e m e n tr e l e a s e d f o rC A L b y S P Oi . e . r e c e i v e db y D P OS c h o o l s T e a c h e r S c h o o l s T e a c h e r s2 0 0 5 - 0 6 N A N A 1 7 7 2 9 6 2 8 1 . 2 3 N A 1 5 7 . 7 9 1 5 7 . 7 02 0 0 6 - 0 7 N A N A 1 9 9( r e p o r t e d5 2 8( r e p o r t e d3 0 0 . 0 0 N A 2 9 3 . 8 0( r e p o r t e d )2 5 0 . 5 02 0 0 7 - 0 8 1 0 0( r e p o r t e d )4 0 0( r e p o r t e d )8 0( r e p o r t e d )6 5 2( r e p o r t e d )3 0 0 . 0 0 N A 2 7 7 . 8 2( r e p o r t e d )4 3 . 4 02 0 0 8 - 0 9 3 0 0 9 0 0 N A N A * 1 0 0 0 . 0 0N A N A 4 5 4 . 8 2N o t i n c l u d e dT o t a l 4 0 0 1 3 0 0 4 5 6 1 4 7 6 8 8 1 . 2 3 N A 7 2 9 . 4 1 4 5 1 . 8 4
163i) It was revealed from the records that computers procured (NA)and schools covered (177 nos) under CAL during 2005-06 did notinclude upper Primary Schools under Murshidabad district. 10numbers of upper Primary Schools of Murshidabad district wereprovided with 50 numbers (5 nos. per Ups) during 2005-06.ii) 24 Parganas (South) district, instead of procuring 50 nos.computer for CAL under SSA per year, procured all 150computers during 2007-08 pertaining to the years2005-06 to2007-08.iii) PAB approval of Rs.7.99 lakh, Rs.11.24 lakh and Rs.7.00 lakhwasreceived for Darjeeling, Coochbehar, Siliguri districtsrespectively for the year 2005-06 instead of Rs.15 lakh each.iv) As already stated that SPOdid not release funds interventionwise,the actual amount received by the districtstowards CALeach year was not available. However, expenditure on CAL wasincurred on the basis of budget provision made at districtProject Office.It may be seen from the above table that against an outlay(PAB approved) of Rs.881.23 lakh for the period 2005-06 to 2007-08, the Mission incurred expenditure on CAL of Rs.729.41 lakhleaving a wide gapin the Coverage of Schools/students underCAL (17.23%) as reported. However, actual achievements as perannual accounts (51.27%) were far less than the reportedachievements as above. The reasons for such variation were notfound to be analysed and recorded. Non–utilization of fundapproved annually by PAB for the intended purpose for theparticular year (South 24 Parganas did not utilize the approvedoutlay for the year 2005-06 and 2006-07 in the same year on CAL)resulted into non-fulfillment of the SSA objectives for access to
164and improving upon quality of learning in elementary educationand negated the alleviation of the effort-making universalisationof Elementary Education (UEE) useful and relevant to lifethrough CAL programme.10.3 (A) STATUS OF COMPUTER AIDED LEARNINGIN THE SELECTED DISTRICT -MURSHIDABADTable below indicates the position of CAL in the upper Primary schoolsin the district of Murshidabad during 2005=-06 to 2007-08YearPABappr ovedFund(Rs. inlah)BudgetaryPr ovision inthe Distt/.(Rs.inlakh)2005-06 15.00 13.002.00Fundreceivedfr om SPOfor CAL(Rs.inlakh)Expenditureincurr ed(Rs.inlakh)NA 17.715(onlypr ocuremen tof computers& accessories)No.ofUPSNo.ofUPScoveredNo.ofTeacherTrained513 10 Nil2006-07 15.00 15.00 NA 14.955 513 10 802007-08 15.00 15.00 NA 15.068 513 10 120Total 45.00 45.00 NA 47.738 513 10 200It emerges from the above table that during last three years2005-06-2007-08 only 30 UPS out of total 519 UPS constituting 5.85 percent (UPS) were covered under CAL in the district. Total nos. ofteachers trained on CAL was only 200 ( 80 nos. in 2006-07 and 120nos. during 2007-08) while no teachers were trained in CAL during2005-06. In absence of any trained teacher in CAL how the studentswere imparted training in CAL during 2005-06 was not recorded. Asreported ,out of 4,63,108 nos. of student enrolled in Ups only 32449(Average) nos. of students constituting only 7 per cent were coveredunder CAL.
165Further, as reported by the District Project Office (Murshidabad)no teaching learning programme was fed into the computer forexposure of students. This shows that the district didnot makenecessary effort to make teaching learning through computer effectiveand interesting which is one of the objectives of CAL.10.3 (B) Unplanned procurement of computersIn terms of para 38 of Manual on Financial Management &Procurement (MFM&P)the innovative programme for computereducation for upper primary level would include expenditure onProvision of computer and its accessories, training to teachers acomputer education ; computer stationary etc. It also provided that theceilingof Rs.15 lakh prescribed in the norms for the programmedshould strictly be adhered to.The procurement and school wise distributing of computer andaccessories of Murshidabad district during 2005-06 to 2007-08 aredetailed below :-Year Items Procured Total Amount No. of UPSinvolved2005-06 50 Nos. ComputerRs.17,17,500 1050 Nos. UPS10 Nos. Modem2006-07 40 Nos. computerRs.14,00,000 1040 Nos. Ups2007-08 50 Nos.Computer50 Nos. UPS10 Nos. ModemRs.13,99,250 10
166Besides ,an amount of Rs.1,96,370 was spent for training of200 teachers for computer education during 2006-07-Rs.89,250/- for 80teachers and during 2007-08 (Rs.1,07 lakh for 120 teachers).Following points emerge from the above.i) No chair/table specially designed for setting and operationof computerwere procured and supplied to schools withcomputer during 2005-06 to 2007-08 nor any cost estimateor actual expenditure on this was included in the CAL asrequired under para 38 ofMFM&P. Absence of speciallydesigned table/chair might expose the computer to earlyloss of effective life and/or damage.ii) Printers were procured during 2005—6 and 2007-08without ascertaining their utility/requirement in CAL in asmuchas it was noticed in the schools visited that theprinters were not being utilized for CAL and instead usedfor official purposes. No printers were ,however, procuredand supplied to school during 2006-07.iii)During 2005-06, the ceiling of Rs.15.00 lakh (as laid downin MFM&P) was exceeded by Rs.2.72 lakh. The amount wasmet out of diversion from other fund (Teachers training).No other cost like teacher training in CAL , cost ofspecially designed chair/table for computer, computerstationery etc. were included in the total expenditure onCAL. No teachers were trained inCAL during the yearthough.iv)10 Nos. of Modem were procured along with computerduring 2005-06 without assessing their necessity in CAL atelementary level. It was learnt from the school authoritiesthat modems procured during 2005-06 were not being usedand lying idle in the schools where those were supplied .Reasons for procurement of modems were not recorded.
167v) The actual expenditure incurred respectively during 2005-06, 2006-07 and 2007-08 were Rs.17,71,500/- (excludingTeacher training, costof specially designed chair/table,computer stationery etc.), Rs.14,89,250/- (excluding costof specially designed chair/table and computer stationeryRs.15,06,250/-…(excluding cost of specially designedchair/table and computer stationery etc.).It was observedthat had the cost of all itemsincluded in the expenditure on CAL programme in terms ofMFM & P (Para 38) ,the expenditure would have quiteevidently exceeded the ceiling of Rs.15.00 lakh every year.The above particulars are pointer to the factsthatthe computers along with accessories (excluding otherrequisites) were procured without properassessment,planning and specific strategy.10.3 STATUS OF COMPUTE R AIDED LEARNING(C)IN THE SELECTED DISTRICT SOUTH 24PARGANASTable below indicates the (reported) position of CAL in the upperprimary schools in the district of South 24 Parganas during 2005-06 to2007-08.YearPABappr ovedFund(Rs. inlakh)BudgetaryPr ovision inthe Distt.(Rs. in lakh )Fundreceivedfr omSPO forCAL(Rs. inlakh)Expenditureincurr edNo. ofUpsNo ofUPScoveredNo. ofTeacherTrained2005-06 15.00 15.00 NA 12.24 10 402006-07 15.00 15.00 NA 12.24 10 392007-08 15.00 15.00 NA 13.48 10 -Total 45 45 NA 37.96 30 -It was revealed from examination of records that reported status ofCAL in UPS in the district as above was far from reality. No computers
168were procured and suppliedduring 2005-06 and 2006-07. Hence noexpenditure was incurred nor any student was benefited during thesetwo years. The district office procured & distributed 100 computers to20 schools during 2007-08 out of the fund approved by PAB for 2005-06and 2006-07. Order for 50 computers projected for the year 2007-08 wasplaced on 20.03.2008.Thus computers procured in the year could beprovided during the academic year 2007-08. The actual position of CALin UPS during the period 2005-06—2007-08 is detailed below :Year2 0 0 5 -0 62 0 0 6 -0 72 0 0 7 -0 8PABa ppr ovedFund(Rs. inl a kh)Budgeta ryPr ovisi on inthe Distt.(Rs. in lakh)Expend.No ofUPSNo. ofUpscovered1 5 .00 1 5 .00 Nil Nil Nil1 5 .00 1 5 .00 Nil Nil Nil1 5 .00 1 5 .00 3 7 .96*(2 4 .48+1 3 .48)No ofTeacherTra i nedRemark s7 9 4 2 0 * 7 9 1 0 0 nos. com puterpr ocureda nddistri b uted duri ng2 0 0 7 -0 8 & expdr.i ncur red on C ALRs.24.48 l a kh whileord er f or 5 0 nos.comp uter placed on2 0 .03.2 0 08 forRs.13.48 l a kh coul dnot b e dist ri b uted i n2 0 0 7 -0 8It was observed that the District Project Office claimed tohave covered 4944 children during 2005-06, 5767 children during 2006-07 and 7951 children who were benefited from this CAL programme.But fact remains that no computer was procured during 2005-06 and2006-07 and for the year 2007-08, procurement order for computer wasplaced on 20.03.08 which was not supposed to reach the targetschools/students with the academic year 2007-08.Hence, the number of beneficiaries recorded by the districtProject office was not correct and thereof, not acceptable.
169Procurement of Computers in contravention of SSA norm.SSAprovided that innovative programme for CAL in the UpperPrimary level would include expenditure on provision of computer andits accessories, training of teachers in CAL. Computers stationery etc.Also the ceiling of Rs.15.00 lakh for the purpose prescribed in thenorms should strictly be adhered to (MFM&P… Para 38) . It wasfurther provided (MFM&P-Para 441 that in a particular year, if anoutlay approved was not spent fully, the same would becomes outlaysaved and would be taken as spill over to subsequent years andthe district were required to prepare plan every year along with theAWP & B in the following format.Activity(CAL)Approved last ExpenditureyearPhy Fin Phy FinSpilloverLapseAnnexure IV of MFM&P (Para 44)It emerges from the above format that if spill over would not beproposed in the PAW&B and got approved, the unpsent-amount wouldlapse.It was seen from the records that PAB accorded fresh approvedof Rs.15.00 lakh each year to the district (South 24 Parganas) from2005-06 to 2007-08 without allowing spill over of the unspent fund ofthe previous years in respect of the innovative activity (CAL). Thus, asper the above format (Annexure IV of Para 44-MFM&O). The unspentamount of Rs.30.00 lakh of the previous two years 2005-06 and 2006-07was lapsed and was not available in the year 2007-08 for performingthis activity (CAL).The district project office (South 24 Parganas) , however, treatedthe amount ofRs.30.00 lakh as spilled over from the previous two
170years (2005-06 and 2006-07) and utilized Rs.24.48 lakh out of thisamount (of Rs.30.00 lakh) for CAL activity during 2007-08 althoughthe fund (Rs.30.00 for CAL for 2005-06 and 2006-07) was already lapsedin terms of 2005-06 and 2006-07) was already lapsed in terms of para44 ibid (format at annexure IV). The district project office had,therefore, violated both the provisions at para 38 and 44 of MFM & P– firstly by utilizing lapsed fund (para 44-annexure IV and secondlyby exceeding the ceiling of Rs.15.00 lakh annually forthis activity(para 38). This was possible due to poor reporting system and back ofproper monitoring and absence of internal checks also due to release offund by SPO in lump instead of activity wise (intervention wise) in asmuch as diversion of fund could easily be made from one interventionto others.Against fresh outlay of Rs.15.00 lakh approved by PAB forcomputer Aided Learning (CAL)activity for the year 2007-08 ,theDistrict Project Office, South 24 Parganas placed order forprocurement of 50 nos. computer with accessories on 20.03.2008 i.e. atthe fag end of the financial as well as academic year (2007-08).It was observed from the available records that thepurchase order (for the computer) was processed without theprocurementnorms laid down in the MFM&P (117 ibid) no pressadvertisement or other means of open tender inviting price Quotationwas fluted forOffice (DPO),ascertaining competitive rates. The District Projectinstead, placed order on M/s. Supertron ElectronicsLimited who was selectedby the Zila Parisad for procuring theircomputer without ascertaining competitive rtes even from the market. Itwas alsonot ascertainable from the available records the procedurefollowed by Zila Parisad for selection of supplies in as much as DPO,South 24 Pargans incurred an excess amount of Rs.1.24 lakh for 50computer that earlier procurement. While the earlier procurement price
171was 12.24 lakh for 50 computers, Rs.13.48 lakh was incurred forpurchase of 50 computer at the selected rate of Zila parisad.Incidentally, the price of computes was showing a downward trend, buteven a repeat order would have saved DPO of Rs.1.24 lakh towardsprocurement of Computer.10.4 PURCHASE OF MICRO-MICROSCOPEUnder SSA norm, a Teacher’s Grant, Rs.500 per teacher peryear is admissible to all primary and upper primary teacher forthe purpose of Teaching and Learning Materials(TLM) as perrequirement of the teachers.It was, however, noticed that in South 24-Parganas Districtthis grant was not released by the D.P.O. to 3657 primary schoolsduring 2007-2008. Instead 3657 Micro-Microscopes were procuredwithout any tender from suppliers, Micro Instrument, Howrah at acost of Rs.18.10 lakhs paid on 31 s t March,2008. The instrumentswere subsequently delivery to primary schools.It was observed that neither any sanction order from SPDand approval of the District Purchase Committee were on recordin respect of this purchase nor post-facto sanction or approval wasavailable. It was noticed that Director of School Education, <strong>West</strong><strong>Bengal</strong> State (July 2008) to the SPD that the Microscope was good
172and effective for the students, if group viewing of the magnifiedobjects could be arranged.However during visit to schools it was observed that theinstruments were of no use to the students of primary schoolwhere group viewing of Magnified object was not possible due toabsence of infrastructure in rural area.Thus, the procurement of microscope in unplanned mannerand without assessing the necessity of primary students did notserve the purpose of SSA objective.10.5 PROCUREMENT FOR NON SSA PURPOSERecords reveled that two computers valued Rs.0.96 lakhand one printervalued Rs.0.17 lakh procured out of Budget ofSPO during 00602007 was installed in the Chamber of MIC(SE)W.B. on 11 t h September 2006.Similarly, in Murshidabad District one steel Almirah valuedRs.0.14 lakh and one photo copier machine valued Rs.0.71 lakhprocured from SSA fund was handed over to D.M. Murshidabadand D.I., of Schools (S.E.) Murshidbad respectively for their officeuse during 2007-08.PROCUREMENT OF ADDITIONAL LEARNING MATERIAL(SOUTH 24 PARGANAS DISTRICT)
173Records revealed that there was a provision of Rs.308.25lakh in the AWP&B of DPO, South 24 Parganas District for theyear 2007-08 under the sub-head “Remedial Teaching ”for out ofschool children. Out of this fund an amount of Rs. 76.77 lakh wasspent for printing of ILIP package, books for Bridge course,teachers’ salary etc. Out of the balance amount of Rs.231.48 lakh,an amount of Rs.229.50 lakhwas paid by the DPO to 51 CLRs ofthe District @ Rs.4.50 lakh per circle on an adhoc basis on 27 t hMarch 2008 without assessing any requirement of each CLRC.The decision to allot the fund to all CLRCs at the fag end ofthe year to avoidlapse of budget grant resulted in violation ofpara 20.1 (Annexure II – Norm No. 19) which envisages TeachingLearning Material grant of Rs.5000 per year of reach CLRC.Besides, no accounts of expenditure incurred by each circlefor the procurement of additional learning materials school wisewith details of such materials and records of tenders floated couldbe furnished to the Study Team (January 2009).PROCUREMENT OF MATERIAL FOR CWSN(MURSHIDABAD DISTRICT)Records revealed that the SPO released the following fundsto DPO , Mushidabad for procurement of materials for CWSN.
174[Amount in lakh]Date of release Amount released Amount utilized Amount not utilized tillDecembe r2 0 0 8(i ) 2 1 -0 9 -0 4 0 .72 0 .42 0 .30(i i ) 2 7 .03.0 7 4 1 .36 2 0 .22 2 1 .14Regarding non-utilisation of Rs.21.44 lakh, the DPOstated that the amount of Rs.0.30 lakh was kept for purchase ofresource materials being under process and tender was invited on9 t h August 2008 for the purchase of stationary articles etc. forutilization of the balance amount on Rs.21.,14 lakh which was notfinalized till the date of visit by the Study Team (December2008) :This brings into focus abnormal delay in procurement forCWSNcausing adverse effect on the implementation of SSAprogramme. The SPO did neither monitor the procurement nor callfor the utilization certificate.
175CHAPTER-1111.1 NATIONAL PROGRAMME FOR EDUCATION OF GIRLSAT ELEMENTARY LEVEL (NPEGEL)11.1(i)A new Programme called National Programme for Educationof Girls at Elementary Level (NPEGEL) was introduced foradding additional components for education of Girls atelementary level under the umbrella of SSA, but with adistinct identity. The scheme is applicable to EducationallyBackward Blocks (EBB) where the level of rural femaleliteracy is less than the National level and the gender gap isabove the National average.(ii) The objectives of NPEGEL were -(a) to provide for blocks’ focused projects for girls atrisk/difficult circumstances with clearly defined outforms.(b) to develop and promote facilities to provide access andto facilitate retention of girls and to ensure greaterparticipation of women and girls in the fields ofeducation.
176(c) to improve the Quality of education through variousintervention and to stress upon the relevance andQuality of girls’ education for their empowerment.iii) The assistance under this component would be as per theparameters of SSA i.e., in the ratio of 75:25 between GOI andthe State Government during X five year plan upto 2006-2007. During XIth plan it would be 65:35 for the 1 s t two years2007-2008 and 2008-2009, 60:40 for the 3 r d year 2009-201055:45 for the 4 t h year i.e. 2010-2011 and 50 : 50 thereafterfrom 2011-2012 onwards. The Programme envisagedprovision for forming a Model cluster schools for girls, Lifeskill training for girls, Remedial coaching camps for girls etc.to supplement the usual mode of activities on Girls’Education.iv) In <strong>West</strong> <strong>Bengal</strong>, initiative for implemention of the Scheme –National Programme for Education of Girls at ElementaryLevel (NPEGEL) were taken up in the year 2003-2004.NPEGEL was launched in 86 Educationally Backward Blockswith 172 clusters distributed in 12 districts of the Statethrough Video Conference on 29-09-2003. Actual activities
177started during 2004-05 in 11 districts which were stated to beonly fuctional in that year.The districts identified were Bankura, Birbhum Cooch Behar,South 24 Parganas, North 24 Parganas, Jalpaiguri, Malda, Purulia,Uttar Dinajpur, Paschim Medinipur and Siliguri. During this year(2004-2005), fund was distributed to 1030 cluster covering 57 EBBin the 1 districts. 169 schools were identified as clusters ResourceSchools for NPEGEL and construction of cluster Resource Centrestarted in 33 schools.11.1.2 Irrational IdentificationAs stated in para (i) Supra ‘NPEGEL’ is applicable toEducationally Backward Blocks (EBB) where the level of ruralfemale literacy is less than the national average and gender gap inliteracy is above the national average. The average of nationalrural female literacy is 46.13% (2001 census) and the nationalaverage gender gap in literacy is 21.59% (census 2001).Against the above national average, the status of the blocksin the average rural female by literary rate in the districts of <strong>West</strong><strong>Bengal</strong> is indicated below :Districts Identified forImplementation of the Scheme (A)% of rural femaleliteracy% of Gender gapin literacy1. Bankura 50.1 27.40
1782. Birbhum 50.35 19.363. Cooch Behari 57.04 18.164. South 24 Parganas 67.4 20.165. Jalpaiguri 47.97 20.746. Malda 38.85 17.577. Purulia 33.91 37.038. Uttar Dinajpur 30.77 21.979. North 24 Parganas 61.71 12.2210. Paschim Medinipur 63.63 19.3311. Siliguri 56.14 (-) 8.25Districts not Identified forImplementation of the Scheme (B)% of rural femaleliteracy% of Gender gapin literacy1. Murshidabad 46.37 13.072. Dakshin Dinajpur 42.54 18.183. Bardhaman 56.1 17.604. DGHC 56.14 17.365. Howrah NA 12.756. Hooghly NA 14.307. Nadia 55.23 12.738. Purba Medinipur 63.63 15.779. Kolkata No Rural Area ---It may be seen from the above tables that out of 11 districtsidentified for the purpose of implementation of NPEGEL only 3districts viz. Malda, Purulia and Uttar Dinajpur fulfilled the mainpara meters i.e., to having average rural female literacy below thenational average of 46.13% and 1 district viz., Jalpaiguri with47.97% was marginally above the average national level. In allother identified districts, the % of rural female literacy was far
179above the national average, ranging from 50.34% (Birbhum) to67.4% (South 24 Parganas). However, Dk. Dinajpur with 42.54%rural female literacy (below national average) and Murshidabadwith 46.37% rural female literacy (almost at the level of nationalaverage – even lower than Jalpaiguri with 47.97%) were moredesirable for identification/selection for implemental of NPEGELin the blocks under these districts than blocks under the districtslike Paschim Medinipur with 63.63%, South 24 Parganas with67.4% of rural literacy. It is pertinent to mention in this connectionthat a district is a constitution of blocks and blocks in turncomprise of rural as well as urban areas. Identification of LBBsunder a district a should have, therefore, been made ideally fromthose districts which fulfilled the main parameter mostly in asmuch as average percentage (of fulfillment of parameter) ofdistricts depict the average educational health of the total areas(includings) of the same (districts) as exhibited in the above tables.So far % of gender gap (literacy) is concerned, only 3identified districts viz. Bankura with 27.40% Purulia with 37.03and Uttar Dinajpur out of 11 districts fulfilled the parameter.
180NPEGEL further provides that blocks of districts which haveat least 5% of SC/ST population and SC/ST female literacy rate isbelow 10% shall also be taken up under this programme.The position with regard to fulfillment of the above criteriais given hereunder :DistrictsPercentage ofPercentage ofPercentagePercentage of(A) IdentifiedSCSC femaleof STST femalePopulationliteracy ratePopulationliteracy rate1. Bankura 31.24 6.40 10.36 6.832. Birbhum 29.51 7.81 6.74 2.783. Cooch Behar 50.11 29.44 0.58 9.034. South 24 Parganas 29.81 16.11 1.14 5.965. Jalpaiguri 34.54 12.68 18.72 6.086. Malda 16.89 9.71 6.91 3.207. Purulia 17.92 6.51 19.35 5.158. Uttar Dinajpur 18.71 9.06 3.82 4.499. North 24 Parganas 20.60 19.65 2.23 6.3110. Paschim Medinipur 17.87 19.39 16.11 12.0911. Siliguri 25.63 15.82 14.56 14.98Districts not identifiedfor the Scheme (B)Percentage ofSCPopulationPercentage ofSC femaleliteracyPercentageof STPercentage offemaleutilisation1. Murshidabad 11.90 11.74 1.37 5.222. Dakshin Dinajpur 28.71 9.07 16.01 4.493. Bardhaman 26.98 16.71 6.41 4.064. DGHC 16.15 15.82 13.78 14.985. Howrah 15.78 15.81 0.27 14.506. Hooghly 23.00 14.06 4.16 1.997. Nadia 28.78 53.88 3.29 29.208. Purba Medinipur 13.32 19.39 0.53 12.09
1819. Kolkata 6.45 20.28 0.49 16.01It emerges from the above that all the districts in <strong>West</strong><strong>Bengal</strong> were having more than 5% SC population and 10 out of 20districts were having more than 5% ST population while 2unidentified districts viz. Dakshin Dinajpur and DGHC had asmuch as 16.01% and 13.78% ST population respectively, Identifieddistricts like Cooch Behar (0.58%) South 24 Parganas (1.14%) andNorth 24 Parganas (2.23%) had as low as 0.58% to 2.23% of STpopulation while 3 out of 11 identified districts (viz. Bankura,Birbhum and Purulia) were having SC female literacy compositionbelow specified parameter of 10%, 2 districts had SC femaleliteracy marginally below 10%. However, all but in 2 identifieddistricts, ST female literacy rate was below 10% and 1 district had9.03% ST female literacy rate which was marginally lower than thespecified parameter.Out of 9 unidentified districts, SC female literacy rate for Idistrict (Dakshin Dinajpur) and ST female literacy rate for 4unidentified districts (Murshidabad, DK Dinajpur, Bardhaman andHooghly) were below 10%.Thus it is evident from the tables above that only twoidentified districts fulfilled both the main parameters fixed for
182declaring EBB status and 4 (identified) districts fulfilled the samepartially and the remaining 5 (identified) districts were identifiedwithout fulfilling the main parameters. But districts like DakshinDinajpur and Murshidabad despite fulfilling both main parametersand other national parameters mostly, were left out fromconsideration for identification of EBB and correspondingimplementation of NPEGEL there.This amply indicates that the procedure adopted foridentification of EBB in the districts for implementation ofNPEGEL Programme was not rational and/or other VideoConference in the year 2003-2004 was partial and inconclusive.11.1.3 Status of Progress (in implementation of NPEGEL)It was revealed from the records that not much initiative wastaken for furtherance of the programme to other districts havingEBBs since launching in 2003-2004. During 2004-2005 the NPEGELwas taken up in 57 blocks distributed in 11 districts, and theprogress made since then (2004-2005) does not give an impressivepicture.
183(A)Table below indicates status of Progress in respect ofNPEGEL for the period ending 31-03-2008. As already statedin para 1(iv) of this chapter, distribution of fund ( 1030clusters covering 57 EBB in 11 disricts/169 schools) andconstruction of cluster Resource Centre (in 33 seconds)started in the year 2004-2005. However, progress ofimplementation has been considered from the table belowsince 2005-2006 i.e., year from which the as such progressreport for implementation of the programme was available :TableSl.ParticularsNo.1. Total number of EBBs taken up forimplementationYear Year 2008-20092005-2006 (upto 9/2008)57 592. Number of districts covered 11 113. Total number of cluster sanctioned 996 1,0644. Total number of upper Primary Girlsenrolled at the NPEGEL5. Total number of Primary girl childrenenrolled in NPEGEL6. Total number of Primary teachers werecovered at the NPEGEL7. Total number of upper Primary Teacherswere covered at the NPEGEL7,23,095 2,99,5694,94,537 5,38,7837,622 23,5317,103 10,908It emerges from the above that the Programme was ex.(i) to only two (3.51%) more EBBs within the same covered (11)districts without carrying out further identification of (new)
184districts fulfilling the main parameters during the last 3years.(ii) sanction of cluster was increased by only 68 Nos. since 2005-2006 i.e. (6.83%) only.(iii) while in UPS, girls enrolment decreased by 141%, coverageof UPS teachers in Ups increased by 53.5%.(iv) Again, while enrolment of Primary Girls students increasedby 8.95%, coverage of teachers in the primary schooldecreased by 59.88%.BSlow Progress of ConstructionThe object for which the Programme (NPEGEL) was launchedduring 2003-2004 with fund distribution and construction ofCluster Resource (in 33 schools) started in 2004-2005 did not comeinto friction since it could achieve only 71.05% of the sanctionedconstruction (of Cluster Resource School) till the end of financialyear 2007-2008 with an annual average of 33.33% as may be seenfrom the following table:Cluster Completed In Not
185Year sanctioned Progressive This % this year Progress taken upyear(1) (2) (3) (4) (5) (6) (7)2005-06 547 204 204 37.29 285 582006-07 1040(860) 443 239 27.80 452 1692007-08 1064(621) 756 313 50.40 252 56Under column 2 indicates remaining targets (Total sanctionedcluster, less construction completed till the previous year). Sincecompleted clusters include left over (in complete – in progressportion of some cluster) cluster of which certain % of work wascompleted in the previous years, average annual completion ofclusters has been considered which comes to 33.33% ascertained onthe basis of 756 clusters completed in 3 years (annually 252 on inaverage).Non utilization of completed roomsIt was noticed from the records that rooms constructed underNPEGEL were locked and were not put to use for the promotion ofgirls education, skill training etc. which are the main objectives ofNPEGEL Programme.
186It was observed that (i) there was general lack ofunderstanding of NPEGEL activities in <strong>West</strong> <strong>Bengal</strong>. (ii) therewere no specific out reach strategies for girls who were in school.Project Approval Board desired that the State should develop atarget oriental plan for effective implementation of NPEGELprogramme.Status of shares of Fund released by Central/StateGovernment.Table below indicates receipts of funds and expenditure thereoffor the period from 2005-2006 to 2007-2008.YearOutlayapprovedOpeningbalanceRelease of fundCentral StateOthe rReceiptsTotalfundavailableExpenditure(actual)2005-06 1133.85 413.86 538.00 239.41 13.82 1205.09 741.212006-07 2416.99 463.88 850.25 223.33 23.30 1560.76 954.56 606.2007-08 1547.57 606.20 507.81 111.90 14.70 1240.61 409.95 830.66Total 5098.41 2105.72i) It was observed that a sum of Rs.190.38 lakhs pertaining toGovt. of India (GOI) share released on 31-03-2008 wasreceived by the SIS in the following month and, therefore,was not available for fulfillment of the intended purpose forthe year (2007-2008) it was received.
187ii) Total expenditure incurred (Rs./2105.72 lakhs) underNPEGEL for the year 3 year period ending 31-03-2008(2005-2006 – 2007-2008) stead at 41.30% of approved outlay(Rs.5098.41).Due to low utilization and unimpressive achievements overthe years, GOI continued to cut its share of approved outlayand released reduced share of fund every year during 2005-2006 – 2007-2008.Release of GOI share(Rs. In lakh)YearOutlayapprovedGOI(approved)Release offund (GOI)Slvortrelease%sharerelease(i) (ii) (iii) (iv) (v)(iii-iv) (vi)2005-2006 1133.85 853.39 75% 538.00 315.39 36.96%2006-2007 2416.99 1812.74 75% 850.25 962.49 53.10%2007-2008 1547.57 1005.92 65% 507.81 498.11 49.52%Total 3672.05It may be seen from the above that short release of fund byGOI ranged between 36.96% (2005-2006) and 53.10% (2006-2007).
188(iii) For the years 2005-2006 to 2007-2008. Fund released by theState Government fall short of sharing ratio (75:25 for theyears 2005-2006 and 2006-2007 and 65:35 for the year 2007-2008) by Rs.864.05 (60.45%) [ 25% of approved outlay for2005-2006 and 2006-2007 plus 35% of approved outlay for2007-2008 minus actual fund released).(iv) As a result of short receipt of fund by the SIS from GOI andGOWB, the target set out by the PAB in the AWP&B hadnever been achieved. This is amply indicative of tardyimplementation of the programme “NPEGEL” in the stateand non-fulfilment of the objective.(Rs. In lakh)Sl.No.Particula rs of Activities<strong>Report</strong>ed Expenditure ( )2005-06 2006-07 2007-081. Model cluster sch ool for girls 296.00 84.02 210.192. TLE, Library sports voca tional training etc. 74.70 22.69 78.973. Recurring grant to Model cluster sch ool 38.82 17.61 42.114. Award to sch ool Teach er s 17.61 13.43 11.555. Studen t evalua tion, remedial teaching, bridgecour ses, alterna tive sch ool42.37 14.95 55.636. Learning thr ough open sch ool 0.00 0.337. Teacher training 10.91 4.83 4.978. Child Care Cen tr e 12.50 5.78 0.009. Additional In cen tives 0.00 0.0010. Commun ity Mobilization and Managemen tcost10.49 28.96 18.35
189Total 503.40 192.27 422.1011.2 KASTURBA GANDHI BALIKA VIDYALAYA (KGBV)11.2.1 The government of India, in an attempt to reduce genderdisparities through educational opportunities launched a Schemein August-2004 called “Kasturba Gandhi Balika Vidyalaya”. Itseeks for setting up residential schools at upper primary level forgirls belonging predominantly to the SC, ST, OBC and minoritiesin different areas. The scheme of the KGBV ran as a separateprogramme but in harmony with the <strong>Sarva</strong> <strong>Shiksha</strong> <strong>Abhiyan</strong> (SSA),“National Programme for Education of Girls at Elementary Level(NPEGEL) and Mahila Samikhya (MS) “upto March 2007. However,since April 2007 (2007-08) the scheme merged with the SSAProgramme as a separate Component.The Scheme was applicable since inception (2004) inEducationally Backward Blocks (EBBS) having rural female literacybelow 46.13 per cent (National average as per census 2001) andgender gap in literacy over 21.59 per cent (National average –Census 2001). Among these blocks residential schools would be setup in areas with concentration of ST, SC, OBC and minority
190population with low female literacy and large number of girls outof school.In <strong>West</strong> <strong>Bengal</strong>, the location and the schools for promotingresidential facility for girl students under KGBV scheme, werestated to be identified with necessary field verification during2004-05. However, records revealed that the schools for residentialpurposes were selected from amongst the “blocks of districtsidentified as EBB for implementation of NPEGEL withoutconsidering other EBB/areas, under districts not identified forNPEGEL based on parameters of selection of KGBV which wouldhave been more desirable for KGBV scheme in as much as thenature andobjectives of both the components (NPEGEL andKGBV) differ from each other. Till 2005-2006, 54 schools wereidentified in 10 districts, construction of which also started in thisyear (2005-06). Districts selected for construction of KGBV were asfollows :Serial No. Districts identified/selected No.of KGBV1. Bankura 102. Birbhum 23. Jalpaiguri 44. Malda 35. Uttar Dinajpur 66. Paschim Medinipur 37. Purulia 208. South 24 Parganas 39. Siliguri 2
19110. Cooch Behar 1Total 54Target of construction of KGBV school was subsequently increasedto 59 from 54 and the same was continued till 2007-08. Theidentification/selection vis-à-vis construction of KGBV schoolswas, however, limited to the 10 districts out of the 11 districtsidentified for NPEGEL.As observed earlier para(NPEGEL) that only 2 identifieddistricts, viz. Purulia & Uttar Dinajpur fulfilled the mainparameters of EBB and only 4 identified districts viz. Bankura,Jalpaiguri, Malda and Siliguri fulfilled the parameter partially.The fact remains that restricting identification of location forsetting up KGBV only within those 11 districts (NPEGEL) was notideal as would be evident from the table below, and, which ifconsidered, such selection was inconclusive and not logical.11.2.2 The table (A & B) below indicate district wiseconcentration of SC, ST and Minority population along with femaleliteracy (A) and out of school (B).TABLE A(1 )
192Sl.NoDistr icts(identif ie d)Tota l Pop ula t ion(F ig. in la kh) SC concentra ti on ST concentrati onMinor it yconcentrationUrban Rural Tota l % of to ta lpopula t ionFe m a leL ite rary% to tota lpopula t ion% femaleL ite rary% o f t o t a lp o p u l a t i on1 . Bankura 2 .57 3 2 .41 3 4 .97 3 1 .24 6 .40 1 0 .36 6 .83 7 .57 NAF e m a l eL i t e r a r y2 . Birbhum 2 .84 3 0 .21 3 3 .05 2 9 .51 7 .81 6 .74 2 .78 3 5 .08 5 0 .973 . C ooch Be har 2 .47 2 4 .70 2 7 .17 5 0 .11 2 9 .44 0 .58 9 .03 2 3 .06 4 7 .114 . Ja l paiguri 6 .61 3 0 .66 3 7 .28 3 4 .54 1 2 .68 1 8 .72 6 .08 1 0 .89 4 5 .015 . Ma l da 2 .64 3 3 .42 3 6 .06 1 6 .89 9 .71 6 .91 3 .20 4 6 .59 3 8 .686 . UttarDinajpur7 . Pa schimMedinipu r3 .23 2 3 .53 2 6 .76 1 8 .71 9 .06 3 .82 4 .49 4 8 .28 2 5 .506 .09 5 1 .96 5 8 .05 1 7 .87 1 9 .39 1 6 .11 1 2 .09 1 9 .65 5 4 .368 . Pu rul i a 2 .80 2 5 .00 2 7 .80 1 7 .92 6 .51 1 9 .35 5 .15 6 .03 3 4 .149 . South2 4 -Pa rganas1 1 .94 6 3 .76 7 5 .70 2 9 .81 1 6 .11 1 .14 5 .96 2 8 .75 1 6 .251 0 . Siliguri 1 .90 3 .95 5 .85 2 5 .63 1 5 .82 1 4 .56 1 4 .98 1 0 .43 3 7 .92Table-A(II)Sl.NoDistr icts(unidenti fie d)Tota l Pop ula t ion(F ig. in la kh) SC concentra ti on ST concentrati onMinor it yconcentrationUrban Rural Tota l % of to ta lpopula t ionFe m a leL ite rary% to tota lpopula t ion% femaleL ite rary% o f t o t a lp o p u l a t i oF e m a l eL i t e r a r yn1 . Mu rshidabad 8 .03 5 6 .26 6 4 .29 1 1 .90 1 1 .74 1 .37 5 .22 6 8 .00 4 2 .762 . DakshinDinajpur2 .16 1 4 .32 1 6 .48 2 8 .71 9 .07 1 6 .01 4 .49 3 4 .92 1 8 .653 . Bardhaman 2 8 .10 4 7 .47 7 5 .57 2 6 .98 1 6 .71 6 .41 4 .06 2 1 .11 6 1 .394 . DGHC 3 .82 7 .96 1 1 .78 1 6 .15 1 5 .82 1 3 .78 1 4 .98 9 .38 3 7 .925 . Howra h 2 3 .60 2 3 .23 4 6 .83 1 5 .78 1 5 .81 0 .27 1 4 .50 1 9 .61 6 0 .786 . Hoo ghly 1 8 .50 3 6 .76 5 5 .26 2 3 .00 1 4 .06 4 .16 1 .99 1 6 .42 1 1 .297 . Nadia 1 0 .74 3 9 .73 5 0 .47 2 8 .78 5 3 .88 3 .29 2 9 .20 2 5 .41 1 0 .648 . Pu rbaMedinipu r9 . North2 4 -Pa rganas4 .96 4 2 .32 4 7 .28 1 3 .32 1 9 .39 0 .53 1 2 .09 1 9 .65 5 4 .365 3 .17 4 4 .75 9 7 .92 2 0 .60 1 9 .65 2 .23 6 .31 2 2 .96 5 8 .131 0 . K ol kata 5 0 .12 0 .00 5 0 .12 6 .45 2 0 .28 0 .49 1 6 .01 2 6 .00 6 3 .61Table-BGirls out of School/UPS
193Sl.No.Distr ictIdentif ie dfor KGBVGirlsnote nrolle din UPSGirlsDroppedout UPSTota lNo.ofGirlsout ofSchoolDistr ictunidentifie dfor KGBVGirls n ote nrolle din UPSGirlsDroppedout UPSTota lNo.ofGirlsout ofSchool1. Bankura 3362 2802 6164 Murshida bad 5062 4362 94242. Birbh um 2376 4570 6946 DakshinDinajpur855 1715 25703. Jalpaiguri 1694 3490 5184 Bardhaman 2311 4302 66134. Malda 6180 3452 9632 DGHC 373 957 13305. UttarDinajpur8157 14387 22544 Howrah 1994 7514 95086. PaschimMedinipur3974 10048 14022 Hoogh ly 1227 1948 31757. Pur ulia 10558 7370 17928 Nadia 296 712 10088. South 24Parganas12510 5358 17868 Pur baMedinipur1538 4331 58699. Siliguri 798 840 1638 Nor th 24Parganas1724 4527 625110. CoochBehar3372 605 3977 Kolka ta 1690 3822 5512The following picture emerges from the above 2 tables (TableA (I & II & B) :-(i)Two unidentified districts viz. Murshidabad and DakshinDinajpur were having concentration of more percentage ofSC, ST and Minority population with a total of 81.27 per centand 79.64 per cent respectivelythan any of the identifieddistricts (percentage basis).(ii) Again, total out of school girls (in Ups) of 2 unidentifieddistricts (Murshidabad and Howrah) were having more
194numbers of out of school girls in UP level than that of 5identified districts (viz. Bankura, Birbhum, Jalpaiguri,Siliguri and CoochBehar).It may be seen from the paragraphsupra thatidentification of EBB for implementation of NPEGEL was not donein keeping with the main parameters and moreover, the crux of theobjective laid down for KGBV differs more or less from that ofNPEGEL. Selection/identification of location for setting up schoolsunder KGBV within the areas considered as EBB for NPEGEL wastherefore, not ideal and rational.11.2.3 The thrust of the objective of KGBV was to attract and arrestout of school girls, particularly those who are at risk of beingdropped out of school at any stage of elementary education.District wise dropped out girls student (all communities is givenin the following table)Sl.No.Table-CDrop out rates of upper Primary School (UPS) Girls %Identified DistrictsRate(%) ofDropoutSl.No.Identified DistrictsRate(%) ofDropout1. Bankura 19.31 1. Murshidabad 34.162. Birbhum 31.77 2. Daskshin Dinajpur 30.003. Jalpaiguri 19.91 3. Bardhaman 31.02
1954. Malda 34.86 4. DGHC 42.285. Uttar Dinajpur 27.05 5. Howrah 26.196. Paschim Medinipur 38.08 6. Hooghly 31.317. Purulia 36.87 7. Nadia 27.818. South 24 Parganas 33.83 8. Purba Medinipur 28.199. Siliguri 12.28 9. North 24 Parganas 29.7110. Cooch Behari 35.42 10. Kolkata 27.79On analysis of the above 3 tables, (Table A, B, C). Showingrespectively, (i) Concentration of SC and ST, (OBC Not available)and Minority population, (ii) Girls out of School and (iii) Dropoutrates of upper Primary Girls student, it would be evident that 3more unidentified districts (viz. Murshidabad, Dakshin Dinajpurand Howrah) were eligible and deserved to be included forimplementation of KGBV Programme.11.2.4 Status of Implementation of Kasturba Gandhi BalikaVidyalaya till 2007-08.It was revealed from the records that in the year 2006-07 (till31-03-2007) 44 numbers of KGBV were operationalised out ofsanctioned 59 KGBV and in the year 2007-08 (till 31-03-2008) 8more KGBV were operationalised making the total to 52 KGBV outof sanctioned KGBVs of 59 numbers. However, the status of
196construction of hostels under KGBV does not show veryimpressive picture as follows :-Status of Construction of hostels under KGBVYearNo. ofK GBVsanctionedConstruction c omple te dPr og(a )C urr entyear (b)%(c)Constructionin pro gressConstructionNot sta r te dRemarks(1) (2) (3) (4) (5) (6)2 0 0 6 -0 7 5 9 2 4 2 4 4 0 .68 2 5 1 0Release of fundstarted in 2004-0 5 and workstarted in2 0 0 5 -0 6 a ndspent R s.972.67l a kh till 200 6 -0 7for c ompleti on of2 4 hostels andfor w or k inpr og re ss.2 0 0 7 -0 85 9(3 5 ) balancetarget3 5 1 1(l eft over ofi ncompleteconst r uctiona s on3 1 -0 3 -0 7 )3 1 .43 1 6 8I ncludes 24numbe rcomplet ed anduri n g 2006-0 7a nd 11 numbersl eft ov erconst r uctionremained inpr og re ss d u ri ng(WIP) 2006-0 7 16i ncludes 14 from2 0 0 6 -0 7 a nd 2fr om 2007-0 8It would emerge from the above table that during the year2007-08, the achievement towards construction of KGBV was toolow and the percentage of construction achieved was only 31.43which also included percentage of work already completed during
1972006-07 out of 25 numbers of hostels, construction of which wereunder progress in 2006-07, only 11 Nos. could be completed during2007-08 leaving 14 numbers hostels to remain as it were (underconstruction) even at the close of 2007-08. Construction of only 2new hostels were taken up during 2007-08 making it 16 (14 +2) inprogress.11.2.5 Status of Share released by GOI/GOWB for KGBVTable below indicates receipts of fund and expenditure incurredthere against for the period 2005-06 to 2007-08(Rupees in lakh)Release ofTotalOutlay OpeningOthe rYearfundfund Expenditure Balanceapproved balancereceiptsCentral Stateavailable2004-05 -- -- 711.43 -- -- 711.43 -- 711.432005-06 -- 711.43 34.08 248.50 19.03 1013.04 420.31 592.732006-07 -- 592.73 357.94 119.31 88.37 1158.35 552.36 605.992007-08 1039.18 605.99 169.05 91.03 15.88 881.95 554.07 327.88As already stated KGBV scheme was introduced in August2004 and continued as a separate Programme but in harmony withSSA, NPEGEL and Mahila Samakhya till 2006-07 (March 2007) andsince 2007-2008, the scheme merged with SSA Programme as aseparate component. Accordingly separate outlay was approvedfor the KGBV from the year 2007-2008. However, funds were being
198released by both the Government of India and Government of <strong>West</strong><strong>Bengal</strong> (GOI & GOWB) from the year 2004-2005.It was observed that Mission had not incurred anyexpenditure during 2007-2008 out of the approved/allocated outlay(Rs.1039.18 lakh) for the year (2007-2008). The expenditure (ofRs.554.07 lakh) incurred during 2007-2008 was for the completionof left over construction and infrastructural work of 2006-2007which was covered by the opening balance (Rs.605.99 lakh) as on1 s t April, 2007 (2007-2008). Thus non-utilisation of the fund for thepurpose (construction of hostels and creation of infrastructurerelating to KGBV) for which it was allocated/ released resultedinto non fulfillment of objective of KGBV for access and qualityeducation to the girls of disadvantaged groups of society (bysetting up residential schools at upper Primary level).It was also noted with concern that even after 4 years ofintroducing KGBV Scheme in the state (Central Govt. released its1 s t instalment of Rs.711.43 lakh in the year 2004-2005 and work ofconstruction started in 2005-2006) not enough infrastructure couldbe created by the State Mission.Incidentally, the 7 t h Joint Review Mission (JRM) stated intheir report (<strong>West</strong> <strong>Bengal</strong> State <strong>Report</strong>) that during the visit of the
199team to one of the KGBV Centres, the girls in Class-VIII expressedto the team of their strong desire to continue their studies evenafter completion of Class-VIII, ideally in a KGBV.Similar eagerness for higher studies (after completion ofClass-VIII) was expressed by of a school under earning CLRCstudents shown to the study team during their visit to one KGBVin January 2009.However, in juxtaposition of the fact stated aboveconstruction of 2 KGBV upper Primary Schools viz. Tiluri GirlsHigh School in the district of Bankura (Saltora block) andTarangapur Baral Haralal J. High School in the district of UttarDinajpur (Kaliaganj block), though completed, no enrolment ofstudent was made. But the KGBV Schools were having respectively14 and 10 teachers in position. Yet another school Jaingas JuniorGirls’ High School in Uttar Dinajpur though not constructed, 4teachers were in the roll : No student was enrolled.Thus the above fact and figures confirm the views expressedby the Study Team regarding identification/Selection of locationfor setting up of schools under KGBV. The schools under KGBVwere not being constructed on need basis and planned way.
20011.2.6 The KGBV school visited by the Study Team (HowrahmariHigh School in the district of South 24-Parganas) was having50 bedded hostel. But as observed by the team the schoolneeded a 100 bedded hostel to meet the requirement in theresponse to students’ demand. The SSA Mission, instead,constructed and opened up KGBV in other districts as statedabove with no enrolment of students. The disparity needscloser attention and selection of location should be morerational as per norms laid down by the Government of India.
201CHAPTER-12INNOVATIVE ACTIVITIES12.1 EARLY CHILDHOOD CARE AND EDUCATION (ECCE)Early Childhood Care and Education (ECCE) is a majorcomponent to achieve UEEE,ECCE addressed children of the agegroup3 to 5 and prepares them to get acquainted to schoolenvironment. In <strong>West</strong> <strong>Bengal</strong> , only the Integrated ChildrenDevelopment Scheme (ICDS) run by the women and Child Developmentand Social Welfare Department catered to the pre-schoolingfacilitiesin the Government sector. Out of 20 educational district, 19 werecovered under ICDS, One district, viz. Darjeeling remained out ofcoverage. In the private sector, Kinder Garten /Nursery schoolsprovides for pre-schooling facilities. Anganwadi Centres (AWCS) setunder ICDS rendered, inter-alia, pre-schooling for children in the agegroup3 to 6 . But since in <strong>West</strong> <strong>Bengal</strong>, children of 5+years of agewere enrolled in primary school, the scope of pre-schooling remainedopen to children of 3+ to 4+ age groupThe positionshowing the number of AWCs and the number ofchildren covered in each year during 2005-06 to 2007-08 for the stateand the selected districts of Murshidabad and South 24 Parganas was asgiven below :
202Number ofAWCsChildrenYearState Murshida bd S.24 Pgs. State Murshida bd S.24 Pgs.2005-06 53,420 -NA- 5,197 23,01,647 -NA- 1,03,9402006-07 55,190 3,993 6,100 23,28,545 2,65,924 1,22,0002007-08 54,547 9,923 7,748 16,41,755 2,12,134 2,60,779Source : AWP&B for 2008-2009 and information furnished by districtThe financial targets vis-à-vis achievement in respect of ICCE for theyears 2005-06 to 2007-08in respect of the state as a whole and theselected districts of Murshidabad and South 24 Parganas was as under[Rupees in lakh]YearState 2 0 0 5 -0 62 0 0 6 -0 72 0 0 7 -0 8Total :App rov edoutlay1 5 4 .101 2 5 .241 6 4 .754 4 4 .09Expenditure a sper a uditeda ccount s7 1 .418 0 .205 9 .822 1 1 .43Shortfa l l Pe rcentage ofShortfa l l8 2 .694 5 .041 0 4 .932 3 2 .665 3 .663 5 .966 3 .695 2 .39Mu rshidabad 2 0 0 5 -0 62 0 0 6 -0 72 0 0 7 -0 8Total :South 24 Pg s. 2 0 0 5 -0 62 0 0 6 -0 72 0 0 7 -0 8Total :NIL1 1 .861 1 .002 2 .861 0 .149 .809 .802 9 .74NIL5 .61NIL5 .61NIL7 .60NIL7 .60NIL6 .251 1 .001 7 .251 0 .142 .209 .802 2 .145 2 .701 0 0 .007 5 .461 0 0 .002 2 .451 0 0 .007 4 .45The above disclosed the tardy implementation of pre-schoolactivities through ECCE in the state out of total budget provision ofRs.444.09 lakh for the years 2005-06 to 2007-08. The State Missioncould not utilizeRs.232.66 lakh, representing 52.39 percent of theoutlay. The position in respect of utilization of outlay by the IPOs,
203Murshidabad and South 24 Parganas miserably low-only 24.54percent and 25.55 per cent respectively during the three year period.12.2 GIRLS EDUCATIONAccording to Census,2001 the overall literacy ratio in male andfemale population of the state was 77.02 per cent and 59.61 per centrespectively. Literacy rates in the selected district of Murshidabadand South 24 Parganas was 60-71 percent and 47.63 percent and 79.15percent and 59.01 percent respectively.The overall girls’enrolment percentage in primary and upperprimary schools during the last three years upto 2007-08 was under :-Percentage of girls enrolment in total overall population inPri ma ry Ed ucationUppe r Pri ma ry Ed ucation2 0 0 5 -0 6 2 0 0 6 -0 7 2 0 0 7 -0 8 2 0 0 5 -0 6 2 0 0 6 -0 7 2 0 0 7 -0 8State 4 9 .60 4 9 .66 4 9 .75 4 9 .09 4 9 .59 5 0 .06Mu rshidabad 4 9 .47 4 9 .37 4 9 .26 5 0 .18 5 1 .47 NAS.24 Pgs. 5 0 .41 5 0 .38 5 0 .35 5 0 .65 5 1 .19 5 1 .74Source AWP&B for 2008-09The above showed a slight increase in girls’ enrolment over the yearsin primary education, increase in enrolment in upper primary educationwas marginal.Status of gender gap in primary and upper primary levels duringthe period from 2005-06 to 2007-08 was as given below :Gender gap in
204Pri ma ry Ed ucation(i n pe rcent )Uppe r Pri ma ry Ed ucation(i n pe rcent )2 0 0 5 -0 6 2 0 0 6 -0 7 2 0 0 7 -0 8 2 0 0 5 -0 6 2 0 0 6 -0 7 2 0 0 7 -0 8State 0 .80 0 .69 0 .50 1 .82 0 .61 (- )0 .12Mu rshidabad 1 .70 1 .27 1 .48 (- )0 .36 (- )2 .94 NAS.24 Pgs. (- )0 .83 (- )0 .76 (- )0 .70 (- )1 .29 (- )2 .37 3 .48Source AWP&B for 2008-09Gender gap in terms of enrolment in primary leveldecreasedfrom 0.80 per cent in 2005-06 to 0.50 per cent in 2007-08. Overallgender gap in upper primary level reduced from 1.82 per cent in 2005-06 to (-) 0.12 per cent in 2007-08. However, in 4 district, viz. Bankura,Purulia. Uttar Dinajpur and Paschim Medinipur, the gap in upperprimary level still remained at 8.97 percent, 12.45 , 1.20 per cent and3.25 per cent in 2007-08Gender Parity Index (GPI)The overall GPI for the State as a whole in respect of primarylevel and upper primary level of education during the year s2005-06 to2007-08 was as under :Gender Parity IndexPri ma ry Ed ucationUppe r Pri ma ry Ed ucation2 0 0 5 -0 6 2 0 0 6 -0 7 2 0 0 7 -0 8 2 0 0 5 -0 6 2 0 0 6 -0 7 2 0 0 7 -0 8State 0 .984 0 .986 0 .990 0 .9641 7 0 .9877 8 1 .0024 7Mu rshidabad 0 .9789 0 .9749 0 .971 0 .1007 3 1 2 .068 6 6 NAS.24 Pgs. 1 .0167 1 .0153 1 .014 1 .0261 7 1 .0486 2 1 .0720 3GPI valued less than 1 means disparity in literacy in favour ofmen. A district wise data focused that GPI value n South 24 Parganas,Maldah , Howrah, Kolkata and Siliguri atprimary level andMurshidabad. Hoogli, Kolkata, North 24 Parganas at upper primarylevel was more than .
205Status of SC and ST Girls enrolment in primary and upperprimary education :The percentage of enrolment of SC and ST among total SC and STenrolment in primary and upper primary schools during 2005-06to2007-08 was as under :Percentage of SC Girls amongtotal SC enrolmentPri ma ry Ed ucationUppe r Pri ma ry Ed ucation2 0 0 5 -0 6 2 0 0 6 -0 7 2 0 0 7 -0 8 2 0 0 5 -0 6 2 0 0 6 -0 7 2 0 0 7 -0 8State NA 4 9 .37 4 9 .50 NA 4 7 .54 4 7 .74Mu rshidabad NA 4 9 .94 4 9 .24 NA 4 7 .27 NAS.24 Pgs. NA 4 9 .38 4 9 .90 NA 4 7 .76 4 8 .64Percentage of SC Girls amongtotal ST enrolmentPri ma ry Ed ucationUppe r Pri ma ry Ed ucation2 0 0 5 -0 6 2 0 0 6 -0 7 2 0 0 7 -0 8 2 0 0 5 -0 6 2 0 0 6 -0 7 2 0 0 7 -0 8State NA 4 9 .06 4 9 .21 NA 4 5 .09 4 5 .48Mu rshidabad NA 4 9 .61 4 9 .47 NA 4 4 .17 NAS.24 Pgs. NA 4 7 .42 4 8 .45 NA 4 4 .75 4 3 .55Source : AWP&B for 2008-09The above showed that through at primary level, the percentage ofenrolment of SC and ST girls was comparable to overall girls enrolmentin the State. The percentage of enrolment dropped drastically at upperprimary stage. CHORT <strong>Report</strong> 2004 in upper primary students showedthat drop-out rate of girls was 30.75 percent. Only 37.31 percent girlscompleted their elementary education in four years and 50.33 percentremained in the system through repetition.Major activities undertaken.
206The State Mission undertook the following activities on genderinterventions.(a) Organisastion of Ma-O-Meya melas(b) formation of MotherTeacher Association (MTA) in primary schools (c) Training ofMTA members (d) Formation of MTA in upper primary schools(e) Sensitization of primary schools on gender issue (f)orientation of VEC/WEC members on gender issues (g) Healthcheck up programme and (h) Free Text Books to Girls students.Utilization of budgetary allocation for Girls’ EducationThe utilization of budgetary allocation in each year during 2005-06 to 2007-08 in respect of the State as whole and the selecteddistricts of Murshidabad and South24 Parganas was as givenbelow :[Rupees i n lakh]YearState2 0 0 5 -0 62 0 0 6 -0 72 0 0 7 -0 8App rov edOutlay2 1 3 .702 9 9 .212 9 6 .47Expenditure asper AuditedA/cs.9 8 /7 21 7 1 .362 7 0 .69Shortfa l l /Excess (+ )1 1 4 .981 2 7 .842 5 .78Pe rcentage o fShortfa l l /Excess5 3 .804 2 .738 .70Mue shidabad2 0 0 5 -0 62 0 0 6 -0 72 0 0 7 -0 82 .001 5 .001 5 .002 .671 5 .05NIL(+ )0 .67(+ )0 .051 5 .00(+ )3 3 .50(+ )0 .331 0 0 .00S.24 Pgs.2 0 0 5 -0 62 0 0 6 -0 72 0 0 7 -0 81 5 .001 5 .001 5 .002 .701 2 .01NIL1 2 .302 .991 5 .008 2 .001 9 .931 0 0 .00It is evident from the above that the overall shortfall in expenditurewas 53.80 percent in 2005-06, 42.73% in 2006-07 and then reduced to
2078.70 in 2007-08 . Out of the budgetary allocation of Rs.32 lakh andRs.45.00 lakh for the years 2005-06 to 2007-08, Murshidabad districtutilized Rs.15.72 lakh and South 24 Parganas Rs.14.71 lakhrespectively representing 55.37 per cent and 32.69 of the approvedoutlay. Under-utilisation of approved outlay as indicative of partyimplementation of activities.12.3 Intervention on SC/STAccording to 2001 census of the total population in <strong>West</strong> Bengla,SC and ST population was 23.96 percent and 5.63 percentrespectively. SC population varied from 6.45 percentin Kolkata to51.76 per cent in Coochbehar. ST population ranged between 0.27 percent in Howrah to 21.04 in Jalpaiguri . Seven district in the state werehaving more than 10 percent.The position showing the percentage of SC and ST enrolment intotal overall enrolmentin primary and upper primary during years2005-06 and 2006-07 for the state as a whole and for the selecteddistrict of Murshidabad and South 24 Parganas was as under :Pri ma ryUppe r Pri mary2 0 0 5 -0 6 2 0 0 6 -0 7 2 0 0 5 -0 6 2 0 0 6 -0 7SC ST SC ST SC ST SC STState 2 9 .11 7 .18 2 8 .86 7 .28 2 6 .48 5 .08 2 6 .71 5 .21Mu rshidabad 1 3 .23 1 .52 3 4 .76 1 8 .89 1 3 .55 1 .10 3 0 .47 1 2 .82
208South 24 Pg s. 3 3 .07 1 .63 1 1 .39 2 8 .50 3 6 .07 1 .11 9 .59 2 9 .70The above showed thatwhile the SC and ST enrolment in2006-07 primary level in respect of the State and MurshidabadDistrict showed increase over the previous year. The enrolmentshowed significant decline in South 24 Parganas. Again, whileoverall enrolment of SC and STin the state and Murshidabadshowed improvement. enrolment of SC declined in 2006-07 inSouth 24 Parganas . ST enrolment,however, showedremarkableincreased from 1.11% percent in 2005-06 to 29.70 % percent in2006-07.The CHORT STUDY 2005 at Primary Level done by SPOdisclosed the completion rate, Drop outrate among SC and STstudents at primary level as under :Completion RateDrop out RateSC out ST out Overall SC out ST out Overallof SC of STof SC of STState 55.11 48.99 58.08 14.97 20.63 15.56Murshidabd 55.66 43.33 58.71 12.40 23.35 13.12S 24 Pgs. 48.66 45.15 48.43 17.90 23.24 20.53SC/ST students had low performance at both primary and upperprimary levels due to mainly to parents’ low social class,educationaland occupational level and family environment.Facilities available in school, school environmentand teachers’attitude were also influencingfactor Major activities undertakenfor SC/ST students included (a) Pedagogical Inputs (b) CommonInitiatives related to school and (c) Community Mobilisation.Targets and achievement
209Financial targets vis-à-vis achievement during the last three yearsupto 2007-08 is given below :YearApp rov edOutlayExpenditure asper a udited A/c.Pe rcentage o fUtilisa tion[ Rs. in lakh]Shortfa l lState2 0 0 5 -0 6 1 4 3 .98 4 9 .14 3 4 .13 9 4 .842 0 0 6 -0 2 5 0 .55 1 7 3 .64 6 9 .30 7 6 .912 0 0 7 -0 8 2 3 8 .77 3 6 .88 1 5 .45 2 0 1 .896 3 3 .30 2 5 9 .66 4 1 .00 3 7 3 .69Mu rshidabad2 0 0 5 -0 6 5 .00 NIL NIL 5 .002 0 0 6 -0 7 8 .14 NIL NIL 8 .142 0 0 7 -0 8 9 .00 NIL NIL 9 .002 2 .14 2 2 .14S.24 Pgs.2 0 0 5 -0 6 9 .86 NIL NIL 9 .862 0 0 6 -0 7 1 0 .20 NIL NIL 1 0 .202 0 0 7 -0 8 1 0 .20 NIL NIL 1 0 .203 0 .26 3 0 .26It is seen that out of the approved outlay of Rs.633.30 lakhfor the years 2005-06 to 2007-08 a sum of Rs.259.66 lakhrepresenting only 41.00 per of approved outlay for these yearswas utilized. Utilisation in 2006-07 was 69.30 percent , while in2005-06 and 2007-08 only 34.13 per cent and 15.45 percent ofoutlay was spent.There was no expenditure at all in Murshidabad and South24 Parganas district in any of the years.The above reveals the awareness was not generated in SPO/DPOs towards the needs of SC/ST students.CHAPTER-13RESEARCH, EVALUATION ,SUPERVISION AND MONITORING(RESM)
210As per para 36.1 of the MFM & P, out of Rs.1500 perschool per year, Rs.100 and Rs.1400 per school per year will be spentat national level and state level respectively. The State shalldecide onthe distribution of its share at various levels from the state to theschool.Under the intervention RESM the following was the approvedbudget and expenditure during the period from 2005-06 to 2008-09 :-(Rs.in lakh)Year Approved Budget Expenditure %of expenditure toapproved outlay2005-06 464.98 317.08 68.192006-07 783.26 492.71 62.902007-08 829.92 349.29 42.082008-09 772.40 NO EXPENDITURE REPORTED TILLJANUARY 2009The above table indicates decrease in expenditure from 68.19 per centin 2005-06 to 42.08 per cent in 2007-08 reasons for which were not inrecord.In terms of para 26.6. of the MFM&P details of expenditureyear-wise on (a) creation of a pool of resource persons at national,state, district, sub-district level for effective field based monitoring (b)Achievement tests, evaluation studies (c) Research activities (d) specialtask force for low female literacy districts and for special monitoring ofgirls, SC(e) Education Management Information ‘system (f)Assessment and appraised of field activities (g) Institutionalmonitoring of the progress of implementation etc. were not available.It was noticed that the monitoring was severally lacking aslocal level monitoring by VEC/WEC was almost non-functional andSPO had not attempted any evaluation of quality improvement ofeducation as envisaged in the SSA guidelines which would be evident
211from para ………………chapter ………………that there was practically nosupervision/monitoring of the civil work construction, the mostsignificant SSA intervention and also in respectof activities ofdifferent Institutions, viz. Paschim Banga Rajya Sishu <strong>Shiksha</strong>Mission, <strong>West</strong> <strong>Bengal</strong>Board of Secondary Education, <strong>West</strong> <strong>Bengal</strong>Board of Primary Education, <strong>West</strong> <strong>Bengal</strong>, Board of MadrasahaEducation, Director of Local Bodies Ravindra Mukta Vidyalaya andState Council of Educational Research and Training.13.2 EXCESS EXPENDITURE ON MANAGEMENT COST :Programme guidelines forebade expenditure in respect ofManagement Cost in excess of 6 per cent of annual total costseparately for each district and also in total for the entire state.The expenditure should be incurred for the purpose of officeexpenses, hiring of experts, POL, Community Planning Process,etc.It was, however, noticed that the SPO and four districtsincurred expenditure towards management cost for the periodfrom 2005-06 to 2007-08 aggregating Rs.3,040.35 lakh (indicating6.85 percent to 71.20 per cent) as against permissible limit ofRs.983.76 lakh. Details are given below :YearName ofdistr ictTota lproje cte dcost6 percentof thecostManagementcost as pera ccounts (percent)(Rupes in lakh)E x cesse x penditureonm a nageme ntcostRemarks2 0 0 5 -0 6 Darjeeling 8 6 .80 5 .20 1 8 .49(2 1 .3 0 ) 1 3 .29 DGHCNadia 1 ,566.2 2 9 3 .97 2 0 9 .68 (1 3 .39) 1 1 5 .71Pa schimMedinipu r (1 9 6 .08(6 .85 ) 2 4 .44South 24 2 ,860.8 1 1 7 1 .64 1 3 6 .54 (8 .94) 4 5 .47Pa rganas 1 ,527.9 4 9 1 .072 0 0 6 -0 7 SPO 1 0 2 04 .31 6 1 2 .25 2 4 2 5 .4 2 (2 3 .77 ) 1 ,813.1 7
212Darjeeling 2 6 .35 1 .58 1 8 .76(7 1 .2 0 ) 1 7 .182 0 0 7 -0 8 Darjeeling 1 3 4 .33 8 .05 3 5 .38 (2 6 .3 4 ) 2 7 .33Total 9 8 3 .76 3 ,040.3 5 2 ,056.5 9Thus, there was excess expenditure of Rs.2,056.59 lakh which notonly resulted in irregular expenditure on management cost beyond thepermissible limit but also led to curtailment of other componentsalready approved in AWP&B.CHAPTER-14MISCELLANEOUS1.41. UTILIZATION OF FUNDS PLACED TO DIFFERENTIMPLEMENTING AGENCIES.It was noticed from the statement furnished by SPO that out ofSSM funds were placed to the following institutions during the periodfrom 2005-06 to 2007-08 as support for implementations of SSA
213programme. The table below indicates the position of fund releasedvis-à-vis utilization thereof[Rs. in lakh]Year WBBSE WBBPE WBBME RMV DLB SCERT Total2 0 0 5 -0 6 8 .71 7 .43 1 3 .00 2 .90 1 0 2 .70 - -2 0 0 6 -0 7 4 8 .00 6 0 .00 8 .00 1 0 .67 1 3 8 .41 - -2 0 0 7 -0 8 1 2 0 .00 - - - - - -Total 1 7 6 .71 6 7 .43 2 1 .00 1 3 .57 2 4 1 .11 1 0 .38* -U/s received till 1 7 0 .87 7 .43 1 6 .00 Nil 1 5 2 .33 3 .25 -completi on o fstud y (Ja n.2009)Balance 5 .84 6 0 .00 4 .91 1 3 .57 8 8 .78 7 .13 1 8 0 .23It was also noticed from records that funds were allotted to theabove institution in lump in absence of any activity wise budget to beprepared as per guidelines of SSA in their plan proposal.No records / Register were maintained in SPDfor watchingreceipt of utilization certificates against the allotted funds. Nomonitoring was also done for verification of the actual work done andno action was taken calling for the utilization certificates though suchcertificates were required to be submitted to SPD monthly latest by 10 t hof the following month for onwards transmission to GOI. Instead,fund was continued to be released though the u/c of the previousfund allotted was not received. This resulted in non-accountal of fundto the extent of Rs.180.23 lakh.A review of statement of expenditure furnished with theutilization certificate revealed the following irregularities inexpenditure.
214IMPROPER UTILISATION OF SSA FUND – Rs.113 lakh(a) WBBPE utilized a sum of Rs.113 lakh for construction of itsAdministrative Building as intimated to SPD in July 2006although such construction in civil works isspeciallyprohibited as per para 26.2 of the MFMAP.(b) WBBBPE incurred an expenditure of Rs.7.02 lakh forrepayment of loan taken by SSA cell of the of the Boardfrom WBBSE. This was also in violation of SSA norm.(c) WBBME incurred expenditure of Rs.28.43 lakh during 2007-08 for procurement of the following articlesComputer - Rs. 1.29 lakhMathematics Instrument kit - Rs. 9.82 “Laboratory equipment - Rs.17.32 “Rs.28.43 lakhThe above articles pertain to TLM category for whichregular grants are released to schools out of SSA fund oftheDistrict.There is nothing on record to indicate whether the articlesare kept with the Institution or distributed to Madrasah of theState for benefit of the students.14.2 STATE INSTITUTE OF EDUCATIONAL MANAGEMENT ANDTRAINING (SIEMAT)As per para 1.9.10 (Sl.No.12) of the FRAMEWORK FORIMPLEMENTATION (Amended till 31 s t March, 2008) of <strong>Sarva</strong> <strong>Shiksha</strong>
215<strong>Abhiyan</strong> (SSA) read with para 33 of the Manual on FINANCIALMANAGEMENT AND PROCUREMENT, the Project Approval Board(PAB) (MOHRD) approved allocation of fund (Rs.3 crore) in 2003-04after ensuring that the state had agreed to open SIEMAT with a clearcommitment to sustain it. Accordingly the state project office (PBSSM)paid Rs.430.50 lakh (Rs.300 lakhs allotted by PAB plus Rs.130.50 lakhsfrom District Primary Education Project (DPEP) fund) to the Director,State council of Educational Research & Training (SCERT), <strong>West</strong> <strong>Bengal</strong>on 25 t h October, 2004 and 2 n d March, 2005 for construction of thecomposite building of SCERT & SIEMAT.Records revealed that a plot of land measuring 13.6394 cottah wasallotted by the State Government to SCERT. Records also revealed thatthe Letter of Intent was issued to M/s. Mackintosh Burn Ltd. by theSchool Education Department on 25 t h February 2005 for construction ofthe Building. But the construction work was not commenced andultimately the Director, SCERT refunded the entire amount ofRs.35102852/- (including interest released by Govt. of India, statedSupra). Rs.300.00 lakh being spill over from 2004-05 sanctioned by PABin 2005-06 in respect of SIEMAT. No provision in 2006-07, 2007-08 and2008-09. On 1 s t Janaury 2008 and Rs.1,30,50,000 (DPEP fund) on 20 t hMarch 2007 to the State Project Director, PBSM retaining interest ofRs.1301021 on DPEP fund. Reasons for not commencing the constructionwork were not on record. Mention may be made here that no spill
216please be stated over of the amount allotted by PAB (Rs.3 crore) wasallowed in the AWP&D for 2006-07, 2007-08 and 2008-09.As per para 6.16 (6.16.1 and 6.16.2) of the a FRAMEWORK FORIMPLEMENTATION (Amended till 31 s t March, 2008), the <strong>Sarva</strong> <strong>Shiksha</strong><strong>Abhiyan</strong> emphasizes quality improvement in elementary education forwhich it deems necessary that resource groups and responsibilitycentres from national to sub-district levels are identified and thesegroups would oversee the policy, planning, implementation andmonitoring of all quality related interventions. SIEMAT, one of themost important Resource groups and Responsibility centres at the Statrelevel, being not constituted in the state, the purpose for which the Govt.of India allotted the fund to PBSSM, VIZ to constitute SIEMAT enablingit to advise and assist at various levels in curriculum development,pedagogical improvement, teacher education/training and activitiesrelated to classroom transaction etc, did not come into friction.14.3 IMPROPER UTILISATION OF FUNDMarui Beria’s Ainul Ulum Senior Madrasah, Diamond Harbour,South 24 Parganas District received Rs.10.50lakhs during the periodfrom 25 t h March 2006 to 5 t h March 2008 for construction of 6Additional class rooms (ACRs). On physical verification of the site on21 s t January 2009, it was noticed that only one ACR was fullyconstructed on the ground floor. In two ACRs on the ground floor, two
217rooms without partition had wall already been in existence with “Tolly roof” which had been replaced by casting new roof. But work onceiling, flooring, fixing of windows, partition wall etc. was notexecuted. In the first floor, one ACR was constructed with 5” wall.No accounts of expenditure incurred justifying the authenticity ofutilization of Rs.10.50 lakh could be furnished to the study team. 11teachers including the secretary of Staff council and one non-teachingrepresentative being employee of the school stated (January 2009) aboutirregular utilization ofRs.10.50 lakh. This was intimated to the DPOSouth 24 Parganas for investigation.(ii) Further all the abovementioned Teachers including the nonteachingstaff started that they will to at all aware of what kind of(a) TLMs were purchased out of Rs.21500 received during 2005-06(Rs.7500), 2006-07 (Rs.7000) and 2007-08(Rs.7000) and (b) bookswerepurchased out of book grant of Rs.30000/- received during 2005-06(Rs.10,000), 2006-2007 (Rs.10,000) and 2007-08 (Rs.10,000). No accountsof expenditure in this respect could be shown to the Study Team.The President of the Senior Madrasah was absent despite receiptof intimation regarding the visit by the study team. As such the matterwas intimated to the DPO, South 24 Parganas for investigation in thematter.
218Apart from the above, one voluntary Resource person continuedto draw salary from 2006-07 to Rs.2007-08 (Rs.18315) on occasionalvisit to the school asneither any attendance nor any nature of workdone could be shown to the study Team (January 2009).14.4 MISUTILISATION OF RS. 5.08 LAKHKalitala Diara Raja J.K. High School,Murshidabad Districtreceived Rs.5.10 lakh on 27 t h February 2007 (Rs.1.70 lakh) and 13 t hApril 2007 (Rs.3.40 lakh) for constructionof 3 Additional class rooms(ACRs). During visit of the school on 13.12.2008, it wasascertainedthat through the school Authority incurred expenditure of Rs.5.08 lakhduring the period from May 2007 to May 2008 for construction, therewas no trace of 3 ACRs. Only 3 alls were constructed.Teachers of the School stated that the Secretaryof the SchoolManagement committee was responsible for such misutilisation but thelatter tendered resignation. It was also noticed that the Junior Engineersupervising the work did not report the matter to the DPOMurshidabad with detailed accounts of expenditure.The matter being pointed out to the DPO, the latter intimatedthat necessary investigation would be conducted.
219CHAPTER-1515 FIELD VISITSIn the selected 2 districts, viz. Murshidabad District andSouth 24 Parganas district, the Study team visited the DistrictProject Offices of both the districts, 3 circle level Resource Centreoffices and 56 schools. The Team also visited 2 NPEGELentre and 1KGBV hostel including surprise visit to 6 schools area 1 Maadrasha(16 Ups and 40Ps). The team also visited 2 NPEGEL centres and 1KGBV hostels.15.1 DISTRICTS
220An abstract of specific features (relating to ElementaryEducation) of the two districts visited by the team is givenhereunder :15.1.1 Murshidabad : The district is agro-based and about 80 percent of the population is engaged in agriculture. There is nobig industry in the district except one Thermal Power Plantat Farakka. The district has only some small scale & collegeindustries such as Brickfield works, Bidi making, silkweaving etc. So population of near about 6 million has noalternative but to depend on agriculture and small businessto earn their livelihood.♦Another aspect is Migration. Labourers along with theirchildren and families migrate frequently to different parts ofthe state and the country in search of various occupations.Because of this situation, children of these families cannotget access to formal schooling.♦Another concern is the situation and border problem withBangladesh.♦All 26 blocks of the districts are having more than 20 percent Muslim Population.♦Seasonal migration is the main problem in 9 blocks out of thetotal 26 blocks.
221♦Early marriage of girls is the major cause of drop out forgirls among minority/SC/ST.15.1.2 South 24 Parganas: The geographical location of theSundarban area is vulnerable for natural calamities suchcyclones, thunderstorms with occasional floods, whichseverely affect the habitations and stall the existinginadequate communication facilities through vessels.♦ The massive dependence on water transport systemalongwith inadequate landing facilities practically makes thearea inaccessible during rainy season.♦About 53 percent of the working population is directlydependent on agriculture forest products, fishery andcottage industry.♦A seizable part of the child population is engaged incollection of tiger prawn seedlings.♦ Incidence of poverty and malnutrition, particularly inSunderban areas is quite high.♦There are many islands surrounded by river, rivulets andestuaries and continuously facing the high and low tide withcomparatively high level of salinity and soil erosion.♦♦The district shares the International border with Bangladesh.A sizeable population of the district belongs to SC/ST andminority communities.
222♦A section of the population is engaged in the production ofseasonal fruits like guava etc. The children also engaged inthe production process. Out of 29 blocks, 22 blocks arehaving more than 20 per cent Muslim population.During field visit, the team had extensive interactionwith the VEC Chairman / Members, the Headmasters,Teachers Students and Parents. Interviews were conductedwith the parents, students, VEC Chairman / Members,Teachers/ Headmasters based on a Structured questionnaire.In addition, the basic records maintained by the schools wereexamined. The team visited 30 schools (9 upper primaryschools and 21 primary schools) & 2 CLRCs in the district ofMurshidabad and 26 Schools (7 upper primary schools and19 primary schools), 1 CLRC, 2 NPEGEL centre and 1 KGBVhostel in the district of South 24-Parganas.15.2.3 The position of civil infrastructure (building, toiletdrinking water facilities, boundary wall and electrification)as noticed by the team during field visits was as follows :(A1) District Project Office Building, District – MurshidabadThe District Project Office Murshidabad had nobuilding of its own and was housed in a rented premises. The
223accommodation available for the DPO was inadequate.However the office was having electric connection and toiletwith water connection.(A2) District : South 24 ParganasThe district Project Office, South 24 Parganas wasaccommodated in the premises of District Collector’s officefree of cost (rent free). The accommodation was not sufficientfor the DPO. However the office was having regular supply ofelectricity and toilet with water connection.BCircle Level Resource Centres (CLRC) Builidings-All the 3 CLRCs viz Kandi and Sadar <strong>West</strong> underMurshidabad District Project Office and Diamond HarbourSouth under South 24 Parganas District Project Office visitedby the Study Team, had their own office building and whichalso accommodated the offices of the Sub Inspector of Schools(SI/s), perfrorming <strong>Sarva</strong>shiksha duties addition to their (SI/S)normal duties as SI/S they had to perform the duties of circleProject Co-ordinator (CPC). The accommodations available forCLRC offices were, therefore, not adequate. The CLRC officeswere having electric connection and toilet with waterfacilities.15.3 School Buildings :Position of civil works of the 56 schools (includingsurprise visit to 6 schools) visited by the Study Team was asunder :
224(i) Schools having dilapidated buildings.Para 27.2, 27.3 and 27.4 of the Manual (MFM&P) proviefor maintenance of school buildings :As envisaged in the Manual, there was no distinctionbetween major or minor repairs. All repairs and maintenanceshould be carried out within Rs.5,000/- per year.Repairs beyond Rs.5000/- could always be taken up bysourcing of other funds. Schools having upto three classroomswould be eligible for maintenance grant upto a maximum ofRs.4000/- per school per year, while schools having more thanthree classrooms would get a maintenance grant uptoRs.7500/- per school per year, subject to the condition that theoverall eligibility for the district would be Rs.5000/- perschool per year.However, it was noticed by the team that maintenance@ Rs.5000 per school per year was being released to theschools by the DPOs Murshidabad and South 24-Parganasirrespective of the number of classrooms of the schools. Nocase of sourcing of other funds for this purpose was noticed.The table below indicates the position of some dilapidated schoolbuildings visited by the teamSl.No. Name of School Remarks1 Parbatipur Primary (KandiCLRC)2 Purandarpur High (Ups)Kandi CLRC6 rooms of the building werefound in damaged condition andwere unusable without repairingThe school building was more than42 years old and a portion was indilapidated condition.3 Krishnamati GS Primary The school had no RCC roof on
225(Sadar <strong>West</strong>)4 Haridasmati KalachandPrimary (Sadar <strong>West</strong>)5 Mahalandi G.C. High(UPS) (Kandi CLRC)6 Netriabad F. Pry (CanningCLRC)7 Howramari F.P. (CanningCLRC)one of the classrooms and made ofcorrugated asbestos. As reported,during rainy season classroomswere in innundated due to leakageof Water through the asbestosroof.The school building was not ingood condition. During rains,water was soaking through thewalls dampening whole classroom. A new classroom was underconstruction. But the work ofconstruction, which wasreportedly being executed bycontractor in violation of SSAnorm, was lying incomplete andthe work remained suspended forthe last 3-4 monthsThe windows of other classroomswere uncovered (No window panswere there).5 of the 10 classrooms were indilapidated condition. The factwas reported to CLRC (asinformed to the team) without anyaction..The school building was in a badshape. The building had no RCCroof. Theroof was made ofasbestos sheet. As reported thehall in which the classes were heldwas inundated due to leakage ofwater through the porous asbestos– during rains. Windows had nocover/pans. Floor was founddamaged and the students sit onthis damaged floor (on mats.)Old building – having 3classrooms. During rains, waterleakage through the roof. Allwindows were found broken. Iclassroom was newly constructed.2 classrooms were in dilapidatedcondition requiring repair.1 class room out of 2 class roomswas found dilapidated8 Mahalandi mandalaparaPrimary (Kandi CLRC)9 Namukandi Primary(Kandi CLRC)10 Kadambari Primary The school building was partially
226(Kandi CLRC) damaged and water leakedthrough porous of the roof duringrains, as reported.11 Gajdharpara High (UPS)(Sadar west –Murshidabad)12 Iswaripur new FP(Canning CLRC)13 Roynagar FP (DiamondHarbour South)14 Udaichandpur JuniorBasic (Kandi CLRC)15 Rajnagar BiswambharHigh (CLRC) (UPS)The school building was not ingood condition and dilapidated.The school building needed majorrepair immediately.One classroom was in dilapidatedcondition requiring immediaterepair. Despite repeated requestfor repair no action was asreported not taken. During rainwater leaked innundating theroomThe ground floor of the school wasfound damaged requiringimmediate repair.Seven classrooms weredilapidated. No classes could beheld in these rooms. Immediaterepair was necessaryThe old building was more than 60years old. One portion wasdangerously positioned. Thedamaged roof would come downanytime risking the life of thestudents as well as the teacher.The class rooms were completelydilapidated condition requiringimmediate renovation/repair. Theother portion of this building hadno RC roof. The roof was made oftin and as reported the classroomsof this portion of the buildingwere inundated due to leakage ofwater profusely through the tinshades.(ii) School building in good condition :Overall condition of remaining 41 school buildings wasfound to be more or less satisfactory except that some of thebuildings required repairs to be carried out in floors, wallsand windows etc.
227(iii) Repair of buildings :In some of the cases maintenance/repair grant wasreceived, but was not utilized although immediate repair ofbuilding was necessary.(a) Rs.5000/- each received during 2005-06 2006-07 and 2007-08 was duly spent on maintenance of dilapidated (serial14 above) school building by Udaichand Junior BasicSchool of Kandi CLRC. But Rs.70,000/- received by theschool towards repair of the building during 2008-09 (on27-07-2008) could not be utilized due to non-formationof new WEC. However, this was not pointed out to theSIS authority for getting the work done by the existingWEC.(b) Similarly, maintenance grant Rs.5000/- received byRoynagar FP under Diamond Harbour South CLRC couldnot be utilized due to non-formation of WEC. (serial 13above)(c) Four classrooms of Fraserganj KPA Vidyapith were notin good condition in as much as the work relating tofloor and plastering were not done.The school received only Rs.5000/- asmaintenance grant in 2007-08 which was found notsufficient to take up and complete this work. The matterwas not intimated to the SIS authority.15.4 Drinking Water :
228Under SSA norms, one time grant of Rs.0.15 lakh fordrinking water facilities was payable to those schools whichwere not having such facilities.During field visit, the study team noticed the followingstatus of water facilities available with schools.(i) Schools having no water facilities :10 schools (viz. Udaichandpur Junior Basic,Khidirpur Primary, Ugra Bhatpara Primary andKadambari Primary under Kandi CLRC, RatanpurHiramati Dey GSFP under Sadar <strong>West</strong> CLRC ofMurshidabad District Ganti Jagannath Vidyaniketan,UPS having NGEPEL attached under Canning CLRC andRoynagar FP, Rabiandra Primary, Hazipur (North)Primary under Diamond Harbour South CLRC) RajnagarBiswambhar Primary under Namkhana CLRC out of 56schools visited by the Study team were not having waterfacilities. Student had to fetch water from nearby watersource or from their residence.(ii) Schools having water facilities – which were eitherinoperative or the water supplied were unclear/unhygenicSl.No. Name of School Remarks1 Purandarpur High Madrasa(UPS) (Kandi CLRC)The only Handpump (Tubewell) wasnot in working condition.2 Belpukur Primary (Sadar One of the two handpumps was out
229west, Murshidabad)3 Bhakuni Primary (Sadarwest Murshidabad)4 Atkrishna Rampaur Primary(Diamond Harbour South)CLRC5 Ram Rampur Basic Primary(Diamond Harbour SouthCLRC)6 Sukanta Smrity Primary(Diamond Harbour SouthCLRC)of order.One of the two handpumps was outof orderOne hand pump exists. Butreportedly water was not clear andhygienic.One hand pump not in operation.Water connection exists. But studentsdid not get clear and hygienic watersupply. Water was being brought bystudents from their residence or faroff place.All other schools, visited by the team, were havingwater facility, the source of water being hand pumps(barring 2/3 schools which had pipeline connection). Some ofthese hand pumps were made arsenic free as per reports ofrespective school authorities.15.5 Toilet :Schools having no toilet were to get one time grant ofRs.0.20 lakh each for providing this facility.During visit of schools it was noticed by the team –(i)Out of 56 schools visited 5 schools (viz. Raja M.C. Girls HighSchool (UPS), Sri Bishnu high School (UPS) under KandiCLRC, Howramari High School under (UPS) Canning CLRC,Diamond Harbour Balika Vidyalaya (UPS) under DiamondHarbour South CLRC and Rajnagar Bisambhar High (UPS)under Namkhana CLRC had 4 or more toilets without waterconnection excepting Raja M.C. Girls School, 23 schools –comprising 7 schools (viz. Mahalandi Mandal para Primary,
230Purandarpur High, Nabagram Sauntapara Junior Basic,Jibanti Primary, Ugra Bhatpara, Purandarpur High Madrasahand Udaichandpur) under Kandi CLRC, 6 schools (viz.Krishnamati G.S. Primary, Haridasmati Kalachand Primary,Ratanpur Hiramati Dey G.S.F.P. Bhakuri Primary,Gajdharpara High and Kalitala Diara R.J.K. JuniorBasic)under Sadar <strong>West</strong> CLRC of Murshiaabad District, 2 schools(viz. Ganti jagannath Vidyaniketan and Netrabad F.P. ofCanning CLRC, 1 school (Laxmi Parbatipur Primary) underNamkhana CLRC and 7 schools (viz. Atkrishna RamapurPrimary, Rajnagar K.S. Paura Vidyalaya, Madhavpur StatePlan Primary, Sultanpur Satyayug Primary, Hazipur (North)Primary and Diamond Harbour High) of Diamond HarbourSouth CLRC had 2 toilets and all without water connection,16 schools (viz. Parbatipur Primary, Nimukandi Primary,Mahalandi G.C. High, Udaichandpur Jr. Basic, KhdirpurPrimary and Kadambari Primary under Kandi CLRC, -Bhakuri Junior Basic, Banjetia Srikrishna Primary, BelpukurPrimary, Pakuria Adarsha Primary, Kalitala Diar RJK Highand Saluadanga High Under Sadar <strong>West</strong> CLRC Murshidabaddistrict – Rabindra Primary and Parulia South Primary underDiamond Harbour South CLRC and Rajnagar BiswambharPrimary and Frasergunj KPA Vidyapith (UPS) high underNamkhana CLRC had only one common toilet each (school)without water connection. Boys of these schools generallyhad to use open space or roadside for meeting their urinalpurposes. Sometimes the girl student had to go to theirresidence for toilet purposes which took away a portionvaluable class time. The condition was worse where girls of
231classes VII/VIII had to share common toilet. However, in 3schools viz. Kalitala Diara RJK High, Saluadanga High andFrasergunj KPA Vidyapith having 1 toilet each were beingused by girl students only and the boys of these schools hadno toilet.(ii) The following schools had no toilet facility :Sl.No. Name of School Remarks1 Sribishnu Primary (KandiCLRC)2 Banjetia Primary (Sada r westCLRC)3 Paschimgamini Primary (Sadar<strong>West</strong> CLRC)For toilet pur pose students use open spa ce oruse nearly h igh sch ool.For toilet pur pose students use open spa ce oruse nearly h igh sch ool.Girl studen ts use Tea cher’s toilet and boystuden ts use open space – road side4 Jibantala FP (Canning CLRC) Studen ts use teacher’s toilet5 Howramari Primary (CanningCLRC)Girl studen ts use Tea cher’s toilet and boystuden ts use open space – road side6 Iswaripur new FP (Canning Girl studen ts use Tea cher’s toilet and boyCLRC)studen ts use open space – road side7 Deuliganti Primary (Canning Girl studen ts use Tea cher’s toilet and boyCLRC)studen ts use open space – road side8 Narayanpur Jr. Basic (DiamondHarbour South CLRC)9 Roynagar FP (DiamondHarbour South CLRC)10 Dhanberia Primary (DiamondHarbour South CLRC)Girl studen ts use Tea cher’s toilet and boystuden ts use open space – road sideStuden ts were sen t to their residence for toiletpurposes. Study h our was wastedStuden ts use open spa ce for toilet n eeds.11 Sukanta Smrity Primary Studen ts eith er use Teachers toilet or openspace for their toilet needs12 Ram Ra mpur Basic Pr imary Girls studen ts were sent to th eir residen ce formeeting toilet n eeds. Boys met their toiletneeds by using open spa ce / r oa d side.(iii)Schools having no separate toilets for Girls student.The following schools were not having separate toiletsfor girls student.Sl.No. Name of School Remarks1 Parba tipur Primary2 Nimu Kandi Primary3 Mahalandu G.C. High (UPS) Girl studen ts of Class-VII – VIII also hadto share a common toilet.4 Jibanti Primary5 Udaichand Jr. Basic
2326 Khidir pur Primary7 Ugra Bhatpara Primary8 Kadambari PrimarySadar <strong>West</strong> - Murshidabad9 Bhakuri Jr. Basic10 Banjetia Srikrishna Primary11 Krishnamati GSP12 Belpukur Primary13 Pakuria Adarsha Primary14 Diamond Harbour SouthCLRC Rabindra Primary15.6 Boundary wall :In terms para 26.1 (g – amended as f) of Manual onFinancial Management and Procurement construction ofboundary walls would be approved in extreme cases likehilly terrain, forest areas or urban areas subject to furnishingjustification. The geographical situation and specific featureswith regard to Elementary Education of the 2 Districts,(visited by the team) viz. Murshidabad and South 24-Parganas as given in this Chapter (para) would havejustified construction of boundary walls in most of theschools under these districts. However, the State Mission didnot include any target for construction of boundary wall (forthese two districts) in the budget proposed for the years2005-06 to 2007-08.During school visit, the study team noticed followingposition of boundary wall :
233(i)In Kandi CLRC, only 3 schools (Raja MC Girls High School-UPS, Jibanti Primary School and Kadambari Primary School)had full boundary wall and 2 schools (Parbatipur PrimarySchool and Mahalandi G.C. High School – UPS) had partialboundary wall. The remaining 11 schools of this CLRCvisited by the team had no boundarywall.(ii) In Sadar <strong>West</strong> CLRC of Murshidabad district out of 14schools visited by the team only I school (Bhakuri Jr. BasicSchool) had boundary wall and 1 School (Pakuria AdarshaPrimary School) had a dilapidated/broken boundary wall. Noother school under this CLRC had boundary wall.(iii) One School (Howramari High School) under Canning CLRChad full boundary wall while another school (Netrabad FPSchool) had wall on 3 sides of the school. The remaining 5schools of the CLRC had no boundary wall.(iv) Out of 15 school visited by the team is Diamond HarbourSouth CLRC, only 3 schools (Dhanberia Primary School,Diamond Harbour Balika Vidyalaya and Diamond HarbourHigh Schol) had complete boundary wall and 4 schools(Atkrishna Rampur Primary, Sultanpur Satyayug Primary,Sukanta Smrity Primary and Diamond Harbour TownPrimary School) had partial boundary wall.(v) Out of 4 schools visited by the team in Namkhana CLRC,only 1 school (viz. Laxmi Prabartak Primary) had boundarywall. Remaining 3 schools had no boundary wall.
234Thus out of 56 schools visited by the team 39 schoolhad no boundary wall while some schools badly needed thesame to save school property and for safety of students.15.7 Electrification :The study team visited 40 Primary (including Jr. BasicPrimary) Schools and 16 upper primary (includingMadrasah, NPEGEL & KGBV) schools. Out of 40 primaryschools, only 12 schools had electric connection (viz.Ratanpur Hiramati Dey GSFP, Pakuria Adarsha Primary,Bhakuri Primary, Jibantala FP, Howramari Primary,Atkrishna Ramapur Primary, Narayanpur JB, Roynagar FP,Rabiandra Primary, Madavpur State Plan Primary, ParuliaSouth Primary and Rajnagar Biswambhar Primary). None ofthe remaining 28 primary schools had electric connection.However, all the 16 upper primary schools visited by theteam had electric connection. 2 UPS (viz. Ganti Jagannathmahalandi G.C. High and Purandarpur High Madrasah)reported irregular supply of power.15.8 Delay in Completion of civil work.
235The commencement / completion of the following civilwork was delayed due to various reasons like shortage offund, land problem etc.ADistrict MurshidabadSlNo.Name of School CL R C1 Namdhari Pri mary,K a ndi2Pu ra ndarp u rkandiHigh,3 Shri Bi shnu P ri maryK a ndiNature ofConstructionACR-1ACR-1Toi l etACR-1ACR-1Toi l etACR-2ACR-1Toi l etAll ot te dFund(Rs.inla kh)1 .851 .850 .301 .501 .700 .353 .701 .700 .30Rele a seOf Fund(Date )(Rs. inla kh)1 1 -0 3 -0 80 7 -0 5 -0 82 0 -0 7 -0 83 1 -0 3 -0 53 0 -0 3 -0 63 0 -0 3 -0 63 0 -0 3 -0 61 6 -0 3 -0 60 1 -0 9 -0 8Date ofCommencementDate ofCompletio nNot yet taken up(Decemb er, 2008)June2 0 0 7Dela y in Communicate /comple te d1 6 -1 0 -0 7 2 6 months1 40 9 -0 5 -0 8 1 9 -0 4 -0 8 2 5 months1 4 -0 9 -0 6 20 -1 1 -0 6Wor k n ot start ed(Decemb er, 2008)4 Ma halandi G.C. High ACR-2 3 .40 2 1 -0 6 -0 7 Jul y 2007 I npr og re ss6 month sNo delay butFund exha usted5 Banjitia GSPE ACR-1 1 .70 2 5 -0 2 -0 6 1 4 -0 6 -0 6 2 6 -0 9 -0 6 3 month s6 Sri Bishn u High ACR-1 1 .70 2 8 -0 2 -0 7 0 7 -0 8 -0 7 2 5 -0 1 -0 8 5 month s7 Ma halandi Ma ndalparaPri ma ryC RC 2 .00 1 5 -0 5 -0 7 1 5 -1 2 -0 7 2 5 -0 2 -0 8 7 month s8 K a ndi RMC Girl s High ACR-1 1 .70 0 9 -0 2 -0 7 1 1 -0 9 -0 7 2 0 -0 4 -0 8 7 month s9 Saludanga High ACR-1 1 .85 2 9 -0 2 -0 8 Wor k not sta rted (Decem be r, 2008)1 0 Pa ku ri a Pri mary ACR-1 1 .70 2 9 -0 2 -0 6 1 6 -0 2 -0 7 1 8 -0 6 -0 7 1 1 monthsIt would be evident from the above that delayu ranged from3 to 26 months reasons for which were not specifically onrecord. Besides no assessment was made for allotment offund with physical verification of existing class rooms priorto payment of the amount to the school in terms of para 24.1of the MFM&PB District South 24 Parganas :
236No instance of delay in commencement of Civil workwas noticed except in 3 schools (Rabindra Primary,Madhavpur State Plan FP and Roynagar K.N.S. High)(i) Rabindra Primary :Fund for Rs.1.80 lakh for 1 ACR was released on11-09-07 for completion within 31 s t March, 2008. But thework was not completed (January, 2009) as the fund wasexhausted..(ii) Madhavpur State Plan FP :Fund for ACR (Rs.1.85 lakh) was released on 26-04-08.But work of construction could not be commenced on theground of non formation of new WEC.(iii) Roynagar Khetranath Sunil Bara Paura Vidyalaya :Fund for Rs.3.70 lakh was received for construction of2 ACR on 11-1-2007. The construction could not becommenced due to lack of space and the fund was lyingunutilized till date (January, 2009).15.9 IDENTIFICATION OF PLANNING TEAMThe procedure for planning, stated in parachapter wastotally absent in the schools/ VEC/WECs/ CLRCs visited by theteam.It was learnt from the VEC/WEC/Schools visited by theteam that they were never asked to prepare or involve in theplanning/budgetingprocess nor their repeated representationfor inclusion, in the district AWP&B, of non existence of
237toilets/drinking water arrangement/poor and/or unhygienicwater arrangement through hand pumps, unusuable toiletsnon-existence of separate toilets for girls etc. were neverconsidered. It was reported to the visiting team by theCLRCs that the District Project Authorities neither asked theCLRCs to submit any plan or budget for inclusion in thedistrict AWP&B nor, if at all, any plan submitted by theCLRCs was considered for inclusion in the district AWP&B.15.10 COMMUNITY PARTICIPATIONAs per para 1.8 of MFM&P, at the village level the criticalunit was village Education Committee (VEC)/Ward EducationCommittee (WEC) which assisted the basic education system inSecuring the cooperation and participation of the local communityand at the same time overseeing implementation of SSA in thevillage. VECs / WECs are assist by the other grassroot levelstructures like SMC, MTA, PTA etc. WEC would undertake surveyin the area under its jurisdiction to identify children within theage group of 5+ to 13+ (6 – 14) years and ensure that none of thesechildren are left out of school.It is the responsibility of the District Project Office (DPO) toimpart adequate training to the VEC members, process in respectof identification, maintenance and updating of child Register.During visit of schools the study team came to know throughinterview and interaction with teachers/parents/VEC members thatin several cases teacher in charge/teachers of the schools and notthe VECs as per provision of SSA guidelines conducted door to
238door survey and identified the children and recorded their(children) Profile in the child Registers. The Registers, as required,were being updated annually in most of the cases. Due to reportedongoing survey for updation of child registers, a few number ofschools could not present the village Education Register (VER) tothe study team. As per available records (VER), 277 children wereout of school. There was nothing on record/or explanation whetherany initiative was taken by the VEC to persuade the family/parentsof the out of school children to send them to school and undertakestudy. Lack of motivation on the part of VEC might frustrate thevery objective of SSA as to provide elementary education to allchildren in the age group 6 to 14 years by 2010. As per norms forinterventions under SSA, training of community leaders for 4persons in a village plus 2 persons per school for 2 days in a year(preferably women) is to be arranged and expenditure at the rateof Rs.30/- per day per person is to be incurred. There were 229village samsad (not villages) under 3 CLRCs visited by the team.However number of community leaders trained from these CLRCand expenditure incurred there against could not be madeavailable to the team. As noticed, the members of the VEC/WECdid not have necessary training/guidelines towards management ofschools and keeping their (schools’) books of accounts etc. Alladministrative, accounting work organization of mid-day mealprogramme and keeping of stock and stores thereof were theresponsibility of the Headmaster. These apart, the Headmaster hadto perform a good number of other non teaching activities. As aresult, there was very little time left for him to concentrate onteaching job.
239During the period 2005-06 to 2007-08, VEC/WEC meetingsheld in 34 schools out of 40 schools (primary) visited by the teamand the number of meetings held was minimum of 12 andmaximum of 46.The study team did not find recorded any matter, discussedin the VEC meeting which was considered reportable/reported toCLRCs/DPOs.The study team strongly felt, that VEC/WECs’ involvementin the SSA is to be intensified. Interaction and coordination at alllevels right from district to village were to be geared up.15.11 Formation of School Building :SSA provide that every primary school building should have atleast 2 rooms with a verandah and there should be at least 2 teacher in aprimary school.It was noticed during visit of schools that 22 out of 40 schoolswere having 4 or more class rooms. In some of these schools a fewclassrooms remained unutilized as classes could not be held due tolesser number of teachers. As reported, at times it becameunmanageable of 4 classes (I – IV) by 2 teachers, particularly, when I ofthese 2 teachers had to be involved in other activities (including nonteaching activities). A few teachers of such schools expressed the viewthat more teacher would be preferable than ACRS.15.12 Sitting arrangementStudents of all classes (I – IV) in 20 primary schools out of 40primary school, visited by the team, had to sit on floor using
240cement bags, Mats etc. students of class I of all but 2 primaryschool and students of Class II of all but 5 primary schools had tosit on mats. Besides the sitting space available were not as per SSAnorms. In some of these schools, students were accommodated inopen (uncovered) verandah or even under the shade of tree. Thepresent arrangement added more discomfort during winter andrainy seasons.Upper primary schools had two bench sitting arrangement.Consequent on SSA programme, admission to upper primaryschool had been increased and the sitting arrangement became insufficient.15.13 Attendance of Students :The study team visited 2 districts and covered 56 schools(including surprise visit of 6 schools)Review of attendance registers of students revealed that whileaverage 81 per cent presence was registered on the days of visits of 30schools in Murshidabad district (out of 13159 enrolled students, numberof students found present was 10785) the average percentage ofattendance in the schools of South 24 Parganas was 60 on the days ofvisits of 26 schools by the team out of 9101 enrolled students numberstudents found present was 5445). However, percentage of attendancein schools of Murshidabad varied from 47 to 98 percent and that ofSouth 24 Parganas varied from 33 to 100 percent.
241Students interviewed disclosed that the activities likeattractive method of teaching, Teachers, reading of text books,association with friends attracted them most to come to school.Students also stated during interview that the teachers were notharsh to them rather affectionate and made the learning joyful.They kept track of absentee students.15.14 Mother – Teacher Meeting :Out of 56 schools, the meetings were held once in a month in3 seconds, 10 meetings annually in 1 school, 9 meetings annuallyin I school, 6 annually in 6 schools, 5 annually in 1 school, 4annually in 4 schools, 3 annually in 3 schools, twice annually in 6schools. Meetings were held occasionally in 8 schools and nomeeting was held during the last 3 years in 23 schools (includingnon formation MTA as yet).It is imperative that the Mother Teacher Association beformed immediately and hold more meeting for transparency andmothers take much more interest in the helm of affairs of theschools for the benefit of the schools as well as improvement ineducation system and progress of students.15.15 School Uniform :Most of the students of Primary Schools were not found inuniform due to poverty as stated by teachers/VEC members.However, the position of uniform of students of UP schools wasfound to be more less satisfactory.15.16 Black Boards :
242In all the schools visited by the team, arrangement of blackboards either on the walls or through separate wooden planks had beenmade and found fixed on the wall.15.17 Health Check of Students :It was noticed that no periodical or otherwise health check up ofstudents was carried out by the Health Department of Government of<strong>West</strong> <strong>Bengal</strong>.15.18 Play Ground and Playing Materials :During visit of schools it was noticed some schools, mainlyprimary, were not having playground for the students and in a fewschools small playgrounds were there, but those were not found tobe suitable for outdoor sports/games. Further in one of the schools(viz. Diamond Harbour Balika Vidyalaya) there existed a pond,owned by a private person, in the middle of the playground whichhindered the normal playing condition. In most of the PrimarySchools, there were not enough playing materials, particularly forgirl students nor the students were encouraged much to play.15.19 TRANSPARENCY :The display board had to be maintained by schools to showall investments being made in the school alongwith details ofgrants received and expenditure incurred in order to highlighttransparencyIn course of visit of schools, the study team noticed that –(i)46 out of 56 schools did not maintain display board.
243(ii)10 schools (Ps 9 and UPS I) had small display boardsdisplaying only the status of students on roll and present etc.But none of these schools displayed grants received andexpenditure incurred there against.In the interview, the parents of the students alsoconfirmed the fact.15.20 Pupil Teacher Ratio (PTR)Frame work for implementation of SSA envisagedproviding one teacher for every 40 children in PrimarySchool (at least two teachers in a primary school) and oneteacher for every class in the upper Primary Schools.As per available records the pupil Teacher Ration inthe State wasPupil Teacher RatioPrimary Primary Schools (Govt) 43.31 : IPrimary Schools (including 38.17 : 1para teachers)Upper Primary UPS (Govt.) 71.25 : 1UPS (including para Teacher) 40.01 : 1Status of PTR in schools in the selected districts visited by the studyteam was as underA Distr ict Murshida bad Average PTR Highest PTR Low est PTRSl.No. Primary / Upper Primar y1 Primary Sch ools 38.60:1 53.5:1 18.6:12 Upper Pr imary Sch ools 58.74:1 78.92:1 37.18:1B Distr ict South 24-Parganas Average PTR Highest PTR Low est PTR1 Primary Sch ools 54.66:1 242.5:1 16.33:12 Upper Pr imary Sch ools 66.70:1 131.1:1 37.81:1
244It emerges from the above table that while the highest PTR inprimary schools visited under Murshidabad district exceeded thenormal PTR of 40:1. The average PTR and the lowest PTR werewell below normal.The average PTR in the Primary Schools in South 24 Parganasexceeded the normal PTR by about 19 students against I teacher.However, highestPTR of 242.5:1 was alarmingly high. In fact agood number of Primacy Schools in South 24 Parganas were havingPTR ranged between 93:1 to 165.67:1, besides 242.5:1. This aspectneeds much closer monitoring by the authorities concerned for theimprovement of the situation.15.21 Teacher Attendance :During visit of schools it was noticed that a good percentageof teachers in a large number of Schools remained absent on thedays of visits. The average absentees in Murshidabad district was12 per cent and in South 24 Parganas was more than 5 per cent.During discussion, many of the teachers including teacher incharge reported that their services were being utilized also fornon-academic purposes like census, preparation of voters list,election duty pulse polio programme etc. resulting in loss tostudies so far as students are concerned.15.22 Teacher Training :More than 78 per cent teachers, of the 56 schools visitedreceived training under various Camps (including CLRCs, highschools etc.), organized by SSM and Education Department of <strong>West</strong><strong>Bengal</strong> on different subjects /fields since 2005-06.
245The subjects in which trainings were imparted included interalia Life Science, English, <strong>Bengal</strong>i, History, Mathematics,Geography, Environment, Disability, Computer etc. The durationof training ranged between 2 days to 10 days. The concernedteachers praised about the role of modules which were provided tothem. The teachers got a clear conception regarding knowledge,comprehension, application and skilled bare question. As regardsimpact of training, teachers of some of the schools stated that therewas no monitoring system to assess the impact of training andthey were, therefore, not in a position to comment on this aspect.However, some of the teachers stated that the trainingmodules on different subjects were of great help for furtherance ofknowledge and became easier to train students. They stressed thatthe experience gathered in the training were being utilized toenhance the level of education through joyful teaching.15.23 School Grading and Level of Education :One of the objectives of the SSA was to provide qualityeducation to the targeted children. Gradation of schools was ameans to determine the level of education imparted to students.The concept of minimum level of learning was not clear tothe teachers. Teachers faced difficulty, particularly in Class-I toset uniform pattern of teaching. To cope with the situation aguideline had been prepared. The system of gradation had beenintroduced to assess the quality of schools, although the same wasin initial stage. The following procedures for grading the schoolwere prescribed.
246(i)To enhance the performance of the students, the upperprimary school would conduct eight evaluation tests in anacademic year while for Primary Schools, three phases ofevaluation conducted by the District Primary School Council.(ii) For Primary Schools, circle level question would be preparedon the basis of question papers received from each school. Forupper Primary Schools, schools themselves would preparequestion papers and receive evaluation on those.During visit of schools, it was noticed that the system wasintroduced in 2 upper primary schools (viz. Purandarpur HighSchool and Kandi Raja M.C. Girsl School in Murshidabad District)The overall gradation received by Raja M.C. Girls High wasgood with 67 marks while the overall gradation in respect ofPurandar High was not available. However marks awarded to theSchool was 52. In no other school visited by the team the system ofgradation had been introduced.15.24 INSPECTION OF SCHOOLS :SSA envisages regular monitoring, inspection and evaluationto improve the quality and content of school education delivery. Inthe state Mission no system was in place to constantly monitorschool working and development work of schools throughperiodical visit by different authorities. The study team noticedthat circle level Resource Coordinators (SSIS) visited a few schoolswhile some of the schools were never visited. The Inspection were
247held in a customary fashion by recording signature in theAttendance Registers of the teachers. No Inspection <strong>Report</strong> orsuggestions for improvement was recorded.Inspection by officers at higher level was never carried out.There was no record in the State Project Office (as per therecords made available to the team) to indicate that the aspect waspursued from State Mission level. DPO at anytime during 2005-06to 2007-08 nor any written report of School Inspection conductedat CLRC level was available in the SPO/DPO.15.25 Teaching Learning Materials :Students of some schools reported during interview thattheir teachers did not use TLM (for procurement of which eachteacher got Rs.500/- per year) in the class. No register or otherrecord was found to be maintained showing the nature andindication of use in the classes. The TLMS were mostly procuredfrom the local market without observing Codal provisions. Theteachers were not applying their innovative quality to prepareTLMS suitable for the students.15.26 Free Text Books (FTB) –The scheme of supply of free text books by the Governmentof <strong>West</strong> <strong>Bengal</strong> to all children of Classes-I to V of the recognizedPrimary/Upper Primary Schools was continued. Hence supply offree text books to children of Classes-I to V was not beingprovided under SSM, WB in keeping with para 25.6 of MFM&P.
248However, supply of free text books or payment money (Rs.150/-per child) in lieu of free text books to all eligible children (Girls,SC/ST and Minority Students) of Classes-VI to VIII of therecognized schools was in vogue. But in course of visit of schoolsit was noticed that out of 16 Ups, some of the eligible students of 4recognized Ups did not receive free text books or money in lieu ofFTB as detailed below:No.of eligible student did notreceive FTB/Money(i) Kandi Raja MC Girls High School 2005-06 3902006-07 5272007-08 118(ii) Rajnagar Biswambhar High School 2005-06 1032006-07 2332007-08 149(iii) Mahalandi G.C. High School 2006-07 29(iv) Sribishnu High School 2005-06 N.A.2006-07 62007-08 7615.27 Mid-day MealIn terms of para 4.2 of MFM&P one of the focus areas of theSSA was to establish linkages with other social sector schemes andprogrammes of various agencies and derive benefit from them. Theother education programme as Projected in the State SSA Missionincluded inter alia Mid-day meal scheme. Mid-day meal wasintroduced with a view to Supplementing domestic meal, which asper Survey conducted fell short of calorific value by 300 calorieson an average for student coming from lower income group.Another objective was to attract children coming from below
249poverty line to get admitted in the school. The concept of the middaymeal scheme was that full day time square meal was to beprovided. The existing arrangement was as follows :(i)(ii)(iii)100 Gms. Of rice per head / per studentRs.2.50 (for other ingredients) per head / per studentRs.600/- to be paid to the look per month.According to the state SSA Mission, the scheme (Mid-daymeal) a Central/State Government Programme, was in vogue inGovernment Primary Schools in the state and revamping of theentire system was under Contemplation of Government.However, the study team noticed the following positionduring field visit of schools.1. As reported mid-day meal was being supplied regularly to 20schools (out of 56 schools visited) including 18 primary and2 UPS.2. Mid-day meal scheme was not introduced to 7 schools.3. Rice (Husked Paddy) was being supplied to 8 schools in lieuof cooked meal.4. In 21 schools supply of mid-day meal was suspended forwant of fund. It was reported by a number schools that middaymeals were not supplied regularly. Provions for 100 daysor even lesser days were given at a time. After the fund(provision) was exhausted, it took several months, - even 16to 18 months in some cases, after submission of utilizationcertificates (UCS) to release of next fund. The mid-day meal
250programme remained suspended till that time the next fundwould be available.It was reported by some schools that due to suspension ofmidday meals, students coming from lower income group/belowpoverty line, gradually losing, their interest in coming to schooland the attendance becoming thinner (absenteeism was beingincreased) Again, the fixed Quota (of 100 gm rice Rs.2.50 perhead/per day) was reportedly cut down by 15% considering samerate of estimated absenteeism.It was further reported that students receiving rice in lieu ofcooked meal were showing reluctance to accept the same (ricehuskedpaddy). As a result there was always a chance ofmisappropriation (of rice) of allotted Quota.No evaluation to assess the nutritional value of the mealbeing supplied to students was conducted nor there existed anysystem of monitoring the programme to resolve problems faced bythe schools with regard to running / continuing the scheme of middaymeal.15.28 Drop out students :Analysis of roll – strength for the 3 years 2005-06 to 2007-08of 56 (40 primary and 16 upper primary) schools visited revealed
251that retention of students all through the years of Primary / UpperPrimary level had not been maintained resulting in mid-term dropout of students.It was noticed that a total of 1192 drop outs took place in 12schools ranging from 1 to 352. Appropriate measures need to betaken for the retention of students through out the year so as tofulfil the objectives of UEE.15.29 Disabled Children :In 41 schools (30 Primary and 11 UPS) out of 56 schools (40Primary and 16 UPS) visited by the team, a total number of 377children were found enrolled. However, out of 377 enrolleddisabled children only 49 children were issued with disabilitycertificates. It was reported to the team that medical test to findout the percentage of disability had seldom taken place. Even, iftests were made neither the results of test nor certificates wereissued in most of the cases. Due to non-receipt of certificates thestudents (disabled) were being deprived of benefits, of neededaids/appliances in many cases.
25215.30 Non-availability of water facility and IED Resource room underCLRCDuring visit of school, a surprise visit was made to oneCLRC – Namkhana and found, inter alia, the following indeficiencies.1. (i) The CLRC had no water facility and the CLRC personnel hadto fetch water from more than ½ KM away from the office.(ii) There was also no IED Resource Room as a result of which itbecame difficult for the CLRC to maintain favourable /normal classroom situation. There were 50 Nos. of DisabledChildren under the CLRC 50 Disabled children alongwiththeir parents could not be accommodated in the meeting hallat a time.2. Low-paid/non payment of salary.Para teachers, Special Educators, VRP’ of differentschools and Demonstrator of KGBV Hostel represented to theteam about low salaries. Para teachers of schools underDiamond Harbour South CLRC of District South 24 Parganasreported (January, 2009) that they were not paid theirsalaries for the last 3 and half months.CHAPTER-16
253SUMMARY OF RECOMMENDATIONSTo conclude, some of the areas which need attention are :16.1 FINANCIAL MANAGEMENT :GOI may allocate fund intervention wise instead oflump sum as per approved budget for assessment ofperformance of each such intervention. There have beendelays in transfer of funds from Government of India andState Government. Often funds have been received towardsthe end of the financial year. While civil works budget is notlapsable the funds under other heads are likely to lapse. Thisaffects implementation of plan and causes a vicious circle oflow utilization, which in turn delays the release of nextinstalment.The funds received by SIS are to be released within 15days from the date of receipt from GOI to the districts. But inmost cases delay in receipt of grants ranged between 3 dayand 119 days during the period from 2005-06 to 2007-08. As aconsequence the transfer from districts to CLRCs and thenCLRC to VEC/SMC/WEC too was delayed by 01 to 79 days.Hence, improved flow of funds between GOI and thestate, between State and District and between District and
254CLRc, and schools is necessary and this should includespecial efforts to ensure liquidity in the first quarter of thefiscal year require necessary action to accelerate financialreporting for mobilizing subsequent allotments and(ii)enhanced internal audit capacities.16.2 There is no monitoring of the activities of WBBSE, WBBPE,WBBME, OBRSSM, RMV, DLB and SCERT with whom SSAfund of Rs.180.23 crore was lying as on 31 s t March 2008.Utilisation certificates furnished by these. Institutions areaccepted without verification of the actual work done. Thiswill be evident from the para chapter indicatingaccountal of Rs.lakh as revenueexpenditure insteadof capital expenditure/Asset created by PBRSSM out of SSAfund.SIS may take appropriate action for regularsupervision, monitoring and verification of the physical andfinancial performance of each intervention concerned byInternal Audit to ensure proper utilization of SSA fund.16.3 UTILISATION CERTIFICATESThe expenditure is booked on transfer of funds to thedistricts/sub-district level and not based on actual
255expenditure against UCs Auditobservations have been maderegarding improper maintenance of Utilization certificateregister by the districts/CLRC/VEC/WEC/SMC level. It isnecessary that at the district/CLRC/VEC/WEC/SMC levelregisters are maintained to monitor receipt of UCs andcorrect accounting procedure is followed.16.4 WIDE GAP BETWEEN PRIMARY AND UPPER PRIMARYSCHOOLThe SIS may concentrate financiala resources onexpansion of Upper Primary schools to reduce the wide gapbetween Primary Schools (49965) and Upper Primary Schools(9446) to 2:1 so as to ensure improved quality of education.16.4 OUT OF SCHOOL CHILDRENOne of the main objectives of SSA is reduction innumber of out of children and increase in enrolment. Thenumber of out of school children increased from 8,96,930 in2004-05 to 13,57,601 in 2006-07. Though as per record thenumber decreased to 4,56,215 in 2007-08, documentaryevidence showing enrolment of 9,01,386 children shoolwisein formal and non-formal school could not be shown to the
256Study Team. Special and different interventions are neededto reach out of school children.16.5 CAPACITY BUILDINGTraining and capacity building in accounts andmaintenance of accounts records of all concernedfunctionaries from state to sub-district level includingHeadmasters of schools must be given urgent attention. Itwas noticed in the District Project Offices Murshidabad/South 24 Parganas, CLRC, VECs/WEC/SMC that vitaldocuments records like asset register, etc. were notmaintained. Cash Book was not maintained in any primaryschool visited in the above two districts.15.6 FMP MANUALIt was noticed during visit to CLRCs/VECs/WEC/SMCin the Murshidabad and South 24 Pargnaas District that theFMP manual was not made available to these functionaries.A simplified version needs to be printed in English andtranslated in local language and supplied to all thesefunctionaries.15.7 INTERNAL AUDIT
257Internal Audit is an important internal control to getan assurance that rules, regulations and procedures as laiddown in the Manual are being followed, funds are properlyutilized and accounted for, reporting is accurate, any thereare no misappropriation or misuse of funds. Internal auditfor SSA was set up in July 2007. It is one team of twoofficials but given 20 educational districts and circles, SISmay deploy two or more teams for checking and identifyingweak areas in its entirety and for advice for improvement.16.8 CIVIL WORKSSchool infrastructure was a weak area in the state. Nowork for completion of 3300 Nos. UPS was taken up (30 t hSeptember, 2008) though target for this intervention wasfixed in AWP&B for 2008-09. As on 31 s t March, 2008, 5145Primary and 178 upper primary school were not havingdrinking water facilities and 5971 primaryand 345 upperprimary schools were not having toilets. Besides 28146primary and 881 upper primary schools were not havingseparate toilets for girls. Abnormal delay in completion ofcivil work was largely due to initial pace of civil work beingvery slow in the absence of any assigned technical staff.
25816.10 CWSNThe expenditures on CWSN interventions were 48.8 percent,39.97 per cent and 75.70 per cent of the approvedbudgets of 2005-06, 2006-07 and 2007-08 respectively.However, in 2008-09 (upto September, 2008), only 6.85 percent of the approved budget was spent. Till September 2008,187545 children though identified are yet to be enrolled.Special Educators are paid only Rs.5,500/- per monthfor coveriung a large numberschools where CWSN areenrolled. Besides they are to cover a considerable number ofresidences of urban and rural CWSN for which they are notbeing paid TA/DA. This aspect needs careful thought of theauthorities concerned.16.11 QUALITY OF EDUCATIONAnother important objective of SSA is improvement inquality of elementary education one of the important issuesin the state in the context of quality of education is theshortfall in respect of teacher and para teachers to the extentof 10344 primary regular teacher, 4219 primary parateachers, 18744 upper primary regular teachers and 3559upper primary para teachers as on 30 t h September 2008.Besides the expenditures on teachers training in 2005-06,
2592006-07 and 2007-08 were only 26.46 per cent, 32.23 per centand 60.57 per cent of the budget approved by PAB.