HP-UX Stress Testing - The Workshop On Performance and Reliability
HP-UX Stress Testing - The Workshop On Performance and Reliability
HP-UX Stress Testing - The Workshop On Performance and Reliability

You also want an ePaper? Increase the reach of your titles
YUMPU automatically turns print PDFs into web optimized ePapers that Google loves.
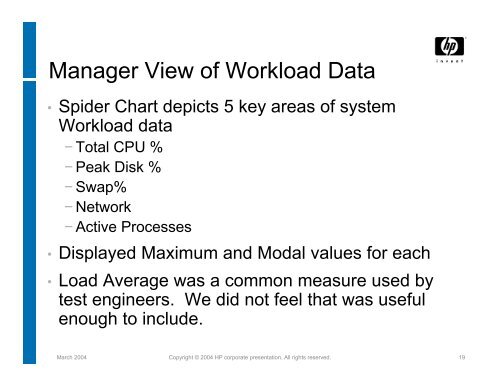
Manager View of Workload Data• Spider Chart depicts 5 key areas of systemWorkload data− Total CPU %− Peak Disk %− Swap%− Network− Active Processes• Displayed Maximum <strong>and</strong> Modal values for each• Load Average was a common measure used bytest engineers. We did not feel that was usefulenough to include.March 2004 Copyright © 2004 <strong>HP</strong> corporate presentation. All rights reserved. 19