HP-UX Stress Testing - The Workshop On Performance and Reliability
HP-UX Stress Testing - The Workshop On Performance and Reliability
HP-UX Stress Testing - The Workshop On Performance and Reliability

Create successful ePaper yourself
Turn your PDF publications into a flip-book with our unique Google optimized e-Paper software.
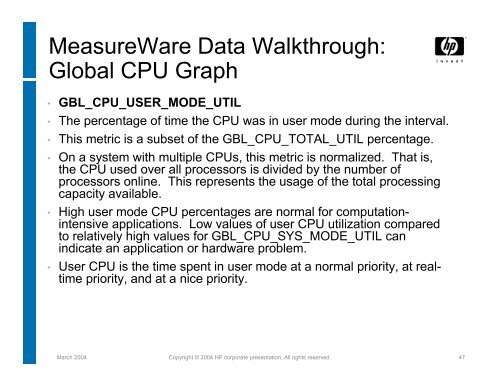
MeasureWare Data Walkthrough:Global CPU Graph• GBL_CPU_USER_MODE_UTIL• <strong>The</strong> percentage of time the CPU was in user mode during the interval.• This metric is a subset of the GBL_CPU_TOTAL_UTIL percentage.• <strong>On</strong> a system with multiple CPUs, this metric is normalized. That is,the CPU used over all processors is divided by the number ofprocessors online. This represents the usage of the total processingcapacity available.• High user mode CPU percentages are normal for computationintensiveapplications. Low values of user CPU utilization comparedto relatively high values for GBL_CPU_SYS_MODE_UTIL canindicate an application or hardware problem.• User CPU is the time spent in user mode at a normal priority, at realtimepriority, <strong>and</strong> at a nice priority.March 2004 Copyright © 2004 <strong>HP</strong> corporate presentation. All rights reserved. 47