Case StudyFigure 4. Plot of sedimentation rate (log) versus fluid retention depth(for rock column in km) for a set of shale mudrock, silty shales, andsiltstone (updated figure from <strong>Swarbrick</strong> et al., 2002).Figure 5. Schematic plot of a well in basin “X” in which the fluidretention depth method provides a good estimate of overpressure, wherea velocity-based approach underestimates overpressure on account ofchemical compaction at temperatures of about 140°C.effective stress and porosity. <strong>Swarbrick</strong> et al. (2002) demonstrateda broad relationship between the log of sedimentationrate and a “fluid retention depth” (FRD)—a depth below seafloor (when offshore) from which a lithostatic parallel “shalegradient” begins (Figure 3). The original sedimentation rate-FRD relationship from <strong>Swarbrick</strong> et al. (2002) has nowbeen updated with subsets of lithology added for shales, siltyshales, and siltstones from a larger global data set (Figure 4).None of the examples comes from an area in which there arelarge, known tectonic (horizontal compressive) stresses, butrather are known to be areas where rocks are currently consideredat their maximum depth of burial.Sedimentation rate can be derived from depth-convertedseismic data, (where seismic time lines can assigned ages), andcalibrated using age-depth data from associated wells. Theaverage sedimentation rate for the rocks in the top 3.0 km(10,000 feet) was used to determine the majority of valueson Figure 4. Note that the sedimentation rate values plottedon Figure 4 were estimated using current depths of burial(no uplift was evident in any of the examples used in thedata set) and without consideration of back-stripping whichwould estimate the compaction effects during burial. Hencethe same approach should be employed when using the plotfor prediction in new areas—i.e., predictions using these datashould also adopt a simple sedimentation rate calculation approximatingsedimentation rate from depth and age informationalone.As an example of how this prediction method may beshown to work is illustrated using data from a well in theNile Delta (Mann and Mackenzie, 1990) where an averagesedimentation rate is estimated at 810 m/Ma (Figure 3). Applyingthe sedimentation rate of 810 m/Ma and assumingaverage “silty shale” lithology in Figure 4 yields a FRD at adepth 0.8 km. Because RFT data are also reported by Mannand Mackenzie (1990) it is possible to verify this estimate.The RFT data in Figure 3 show a lithostatic-parallel gradientwhen drawing a line through the data over the interval fromapproximately 2.0 to 4.0 km. When this line is extrapolatedto the hydrostatic gradient the intercept occur at approximately0.8 to 0.9 km below mudline, confirming the suitabilityof the earlier prediction of FRD at approximately 0.8 km.Assuming only sedimentation rate is known, then the determinationof FRD provides information about the verticalstress at 0.8 km depth. Assuming the well is located at thecoast (zero water depth) and the FRD is 0.8 km:• The hydrostatic stress at 0.8 km is 8 MPa, assuming anhydrostatic gradient of 10.0 MPa/km.• The total vertical stress is 16.0 MPa, assuming a verticalstress gradient of 20.0 MPa/km as an average from surfaceto 0.8 km.• The vertical effective stress (VES) is therefore 16.0 − 8.0 =8.0 MPa.Because the assumption is for a lithostatic-parallel profileof pressure for the shales, VES remains constant at depth andrepresent the pore-pressure prediction for the shale mudrocks.Hence the pore-pressure prediction for undrained shale mudrocksat 4.0 km will be the vertical stress minus the verticaleffective stress, which is 86.0 − 8.0 = 78 MPa, where the lithostaticstress averages 21.5 MPa/km down to 4.0 km and thevertical effective stress remains at 8.0 MPa.The FRD method described above has now captured thevertical effective stress to define a vertical stress/lithostatic stressparallel shale pressure gradient. The method can be used todetermine the approximate pressure regime of shale mudrocksindependent of any rock property data. In low-temperatureregimes the method provides an independent method to comparewith porosity attribute driven pore-pressure estimates. Inhigh-temperature regimes, the method may be the only oneto offer a useful estimate of overpressures if the porosity-basedmethods are severely influenced by chemical compaction. Areduction in porosity (e.g., because of the load transfer orchemical compaction) leads to pressure predictions which areunderestimates. The shale-pressure-gradient method capturesthe contribution from burial and disequilibrium compaction1292 The Leading Edge <strong>Nov</strong>ember <strong>2012</strong>
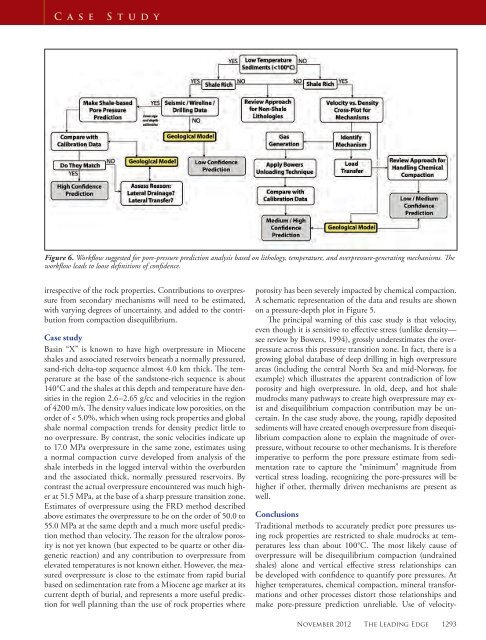
Case StudyFigure 6. Workflow suggested for pore-pressure prediction analysis based on lithology, temperature, and overpressure-generating mechanisms. Theworkflow leads to loose definitions of confidence.irrespective of the rock properties. Contributions to overpressurefrom secondary mechanisms will need to be estimated,with varying degrees of uncertainty, and added to the contributionfrom compaction disequilibrium.Case studyBasin “X” is known to have high overpressure in Mioceneshales and associated reservoirs beneath a normally pressured,sand-rich delta-top sequence almost 4.0 km thick. The temperatureat the base of the sandstone-rich sequence is about140°C and the shales at this depth and temperature have densitiesin the region 2.6–2.65 g/cc and velocities in the regionof 4200 m/s. The density values indicate low porosities, on theorder of < 5.0%, which when using rock properties and globalshale normal compaction trends for density predict little tono overpressure. By contrast, the sonic velocities indicate upto 17.0 MPa overpressure in the same zone, estimates usinga normal compaction curve developed from analysis of theshale interbeds in the logged interval within the overburdenand the associated thick, normally pressured reservoirs. Bycontrast the actual overpressure encountered was much higherat 51.5 MPa, at the base of a sharp pressure transition zone.Estimates of overpressure using the FRD method describedabove estimates the overpressure to be on the order of 50.0 to55.0 MPa at the same depth and a much more useful predictionmethod than velocity. The reason for the ultralow porosityis not yet known (but expected to be quartz or other diageneticreaction) and any contribution to overpressure fromelevated temperatures is not known either. However, the measuredoverpressure is close to the estimate from rapid burialbased on sedimentation rate from a Miocene age marker at itscurrent depth of burial, and represents a more useful predictionfor well planning than the use of rock properties whereporosity has been severely impacted by chemical compaction.A schematic representation of the data and results are shownon a pressure-depth plot in Figure 5.The principal warning of this case study is that velocity,even though it is sensitive to effective stress (unlike density—see review by Bowers, 1994), grossly underestimates the overpressureacross this pressure transition zone. In fact, there is agrowing global database of deep drilling in high overpressureareas (including the central North Sea and mid-Norway, forexample) which illustrates the apparent contradiction of lowporosity and high overpressure. In old, deep, and hot shalemudrocks many pathways to create high overpressure may existand disequilibrium compaction contribution may be uncertain.In the case study above, the young, rapidly depositedsediments will have created enough overpressure from disequilibriumcompaction alone to explain the magnitude of overpressure,without recourse to other mechanisms. It is thereforeimperative to perform the pore pressure estimate from sedimentationrate to capture the “minimum” magnitude fromvertical stress loading, recognizing the pore-pressures will behigher if other, thermally driven mechanisms are present aswell.ConclusionsTraditional methods to accurately predict pore pressures usingrock properties are restricted to shale mudrocks at temperaturesless than about 100°C. The most likely cause ofoverpressure will be disequilibrium compaction (undrainedshales) alone and vertical effective stress relationships canbe developed with confidence to quantify pore pressures. Athigher temperatures, chemical compaction, mineral transformationsand other processes distort those relationships andmake pore-pressure prediction unreliable. Use of velocity-<strong>Nov</strong>ember <strong>2012</strong> The Leading Edge 1293