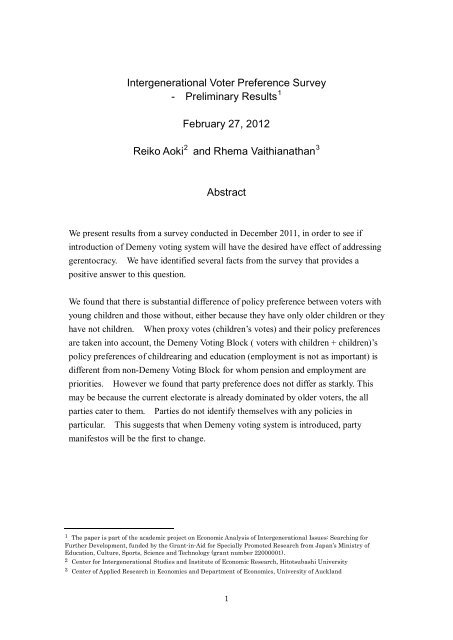
Intergenerational Voter Preference Survey - Preliminary Results ...
Intergenerational Voter Preference Survey - Preliminary Results ...
Intergenerational Voter Preference Survey - Preliminary Results ...

Create successful ePaper yourself
Turn your PDF publications into a flip-book with our unique Google optimized e-Paper software.
a further question regarding the age of their child. This yielded 3 groups ofrespondents:1. Have at least one child 19 years old or younger : 1027 respondents2. Have children all 20 years old or older 515 respondents3. No children 514 respondentsThe Questionnaire is in the Appendix.3. Descriptive statisticsThe age distribution of respondents is given in Table 1 and compared to the agedistribution of the 2011 estimation of the Japanese population (Ministry of InternalAffairs and Communications 2012),<strong>Survey</strong> dataPopulation Census(2011 estimates from JapanStats, over 20 year)Age Males Females Total Males Females Total20 – 24 2.49 3.75 3.11 6.4% 5.6% 6.0%25 – 29 4.21 5.52 4.86 7.2% 6.4% 6.8%30 – 34 8.62 10.06 9.33 8.1% 7.3% 7.7%35 – 39 16.67 18.05 17.35 9.8% 8.8% 9.2%40 - 44 14.94 19.43 17.15 9.2% 8.3% 8.7%45 - 49 13.79 15.19 14.48 7.9% 7.3% 7.6%50 - 54 11.4 9.76 10.59 7.6% 7.0% 7.3%55 - 59 11.02 6.8 8.94 8.3% 7.8% 8.0%60 - 64 9.87 6.31 8.11 10.4% 10.0% 10.2%65 - 69 3.45 3.45 3.45 7.5% 7.6% 7.5%70 - 74 2.2 1.08 1.65 6.6% 7.1% 6.9%75 - 79 1.15 0.2 0.68 5.3% 6.4% 5.9%80 - 84 0.19 0.39 0.29 3.5% 5.0% 4.3%85 + 0 0 0 2.3% 5.4% 3.9%Table 1: <strong>Survey</strong> age and sex distribution and official population estimatesAs one would expect with an internet based method, our survey under-representspeople aged over 60 and is therefore a considerably younger sample. One of the reasons3
is that we over-sampled from people with younger children and they tend to be younger.Table 2 gives age distribution of three groups of respondents. Parents of youngerchildren are themselves younger than parents of older children. Respondents withoutchildren are younger (average distribution) than those who have older children. Thissuggests the group includes those who intend to have children in the future. We usethe term “No minors” as those with no young children and those with only adultchildren (over 20 years of age).At least oneAll childrenNo minorschild underover 20 yearsNo children(over 20 +19 years oldoldNo children)20-29 43 0 121 12130-39 367 0 183 18340-49 480 29 142 17150-59 131 215 54 26960-69 5 219 14 23370-79 1 45 1 4680-89 0 6 0 6Over 90 0 0 0 0Average 41.8 59.9 37.7 48.9Table 2 :Age DistributionDemeny EligibilitySince the main purpose of this research is to understand how Demeny voting ifinstituted for the proportional representation (PR) vote would change preferences andbehavior, define “Demeny Eligible” as respondents who have at least one child under 19years of age (19 and under) and would therefore be eligible for an extra vote (for eachchild 19 and under). The group “No Minors” in Table 2 are those voters who at notDemeny Eligible.4
Figure 1: Proportion of Demeny Eligible <strong>Voter</strong>s in each Age GroupFigure 1 shows proportion of voters that are Demeny Eligible, i.e., has at least one childunder 19, in each age group. The distribution is almost symmetric around average age41. The average number of proxy votes, one for each child under 19, Demeny Eligiblevoters have is shown in Figure 2. It is equivalent to the average number of childrenunder 19 among Demeny Eligible voters.Figure 2: Mean proxy votes by Age Group (for those who are Demeny Eligible)5
From numbers represented in Figures 1 and 2, we have weights to find number of votescast by each age group under Demeny voting. This is shown in Figure 3. We see thatage group 35 to 49, the work force population and generation with children, controlmore votes, as intended.Figure 3: Weighted and Unweighted Votes by Age GroupDemeny Voting BlockUnder Demeny Voting rule, parents will cast the proxy votes of their children. We willrefer to the sum of Demeny Eligible voters and their proxy votes as Demeny VotingBlock. Figure 3 shows how the Demeny Voting Block among the survey respondentsare distributed by age groups.We can also get an approximation of how the Demeny Voting Block in the generalelectorate from the 2010 Population Census. (Figure 4). This is an estimation becausethis is based on people who live with children 18 and under, the only publishedinformation that contains relevant information (Aoki and Vaithianathan 2010). Theactual Demeny Eligible and Demeny Voting Block will be larger.6
Figure 4: Estimate Demeny Eligible and Demeny Voting Block of Actual Population4. <strong>Voter</strong> <strong>Preference</strong> over PolicyWe asked respondents to choose what is the most important and second most importantfrom a list of 11 policies.The specific policy questions that we asked were:1. POL1 : what is the most important policy?2. POL2: what is the second most important policy?3. POL1_CHILD 4 : what is the most important policy for your child?4. POL2_CHILD 5 : what is the second most important policy for your child?Tables 3 summarizes responses by have at least one child under 19, have children allover 20, and no children. The largest proportion in all three groups think Employmentis most important. One can interpret this to mean many people think economic policyis very important. Those with young children think Childrearing Support is veryimportant, while other two groups think Pension is very important. Pension can beimportant because your are old and close to getting a pension but also because you haveno children and cannot expect family support in old age. We will return to the effectof having children and age later in Section 7. Instead, we will focus here on DemenyEligibility (Table 4).4 Only asked from respondents with children.5 Only asked from respondents with children.7
Most Important (POL1) Second Most Important (POL2) (POL1 + POL2)/ 2Under 19 Over 20 None Under 19 Over 20 None Under 19 Over 20 NonePension 年 金 15.1 25.9 21.2 17.1 20.8 21.2 16.1 23.3 21.2Healthcare 医 療 4.4 4.7 7.2 12.3 10.9 14.2 8.3 7.8 10.7Longterm care 介 護 1.6 2.3 3.3 3.9 8.0 6.0 2.7 5.2 4.7Education 教 育 8.4 3.1 4.5 8.5 5.8 3.7 8.4 4.5 4.1Science & technology 科 学 技 術 0.3 1.2 1.2 1.1 1.9 2.5 0.7 1.6 1.8Child rearing support 子 育 て 支 援 16.3 1.6 3.1 15.7 1.9 3.9 16.0 1.8 3.5Environment 環 境 5.2 5.3 5.0 7.6 6.8 6.2 6.4 6.0 5.6Energy エネルギー 5.5 6.6 4.5 5.6 9.1 9.1 5.5 7.9 6.8Foreign affairs 外 交 4.8 7.4 7.0 5.5 8.6 10.5 5.1 8.0 8.7Employment 雇 用 25.7 30.4 30.7 16.8 18.7 17.9 21.3 24.5 24.3Security (safety) 安 全 13.0 11.7 12.4 6.0 7.4 4.9 9.5 9.5 8.6Total 100.0 100.0 100.0 100.0 100.0 100.0 100.0 100.0 100.0Under 19 = Have at least one child under 19Over 20 = All children are over 20None = Have no childrenTable 3: Policy <strong>Preference</strong> by Groups8
Non- Eligible(no minors)Demeny Eligible(have minors)TotalPension 23.55 15.08 19.32Healthcare 5.91 4.38 5.15Longterm care 2.81 1.56 2.18Education 3.88 8.37 6.12Science & technology 1.16 0.29 0.73Childrearing support 2.33 16.25 9.27Environment 5.14 5.16 5.15Energy 5.52 5.45 5.49Foreign affairs 7.27 4.67 5.97Employment 30.33 25.88 28.11Security 12.11 12.94 12.52Table 4: Policy <strong>Preference</strong> (POL1+POL2) by Demeny EligibilityWe asked the Demeny Eligible voter, i.e., parents of young children, what they thoughtwere policies that matters for their child (POL1_Child, POL2_Child in Table 5).There is greatest interest in Education and Childrearing Support. 24.4% of parentsthink most important policy for child is Education. 20% think Education is secondmost important. Employment is also most important for many. As for the parents,25.7% thought Employment is the most important, and second most important wasaround 15% of total for Pension, Childrearing and Employment (Table 6). Security wasmost important for similar proportion of parents (13%) and child (14.9%). Security issecond most important for similar proportion of children (13/1%) while it was only 6%of parents. Environment is second most important for 13.3 % of children but only7.6 % of parents. In short, parents think children’s priority is more long term policies,Education, Security and Environment. For parents, Employment is overwhelminglyimportant with Pension and Childrearing Support the next most important.Relationship between parent and child policy preference is summarized in Table ParentMost /child and Parent Second/child in the Appendix.9
POL1_Child POL2_Child (POL1_Child+POL2_Child)//2Pension 41 4.0 88 8.6 64.5 6.3Healthcare 36 3.5 120 11.7 78 7.6Longterm care 3 0.3 8 0.8 5.5 0.5Education 303 29.5 206 20.1 254.5 24.8Science & technology 3 0.3 11 1.1 7 0.7Child rearing support 251 24.4 137 13.3 194 18.9Environment 55 5.4 137 13.3 96 9.3Energy 25 2.4 41 4.0 33 3.2Foreign affairs 1 0.1 25 2.4 13 1.3Employment 157 15.3 119 11.6 138 13.4Security (safety) 152 14.8 135 13.1 143.5 14.0Total 1027 100.0 1027 100.0 1027 100.0Table 5: Important Policy for ChildFrom the policy preference of Demeny Eligible and Not Eligible (Table 4),preference of children (Table 5), and proxy weights (Figure 3), we can calculate thepolicy preference of Demeny and Non-Demeny Voting Blocks (Figure 5).Figure 5: Policy <strong>Preference</strong>s by Demeny and Non-Demeny Voting Blocks10
5. <strong>Voter</strong> preference over PartyWe asked a range of questions regarding respondents’ attitudes to political parties.The PARTINT relates to questions of current (or intentional voting) while thePARTLAST relates to questions that ask the respondent to consider their vote in the lastgeneral election held on the 30 th of August, 2009:1. PARTINT (Q2): Which party do you currently support (which would you votefor under the PR system).2. PARTINT_C (Q6): Which party would you vote for on behalf of your childunder a Demeny system (only asked Demeny Eligible)3. PARTINT_O (Q7): Which party would you vote for on your own behalf under aDemeny system (only asked Demeny Eligible)4. PARTLAST (Q9): Which party did you vote for in the last general election?5. PARTLAST_C(Q10): Which party would you have voted for in the last electionon behalf of your child? (only asked Demeny Eligible)The PARTINT(Q2) is summarized in Figure 4. More than half the respondents did notsupport any party at the time of the survye (59%).11
Figure 6: Party currently supported (PARTINT(Q2))PARTINT(Q2) by Demeny Eligibility is summarized in Table 3 and Figure 6.Min-nano Toh is the party with third largest support for both Demeny Eligible and not.Among Non-Demeny Eligible voters, support for Min-nano Toh is close to that of JDP.Figure 6: Party <strong>Preference</strong> by Demeny Eligibility12
PARTINT(Q2)NotEligibleDemenyEligibleTotalJapan Democratic Party 10.95 12.65 11.80Liberal Democratic Party 14.83 12.45 13.64Komei Toh 2.03 2.63 2.33Japan Communist Party 1.74 2.92 2.33Social Democratic Party 1.07 0.29 0.68Min-nanto Toh 10.17 7.39 8.79Kokumin Shin Toh 0.39 0.39 0.39Shin Toh Nippon 0.10 0.00 0.05Sin Toh Daichi 0.10 0.00 0.05Other 0.39 0.68 0.53None (does not suppor any party) 58.24 60.60 59.42Total 100.00 100.00 100.00Table 7: Party Supported (PARTINT(Q2) at Time of <strong>Survey</strong>, by Demeny EligibilityWe now turn to responses when we asked the group who are Demeny Eligible (i.e.have minors) who would actually be casting votes (proxy votes) on behalf of theirchildren, how they would vote on behalf of children (PARTINT_C (Q6)) and then howthey would vote themselves (PARTINT_O (Q7)). Reponses are summarized in Table 8and Figure 7.There are two things to be noted in Table 8. First, some parents cast their children’svote differently from their own (columns Child and Own). In addition, some parentschange their own choice once they are able to cast a vote for their child (column fromTable 7 and Own). This results in reduction of proportion of those supporting no party(None) declines from 60.7 % to 40.1%. Proportion of “None” for Child is even lower at38.9%. (Compare Figures 6 and 7). This suggests that the original lack of support for aparticular single party is due to lack of a “best fit” party, i.e. one that is sufficiently closeto the voter’s preference. However, with two votes, it becomes possible to combinetwo parties, in order to find a better fit.Due to reduction of None voters, share of all parties increase with Demeny voting. Thetwo major parties and Min-nano Toh have significantly larger shares with Demenyvoting. In particular Min-nano Toh’s Child vote share is larger than that of JapanDemocratic Party. Relationship between own and child vote is summarized in theAppendix and regressional analysis is in Section 7..13
Table 7, DemenyEligibleChild VotePARTINT_C(Q6)Own VotePARTINT_O(Q7)Japan Democratic Party 130 12.7 149 14.5 156 15.2Liberal Democratic Party 127 12.4 167 16.3 199 19.4Komei Toh 27 2.6 36 3.5 34 3.3Japan Communist 30 2.9 34 3.3 43 4.2Social Democratic 3 0.3 8 0.8 9 0.9Min-nanto Toh 76 7.4 155 15.1 124 12.1Kokumin Shin Toh 4 0.4 4 0.4 8 0.8Shin Toh Nippon 0 0.0 4 0.4 4 0.4Sin Toh Daichi 0 0.0 3 0.3 1 0.1Other 7 0.7 68 6.6 37 3.6None 623 60.7 399 38.9 412 40.1Total 1027 100.0 1027 100.0 1027 100.0Table 8: Party <strong>Preference</strong> of Child vote (PARTINT_C) and Own vote (PARTINT_O) withDemeny voting.. Figure 7: Party Vote for Own and Child (proxy)14
Relationship between own vote and child vote is tabulated in Table 6. One quarter ofthose that vote for JDP will cast the child’s vote for some other party. We will resort tologit regression to explain who reason for the switch in Section 7.Effect of Demeny VotingUsing the weights in Figure 3 and Table 8 we can compare party preference of Demenyand Non-Demeny Voting Blocks (Figure 9).Figure 9: Current Party <strong>Preference</strong> (PARTINT), Demeny and Non-Demeny Voting Blocks.Recall the stark difference in policy priorities between Demeny Eligible andNon-Eligible (Figure 5), as well as separation of child and own policy priorities of theDemeny Eligible voters (Tables 4 and 5). However, those differences do not seem to bereflected in the party votes. This is probably because all parties currently cater to theelectorate dominated by Demeny Non-Eligible voters. There is no emphasis on policiesthat matte to Demeny Eligible voter. In Figure 9, the only notable difference in larger15
proportion of “Other” votes in Demeny Voting Block. We asked the respondents towrite what “Other” and they mostly wrote “Osaka Ishin no Toh”.The survey took placein December, after that Osaka double election.Last General ElectionNow we turn to PARTLAST(Q9), how the survey respondents had voted in the lastgeneral election. This is summarized in Figure 10. In Table 9, we also present the actualbreakdown of party votes in the last election. This suggests that the respondents arenot representative in terms of party preference. Most notably, interpreting only thosethat chose a party went to vote and those that answered None did no, The actual resultsof Proportional Representation in the last general election were JDP 42.41% and LDP26.73%. The survey respondents voted more pro-JDP than the general voterpopulation. Min-nano Toh which had the third largest number of votes among surveyrespondents only had 4.27% among all the voters in the election. This was only the 6 thlargest share. Komei Toh had the third largest share in the general election had thethird largest share in the last election.Figure 10: Vote in last general election (PARTLAST (Q9))16
Party Supported in LastElection<strong>Survey</strong>PARTLAST (Q9):PARTLAST (Q9)without NoneActual ElectorateJapan Democratic Party 45.73 60.11 42.41Liberal Democratic Party 17.14 22.53 26.73Komei Toh 2.62 3.44 11.45Japan Communist Party 3.3 4.34 7.03Social Democratic Party 1.07 1.41 4.27Min-nano Toh 5.49 7.22 4.27Kokumin Shin Toh 0.15 0.2 1.73Shin Toh Nippon 0.19 0.25 0.75Sin Toh Daichi 0.05 0.07 0.62Other 0.34 0.45 0.74None (does not support anyparty)23.92 0 0Table 9: <strong>Survey</strong> Respondents Votes and Actual Electoral Outcome in Last GeneralElectionTable 10 shows difference in party support according to three groups, at least one childunder 19, only children over 20, and no children. The last two groups are aggregatedinto non Demeny Eligible voters in Table 11.Under 19 Over 20 NoneJapan Democratic Party 499 48.6 274 53.3 168 32.6Liberal Democratic Party 171 16.7 87 16.9 95 18.4Komei Toh 32 3.1 12 2.3 10 1.9Japan Communist 34 3.3 14 2.7 20 3.9Social Democratic 5 0.5 10 1.9 7 1.4Min-nano Toh 48 4.7 29 5.6 35 6.8Kokumin Shin Toh 0 0.0 1 0.2 2 0.4Shin Toh Nippon 2 0.2 1 0.2 1 0.2Sin Toh Daichi 0 0.0 0 0.0 1 0.2Other 3 0.3 1 0.2 2 0.4None 233 22.7 85 16.5 174 33.8Total 1027 100.0 514 100.0 515 100.0Table 10: Vote in Last General Election (PARTLAST (Q9)) by GroupsThere is significant difference between Table 6 and Table 9. Table 6 is current17
preference (PARTINT(Q2) which reflects voter’s assessment of the parties since theelection. We will turn to regression analysis to explain the change in the Section 7.Party Supported in Last ElectionNonEligibleDemenyEligibleTotalJapan Democratic Party 42.93 48.54 45.73Liberal Democratic Party 17.54 16.73 17.14Komei Toh 2.13 3.11 2.62Japan Communist Party 3.29 3.31 3.30Social Democratic Party 1.65 0.49 1.07Min-nanto Toh 6.30 4.67 5.49Kokumin Shin Toh 0.29 0.00 0.15Shin Toh Nippon 0.19 0.19 0.19Sin Toh Daichi 0.10 0.00 0.05Other 0.29 0.39 0.34None (does not suppor any party) 25.29 22.57 23.92Total 100.00 100.00 100.00Table 11:Vote in Last General Election (PARTLAST (Q9)) by Demeny EligibilityFurthermore, we asked a retrospective (and hypothetical question) about how parentswould have voted on their children’s behalf (proxy vote) in the last general election(Table 12). Again, we observe child vote being cast for Min-nano Toh. As we will see inthe next section, parents think the most important policy for children is education.Child votePARTLAST_C(Q10):Own votePARTLAST_O(Q9):Japan Democratic Party 389 37.9 499 48.6Liberal Democratic Party 155 15.1 171 16.7Komei Toh 34 3.3 32 3.1Japan Communist 32 3.1 34 3.3Social Democratic 7 0.7 5 0.5Min-nanto Toh 79 7.7 48 4.7Kokumin Shin Toh 0 0.0 0 0.0Shin Toh Nippon 3 0.3 2 0.2Sin Toh Daichi 0 0.0 0 0.018
Other 15 1.5 3 0.3None 313 30.5 233 22.7Total 1027 100.0 1027 100.0Table 12: Child’s Vote in Last Election (PARTLAST_C(Q10))Clearly Demeny Eligible voters are aware different things matter to self and child.However, since Min-nano Toh is not associated with education, this leads us the believeparents may be using the proxy vote to satisfy their party preferences. This is consistentwith vote splitting involving many parties (Tables 8,12).6. Voting SystemsWe asked how a child’s vote should be allocated to parent or parents. Surprisingly,more people believe that father should vote on behalf of a child than mother. However,even more people think the allocation should be decided by the parents themselves.Those that have no children have smaller proportion that think parents should decide butthey have the largest proportion that think that a child’s vote should be shared equallyamong the two parents. 68% oppose Demeny Voting among those with older children.Recall that this group had the highest average age and those young children the lowest(Table 1). The preference of those with no children, i.e., medium average age, fallsbetween the other two groups.Under 19 Over 20 NoneFather 118 11.5 22 4.3 14 2.7Mother 31 3.0 3 0.6 3 0.6Parents decide 445 43.3 89 17.3 138 26.8Each parent 1/2 vote 89 8.7 34 6.6 56 10.9Other 17 1.7 14 2.7 18 3.5Against voting system 327 31.8 352 68.5 286 55.5Total 1027 100 514 100 515 100Table 13: How to Allocate Child’s VoteAmong those that oppose Demeny Voting system, we asked why and the response issummarized in Table 14.19
Under 19 Ove 20 NoneNot fair to people without children 33 10.1 24 6.8 30 10.5Not possible to have voting by proxy 184 56.3 250 71.0 157 54.9No guarantee parent votes on behalf ofchild93 28.4 64 18.2 78 27.3Have more children for more votes 1 0.3 2 0.6 3 1.0Other 16 4.9 12 3.4 18 6.3Total 327 100.0 352 100.0 286 100.0Table 14: Reason for Opposing Demeny VotingAll groups have the largest proportion opposing because parents should not be votingon behalf of their children. The second most common reason is that parent may notalways have the child’s interest at heart. The two top reasons are probably based onsimilar sentiment. What we have seen in the previous sections partly support this view.Although parents are aware that policy that matters to the child is different from what isimportant for themselves (Table 8,10), vote splitting is not necessarily consistent withthis consideration. Reasons for opposing are independent of having children or notDemeny Voting System is not the only alternative electoral system that have beensuggested. Japan has one of the highest minimum voting age which is twenty. Theminimum age for voting on national referendum has already been lowered to 18.<strong>Results</strong> of Table 15 suggest the lower age limit is opposed by very few people..Under 19 Over 20 NoneSupport 436 42.5 209 40.7 206 40.0Don’t know 391 38.1 184 35.8 203 39.4Oppose200 19.5 121 23.5 106 20.61027 100.0 514 100.0 515 100.0Table 15: Lower Voting Age to 18Several people have suggested defining districts not according to geographic proximitybut by age. For instance, voters aged 20 to 29 could all be in one district, votes aged30 to 39 constitute one district, voters aged 40 to 49 constitute one district, and so on(Table 16). The age districts have been proposed to correct for differences in the turn20
out rate among age groups. 6 However, if number of representatives from each districtis proportional to its size, i.e., number of voters, the Preston effect will not be addressed.Lack of political voice of younger people can be corrected if number of representativeswere inversely related to size of the district. This way, younger voters’ votes areweighted more heavily.Under 19 Over 20 NoneSupport 160 15.6 38 7.4 81 15.7Don’t know 560 54.5 241 46.9 268 52.0Oppose 307 29.9 235 45.7 166 32.21027 100.0 514 100.0 515 100.0Table 16: Age Districts7. Regression AnalysisWe first try to examine policy choice. For most policies, age is the only significantvariable, if anything is significant at all, with exception of three policies, Pernsion,Childrearing Support and Education (Table 16). Significant variables are Age, Numberof Children and the constant term when both Pension and Childrearing Support areregressed, but the signs are opposite. Being older and less number of childrenincreases likelihood of choosing Pension. Being younger and more number of childrenincreases likelihood of choosing Childrearing Support. Education regression showsbegin a firm employee, other than clerk or engineer, is significant. Younger voters aremore likely to choose education, but unlike Childrearing Support, number of childrendoes not matter. This could be because it is the young who do not have children thatmatter.Pension Childrearing Support EducationVariable Coefficient t-value Coefficient t-value Coefficient t-valueCivil servant6 For instance, in the last general election (2009), the lowest turn out was voters 20-24 years oldwith rate 46.66%. Turn out rate increase with age until it peaks at 65-69 year old voters with85.04 %. Groups covering 60-74 years of age all have turn our rate about 80%. 大 45 回 総 選 挙における 年 齢 別 投 票 率 財 団 法 人 明 るい 選 挙 推 進 協 会http://www.akaruisenkyo.or.jp/070various/071various/37921
Manager, COE -0.231 -0.53 0.0833 0.11 -0.282 -0.48Firm (clercial) -0.412 -1.17 0.708 1.5 -0.692 -1.54Firm (engieering) -0.317 -0.92 0.338 0.71 -0.872 -1.92Firm(other_) -0.318 -0.87 0.435 0.86 -1.592** -2.6Self employed -0.713 -1.81 0.46 0.82 -0.449 -0.91Independent professional -0.923 -1.32 0.906 0.99 -0.187 -0.23Full time housewife -0.164 -0.53 0.315 0.71 -0.830* -2.11Part time employment -0.626 -1.7 0.199 0.4 -0.514 -1.16StudentOther -0.413 -1.03 -0.217 -0.29 -1.208 -1.75Unemployed 0.222 0.57 0.455 0.51 -1.355 -1.66Sex -0.124 -0.91 -0.113 -0.66 -0.293 -1.4Age .0368*** 5.4 -0.123*** -10.46 -0.0247* -2.26Number of children -0.288** -3.07 0.286** 2.63 0.00902 0.07Constant -2.367*** -5.23 2.411*** 3.84 -0.632 -1.00Table 17: Policy Choice Regression * 95%, ** 99%, ***99.99%We now turn to determination of party support. It turns out that factors thatdetermine party support differs by party. There is only variable that is significant forchoosing of JDP is Age (Table 18). Older the voter, the more likely he or she is tochoose JDP. Age is significant at 99% but constant if significant at 99.99%. LDP isless likely to be chosen by Full-time housewife and those employed part-time. Only theconstant term is significant when the same variables are regressed on Communist Party,Komei-Toh and Social Democratic Party. Min-nano Toh regression shows Age is 0.0205and significant at 95%.JDPLDPVariabale Coefficient t-value Coefficient t-valueCivil servantManager, COE -0.0696 -0.13 0.176 0.41Firm (clercial) 0.195 0.49 -0.171 -0.5Firm (engieering) 0.259 0.6 -0.699 -1.94Firm(other_) 0.00348 0.01 -0.671 -1.74Self employed -0.757 -1.55 -0.672 -1.68Independent professional 0.513 0.82 -0.192 -0.3122
Full time housewife -0.339 -0.9 -0.887** -2.72Part time employment 0.174 0.43 -1.454*** -3.36StudentOther -0.246 -0.52 -0.163 -0.41Unemployed -0.184 -0.38 -0.732 -1.59Sex 0.276 1.8 0.172 1.12Age 0.0209** 2.68 0.00658 0.85Number of children 0.0761 0.77 0.152 1.57Constant 3.121*** -5.86 1.988*** -4.08Table18: Choice of Party Regression * 95%, ** 99%, ***99.99%We also thought to understand if and how policy preference determines party choice.<strong>Results</strong> of logit regression for JDP, LDP, Communist Party and Min-nano Toh are inTables 19 to 22.Japan Democratic PartyLiberal Democratic PartyCoefficient t-value Coefficient t-valuecivil service 0.132 0.27 civil service 0.761 1.61business owner 0.0541 0.11 business owner 0.868 1.83employee(clerk) 0.295 0.73 employee(clerk) 0.629 1.49employee(engineer) 0.337 0.84 employee(engineer) 0.145 0.33employee (other) 0.126 0.30 employee (other) 0.143 0.31self employed -0.662 1.38 self employed 0.0887 0.19Independent 0.694 1.12 independent 0.628 0.94house wife (husband) -0.217 0.56 house wife (husband) -0.0769 -0.19part time 0.294 0.72 part time -0.665 -1.33Student . . Student . .Other -0.133 0.30 Other 0.594 1.34Unemployed . . Unemployed . .Sex 0.253 1.64 Sex 0.181 1.16AGE 0.0228** 2.76 AGE 0.00551 0.68Number of Children 0.0658 0.66 Number of Children 0.177 1.78Pension 0.307 0.97 Pension -0.323 -1.13Healthcare 0.329 0.72 Healthcare 0.419 1.11Longterm care 1.028 1.93 Longterm care -0.092 -0.1623
Education 0.63 1.65 Education 0.241 0.71Science & technology . . Science & technology -0.498 -0.45Child support 0.545 1.54 Child support -0.505 -1.44Environment 0.639 1.60 Environment -0.965 -1.88Energy 0.524 1.32 Energy -0.506 -1.18Foreign affairs 0.146 0.33 Foreign affairs 0.847** 2.62Employment 0.652* 2.25 Employment -0.135 -0.53Security . . Security . .Constant -3.758*** -5.56 Constant -2.680*** -4.01Table 19: Choice of JDP and Public PolicyTable 20: Choice of LDP and Public PolicyMin-nano TohJapan Communist PartyCoefficient t-valueCoefficient t-valuecivil service -1.122 -1.83 civil service 1.618 1.39business owner -0.0985 -0.21 business owner 0.336 0.23employee(clerk) -0.109 -0.28 employee(clerk) 0.663 0.57employee(engineer) -0.647 -1.53 employee(engineer) 1.318 1.18employee (other) -0.576 -1.31 employee (other) 0.629 0.53self employed -0.506 -1.17 self employed 0.778 0.66Independent -0.283 -0.40 Independent 1.564 1.07house wife (husband) -0.857* -2.24 house wife (husband) 0.665 0.6part time -1.701** -3.02 part time 0.018 0.01Student . . Student . .Other -0.565 -1.26 Other 0.534 0.43Unemployed . . unemployed . .Sex 0.0831 0.45 Sex -0.0895 -0.27AGE 0.0193* 2.01 AGE -0.00252 -0.14Number of Children -0.169 -1.36 Number of Children 0.251 1.26Pension 0.513 1.38 Pension 1.147 1.44Healthcare 0.785 1.58 Healthcare 1.933* 2.19Longterm care -0.549 -0.51 Longterm care 1.338 1.07Education 0.386 0.79 Education -0.143 -0.12Science & technology 1.238 1.4 Science & technology . .Child support 0.459 1.05 Child support 0.982 1.15Environment 0.474 0.93 Environment 0.88 0.8724
Energy 0.444 0.9 Energy 0.766 0.76Foreign affairs 1.177** 2.8 Foreign affairs 1.269 1.36Employment 0.35 0.97 Employment 0.798 1.02Security . . Security . .Constant -2.806 -3.69 Constant -5.675*** -3.43Table 21:Choice of Min-nano Toh Public Policy Table 22: Choice of JCP and Public PolicyIn order to understand how parents decide how to vote for self and children underDemeny voting, we used logit regression to predict probability of splitting votes, i.e.,casting different votes for self and child (Table 22). Age variable is 1 =12 and under, 2=12 to19, 3 = 20 to24, 4=25 to29, … 10=55 to 59, 11=60 and over. A parent thatthinks education is an important issue is more likely to split the vote,.25
(1)Party_splitParty_splitjob==2 -0.225 (-0.49)job==3 -0.0781 (-0.22)job==4 0.128 (0.37)job==5 0.458 (1.25)job==6 0.28 5 (0.76)job==7 0.0940 (0.15)job==8 0.851** (2.63)job==9 0.742* (2.10)o.job==10 . .job==11 0.996* (2.25)job==12 0.974 (1.81)sex==2 -0.334* (-2.52)AGE 0.158*** (17.17)Number of Childre~3) -0.0686 (-0.79)Pol1==Pension 0.238 (0.98)Pol1==Healthcare 0.515 (1.38)Pol1==Longterm care 0.455 (0.86)Pol1==Education -0.186 (-0.58)Pol1==Science & te~y -0.0587 (-0.07)Pol1==Child support 0.325 (1.14)Pol1==Environmen t 0.224 (0.67)Pol1==Energy 0.660* (1.97)Pol1==Foreign affa~s 0.599 (1.74)Pol1==Employment 0.428 (1.94)o.Pol1==Security . .Party==Japan Democ~y -0.353 (-1.74)Party==Liberal Dem~y -0.396 (-1.84)Party==Komei Toh -0.933* (-2.06)Party==J apan Commu~t -1.550*** (-3.32)Party==Social Demo~c -1.642 (-1.58)Party==Min-nanto Toh -0.176 (-0.71)Party==Kokumin Shi~h 1.077 (1.03)o.Party==Shin Toh ~n . .o.Party==Sin Toh D~i . .Party==Other -0.817 (-0.88)o.Party==None (doe~n . .Constant -7.996*** (-13.71)Observations 1544t statistics in parentheses* p
and childrearing support second most important policies implies greater probability ofhaving changed party support. One of the major change of policy by JDP after theelection was child support payment, not healthcare. Female and age has negativeeffect.Switched Party since Last ElectionVariableCoefficient t-valueCivil servantManager, COE 0.467 1.27Firm (clercial) 0.295 1.04Firm (engineering) 0.425 1.52Firm(other_) 0.308 1.04Self employed 0.888** 2.86Independent professional -0.0658 -0.13Full time housewife 0.391 1.51Part time employment 0.232 0.81StudentOther 0.369 1.12Unemployed 0.843* 2.41Sex -0.224* -2.13Age -0.0115* -1.97Number of children 0.00355 0.05POL1=Healthcare -0.748** -2.58Longterm care 0.212 -0.52Education -0.0207 -0.09Science & technology -0.312 -0.44Child rearing support -0.209 -0.98Environment -0.0476 -0.18Energy 0.026 0.1Foreign affairs -0.331 -1.29Employment -0.044 -0.26Security (safety) -0.0445 -0.23POL2=Healthcare -0.358 -1.7827
Longterm care -0.333 -1.25Education -0.229 -1.01Science & technology -0.62 -1.33Childrearing support 0.632** -3.02Environment -0.470* -2.03Eenergy -0.0872 -0.37Foreign affairs -0.218 -0.89Employment -0.119 -0.54Security (safety) -0.314 -1.3Constant 0.619 1.44Table 24: Party change since last general electionA voter is more likely to have switched party since the last election if he or she thinkschildrearing is important. This is more likely for younger females. One the mostprominent changes in policy after the general election was cash payment for familieswith young children. Regression suggests this effected young women, who could bemothers or could be mother in the future, that cared about childrearing support.8. ConclusionIn this paper we have presented results of a survey conduction in December 2011, inorder to see if introduction of Demeny voting system will have the desired have effectof addressing gerentocracy. We have identified several facts from the survey thatprovides a positive answer to this question.We found that there is substantial difference of policy preference between voters withyoung children and those without, either because they have only older children or theyhave not children. Among voters with young children, childrearing is very importantwhile pension is important among other voters. (The largest proportion in bothgroups think employment is the most important.). Furthermore, voters with youngchildren thought education was is most important for their children. This suggests,parents in deed are aware that their children’s needs are different form their own.When proxy votes (children’s votes) and their policy preferences are taken intoacocount, the Demeny Voting Block ( voters with children + children)’s policypreferences of childrearing and education (employment is not as important) is differentfrom non-Demeny Voting Block for whom pension and employment are priorities,28
The survey also asked their party preferences. This does not differ between groups.More significant find was that when parents are asked how they would cast own andchild votes under Demeny voting system, 1) proportion of “does not support any party”was reduced from 60% when they only voted for themselves to 40.1% when they havetwo votes , and 2) many voted differently for own and child votes. Fact 2 suggestsparents do in fact vote differently for children. However they do not vote necessarilyvote for parties associated with education. Together with Fact 1, parents may beusing the two votes to vote in a way that is closer to what they think is the ideal policycombination. This suggests introduction of preferential voting may improve voterinterest.The difference in party preference between Demeny and Non-Demeny Voting Blocksare very small compared to the large differences in policy preferences. One reasoncould be that because the current electorate is already dominated by older voters, theall parties cater to them. Parties do not identify themselves with any policies inparticular. This suggests that when Demeny voting system is introduced, partymanifestos will be the first to change.The results of this survey should be interpreted with the knowledge that the surveyrespondents are not representative of the general electorate. We asked for what howthe respondents had voted in the last general election in 2009. Compared to the actualoutcome, the survey respondents are more pro-Japan Democratic Party and Min-nanoToh. 60% of the respondents who voted, voted for Japan Democratic Party. Amongthe respondents, Min-nano Toh had the third largest votes although in the generalelectorate, the party was sixth (Table 9). Respondents are also younger than the generalpopulation, because it was an internet survey and we over sampled from parents ofyounger children.29
ReferencesAoki, Reiko and Rhema Vaithiamathan (2010) “Political Economy of Low Fertility andChanging Population Age Structure - Case of Japan” mimeo.Demeny, Paul (1986) “Pronatalist Policies in Low-Fertility Countries: Patterns,Performance and Prospects” Population and Development Review 12(Supplement) :335-358Ministry of Internal Affairs and Communications Statistics Bureau, Director-General forPolicy Planning (Statistical Standards) (2012) “ August 1, 2011 (Final Estimates),January 1 2012 (Provisional Estimates) Population Estimates by Age (%-Year AgeGroup) and Sex” http://www.stat.go.jp/english/data/jinsui/tsuki/index.htm30
AppendixQuestionnaireAdministered December 27-28, 2011PreambleThis survey contains questions regarding delicate ( political content ) matters. If youagree with the survey, please respond. If you decide not to respond, please discontinueeither by clicking on “stop responding” button or closing the browser. Responses of thissurvey will be processed statistically in a way that it will not be possible to identifyindividuals. We appreciate your cooperation in the survey.Screening question1. Do you have at least one child 19 years old or younger Yes No2. If No, do you have children ? Yes No[Under 19] Yes = 1000[Over 20] No, Yes = 500[None] No, No = 500Main <strong>Survey</strong>Q1. Please choose what you think is the Most Important, and the Second MostImportant policy from the list below.1 Pension2 Healthcare3 Longterm care4 Education5 Science & technology6 Child rearing support7 Environment8 Energy9 Foreign affairs10 Employment11 Security (safety)Q2. Which party do you currently support ? (Which party you would vote for underProportional Representation?)31
1 Japan Democratic Party2 Liberal Democratic Party3 Komei Toh4 Japan Communist5 Social Democratic6 Min-nanto Toh7 Kokumin Shin Toh8 Shin Toh Nippon9 Sin Toh Daichi10 Other11 None (does not support any party)Q3. How many children do you have ?Q4. What is the gender of your children ?First childSecond child…Q5. What is the age of your children ?First childSecond child…< It is possible to give each child a vote and have parents (parent) vote on his/her behalf.This is called Demeny Voting System.>Q6. < Ask only [Under 19]> Which party would you vote on behalf of your child underthe Demeny Voting System ? If you have more than one child 19 or younger, pleaseanswer on behalf of your youngest child.1 Japan Democratic Party2 Liberal Democratic Party3 Komei Toh4 Japan Communist32
5 Social Democratic6 Min-nanto Toh7 Kokumin Shin Toh8 Shin Toh Nippon9 Sin Toh Daichi10 Other11 None (does not support any party)Q7. < Ask only [Under 19]> Which party would you vote for under Demeny VotingSystem ?.1 Japan Democratic Party2 Liberal Democratic Party3 Komei Toh4 Japan Communist5 Social Democratic6 Min-nanto Toh7 Kokumin Shin Toh8 Shin Toh Nippon9 Sin Toh Daichi10 Other11 None (does not support any party)Q8. < Ask only [Under 19].> Which policy do you think is Most Important and SecondMost Important for your child? If you have more than one child, please answer on behalfof your youngest child.1 Pension2 Healthcare3 Longterm care4 Education5 Science & technology6 Child rearing support7 Environment8 Energy9 Foreign affairs33
10 Employment11 Security (safety)Q9. Which party did you support or vote under Proprotional Representation in the lastgeneral election ?1 Japan Democratic Party2 Liberal Democratic Party3 Komei Toh4 Japan Communist5 Social Democratic6 Min-nanto Toh7 Kokumin Shin Toh8 Shin Toh Nippon9 Sin Toh Daichi10 Other11 None (does not support any party)Q10. Which party would you have voted for on behalf of your child ( Demeny VotingSystem ) in the last general election?1 Japan Democratic Party2 Liberal Democratic Party3 Komei Toh4 Japan Communist5 Social Democratic6 Min-nanto Toh7 Kokumin Shin Toh8 Shin Toh Nippon9 Sin Toh Daichi10 Other11 None (does not support any party)Q11. How should Demeny Voting System be implemented ?1 Father votes on behalf of child2 Mother votes on behalf of child34
3 Parents decide who votes4 Each parent has half a vote5 Other6 Opposed to the voting systemQ12. What is the main reason you are opposed to the Demeny Voting System ?1 Not fair to people without children2 Not possible to have voting by proxy3 No guarantee parent votes on behalf of child4 Have more children for more votes5 Other.Q13. How do you feel about the following alternative electoral systems?1 Lower voting age to 18 1 Support2 Don't know3 Oppose2 Age Districts:Instead ofgeographical distrcits, such asTokyo discrict 2, have disctricts byage, 20-29, 30-39, etc, or 20-39,40-59, etx.1 Support2 Don't know3 OpposeQ14. Please tell us any opinion you may have about the electoral systemQ15. What is the highest academic qualification ? (Your current academic program ifyou are still in school)1 Post graduate2 University3 Junior College4 Professional School5 High School, Polytechnique6 Junior High School7 Other35
Table A1: Parent Most or Second Most Important /Child Most Important PoliciesMost Important for ChildMost Important forPension Healthcare LongtermChildEducation S&TEnvironment Energy ForeignParentcarerearingaffiarsEmployment Security TotalPension 23.2 1.3 0.6 22.6 0.6 21.9 3.2 1.3 0.6 19.4 5.2 100.0Healthcare 2.2 37.8 0.0 26.7 0.0 17.8 4.4 0.0 0.0 8.9 2.2 100.0Longterm care 0.0 12.5 12.5 31.3 0.0 31.3 6.3 0.0 0.0 6.3 0.0 100.0Education 0.0 3.4 0.0 81.6 1.1 5.7 2.3 0.0 0.0 3.4 2.3 100.0Science &technology0.0 0.0 0.0 33.3 0.0 0.0 0.0 0.0 0.0 0.0 66.7 100.0Child rearingsupport0.0 2.4 0.0 23.4 0.0 64.7 1.8 0.0 0.0 4.2 3.6 100.0Environment 0.0 0.0 0.0 15.1 0.0 17.0 37.7 3.8 0.0 11.3 15.1 100.0Energy 1.8 5.4 0.0 17.9 1.8 17.9 10.7 26.8 0.0 12.5 5.4 100.0Foreign affairs 2.0 4.1 0.0 51.0 0.0 14.3 4.1 8.2 0.0 8.2 8.2 100.0Employment 0.8 1.1 0.0 30.6 0.0 18.5 4.5 0.8 0.0 32.8 10.9 100.0Security (safety) 0.0 0.0 0.0 12.7 0.0 11.9 1.5 0.0 0.0 6.7 67.2 100.036
Table A2: Parent Second /Child Most ImportantMost Important for Child2 nd MostLongtermChildForeignImportant for Pension HealthcareEducation S&TEnvironment EnergycarerearingaffairsParentEmployment Security TotalPension 1.1 5.1 0.0 26.0 0.0 29.9 6.2 0.6 0.0 21.5 9.6 100.0Healthcare 6.3 4.0 0.8 29.4 0.8 26.2 4.0 2.4 0.0 13.5 12.7 100.0Longterm care 10.0 5.0 0.0 17.5 0.0 32.5 0.0 0.0 0.0 27.5 7.5 100.0Education 0.0 0.0 0.0 47.1 0.0 26.4 2.3 0.0 0.0 5.7 18.4 100.0Science &technology9.1 0.0 0.0 18.2 9.1 9.1 0.0 9.1 0.0 36.4 9.1 100.0Child rearingsupport5.0 3.7 0.0 24.2 0.0 34.2 5.6 1.9 0.0 11.8 13.7 100.0Environment 1.3 5.1 0.0 33.3 1.3 11.5 10.3 2.6 0.0 5.1 29.5 100.0Energy 0.0 3.5 1.8 26.3 0.0 10.5 8.8 10.5 0.0 17.5 21.1 100.0Foreign affairs 5.4 0.0 0.0 39.3 0.0 8.9 5.4 5.4 1.8 21.4 12.5 100.0Employment 8.0 2.9 0.6 26.9 0.0 25.7 4.0 2.3 0.0 16.6 13.1 100.0Security(safety)0.0 2.2 0.0 16.4 0.0 6.0 3.7 1.5 0.0 6.7 9.7 46.337