Intergenerational Voter Preference Survey - Preliminary Results ...
Intergenerational Voter Preference Survey - Preliminary Results ...
Intergenerational Voter Preference Survey - Preliminary Results ...

You also want an ePaper? Increase the reach of your titles
YUMPU automatically turns print PDFs into web optimized ePapers that Google loves.
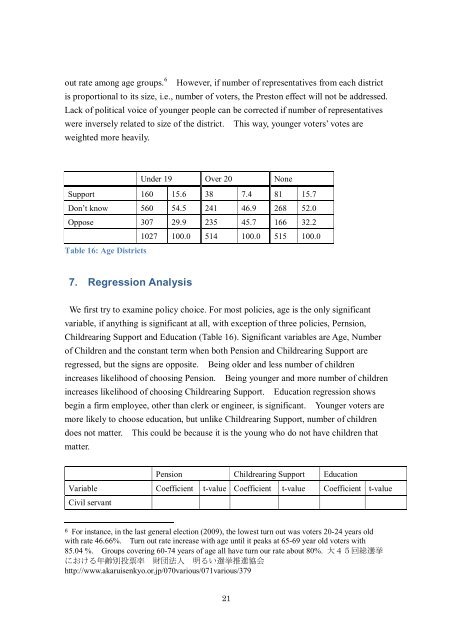
out rate among age groups. 6 However, if number of representatives from each districtis proportional to its size, i.e., number of voters, the Preston effect will not be addressed.Lack of political voice of younger people can be corrected if number of representativeswere inversely related to size of the district. This way, younger voters’ votes areweighted more heavily.Under 19 Over 20 NoneSupport 160 15.6 38 7.4 81 15.7Don’t know 560 54.5 241 46.9 268 52.0Oppose 307 29.9 235 45.7 166 32.21027 100.0 514 100.0 515 100.0Table 16: Age Districts7. Regression AnalysisWe first try to examine policy choice. For most policies, age is the only significantvariable, if anything is significant at all, with exception of three policies, Pernsion,Childrearing Support and Education (Table 16). Significant variables are Age, Numberof Children and the constant term when both Pension and Childrearing Support areregressed, but the signs are opposite. Being older and less number of childrenincreases likelihood of choosing Pension. Being younger and more number of childrenincreases likelihood of choosing Childrearing Support. Education regression showsbegin a firm employee, other than clerk or engineer, is significant. Younger voters aremore likely to choose education, but unlike Childrearing Support, number of childrendoes not matter. This could be because it is the young who do not have children thatmatter.Pension Childrearing Support EducationVariable Coefficient t-value Coefficient t-value Coefficient t-valueCivil servant6 For instance, in the last general election (2009), the lowest turn out was voters 20-24 years oldwith rate 46.66%. Turn out rate increase with age until it peaks at 65-69 year old voters with85.04 %. Groups covering 60-74 years of age all have turn our rate about 80%. 大 45 回 総 選 挙における 年 齢 別 投 票 率 財 団 法 人 明 るい 選 挙 推 進 協 会http://www.akaruisenkyo.or.jp/070various/071various/37921