Intergenerational Voter Preference Survey - Preliminary Results ...
Intergenerational Voter Preference Survey - Preliminary Results ...
Intergenerational Voter Preference Survey - Preliminary Results ...

You also want an ePaper? Increase the reach of your titles
YUMPU automatically turns print PDFs into web optimized ePapers that Google loves.
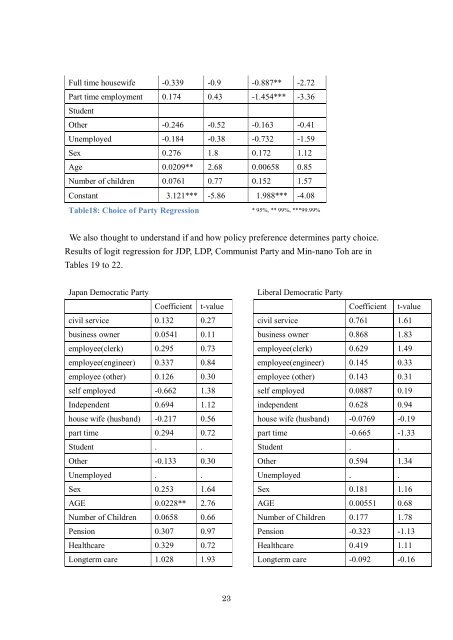
Full time housewife -0.339 -0.9 -0.887** -2.72Part time employment 0.174 0.43 -1.454*** -3.36StudentOther -0.246 -0.52 -0.163 -0.41Unemployed -0.184 -0.38 -0.732 -1.59Sex 0.276 1.8 0.172 1.12Age 0.0209** 2.68 0.00658 0.85Number of children 0.0761 0.77 0.152 1.57Constant 3.121*** -5.86 1.988*** -4.08Table18: Choice of Party Regression * 95%, ** 99%, ***99.99%We also thought to understand if and how policy preference determines party choice.<strong>Results</strong> of logit regression for JDP, LDP, Communist Party and Min-nano Toh are inTables 19 to 22.Japan Democratic PartyLiberal Democratic PartyCoefficient t-value Coefficient t-valuecivil service 0.132 0.27 civil service 0.761 1.61business owner 0.0541 0.11 business owner 0.868 1.83employee(clerk) 0.295 0.73 employee(clerk) 0.629 1.49employee(engineer) 0.337 0.84 employee(engineer) 0.145 0.33employee (other) 0.126 0.30 employee (other) 0.143 0.31self employed -0.662 1.38 self employed 0.0887 0.19Independent 0.694 1.12 independent 0.628 0.94house wife (husband) -0.217 0.56 house wife (husband) -0.0769 -0.19part time 0.294 0.72 part time -0.665 -1.33Student . . Student . .Other -0.133 0.30 Other 0.594 1.34Unemployed . . Unemployed . .Sex 0.253 1.64 Sex 0.181 1.16AGE 0.0228** 2.76 AGE 0.00551 0.68Number of Children 0.0658 0.66 Number of Children 0.177 1.78Pension 0.307 0.97 Pension -0.323 -1.13Healthcare 0.329 0.72 Healthcare 0.419 1.11Longterm care 1.028 1.93 Longterm care -0.092 -0.1623