Maitland High School Annual School Report - Millennium
Maitland High School Annual School Report - Millennium
Maitland High School Annual School Report - Millennium

You also want an ePaper? Increase the reach of your titles
YUMPU automatically turns print PDFs into web optimized ePapers that Google loves.
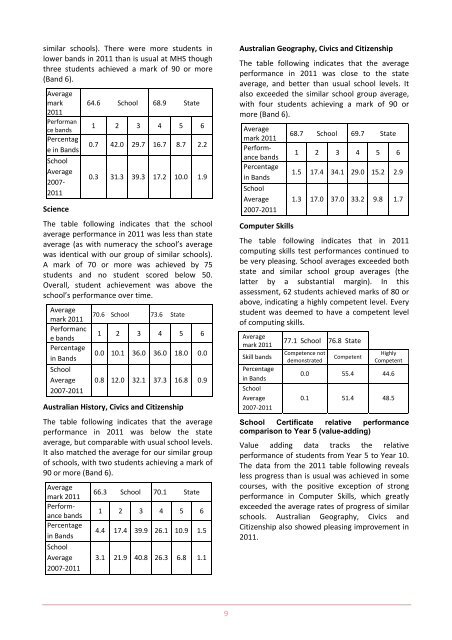
similar schools). There were more students inlower bands in 2011 than is usual at MHS thoughthree students achieved a mark of 90 or more(Band 6).Averagemark2011Performance bandsPercentage in Bands<strong>School</strong>Average2007‐2011Science64.6 <strong>School</strong> 68.9 State1 2 3 4 5 60.7 42.0 29.7 16.7 8.7 2.20.3 31.3 39.3 17.2 10.0 1.9The table following indicates that the schoolaverage performance in 2011 was less than stateaverage (as with numeracy the school’s averagewas identical with our group of similar schools).A mark of 70 or more was achieved by 75students and no student scored below 50.Overall, student achievement was above theschool’s performance over time.Averagemark 2011Performance bandsPercentagein Bands<strong>School</strong>Average2007‐201170.6 <strong>School</strong> 73.6 State1 2 3 4 5 60.0 10.1 36.0 36.0 18.0 0.00.8 12.0 32.1 37.3 16.8 0.9Australian History, Civics and CitizenshipThe table following indicates that the averageperformance in 2011 was below the stateaverage, but comparable with usual school levels.It also matched the average for our similar groupof schools, with two students achieving a mark of90 or more (Band 6).Averagemark 2011PerformancebandsPercentagein Bands<strong>School</strong>Average2007‐201166.3 <strong>School</strong> 70.1 State1 2 3 4 5 64.4 17.4 39.9 26.1 10.9 1.53.1 21.9 40.8 26.3 6.8 1.1Australian Geography, Civics and CitizenshipThe table following indicates that the averageperformance in 2011 was close to the stateaverage, and better than usual school levels. Italso exceeded the similar school group average,with four students achieving a mark of 90 ormore (Band 6).Averagemark 2011PerformancebandsPercentagein Bands<strong>School</strong>Average2007‐2011Computer Skills68.7 <strong>School</strong> 69.7 State1 2 3 4 5 61.5 17.4 34.1 29.0 15.2 2.91.3 17.0 37.0 33.2 9.8 1.7The table following indicates that in 2011computing skills test performances continued tobe very pleasing. <strong>School</strong> averages exceeded bothstate and similar school group averages (thelatter by a substantial margin). In thisassessment, 62 students achieved marks of 80 orabove, indicating a highly competent level. Everystudent was deemed to have a competent levelof computing skills.Averagemark 2011Skill bandsPercentagein Bands<strong>School</strong>Average2007‐201177.1 <strong>School</strong> 76.8 StateCompetence notdemonstratedCompetent<strong>High</strong>lyCompetent0.0 55.4 44.60.1 51.4 48.5<strong>School</strong> Certificate relative performancecomparison to Year 5 (value-adding)Value adding data tracks the relativeperformance of students from Year 5 to Year 10.The data from the 2011 table following revealsless progress than is usual was achieved in somecourses, with the positive exception of strongperformance in Computer Skills, which greatlyexceeded the average rates of progress of similarschools. Australian Geography, Civics andCitizenship also showed pleasing improvement in2011.9