Math III Unit 6, Lesson 2 - Ciclt.net
Math III Unit 6, Lesson 2 - Ciclt.net
Math III Unit 6, Lesson 2 - Ciclt.net
- No tags were found...

Create successful ePaper yourself
Turn your PDF publications into a flip-book with our unique Google optimized e-Paper software.
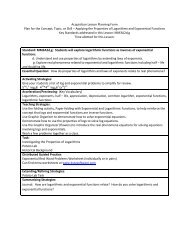
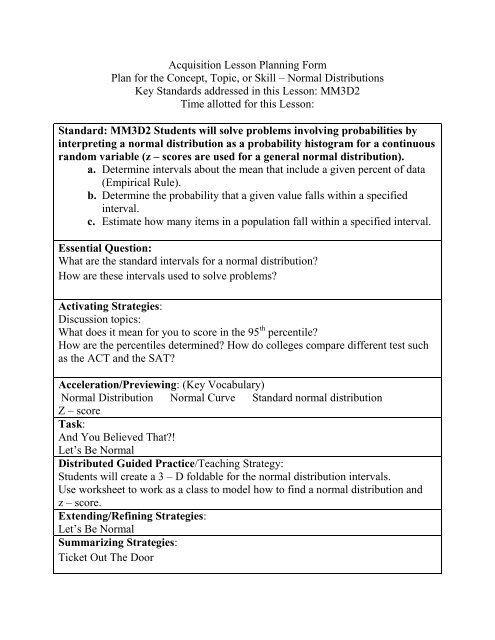
<strong>Unit</strong> 6 <strong>Lesson</strong> 2 Worksheet1) The distribution of heights of adult American men is approximately Normalwith mean 69 inches and standard deviation 2.5 inches. Use the 68 – 95 –99.7 rule to answer the following questions.(a)(b)(c)(d)What percent of men are taller than 74 inches?Between what heights do the middle 95% of men fall?What percent of men are shorter than 66.5 inches?A height of 71.5 inches corresponds to what percentile of adult maleAmerican heights?2) The distribution of weights of 9 –ounce bags of a particular brand of potatochips is approximately Normal with µ=9.12 ounces and standard deviation0.15 ounce.(a)(b)(c)Draw an accurate sketch of the distribution of potato chip bagweights. Be sure to label the mean, as well as the points one, two andthree standard deviations away from the mean on the horizontal axis.A bag that weighs 8.97 ounces is at what percentile in thisdistribution?What percent of 9 – ounce bags of this brand of potato chips weighbetween 8.67 ounces and 9.27 ounces.3) Scores on the Wechsler Adult Intelligence Scale (a standard IQ test) for the20 to 34 age group are approximately Normally distributed with µ=110 andα = 25. For each part that follows, sketch an appropriate Normaldistribution. Then show your work.(a) What percent of people aged 20 to 34 have IQ scores above 100?(b) What percent have scores above 150?(c) MENSA is an elite organization that admits as members people whoscore in the top 20% on IQ tests. What score on the Wechsler AdultIntelligence Scale would an individual have to earn to qualify forMENSA membership?
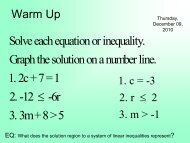
Ticket Out the Door<strong>Unit</strong> 6 <strong>Lesson</strong> 2Normal Distribution and Z Score1. A distribution of test scores is approximately normal with a mean score of 72and a standard deviation of 4.a. Sketch the graph of the normal distribution curve. (Bell Curve)b. What percent of the scores are between 68 and 76?c. In what range do the middle 95% of all scores fall?2. Find the z-score corresponding to a raw score of 132 from a normal distributionwith mean 100 and standard deviation 15.
<strong>Unit</strong> 6 <strong>Lesson</strong> 2Normal Distribution and Z ScoreTicket Out the Door KEY1. A distribution of test scores is approximately normal with a mean score of 72 and a standarddeviation of 4.a. Sketch the graph of the normal distribution curve. (Bell Curve)b. What percent of the scores are between 68 and 76?c. In what range do the middle 95% of all scores fall?a. self explanatoryb. 68%c. Between 62 and 80 which is 95%2. Find the z-score corresponding to a raw score of 132 from a normal distribution with mean100 and standard deviation 15.z =x -We compute132 -z = = 2.13315