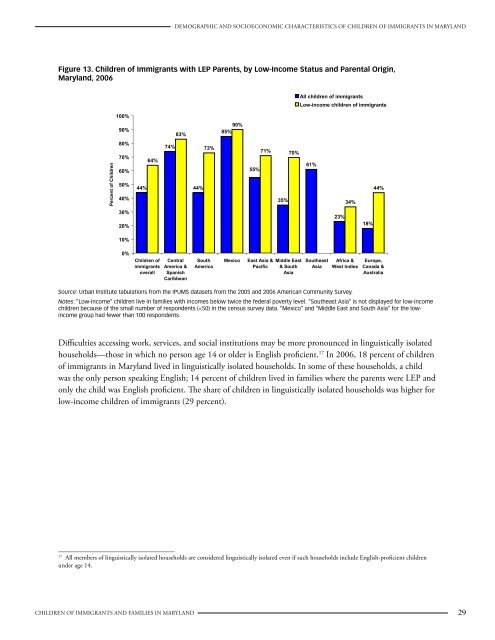
Demographic <strong>and</strong> Socioeconomic characteristics <strong>of</strong> Children <strong>of</strong> <strong>Immigrants</strong> <strong>in</strong> Maryl<strong>and</strong>Immigrant parents <strong>in</strong> Maryl<strong>and</strong> are less likely than immigrant parents nationwide to beLimited English Pr<strong>of</strong>icient, but English skills vary by immigrant orig<strong>in</strong> <strong>and</strong> low-<strong>in</strong>come status.Lack <strong>of</strong> English-language skills is a barrier for higher-skilled <strong>and</strong> higher-pay<strong>in</strong>g jobs, access to public <strong>and</strong>private <strong>in</strong>stitutions, <strong>and</strong> <strong>in</strong>volvement <strong>in</strong> civil <strong>and</strong> social life. Limited English Pr<strong>of</strong>icient (LEP) parents are alsounable to <strong>in</strong>teract with teachers <strong>in</strong> their children’s schools <strong>and</strong> are less able to help their children with homework.16 Thus, hav<strong>in</strong>g LEP parents <strong>and</strong> liv<strong>in</strong>g <strong>in</strong> l<strong>in</strong>guistically isolated households are risk factors for poverty,economic hardship, <strong>and</strong> poor performance <strong>in</strong> school (Hern<strong>and</strong>ez 2004). In Maryl<strong>and</strong>, 44 percent <strong>of</strong> children<strong>of</strong> immigrants had at least one LEP parent. This share was significantly lower than the national share(61 percent). Only eight states—Connecticut, Alaska, North Dakota, New Hampshire, Ma<strong>in</strong>e, Montana,West Virg<strong>in</strong>ia, <strong>and</strong> Vermont—had smaller shares <strong>of</strong> children with LEP parents.<strong>The</strong> LEP share, however, varied by immigrant orig<strong>in</strong>, with children <strong>of</strong> Lat<strong>in</strong> American <strong>and</strong> Asian orig<strong>in</strong>sbe<strong>in</strong>g most at risk because <strong>of</strong> their parents’ <strong>in</strong>ability to speak English well. Children <strong>of</strong> Mexican orig<strong>in</strong>(85 percent) <strong>and</strong> Central American orig<strong>in</strong> (74 percent) were the most likely to have LEP parents (figure 13).Similarly, a majority <strong>of</strong> children <strong>of</strong> Southeast Asian orig<strong>in</strong> (61 percent) <strong>and</strong> East Asian orig<strong>in</strong> (55 percent)had LEP parents.Children <strong>of</strong> immigrants <strong>in</strong> low-<strong>in</strong>come families were more likely than children <strong>of</strong> immigrants overall to haveLEP parents (64 percent versus 44 percent, figure 13). This is not surpris<strong>in</strong>g, given the strong correlationbetween English pr<strong>of</strong>iciency <strong>and</strong> immigrant earn<strong>in</strong>gs (Chiswick <strong>and</strong> Miller 2002). With the exception <strong>of</strong>children <strong>of</strong> European <strong>and</strong> African orig<strong>in</strong>, more than two-thirds <strong>of</strong> children <strong>in</strong> low-<strong>in</strong>come immigrant familieshad LEP parents. Almost all low-<strong>in</strong>come children <strong>of</strong> Mexican orig<strong>in</strong> (90 percent) <strong>and</strong> Central American orig<strong>in</strong>(83 percent) had LEP parents. Almost three-quarters <strong>of</strong> low-<strong>in</strong>come children <strong>of</strong> East Asian (71 percent),South American (73 percent), <strong>and</strong> Middle Eastern <strong>and</strong> South Asian orig<strong>in</strong> (70 percent) had LEP parents.16Limited English Pr<strong>of</strong>icient people reported that they speak a language other than English at home <strong>and</strong> speak English well, not well, or not at all.Those who speak English at home or speak another language but also speak English very well are considered English pr<strong>of</strong>icient. English pr<strong>of</strong>iciency isnot recorded for children under age 5 <strong>in</strong> the census data.28Children <strong>of</strong> <strong>Immigrants</strong> <strong>and</strong> <strong>Families</strong> <strong>in</strong> Maryl<strong>and</strong>
Demographic <strong>and</strong> Socioeconomic characteristics <strong>of</strong> Children <strong>of</strong> <strong>Immigrants</strong> <strong>in</strong> Maryl<strong>and</strong>Figure 13. Children <strong>of</strong> <strong>Immigrants</strong> with LEP Parents, by Low-Income Status <strong>and</strong> Parental Orig<strong>in</strong>,Maryl<strong>and</strong>, 2006All children <strong>of</strong> immigrantsLow-<strong>in</strong>come children <strong>of</strong> immigrants100%90%83%90%85%Percent <strong>of</strong> Children80%70%60%50%40%44%64%74%44%73%55%71% 70%35%61%34%44%30%20%23%18%10%0%Children <strong>of</strong>immigrantsoverallCentralAmerica &SpanishCaribbeanSouthAmericaMexicoEast Asia &PacificMiddle East& SouthAsiaSoutheastAsiaAfrica &West IndiesEurope,Canada &AustraliaSource: Urban Institute tabulations from the IPUMS datasets from the 2005 <strong>and</strong> 2006 American Community Survey.Notes: “Low-<strong>in</strong>come” children live <strong>in</strong> families with <strong>in</strong>comes below twice the federal poverty level. “Southeast Asia” is not displayed for low-<strong>in</strong>comechildren because <strong>of</strong> the small number <strong>of</strong> respondents (