The Integration of Immigrants and Their Families in Maryland: A ...
The Integration of Immigrants and Their Families in Maryland: A ...
The Integration of Immigrants and Their Families in Maryland: A ...
You also want an ePaper? Increase the reach of your titles
YUMPU automatically turns print PDFs into web optimized ePapers that Google loves.
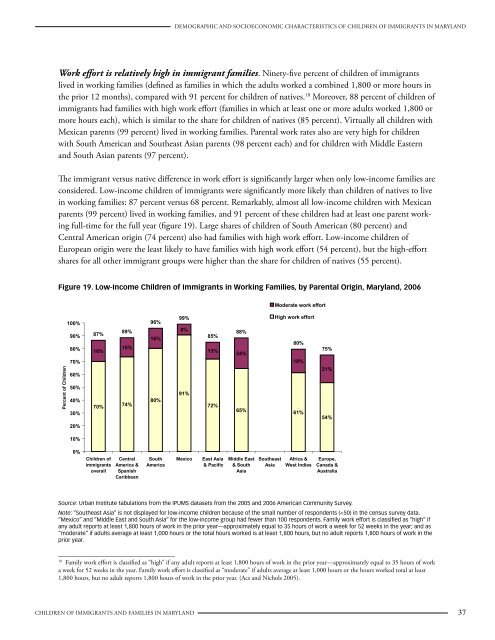
Demographic <strong>and</strong> Socioeconomic characteristics <strong>of</strong> Children <strong>of</strong> <strong>Immigrants</strong> <strong>in</strong> Maryl<strong>and</strong>Work effort is relatively high <strong>in</strong> immigrant families. N<strong>in</strong>ety-five percent <strong>of</strong> children <strong>of</strong> immigrantslived <strong>in</strong> work<strong>in</strong>g families (def<strong>in</strong>ed as families <strong>in</strong> which the adults worked a comb<strong>in</strong>ed 1,800 or more hours <strong>in</strong>the prior 12 months), compared with 91 percent for children <strong>of</strong> natives. 18 Moreover, 88 percent <strong>of</strong> children <strong>of</strong>immigrants had families with high work effort (families <strong>in</strong> which at least one or more adults worked 1,800 ormore hours each), which is similar to the share for children <strong>of</strong> natives (85 percent). Virtually all children withMexican parents (99 percent) lived <strong>in</strong> work<strong>in</strong>g families. Parental work rates also are very high for childrenwith South American <strong>and</strong> Southeast Asian parents (98 percent each) <strong>and</strong> for children with Middle Eastern<strong>and</strong> South Asian parents (97 percent).<strong>The</strong> immigrant versus native difference <strong>in</strong> work effort is significantly larger when only low-<strong>in</strong>come families areconsidered. Low-<strong>in</strong>come children <strong>of</strong> immigrants were significantly more likely than children <strong>of</strong> natives to live<strong>in</strong> work<strong>in</strong>g families: 87 percent versus 68 percent. Remarkably, almost all low-<strong>in</strong>come children with Mexicanparents (99 percent) lived <strong>in</strong> work<strong>in</strong>g families, <strong>and</strong> 91 percent <strong>of</strong> these children had at least one parent work<strong>in</strong>gfull-time for the full year (figure 19). Large shares <strong>of</strong> children <strong>of</strong> South American (80 percent) <strong>and</strong>Central American orig<strong>in</strong> (74 percent) also had families with high work effort. Low-<strong>in</strong>come children <strong>of</strong>European orig<strong>in</strong> were the least likely to have families with high work effort (54 percent), but the high-effortshares for all other immigrant groups were higher than the share for children <strong>of</strong> natives (55 percent).Figure 19. Low-Income Children <strong>of</strong> <strong>Immigrants</strong> <strong>in</strong> Work<strong>in</strong>g <strong>Families</strong>, by Parental Orig<strong>in</strong>, Maryl<strong>and</strong>, 2006Moderate work effortPercent <strong>of</strong> Children100%90%80%70%60%50%40%30%87%16%70%89%15%74%96%16%80%99%8%91%85%13%72%88%24%65%High work effort80%18%61%75%21%54%20%10%0%Children <strong>of</strong>immigrantsoverallCentralAmerica &SpanishCaribbeanSouthAmericaMexicoEast Asia& PacificMiddle East& SouthAsiaSoutheastAsiaAfrica &West IndiesEurope,Canada &AustraliaSource: Urban Institute tabulations from the IPUMS datasets from the 2005 <strong>and</strong> 2006 American Community Survey.Note: “Southeast Asia” is not displayed for low-<strong>in</strong>come children because <strong>of</strong> the small number <strong>of</strong> respondents (


