Demographic <strong>and</strong> Socioeconomic characteristics <strong>of</strong> Children <strong>of</strong> <strong>Immigrants</strong> <strong>in</strong> Maryl<strong>and</strong>Implications. Children <strong>of</strong> immigrants <strong>in</strong> Maryl<strong>and</strong> overall do as well as or better than children <strong>of</strong> nativesdo on <strong>in</strong>dicators <strong>of</strong> poverty, family <strong>in</strong>come, <strong>and</strong> home ownership. In addition, children <strong>of</strong> immigrants areless likely than children <strong>of</strong> natives to use public benefits, <strong>in</strong>clud<strong>in</strong>g food stamps <strong>and</strong> TANF. As expected, theimmigrant groups with the highest educational atta<strong>in</strong>ment <strong>and</strong> English skills—children with European,Middle Eastern, <strong>and</strong> South Asian parents—fare the best on these economic <strong>in</strong>dicators. Children with parentsfrom Southeast Asia, East Asia <strong>and</strong> the Pacific, <strong>and</strong> South America also fare well despite hav<strong>in</strong>g LEP parents.Children with parents from Mexico <strong>and</strong> South America, <strong>and</strong>, to a lesser extent, African parents, are morelikely than children from other immigrant groups to be <strong>in</strong> low-<strong>in</strong>come families. Factors associated with lowerfamily <strong>in</strong>comes <strong>in</strong>clude hav<strong>in</strong>g parents that are recent immigrants, LEP, or that have less formal education. Inthe case <strong>of</strong> children with parents <strong>of</strong> African orig<strong>in</strong>, s<strong>in</strong>gle parenthood, as well as underemployment (despitehigh skills <strong>and</strong> generally high English pr<strong>of</strong>iciency), leads to lower <strong>in</strong>comes for their families.It is encourag<strong>in</strong>g to note that immigrant family <strong>in</strong>comes rise with U.S. residency, education, <strong>and</strong> languageskills. This outcome suggests that adult education, language, <strong>and</strong> job skills tra<strong>in</strong><strong>in</strong>g for immigrant parents canhelp raise family <strong>in</strong>comes <strong>and</strong> improve economic prospects.Family <strong>and</strong> work supports that <strong>in</strong>crease parental employment <strong>and</strong> raise <strong>in</strong>comes may be especially importantfor low-<strong>in</strong>come immigrant families with children. <strong>The</strong> 1996 welfare reform law imposed restrictions onimmigrants’ eligibility for federal public benefits, which led to dramatic decreases <strong>in</strong> public benefits use amongimmigrants, even though some restrictions were subsequently lifted <strong>and</strong> citizen children rema<strong>in</strong>ed eligible forall programs (Fix <strong>and</strong> Passel 2002; Henderson et al. 2008; Shields <strong>and</strong> Behrman 2004). In some states, state<strong>and</strong> local governments have stepped <strong>in</strong> to fill the need to vary<strong>in</strong>g degrees (Fix <strong>and</strong> Passel 2002; Broder 2007).Moreover, many immigrant parents are still afraid or reluctant to apply for public benefits, so improvements<strong>in</strong> outreach <strong>and</strong> access to TANF, SNAP, Medicaid, <strong>and</strong> other programs are still needed.Given that immigrant families, <strong>in</strong>clud<strong>in</strong>g low-<strong>in</strong>come families, have high levels <strong>of</strong> work effort, policies thataim to <strong>in</strong>crease employment might not be sufficient. Programs that improve access to affordable child care,provide better public transportation <strong>and</strong> access to driver’s licenses, <strong>and</strong> help parents obta<strong>in</strong> better pay<strong>in</strong>g jobswith employer-provided benefits <strong>and</strong> stable work schedules, are also needed.38Children <strong>of</strong> <strong>Immigrants</strong> <strong>and</strong> <strong>Families</strong> <strong>in</strong> Maryl<strong>and</strong>
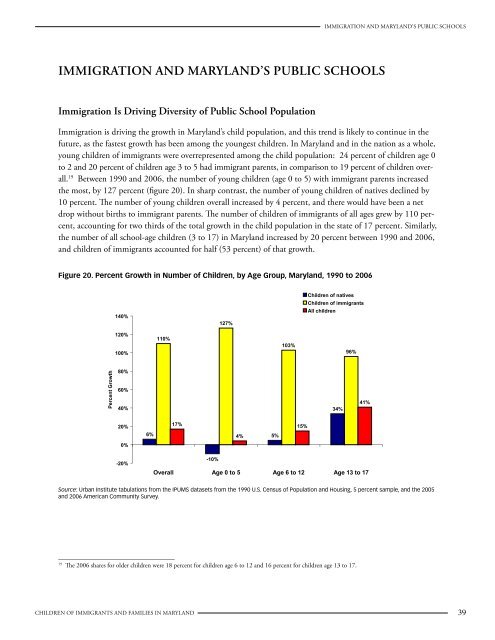
Immigration <strong>and</strong> Maryl<strong>and</strong>’s Public SchoolsImmigration <strong>and</strong> Maryl<strong>and</strong>’s Public SchoolsImmigration Is Driv<strong>in</strong>g Diversity <strong>of</strong> Public School PopulationImmigration is driv<strong>in</strong>g the growth <strong>in</strong> Maryl<strong>and</strong>’s child population, <strong>and</strong> this trend is likely to cont<strong>in</strong>ue <strong>in</strong> thefuture, as the fastest growth has been among the youngest children. In Maryl<strong>and</strong> <strong>and</strong> <strong>in</strong> the nation as a whole,young children <strong>of</strong> immigrants were overrepresented among the child population: 24 percent <strong>of</strong> children age 0to 2 <strong>and</strong> 20 percent <strong>of</strong> children age 3 to 5 had immigrant parents, <strong>in</strong> comparison to 19 percent <strong>of</strong> children overall.19 Between 1990 <strong>and</strong> 2006, the number <strong>of</strong> young children (age 0 to 5) with immigrant parents <strong>in</strong>creasedthe most, by 127 percent (figure 20). In sharp contrast, the number <strong>of</strong> young children <strong>of</strong> natives decl<strong>in</strong>ed by10 percent. <strong>The</strong> number <strong>of</strong> young children overall <strong>in</strong>creased by 4 percent, <strong>and</strong> there would have been a netdrop without births to immigrant parents. <strong>The</strong> number <strong>of</strong> children <strong>of</strong> immigrants <strong>of</strong> all ages grew by 110 percent,account<strong>in</strong>g for two thirds <strong>of</strong> the total growth <strong>in</strong> the child population <strong>in</strong> the state <strong>of</strong> 17 percent. Similarly,the number <strong>of</strong> all school-age children (3 to 17) <strong>in</strong> Maryl<strong>and</strong> <strong>in</strong>creased by 20 percent between 1990 <strong>and</strong> 2006,<strong>and</strong> children <strong>of</strong> immigrants accounted for half (53 percent) <strong>of</strong> that growth.Figure 20. Percent Growth <strong>in</strong> Number <strong>of</strong> Children, by Age Group, Maryl<strong>and</strong>, 1990 to 2006140%127%Children <strong>of</strong> nativesChildren <strong>of</strong> immigrantsAll children120%100%110%103%96%Percent Growth80%60%40%34%41%20%17%15%6%4%5%0%-20%-10%Overall Age 0 to 5 Age 6 to 12 Age 13 to 17Source: Urban Institute tabulations from the IPUMS datasets from the 1990 U.S. Census <strong>of</strong> Population <strong>and</strong> Hous<strong>in</strong>g, 5 percent sample, <strong>and</strong> the 2005<strong>and</strong> 2006 American Community Survey.19<strong>The</strong> 2006 shares for older children were 18 percent for children age 6 to 12 <strong>and</strong> 16 percent for children age 13 to 17.Children <strong>of</strong> <strong>Immigrants</strong> <strong>and</strong> <strong>Families</strong> <strong>in</strong> Maryl<strong>and</strong> 39