The Integration of Immigrants and Their Families in Maryland: A ...
The Integration of Immigrants and Their Families in Maryland: A ...
The Integration of Immigrants and Their Families in Maryland: A ...
You also want an ePaper? Increase the reach of your titles
YUMPU automatically turns print PDFs into web optimized ePapers that Google loves.
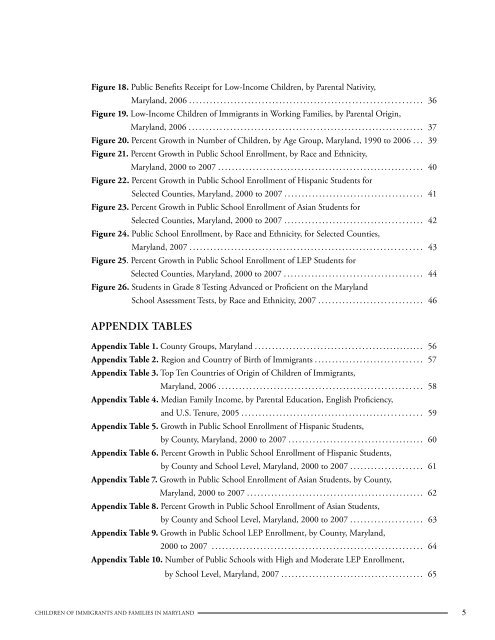
Figure 18. Public Benefits Receipt for Low-Income Children, by Parental Nativity,Maryl<strong>and</strong>, 2006 . . . . . . . . . . . . . . . . . . . . . . . . . . . . . . . . . . . . . . . . . . . . . . . . . . . . . . . . . . . . . . . . . . . 36Figure 19. Low-Income Children <strong>of</strong> <strong>Immigrants</strong> <strong>in</strong> Work<strong>in</strong>g <strong>Families</strong>, by Parental Orig<strong>in</strong>,Maryl<strong>and</strong>, 2006 . . . . . . . . . . . . . . . . . . . . . . . . . . . . . . . . . . . . . . . . . . . . . . . . . . . . . . . . . . . . . . . . . . . . 37Figure 20. Percent Growth <strong>in</strong> Number <strong>of</strong> Children, by Age Group, Maryl<strong>and</strong>, 1990 to 2006 . . . 39Figure 21. Percent Growth <strong>in</strong> Public School Enrollment, by Race <strong>and</strong> Ethnicity,Maryl<strong>and</strong>, 2000 to 2007 . . . . . . . . . . . . . . . . . . . . . . . . . . . . . . . . . . . . . . . . . . . . . . . . . . . . . . . . . . . 40Figure 22. Percent Growth <strong>in</strong> Public School Enrollment <strong>of</strong> Hispanic Students forSelected Counties, Maryl<strong>and</strong>, 2000 to 2007 . . . . . . . . . . . . . . . . . . . . . . . . . . . . . . . . . . . . . . . . 41Figure 23. Percent Growth <strong>in</strong> Public School Enrollment <strong>of</strong> Asian Students forSelected Counties, Maryl<strong>and</strong>, 2000 to 2007 . . . . . . . . . . . . . . . . . . . . . . . . . . . . . . . . . . . . . . . . 42Figure 24. Public School Enrollment, by Race <strong>and</strong> Ethnicity, for Selected Counties,Maryl<strong>and</strong>, 2007 . . . . . . . . . . . . . . . . . . . . . . . . . . . . . . . . . . . . . . . . . . . . . . . . . . . . . . . . . . . . . . . . . . . 43Figure 25. Percent Growth <strong>in</strong> Public School Enrollment <strong>of</strong> LEP Students forSelected Counties, Maryl<strong>and</strong>, 2000 to 2007 . . . . . . . . . . . . . . . . . . . . . . . . . . . . . . . . . . . . . . . . 44Figure 26. Students <strong>in</strong> Grade 8 Test<strong>in</strong>g Advanced or Pr<strong>of</strong>icient on the Maryl<strong>and</strong>School Assessment Tests, by Race <strong>and</strong> Ethnicity, 2007 . . . . . . . . . . . . . . . . . . . . . . . . . . . . . . 46Appendix TablesAppendix Table 1. County Groups, Maryl<strong>and</strong> . . . . . . . . . . . . . . . . . . . . . . . . . . . . . . . . . . . . . . . .......... 56Appendix Table 2. Region <strong>and</strong> Country <strong>of</strong> Birth <strong>of</strong> <strong>Immigrants</strong> . . . . . . . . . . . . . . . . . . . . . . . . . . . . . . . 57Appendix Table 3. Top Ten Countries <strong>of</strong> Orig<strong>in</strong> <strong>of</strong> Children <strong>of</strong> <strong>Immigrants</strong>,Maryl<strong>and</strong>, 2006 . . . . . . . . . . . . . . . . . . . . . . . . . . . . . . . . . . . . . . . . . . . . . . . . . . . . . . . . . . . 58Appendix Table 4. Median Family Income, by Parental Education, English Pr<strong>of</strong>iciency,<strong>and</strong> U.S. Tenure, 2005 . . . . . . . . . . . . . . . . . . . . . . . . . . . . . . . . . . . . . . . . . . . . . . . . . . . . 59Appendix Table 5. Growth <strong>in</strong> Public School Enrollment <strong>of</strong> Hispanic Students,by County, Maryl<strong>and</strong>, 2000 to 2007 . . . . . . . . . . . . . . . . . . . . . . . . . . . . . . . . . . . . . . . 60Appendix Table 6. Percent Growth <strong>in</strong> Public School Enrollment <strong>of</strong> Hispanic Students,by County <strong>and</strong> School Level, Maryl<strong>and</strong>, 2000 to 2007 . . . . . . . . . . . . . . . . . . . . . 61Appendix Table 7. Growth <strong>in</strong> Public School Enrollment <strong>of</strong> Asian Students, by County,Maryl<strong>and</strong>, 2000 to 2007 . . . . . . . . . . . . . . . . . . . . . . . . . . . . . . . . . . . . . . . . . . . . . . . . . . . 62Appendix Table 8. Percent Growth <strong>in</strong> Public School Enrollment <strong>of</strong> Asian Students,by County <strong>and</strong> School Level, Maryl<strong>and</strong>, 2000 to 2007 . . . . . . . . . . . . . . . . . . . . . 63Appendix Table 9. Growth <strong>in</strong> Public School LEP Enrollment, by County, Maryl<strong>and</strong>,2000 to 2007 . . . . . . . . . . . . . . . . . . . . . . . . . . . . . . . . . . . . . . . . . . . . . . . . . . . . . . . . . . . . . 64Appendix Table 10. Number <strong>of</strong> Public Schools with High <strong>and</strong> Moderate LEP Enrollment,by School Level, Maryl<strong>and</strong>, 2007 . . . . . . . . . . . . . . . . . . . . . . . . . . . . . . . . . . . . . . . . . 65Children <strong>of</strong> <strong>Immigrants</strong> <strong>and</strong> <strong>Families</strong> <strong>in</strong> Maryl<strong>and</strong> 5


