The Integration of Immigrants and Their Families in Maryland: A ...
The Integration of Immigrants and Their Families in Maryland: A ...
The Integration of Immigrants and Their Families in Maryland: A ...

Create successful ePaper yourself
Turn your PDF publications into a flip-book with our unique Google optimized e-Paper software.
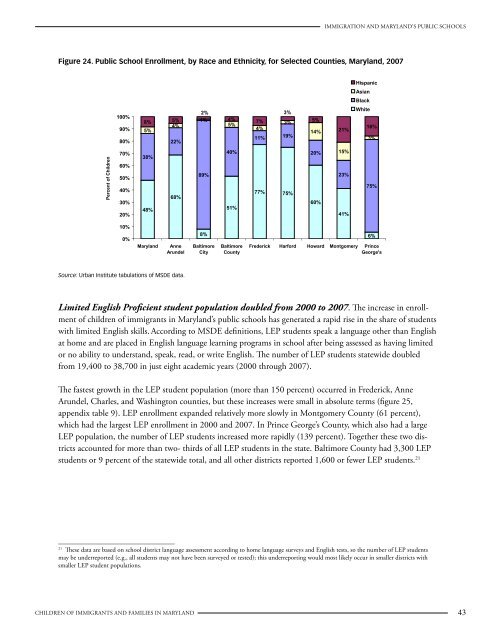
Immigration <strong>and</strong> Maryl<strong>and</strong>’s Public SchoolsFigure 24. Public School Enrollment, by Race <strong>and</strong> Ethnicity, for Selected Counties, Maryl<strong>and</strong>, 2007HispanicAsianBlack100%90%80%2% 3%8% 5% 1% 4%7%4%5%3%5%5%4%14%11%19%22%21%White16%3%Percent <strong>of</strong> Children70%60%50%40%30%20%38%48%68%89%40%51%77% 75%20%60%15%23%41%75%10%0%Maryl<strong>and</strong>AnneArundel8%BaltimoreCityBaltimoreCounty6%Frederick Harford Howard Montgomery Pr<strong>in</strong>ceGeorge'sSource: Urban Institute tabulations <strong>of</strong> MSDE data.Limited English Pr<strong>of</strong>icient student population doubled from 2000 to 2007. <strong>The</strong> <strong>in</strong>crease <strong>in</strong> enrollment<strong>of</strong> children <strong>of</strong> immigrants <strong>in</strong> Maryl<strong>and</strong>’s public schools has generated a rapid rise <strong>in</strong> the share <strong>of</strong> studentswith limited English skills. Accord<strong>in</strong>g to MSDE def<strong>in</strong>itions, LEP students speak a language other than Englishat home <strong>and</strong> are placed <strong>in</strong> English language learn<strong>in</strong>g programs <strong>in</strong> school after be<strong>in</strong>g assessed as hav<strong>in</strong>g limitedor no ability to underst<strong>and</strong>, speak, read, or write English. <strong>The</strong> number <strong>of</strong> LEP students statewide doubledfrom 19,400 to 38,700 <strong>in</strong> just eight academic years (2000 through 2007).<strong>The</strong> fastest growth <strong>in</strong> the LEP student population (more than 150 percent) occurred <strong>in</strong> Frederick, AnneArundel, Charles, <strong>and</strong> Wash<strong>in</strong>gton counties, but these <strong>in</strong>creases were small <strong>in</strong> absolute terms (figure 25,appendix table 9). LEP enrollment exp<strong>and</strong>ed relatively more slowly <strong>in</strong> Montgomery County (61 percent),which had the largest LEP enrollment <strong>in</strong> 2000 <strong>and</strong> 2007. In Pr<strong>in</strong>ce George’s County, which also had a largeLEP population, the number <strong>of</strong> LEP students <strong>in</strong>creased more rapidly (139 percent). Together these two districtsaccounted for more than two- thirds <strong>of</strong> all LEP students <strong>in</strong> the state. Baltimore County had 3,300 LEPstudents or 9 percent <strong>of</strong> the statewide total, <strong>and</strong> all other districts reported 1,600 or fewer LEP students. 2121<strong>The</strong>se data are based on school district language assessment accord<strong>in</strong>g to home language surveys <strong>and</strong> English tests, so the number <strong>of</strong> LEP studentsmay be underreported (e.g., all students may not have been surveyed or tested); this underreport<strong>in</strong>g would most likely occur <strong>in</strong> smaller districts withsmaller LEP student populations.Children <strong>of</strong> <strong>Immigrants</strong> <strong>and</strong> <strong>Families</strong> <strong>in</strong> Maryl<strong>and</strong> 43