Oxford Catalysts Group PLC Annual Report and Accounts 2010
Oxford Catalysts Group PLC Annual Report and Accounts 2010
Oxford Catalysts Group PLC Annual Report and Accounts 2010

You also want an ePaper? Increase the reach of your titles
YUMPU automatically turns print PDFs into web optimized ePapers that Google loves.
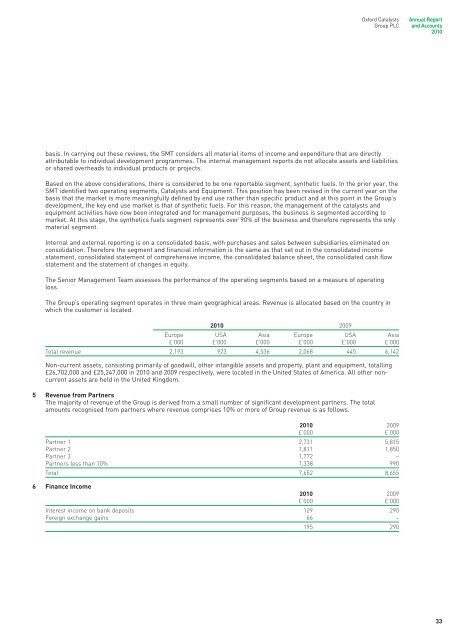
<strong>Oxford</strong> <strong>Catalysts</strong><strong>Group</strong> <strong>PLC</strong><strong>Annual</strong> <strong>Report</strong><strong>and</strong> <strong>Accounts</strong><strong>2010</strong>basis. In carrying out these reviews, the SMT considers all material items of income <strong>and</strong> expenditure that are directlyattributable to individual development programmes. The internal management reports do not allocate assets <strong>and</strong> liabilitiesor shared overheads to individual products or projects.Based on the above considerations, there is considered to be one reportable segment, synthetic fuels. In the prior year, theSMT identified two operating segments, <strong>Catalysts</strong> <strong>and</strong> Equipment. This position has been revised in the current year on thebasis that the market is more meaningfully defined by end use rather than specific product <strong>and</strong> at this point in the <strong>Group</strong>’sdevelopment, the key end use market is that of synthetic fuels. For this reason, the management of the catalysts <strong>and</strong>equipment activities have now been integrated <strong>and</strong> for management purposes, the business is segmented according tomarket. At this stage, the synthetics fuels segment represents over 90% of the business <strong>and</strong> therefore represents the onlymaterial segment.Internal <strong>and</strong> external reporting is on a consolidated basis, with purchases <strong>and</strong> sales between subsidiaries eliminated onconsolidation. Therefore the segment <strong>and</strong> financial information is the same as that set out in the consolidated incomestatement, consolidated statement of comprehensive income, the consolidated balance sheet, the consolidated cash flowstatement <strong>and</strong> the statement of changes in equity.The Senior Management Team assesses the performance of the operating segments based on a measure of operatingloss.The <strong>Group</strong>’s operating segment operates in three main geographical areas. Revenue is allocated based on the country inwhich the customer is located.<strong>2010</strong> 2009Europe USA Asia Europe USA Asia£’000 £’000 £’000 £’000 £’000 £’000Total revenue 2,193 923 4,536 2,068 445 6,142Non-current assets, consisting primarily of goodwill, other intangible assets <strong>and</strong> property, plant <strong>and</strong> equipment, totalling£26,702,000 <strong>and</strong> £25,247,000 in <strong>2010</strong> <strong>and</strong> 2009 respectively, were located in the United States of America. All other noncurrentassets are held in the United Kingdom.5 Revenue from PartnersThe majority of revenue of the <strong>Group</strong> is derived from a small number of significant development partners. The totalamounts recognised from partners where revenue comprises 10% or more of <strong>Group</strong> revenue is as follows.<strong>2010</strong> 2009£’000 £’000Partner 1 2,731 5,815Partner 2 1,811 1,850Partner 3 1,772 –Partners less than 10% 1,338 990Total 7,652 8,6556 Finance Income<strong>2010</strong> 2009£’000 £’000Interest income on bank deposits 129 290Foreign exchange gains 66 –195 29033