Analysis of micro samples using the stand-alone FT-IR ... - Bruker
Analysis of micro samples using the stand-alone FT-IR ... - Bruker
Analysis of micro samples using the stand-alone FT-IR ... - Bruker

You also want an ePaper? Increase the reach of your titles
YUMPU automatically turns print PDFs into web optimized ePapers that Google loves.
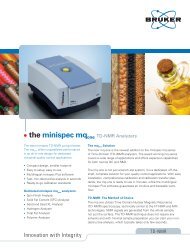
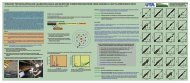
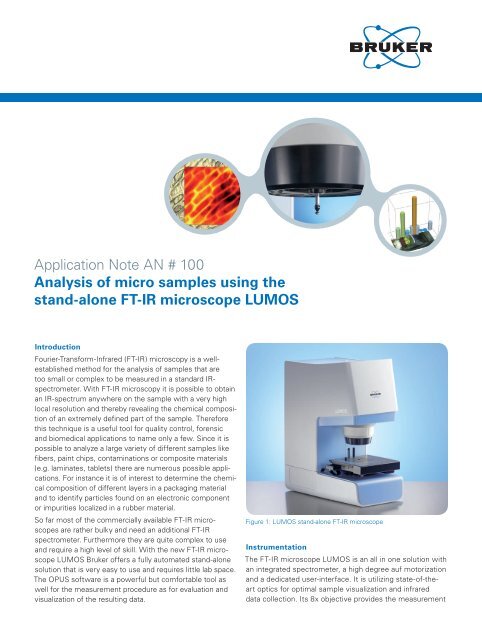
Application Note AN # 100<strong>Analysis</strong> <strong>of</strong> <strong>micro</strong> <strong>samples</strong> <strong>using</strong> <strong>the</strong><strong>stand</strong>-<strong>alone</strong> <strong>FT</strong>-<strong>IR</strong> <strong>micro</strong>scope LUMOSIntroductionFourier-Transform-Infrared (<strong>FT</strong>-<strong>IR</strong>) <strong>micro</strong>scopy is a wellestablishedmethod for <strong>the</strong> analysis <strong>of</strong> <strong>samples</strong> that aretoo small or complex to be measured in a <strong>stand</strong>ard <strong>IR</strong>spectrometer.With <strong>FT</strong>-<strong>IR</strong> <strong>micro</strong>scopy it is possible to obtainan <strong>IR</strong>-spectrum anywhere on <strong>the</strong> sample with a very highlocal resolution and <strong>the</strong>reby revealing <strong>the</strong> chemical composition<strong>of</strong> an extremely defined part <strong>of</strong> <strong>the</strong> sample. Thereforethis technique is a useful tool for quality control, forensicand biomedical applications to name only a few. Since it ispossible to analyze a large variety <strong>of</strong> different <strong>samples</strong> likefibers, paint chips, contaminations or composite materials(e.g. laminates, tablets) <strong>the</strong>re are numerous possible applications.For instance it is <strong>of</strong> interest to determine <strong>the</strong> chemicalcomposition <strong>of</strong> different layers in a packaging materialand to identify particles found on an electronic componentor impurities localized in a rubber material.So far most <strong>of</strong> <strong>the</strong> commercially available <strong>FT</strong>-<strong>IR</strong> <strong>micro</strong>scopesare ra<strong>the</strong>r bulky and need an additional <strong>FT</strong>-<strong>IR</strong>spectrometer. Fur<strong>the</strong>rmore <strong>the</strong>y are quite complex to useand require a high level <strong>of</strong> skill. With <strong>the</strong> new <strong>FT</strong>-<strong>IR</strong> <strong>micro</strong>scopeLUMOS <strong>Bruker</strong> <strong>of</strong>fers a fully automated <strong>stand</strong>-<strong>alone</strong>solution that is very easy to use and requires little lab space.The OPUS s<strong>of</strong>tware is a powerful but comfortable tool aswell for <strong>the</strong> measurement procedure as for evaluation andvisualization <strong>of</strong> <strong>the</strong> resulting data.Figure 1: LUMOS <strong>stand</strong>-<strong>alone</strong> <strong>FT</strong>-<strong>IR</strong> <strong>micro</strong>scopeInstrumentationThe <strong>FT</strong>-<strong>IR</strong> <strong>micro</strong>scope LUMOS is an all in one solution withan integrated spectrometer, a high degree auf motorizationand a dedicated user-interface. It is utilizing state-<strong>of</strong>-<strong>the</strong>artoptics for optimal sample visualization and infrareddata collection. Its 8x objective provides <strong>the</strong> measurement
Contaminations have a negative impact on <strong>the</strong> productquality; especially in <strong>the</strong> field <strong>of</strong> <strong>micro</strong>electronics impurimodesATR, transmission and reflection and high qualityvisual inspection capabilities. The innovative motorizedAttenuated Total Reflectance (ATR) crystal allows performing<strong>the</strong> complete measurement procedure fully automatedincluding background and sample measurements. Toprovide perfect contact to <strong>samples</strong> ranging from s<strong>of</strong>t tovery hard <strong>the</strong> ATR-device <strong>of</strong>fers three pressure steps andis equipped with a precise internal pressure control. Thebuilt in PermaVac Mercury-Cadmium-Telluride Detector(MCT) ensures a maintenance free operation and lownoisespectra. A high working distance and a comfortablefield <strong>of</strong> view <strong>of</strong> 1.5 x 1.2 mm are facilitating <strong>the</strong> sampleinspection. In combination with a motorized stage, fullyautomated mappings can be performed. Additionally formaximum performance and convenience <strong>the</strong> LUMOSincludes amongst o<strong>the</strong>rs:• A motorized ATR crystal, motorized transparent knifeedge apertures and condenser• Automatic change <strong>of</strong> numerical aperture between <strong>IR</strong>and VIS• Two LED sources for transmission and reflection• A CCD camera with 4x digital zoom• Electronic recognition <strong>of</strong> sample plates• Optionally a motorized stage with a position accuracy<strong>of</strong> 0.1 µm• Optional macro accessory that allows to use all QuickSnap sampling modules from <strong>the</strong> compact <strong>FT</strong><strong>IR</strong>spectrometer ALPHAThe user is guided through <strong>the</strong> whole measurement procedureby <strong>the</strong> dedicated OPUS Video-wizard, a user interfacethat always provides <strong>the</strong> appropriate functions for <strong>the</strong>current measurement step. Figure 2 shows <strong>the</strong> functionbar on <strong>the</strong> left side during <strong>the</strong> setup <strong>of</strong> <strong>the</strong> measurementpositions; with <strong>the</strong> Back button it is always possible toalter previous settings at will.Figure 2: Video-wizard – Setting <strong>of</strong> measurement positionsApplication example:Identification <strong>of</strong> a contamination on a SMD choke.Figure 3: Visual image <strong>of</strong> one <strong>of</strong> <strong>the</strong> contacts <strong>of</strong> <strong>the</strong> SMD-choke. Theinset shows a <strong>stand</strong>ard camera image.ties are an important topic. Since electronic devices aregetting smaller and smaller <strong>the</strong>y are also becoming moreand more vulnerable to all kinds <strong>of</strong> contaminations: Asurface mounted device (SMD) which is contaminatedcan eventually not be soldered anymore and is a potentialsource <strong>of</strong> leak currents. In a more complex electronic elementeven a small grain <strong>of</strong> dust can have dramatic effects;most probably <strong>the</strong> element will not work at all.In order to eliminate <strong>the</strong> source <strong>of</strong> <strong>the</strong> contamination it isvital to know its chemical nature. Using <strong>FT</strong>-<strong>IR</strong> <strong>micro</strong>scopycontaminations in <strong>the</strong> low <strong>micro</strong>meter range can be identified.As an example we show <strong>the</strong> analysis <strong>of</strong> a contaminationon <strong>the</strong> soldering contact <strong>of</strong> a SMD-choke (see figure 4). Thechoke has a footprint <strong>of</strong> about 3.0 x 2.5 mm and a height<strong>of</strong> ca. 2 mm. Upon inspection with <strong>the</strong> visible objective <strong>of</strong><strong>the</strong> LUMOS a series <strong>of</strong> black spots is visible on one <strong>of</strong> <strong>the</strong>contacts.To analyze both <strong>the</strong> spots and <strong>the</strong>ir environment a line-mapwas measured in <strong>the</strong> reflection mode including two <strong>of</strong> <strong>the</strong>black spots. Altoge<strong>the</strong>r twenty spectra were measured ina consecutive row as shown in figure 4. Due to prominentamide I and II bands in <strong>the</strong> spectra measured on <strong>the</strong> spotsit was obvious that <strong>the</strong> unknown substance is some kind<strong>of</strong> protein, a fact that was also supported by <strong>the</strong> result <strong>of</strong>a library search. Consequently to quantify <strong>the</strong> degree <strong>of</strong>contamination <strong>the</strong> amide I band between ca. 1710 and1580 cm -1 was integrated and <strong>the</strong> results were graphicallyplotted over <strong>the</strong> visual image. It is evident that <strong>the</strong> highestconcentrations <strong>of</strong> <strong>the</strong> protein can be found on <strong>the</strong> blackspots. With <strong>the</strong> ga<strong>the</strong>red information it is now much easierto remove <strong>the</strong> contamination source.