Poultry statistics in the European Union: flock numbers ... - Eurocarne
Poultry statistics in the European Union: flock numbers ... - Eurocarne
Poultry statistics in the European Union: flock numbers ... - Eurocarne
Create successful ePaper yourself
Turn your PDF publications into a flip-book with our unique Google optimized e-Paper software.
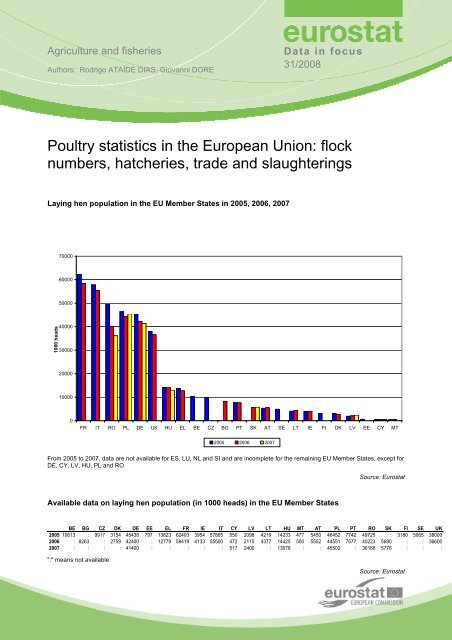
Chicks for fatten<strong>in</strong>g <strong>in</strong> <strong>the</strong> EU per poultry species <strong>in</strong> 2007SELUEEMTLVCYSILTATFIBGSKIEELRODKHUBECZPTITNLDEESPLFRUK0 100 200 300 400 500 600 700 800 900 10001000 ChicksHens Ducks Geese TurkeysConfidential data: BG (ducks, turkeys); DE (ducks, geese); EE (hens); SK (ducks, geese, turkeys); SE (hens); UK (turkeys)Source: EurostatMonthly number of chicks (hens) for fatten<strong>in</strong>g-utility hatched <strong>in</strong> <strong>the</strong> EU Member States2007m03 2007m04 2007m05 2007m06 2007m07 2007m08 2007m09 2007m10 2007m11 2007m12 2008m01 2008m02BE 16120 15437 15246 16120 15845 15052 15038 16397 12078 15742 14644 :BG 5588 5381 5562 5927 5835 5919 5459 5252 4713 3712 4181 :CZ 18002 17057 17744 17310 18971 18509 16630 19708 16704 16633 17467 :DK 10448 8806 9756 11964 9587 9762 11235 9187 7320 12261 : :DE 38080 38123 40054 40257 39955 41091 39467 45060 38879 45137 45155 :EE c c c c c c c c c c c cEL 10584 10258 10936 10180 10509 11241 9246 10304 : : : :ES 49114 47839 51218 50595 48658 50878 46819 50670 48246 49105 : :FR 75757 63275 63948 77695 60731 58449 72442 59483 53473 75335 : :IE 5348 6829 5764 5922 7805 6997 6644 8019 : : : :IT 28854 31967 30444 34531 31203 31804 33705 30612 31633 : : :CY 1356 1249 1344 1304 1120 1313 1248 1377 1301 1287 1350 :LV 898 1185 1223 1148 1195 1242 1093 1285 1234 1183 1282 :LT 3166 3020 3226 2924 3216 3403 3016 3189 2831 3243 3465 :LU : : : : : : : : : : : :HU 13467 12894 11858 11954 11671 12744 10879 12338 11115 11026 9468 :MT 295 258 207 213 237 373 301 359 390 293 : :NL 38557 38004 44330 37417 36966 40812 35744 38766 35137 : : :AT 4645 4192 5325 4398 4259 5475 4298 5307 3963 4005 : :PL 53550 50881 52000 49785 51396 52493 47464 54032 50145 47361 49903 :PT 18773 18178 19811 19284 20377 19825 17477 19242 16867 17197 : :RO 10372 11872 14933 9048 5738 5339 7280 8965 7726 6615 : :SI 2418 2239 2667 2590 3010 2514 2111 2105 2090 2349 2548 2581SK 5435 6237 6611 5298 6021 5263 4742 5589 4083 3807 3669 :FI 4563 4774 4762 4670 4893 5142 4376 4957 4301 4752 : :SE c c c c c c c c c c c cUK 66168 82325 65800 67177 79456 64812 65703 81553 58219 63885 79137 :":" means not available and "c" means confidentialSource: Eurostat2 31/2008 — Data <strong>in</strong> focus
Total capacity of hatcheries <strong>in</strong> <strong>the</strong> EU Member States <strong>in</strong> 2006 and 20071400001200001000001000 animals800006000040000200000PL ES UK IT FR BG SI DE HU CZ BE PT RO NL SK AT LT FI LV CY EE MT2006 2007For 2006 and 2007, data are not available for DK, IE, EL, LU and SESource: EurostatChicks for fatten<strong>in</strong>g placed <strong>in</strong> production = chicks hatched + imports - exports(available data for <strong>the</strong> EU Member States <strong>in</strong> 2005, 2006 and 2007)10000009000008000007000006000001000 heads5000004000003000002000001000000UK FR ES IT NL PT BE DK EL FI BG CY2005 2006 2007Source: EurostatData <strong>in</strong> focus — 31/2008 3
Trade balance (exports m<strong>in</strong>us imports) <strong>in</strong> eggs (average of available data from 2000 to 2007<strong>in</strong> <strong>the</strong> EU Member States)350250150Million eggs50-50NL ES PL BE IT HU SK FI LT BG LV PT CZ LU CY SI EE FR EL RO IE SE DK AT UK DE-150-250-350Data for MT are not available<strong>Poultry</strong> slaughter<strong>in</strong>gs <strong>in</strong> <strong>the</strong> EU Member States <strong>in</strong> 2005, 2006 and 2007Source: Eurostat20001800160014001000 Heads120010008006004002000FR UK ES PL DE IT NL HU PT CZ DK EL IE AT SE BG SK FI LT SI CY LV EE MT LU2005 2006 2007Data for BE and RO are not availableSource: Eurostat4 31/2008 — Data <strong>in</strong> focus
Monthly <strong>Poultry</strong> Slaughter<strong>in</strong>gs (<strong>in</strong> 1000 tonnes) <strong>in</strong> <strong>the</strong> EU Member States2007m05 2007m06 2007m07 2007m08 2007m09 2007m10 2007m11 2007m12 2008m01 2008m02 2008m03 2008m04BE : : : : : : : : : : : :BG 9.036 8.536 8.512 8.122 8.678 8.972 8.205 8.075 6.507 6.501 6.458 8.179CZ 19.428 17.282 18.158 19.1 18.356 20.933 19.041 15.469 17.951 15.469 17.209 :DK 12.841 12.841 14.806 14.806 14.806 14.9 14.9 14.9 14.2 14.2 14.2 :DE 90.608 80.937 92.738 95.873 88.726 95.373 97.207 91.957 100.097 90.435 89.972 101.914EE 1.121 1.091 1.055 1.04 0.883 1.1 1.028 1.029 0.993 0.968 1.073 1.013IE 11.648 8.452 9.016 11.246 9.158 9.204 12.201 14.31 : : : :EL 13.081 13.158 13.479 13.855 14.109 14.086 14.007 14.434 13.512 13.182 12.925 :ES 111.845 96.651 124.833 126.866 113.446 130.97 100.151 95.873 119.478 114.385 111.906 :FR 143.813 143.828 143.946 143.258 132.777 156.163 145.911 147.672 149.432 136.901 138.531 152.125IT 65.913 58.808 63.463 63.492 62.028 68.144 62.178 60.088 93.623 89.786 91.766 96.472CY 2.583 2.455 2.562 2.488 2.135 2.499 2.395 2.874 2.48 2.403 2.393 1.888LV 1.797 1.651 1.77 1.675 1.541 1.692 1.751 1.936 1.979 1.824 1.999 2.015LT 5.95 5.542 5.41 6.326 5.369 5.724 5.667 5.68 5.778 5.089 5.489 5.793LU 0.006 0.013 0.005 0.004 0.005 0.014 0.015 0.014 0 0.014 0.009 0HU 34.691 32.457 32.774 29.01 30.512 35.51 33.097 28.109 31.303 29.278 29.289 34.836MT 0.503 0.377 0.314 0.288 0.295 0.445 0.415 0.355 0.451 0.46 0.415 0.498NL 62.065 60.093 57.31 60.682 62.527 67.77 62.791 58.817 : : : :AT 9.543 9.493 9.509 9.93 8.704 9.505 8.409 9.257 9.297 8.109 8.982 9.265PL 96.175 91.866 99.835 102.889 98.349 113.12 100.781 92.869 104.798 93.918 96.379 102.761PT 23.791 22.246 25.134 24.896 21.395 24.597 22.784 22.379 23.423 21.645 21.445 23.491RO : : : : : : : : : : : :SI 4.747 4.963 5.218 5.148 4.805 5.357 5.41 4.8 5.182 4.405 4.635 4.922SK 7.286 7.522 7.063 7.406 7.75 7.138 6.795 6.451 6.162 4.172 6.968 6.6FI 8.106 7.39 8.296 8.306 8.031 8.884 8.988 7.105 0 : : :SE 8.717 8.717 8.774 8.774 8.774 8.595 8.595 8.595 8.578 8.578 8.577 :UK 114.91 113.72 140 107.8 103.11 140.03 120.23 109.68 137.12 109.25 106.87 135.67":" means not available Source: EurostatEU Import and Export of <strong>Poultry</strong>meat1,2001000 T <strong>in</strong> Product weight1,00080060040020001996 1997 1998 1999 2000 2001 2002 2003 2004 2005 2006 2007import Export Trade SurplusSource: ComextData <strong>in</strong> focus — 31/2008 5
MethodologyAbbreviations:Belgium BE Ireland IE Austria ATBulgaria BG Italy IT Poland PLCzech Republic CZ Cyprus CY Portugal PTDenmark DK Latvia LV Romania ROGermany DE Lithuania LT Slovenia SIEstonia EE Luxembourg LU Slovak Republic SKGreece EL Hungary HU F<strong>in</strong>land FISpa<strong>in</strong> ES Malta MT Sweden SEFrance FR Ne<strong>the</strong>rlands NL United K<strong>in</strong>gdom UKEU<strong>European</strong> <strong>Union</strong>Fur<strong>the</strong>r <strong>in</strong>formation<strong>European</strong> Statistical Data Support:Contact details for this support network can be found on our Internet site:http://ec.europa.eu/eurostat/Data: Estat Website/Agriculture, forestry and fisheries/Agriculture/Agricultural products/Animal productionAgriculture, forestry and fisheriesAgricultureAgricultural products<strong>Poultry</strong> farm<strong>in</strong>gIf you wish to receive an exhaustive data extraction on monthly animal production <strong>statistics</strong> via e-mail, please send arequest to: Estat-Animal-Products@ec.europa.euManuscript completed on: 05.08.2008Data extracted on: 21.07.2008ISSN 1977-0340Catalogue number: KS-QA-08-031-EN-N© <strong>European</strong> Communities, 20086 31/2008 — Data <strong>in</strong> focus


