Lab 2 Spectrophotometric Measurement of Glucose - Employees ...
Lab 2 Spectrophotometric Measurement of Glucose - Employees ...
Lab 2 Spectrophotometric Measurement of Glucose - Employees ...

Create successful ePaper yourself
Turn your PDF publications into a flip-book with our unique Google optimized e-Paper software.
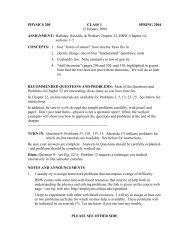
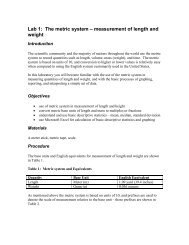
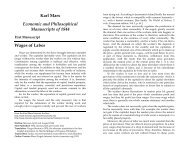
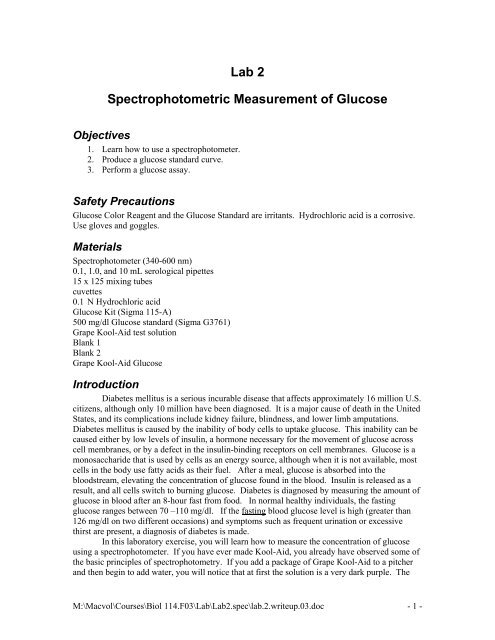
atio <strong>of</strong> Kool-Aid to water (the Kool-Aid’s concentration) is very high. As you add more water,the ratio <strong>of</strong> Kool-Aid to water decreases and the solution becomes lighter in color. Thus, theintensity <strong>of</strong> color is directly related to concentration <strong>of</strong> Kool-Aid. A spectrophotometer canmeasure the amount <strong>of</strong> light absorbed by a solution, and the quantity <strong>of</strong> light absorbed isproportional to the intensity <strong>of</strong> color or pigment in the solution.A second principle involved in spectrophotometery is that the amount <strong>of</strong> light absorbed isalso dependent on through how much <strong>of</strong> the solution the light must pass. If you pour the GrapeKool-Aid into a slender test tube and compare its color to Grape Kool-Aid poured into a drinkingglass, the Kool-Aid in the drinking glass will appear darker in color. This is because as lighttravels through the liquid more and more light is absorbed by the Kool-Aid and less light istransmitted.The spectrophotometer measures absorbance. Absorbance values, by themselves, do notdescribe the concentration <strong>of</strong> a substance. However, we can determine the concentration <strong>of</strong> asubstance in a solution using a standard curve. A standard curve translates absorbance valuesinto concentration. See Fig 2.1 for an example. We can construct a standard curve by makingsolutions with a known concentration <strong>of</strong> the substance we are measuring and then measuring theirabsorbance. Graphing the concentration on the x-axis and the absorbance on the y-axis, we cansee that there is a linear relationship between concentration and absorbance. Thus a standardcurve is not really a curve, but a straight line. Beers Law describes this linear relationship:A = εCLWhere A = absorbanceε = molar absorptivity <strong>of</strong> the substance (how much light it absorbs at thewavelength used)C = concentration (for clinical measurements, the concentration <strong>of</strong>ten used ismg/dl)L = pathlength (the length the light travels through the cuvette—remember theslim cuvette versus drinking glass)1.41.21Absorbance0.80.60.40.200 5 10 15 20 25 30Concentration (mg/dL)Fig 2-1. Example <strong>of</strong> standard curveUsing the standard curve, we can determine the concentration <strong>of</strong> other solutions, by locating theabsorbance <strong>of</strong> that solution on the y-axis and drawing a horizontal line to the standard curve line.Then you can draw a vertical line from that intersection to the x-axis to determine theconcentration.M:\Macvol\Courses\Biol 114.F03\<strong>Lab</strong>\<strong>Lab</strong>2.spec\lab.2.writeup.03.doc - 2 -
It is also possible to calculate the concentration if we know the slope <strong>of</strong> the standardcurve. In the equation for a straight line, y= mx +b, m is the slope <strong>of</strong> the line. The equation forBeer’s Law also describes a straight line with an intercept <strong>of</strong> zero. Absorbance is measured onthe y-axis, concentration on the x-axis and the value εL comprise the slope (m). An alternativeway to determine the concentration <strong>of</strong> a substance is to rearrange Beer’s Law, dividing theabsorbance <strong>of</strong> the solution by the slope <strong>of</strong> the standard curve:AC = ε LWe assume that the y-intercept is zero. In other words we are assuming that theabsorbance <strong>of</strong> a solution is zero when none <strong>of</strong> the substance we are measuring is present. Inreality, that is not always the case. If we are measuring the concentration <strong>of</strong> Grape Kool-Aid,other substances might be present that absorb light. If this occurred, our y-intercept would not bezero. Thus when we are using a spectrophotometer we need to calibrate it so that when none <strong>of</strong>the substance we are measuring is present, the absorbance that is measured is zero. We do this byusing a blank. A blank solution contains all the substances present in the solution except thesubstance to be measured. Before making measurements with the Spec 20, the blank ismeasured, and its absorbance value is set to zero. For example, if we are measuring theconcentration <strong>of</strong> Grape Kool-Aid, the blank should be made <strong>of</strong> water and sugar, the otherconstituents in the solution. By using a blank, if water or sugar absorbs light, that absorption willbe set to zero, and thus the y-intercept on our linear Beer’s Law equation would indeed be zero.Procedure<strong>Spectrophotometric</strong> Technique (See Fig 2-2)1. Plug in the spectrophotometer and turn it on by turning the left dial clockwise. Allow thespectrophotometer to warm up at least 5 minutes before proceeding.2. Set the wavelength dial to 600 nm. This is a wavelength <strong>of</strong> light that gets absorbedreadily by the pigment in the Grape Kool-Aid.3. With no vial in the spectrophotometer, the light path is closed. Therefore no light istransmitted, or in other words there is an infinite absorption. With the on/<strong>of</strong>f dial (leftdial) set the needle to read infinity (∞) on the absorbance scale.4. Now fill a cuvette (a small test tube that is 12 mm in diameter and 100 mm in length)with Blank 1. This solution should contain all the constituents except the substance to bemeasured. Since we are measuring Grape Kool-Aid, Blank 1 contains the otherconstituents, sugar and water, in the same proportion as are found in the Grape Kool-Aid.5. Insert the cuvette containing Blank 1 into the sample chamber. As you do the light pathwill be opened. This blank solution does not contain any Grape Kool-Aid, and so theabsorbance should be set to zero. Use the right knob to set the absorbance to zero.6. Next fill a cuvette with Grape Kool-Aid test solution. Insert it into the spectrophotometerand record its absorbance in question number one <strong>of</strong> your assignment.7. Next, fill a cuvette with Blank 2 solution and repeat steps 5 and 6. Is there a difference inthe measurements <strong>of</strong> the same solution? How can you explain it?M:\Macvol\Courses\Biol 114.F03\<strong>Lab</strong>\<strong>Lab</strong>2.spec\lab.2.writeup.03.doc - 3 -
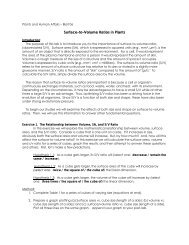
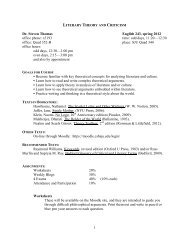
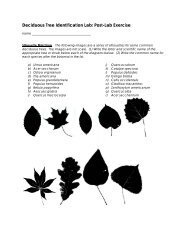
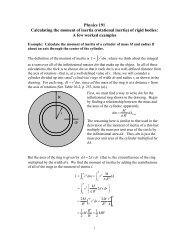
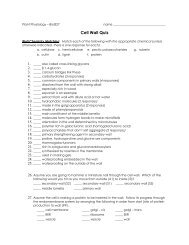
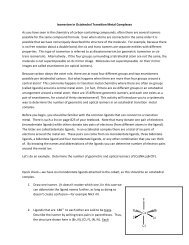
CEBDCABA. On/Off and Zero KnobB. Wavelength DialC. Sample compartmentD. Light control knobE. Mode ButtonDAFig. 2-2. Diagram <strong>of</strong> Spec 20 and Spec 20D Spectrophotometers<strong>Glucose</strong> AssayNow we will use the spectrophotometer to measure the concentration <strong>of</strong> glucose (sugar) in Kool-Aid. When you measured the absorbance <strong>of</strong> Kool-Aid, you made a direct measurement. TheKool-Aid was a colored product that the spectrophotometer could easily measure. In the glucoseassay we will use, you will not measure the concentration <strong>of</strong> glucose directly. Instead, you willmeasure the absorbance <strong>of</strong> colored product created when glucose reacts with the <strong>Glucose</strong> AssayReagent. The amount <strong>of</strong> colored substance is directly proportional to the amount <strong>of</strong> glucosepresent. You will create a standard curve that translates the absorbance <strong>of</strong> the colored substanceinto concentration <strong>of</strong> glucose and will use it to determine the amount <strong>of</strong> glucose in Kool-Aid.1. First you will make several dilutions <strong>of</strong> a glucose standard solution that has an initialconcentration <strong>of</strong> 500 mg/dl <strong>of</strong> glucose. See Fig. 2-3.a. <strong>Lab</strong>el three large mixing tubes A, B, C.b. Into each <strong>of</strong> the large mixing tubes, pipette 5 ml <strong>of</strong> deionized water.c. To mixing tube A, add 5 ml <strong>of</strong> glucose standard solution. Cover with Parafilmand mix well.d. Into mixing tube B, pipette 5 ml <strong>of</strong> standard dilution A. Cover with Parafilm andmix well.M:\Macvol\Courses\Biol 114.F03\<strong>Lab</strong>\<strong>Lab</strong>2.spec\lab.2.writeup.03.doc - 4 -
e. Into mixing tube C, pipette 5 ml <strong>of</strong> standard dilution B. Cover with Parafilm andmix well.<strong>Glucose</strong>StandardStandardDilution A StandardDilution BStandardDilution CFig. 2-3. Illustration <strong>of</strong> the dilutions made.2. Calculate the concentration <strong>of</strong> glucose in each tube using the following equation andrecord it in your assignment:V 1 C 1 = V 2 C 2Where V 1 = volume <strong>of</strong> the stock solutionC 1 = the concentration <strong>of</strong> the stock solutionV 2 = the final diluted volume (volume <strong>of</strong> stock solution and diluent)C 2 = the final diluted concentration.For example, we want to find the final diluted concentration (C 2 ) <strong>of</strong> Standard Dilution A.V 1 is the volume <strong>of</strong> the stock solution we are adding to Standard Dilution A. ThereforeV 1 is 5 ml or 0.5 dl. The concentration <strong>of</strong> the stock solution is 500 mg/dl; this is C 1 . V 2is the final diluted volume <strong>of</strong> Standard Dilution A. Since we are adding 5 ml <strong>of</strong> stocksolution to 5 ml <strong>of</strong> water, the final diluted volume <strong>of</strong> Standard Dilution A is 10 ml or 1 dl.Therefore, V 2 is 10 ml or 1 dl. Inserting these values into the formula, we see that:(0.5 dl)(500 mg/dl) = (1 dl) C 2C 2 = 250 mg/dlWhat is your stock solution for Standard Solution B? What about Standard Solution C?3. For the glucose assay, we will need seven more mixing tubes. One tube will be labeled“blank.” Three additional tubes will be used to test the different concentrations <strong>of</strong>glucose standard. These tubes can be labeled Standard A, Standard B, and Standard C.Finally, three more tubes will be used to test a sample <strong>of</strong> Kool-Aid that your instructor orTA will give you. Your instructor or TA will give each lab group a different Kool-Aidsample to assay. Make sure to record in your assignment, which Kool-Aid sample youwere assigned. You will test your Kool-Aid sample three times in three different tubes.When the same sample is tested more than one time, the individual tests <strong>of</strong> that sampleare called replicates. By testing the glucose concentration more than one time andaveraging the results, we will get a more accurate estimate <strong>of</strong> its true glucoseconcentration. For these replicates <strong>of</strong> your Kool-Aid sample, you can label the remainingmixing tubes Kool-Aid 1, Kool-Aid 2, and Kool-Aid 3.M:\Macvol\Courses\Biol 114.F03\<strong>Lab</strong>\<strong>Lab</strong>2.spec\lab.2.writeup.03.doc - 5 -
a. To each tube, add 1.0 ml <strong>of</strong> <strong>Glucose</strong> Assay Reagentb. Add 20 microliters (0.02 ml) <strong>of</strong> water to the Blank tube.c. Add 20 microliters (0.02 ml <strong>of</strong> the appropriate sample (Standard solutions A-Cand Kool-Aid solutions 1-3) to each tube.d. Mix by gently swirling the tubes.e. After 5-10 minutes, add 10 ml <strong>of</strong> 0.1N hydrochloric acid to each tube, and mix.f. Turn the wavelength dial to 520 nm.g. With nothing in the sample chamber, adjust the absorbance to ∞ using the leftknob.h. Pipette or pour the blank solution into a cuvette, until the cuvette is ¾ full. Insertthe cuvette into the spectrophotometer. Adjust the absorbance to zero using theright knob.i. Pipette or pour each <strong>of</strong> the sample solutions into cuvettes, until each cuvette is ¾full. Measure the absorbance <strong>of</strong> Standards A-C, and the Kool-Aid. Record eachabsorbance in your assignment. It is important to complete the measurementswithin 30 minutes after the addition <strong>of</strong> the hydrochloric acid.4. Construct a graph <strong>of</strong> standard curve using Micros<strong>of</strong>t Excel using the concentration andabsorbance <strong>of</strong> the blank, and standards A-C as data points. Include the equation for a lineon your graph if possible, since this will show you the slope <strong>of</strong> the curve.5. Examine your standard curve. If your pipetting has been accurate and precise, your datapoints should be very close to the standard curve line, and the line should go through theorigin. If the line does not go through the origin, you will have to redraw the lineensuring that it passes through the origin. The quality <strong>of</strong> your standard curve will directlyinfluence how accurately you can determine the concentration <strong>of</strong> glucose in Kool-Aid.6. Determine the concentration <strong>of</strong> glucose in each Kool-Aid sample either by calculating itor using the graph. To calculate it, divide its absorbance by the slope <strong>of</strong> the standardcurve. If you did not have to redraw the standard curve graph, you can find the slope <strong>of</strong>the standard curve in the equation <strong>of</strong> a line.7. Calculate the average glucose concentration in the Kool-Aid you assayed. How muchvariability is present in your measurement?Referenceshttp://www.cdc.gov/od/oc/media/fact/diabetes.htm [accessed 6/12/01]Center for Disease Control ,Office <strong>of</strong> Communications/Media Relations Diabetes Fact Sheethttp://www.awl.com.au/pharma/drugcalc.html [accessed 6/12/01] “Fundamentals <strong>of</strong>Pharmacology on-line.” Addison, Wesley, Longman.Sigma Technical Bulletin, Procedure No. 115. 1997. Sigma Diagnostics, St. Louis, MOM:\Macvol\Courses\Biol 114.F03\<strong>Lab</strong>\<strong>Lab</strong>2.spec\lab.2.writeup.03.doc - 6 -
Name______________________ <strong>Lab</strong> Section Day & Time_____<strong>Lab</strong> 2 Assignment<strong>Spectrophotometric</strong> Technique1. The absorbance <strong>of</strong> the test solution <strong>of</strong> Grape Kool-Aid was ___________________.2. After blanking with Blank 2, the absorbance <strong>of</strong> the test solution <strong>of</strong> Grape Kool-Aid was__________.Is there a difference between the two measurements <strong>of</strong> the same solution? If so, why?<strong>Glucose</strong> Assay3. Calculate the concentration <strong>of</strong> glucose in Standard Dilutions B and C. Show yourcalculations.4. Transcribe the concentrations you calculated for each standard solution into the tablebelow. Then record the absorbance <strong>of</strong> the standards and <strong>of</strong> the Kool-Aid in the glucoseassay.Solution <strong>Glucose</strong> Concentration AbsorbanceStandard AStandard BStandard CKool-Aid 1Kool-Aid 2Koolaid 3M:\Macvol\Courses\Biol 114.F03\<strong>Lab</strong>\<strong>Lab</strong>2.spec\lab.2.writeup.03.doc - 7 -
M:\Macvol\Courses\Biol 114.F03\<strong>Lab</strong>\<strong>Lab</strong>2.spec\lab.2.writeup.03.doc - 9 -