Abbott 2004 Global Citizenship Report - Abbott Laboratories
Abbott 2004 Global Citizenship Report - Abbott Laboratories
Abbott 2004 Global Citizenship Report - Abbott Laboratories

You also want an ePaper? Increase the reach of your titles
YUMPU automatically turns print PDFs into web optimized ePapers that Google loves.
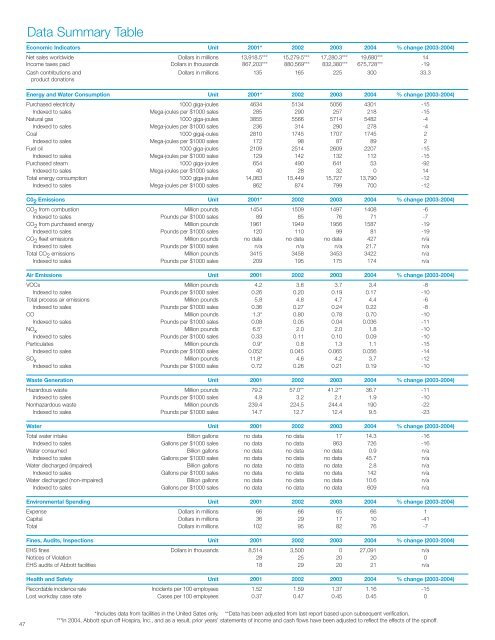
Data Summary TableEconomic Indicators Unit 2001* 2002 2003 <strong>2004</strong> % change (2003-<strong>2004</strong>)Net sales worldwide Dollars in millions 13,918.5*** 15,279.5*** 17,280.3*** 19,680*** 14Income taxes paid Dollars in thousands 867,203*** 880,569*** 832,380*** 675,728*** -19Cash contributions and Dollars in millions 135 165 225 300 33.3product donationsEnergy and Water Consumption Unit 2001* 2002 2003 <strong>2004</strong> % change (2003-<strong>2004</strong>)Purchased electricity 1000 giga-joules 4634 5134 5056 4301 -15Indexed to sales Mega-joules per $1000 sales 285 290 257 218 -15Natural gas 1000 giga-joules 3855 5566 5714 5482 -4Indexed to sales Mega-joules per $1000 sales 236 314 290 278 -4Coal 1000 gigaj-oules 2810 1745 1707 1745 2Indexed to sales Mega-joules per $1000 sales 172 98 87 89 2Fuel oil 1000 giga-joules 2109 2514 2609 2207 -15Indexed to sales Mega-joules per $1000 sales 129 142 132 112 -15Purchased steam 1000 giga-joules 654 490 641 53 -92Indexed to sales Mega-joules per $1000 sales 40 28 32 0 14Total energy consumption 1000 giga-joules 14,063 15,449 15,727 13,790 -12Indexed to sales Mega-joules per $1000 sales 862 874 799 700 -12C0 2 Emissions Unit 2001* 2002 2003 <strong>2004</strong> % change (2003-<strong>2004</strong>)CO 2 from combustion Million pounds 1454 1509 1497 1408 -6Indexed to sales Pounds per $1000 sales 89 85 76 71 -7CO 2 from purchased energy Million pounds 1961 1949 1956 1587 -19Indexed to sales Pounds per $1000 sales 120 110 99 81 -19CO 2 fleet emissions Million pounds no data no data no data 427 n/aIndexed to sales Pounds per $1000 sales n/a n/a n/a 21.7 n/aTotal CO 2 emissions Million pounds 3415 3458 3453 3422 n/aIndexed to sales Pounds per $1000 sales 209 195 175 174 n/aAir Emissions Unit 2001 2002 2003 <strong>2004</strong> % change (2003-<strong>2004</strong>)VOCs Million pounds 4.2 3.6 3.7 3.4 -8Indexed to sales Pounds per $1000 sales 0.26 0.20 0.19 0.17 -10Total process air emissions Million pounds 5.8 4.8 4.7 4.4 -6Indexed to sales Pounds per $1000 sales 0.36 0.27 0.24 0.22 -8CO Million pounds 1.3* 0.80 0.78 0.70 -10Indexed to sales Pounds per $1000 sales 0.08 0.05 0.04 0.036 -11NO x Million pounds 6.5* 2.0 2.0 1.8 -10Indexed to sales Pounds per $1000 sales 0.33 0.11 0.10 0.09 -10Particulates Million pounds 0.9* 0.8 1.3 1.1 -15Indexed to sales Pounds per $1000 sales 0.052 0.045 0.065 0.056 -14SO x Million pounds 11.8* 4.6 4.2 3.7 -12Indexed to sales Pounds per $1000 sales 0.72 0.26 0.21 0.19 -10Waste Generation Unit 2001 2002 2003 <strong>2004</strong> % change (2003-<strong>2004</strong>)Hazardous waste Million pounds 79.2 57.0** 41.2** 36.7 -11Indexed to sales Pounds per $1000 sales 4.9 3.2 2.1 1.9 -10Nonhazardous waste Million pounds 239.4 224.5 244.4 190 -22Indexed to sales Pounds per $1000 sales 14.7 12.7 12.4 9.5 -23Water Unit 2001 2002 2003 <strong>2004</strong> % change (2003-<strong>2004</strong>)Total water intake Billion gallons no data no data 17 14.3 -16Indexed to sales Gallons per $1000 sales no data no data 863 726 -16Water consumed Billion gallons no data no data no data 0.9 n/aIndexed to sales Gallons per $1000 sales no data no data no data 45.7 n/aWater discharged (impaired) Billion gallons no data no data no data 2.8 n/aIndexed to sales Gallons per $1000 sales no data no data no data 142 n/aWater discharged (non-impaired) Billion gallons no data no data no data 10.6 n/aIndexed to sales Gallons per $1000 sales no data no data no data 609 n/aEnvironmental Spending Unit 2001 2002 2003 <strong>2004</strong> % change (2003-<strong>2004</strong>)Expense Dollars in millions 66 66 65 66 1Capital Dollars in millions 36 29 17 10 -41Total Dollars in millions 102 95 82 76 -7Fines, Audits, Inspections Unit 2001 2002 2003 <strong>2004</strong> % change (2003-<strong>2004</strong>)EHS fines Dollars in thousands 8,514 3,500 0 27,091 n/aNotices of Violation 28 25 20 20 0EHS audits of <strong>Abbott</strong> facilities 18 29 20 21 n/aHealth and Safety Unit 2001 2002 2003 <strong>2004</strong> % change (2003-<strong>2004</strong>)Recordable incidence rate Incidents per 100 employees 1.52 1.59 1.37 1.16 -15Lost workday case rate Cases per 100 employees 0.37 0.47 0.45 0.45 047*Includes data from facilities in the United Sates only. **Data has been adjusted from last report based upon subsequent verification.***In <strong>2004</strong>, <strong>Abbott</strong> spun off Hospira, Inc., and as a result, prior years’ statements of income and cash flows have been adjusted to reflect the effects of the spinoff.