Energy_Statistics_2013
Energy_Statistics_2013
Energy_Statistics_2013

Create successful ePaper yourself
Turn your PDF publications into a flip-book with our unique Google optimized e-Paper software.
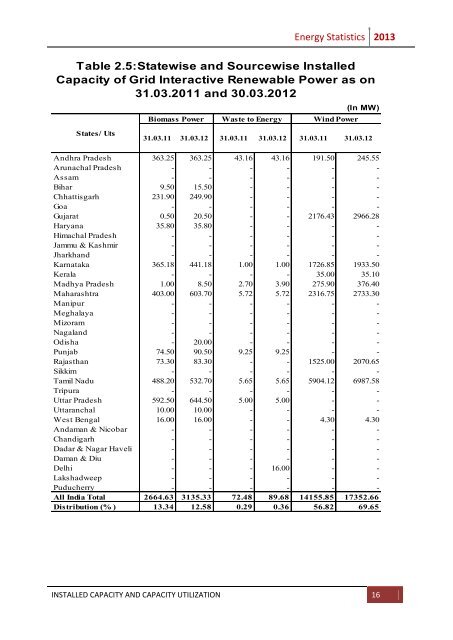
<strong>Energy</strong> <strong>Statistics</strong> <strong>2013</strong>Table 2.5:Statewise and Sourcewise InstalledCapacity of Grid Interactive Renewable Power as on31.03.2011 and 30.03.2012Biomass Power Waste to <strong>Energy</strong> Wind Power(In MW)States/ Uts31.03.11 31.03.12 31.03.11 31.03.12 31.03.11 31.03.12Andhra Pradesh 363.25 363.25 43.16 43.16 191.50 245.55Arunachal Pradesh - - - - - -Assam - - - - - -Bihar 9.50 15.50 - - - -Chhattisgarh 231.90 249.90 - - - -Goa - - - - - -Gujarat 0.50 20.50 - - 2176.43 2966.28Haryana 35.80 35.80 - - - -Himachal Pradesh - - - - - -Jammu & Kashmir - - - - - -Jharkhand - - - - - -Karnataka 365.18 441.18 1.00 1.00 1726.85 1933.50Kerala - - - - 35.00 35.10Madhya Pradesh 1.00 8.50 2.70 3.90 275.90 376.40Maharashtra 403.00 603.70 5.72 5.72 2316.75 2733.30Manipur - - - - - -Meghalaya - - - - - -Mizoram - - - - - -Nagaland - - - - - -Odisha - 20.00 - - - -Punjab 74.50 90.50 9.25 9.25 - -Rajasthan 73.30 83.30 - - 1525.00 2070.65Sikkim - - - - - -Tamil Nadu 488.20 532.70 5.65 5.65 5904.12 6987.58Tripura - - - - - -Uttar Pradesh 592.50 644.50 5.00 5.00 - -Uttaranchal 10.00 10.00 - - - -West Bengal 16.00 16.00 - - 4.30 4.30Andaman & Nicobar - - - - - -Chandigarh - - - - - -Dadar & Nagar Haveli - - - - - -Daman & Diu - - - - - -Delhi - - - 16.00 - -Lakshadweep - - - - - -Puducherry - - - - - -All India Total 2664.63 3135.33 72.48 89.68 14155.85 17352.66Distribution (% ) 13.34 12.58 0.29 0.36 56.82 69.65INSTALLED CAPACITY AND CAPACITY UTILIZATION 16