Energy_Statistics_2013
Energy_Statistics_2013
Energy_Statistics_2013

You also want an ePaper? Increase the reach of your titles
YUMPU automatically turns print PDFs into web optimized ePapers that Google loves.
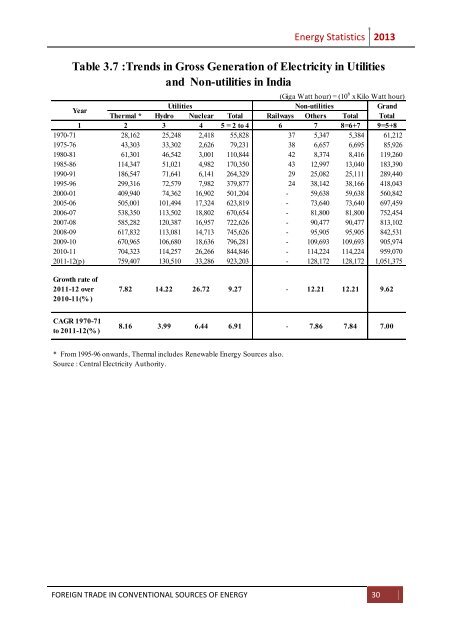
<strong>Energy</strong> <strong>Statistics</strong> <strong>2013</strong>Table 3.7 :Trends in Gross Generation of Electricity in Utilitiesand Non-utilities in India(Giga Watt hour) = (10 6 x Kilo Watt hour)YearUtilitiesNon-utilitiesGrandThermal * Hydro Nuclear Total Railways Others Total Total1 2 3 4 5 = 2 to 4 6 7 8=6+7 9=5+81970-71 28,162 25,248 2,418 55,828 37 5,347 5,384 61,2121975-76 43,303 33,302 2,626 79,231 38 6,657 6,695 85,9261980-81 61,301 46,542 3,001 110,844 42 8,374 8,416 119,2601985-86 114,347 51,021 4,982 170,350 43 12,997 13,040 183,3901990-91 186,547 71,641 6,141 264,329 29 25,082 25,111 289,4401995-96 299,316 72,579 7,982 379,877 24 38,142 38,166 418,0432000-01 409,940 74,362 16,902 501,204 - 59,638 59,638 560,8422005-06 505,001 101,494 17,324 623,819 - 73,640 73,640 697,4592006-07 538,350 113,502 18,802 670,654 - 81,800 81,800 752,4542007-08 585,282 120,387 16,957 722,626 - 90,477 90,477 813,1022008-09 617,832 113,081 14,713 745,626 - 95,905 95,905 842,5312009-10 670,965 106,680 18,636 796,281 - 109,693 109,693 905,9742010-11 704,323 114,257 26,266 844,846 - 114,224 114,224 959,0702011-12(p) 759,407 130,510 33,286 923,203 - 128,172 128,172 1,051,375Growth rate of2011-12 over2010-11(% )7.82 14.22 26.72 9.27 - 12.21 12.21 9.62CAGR 1970-71to 2011-12(% )8.16 3.99 6.44 6.91 - 7.86 7.84 7.00* From 1995-96 onwards, Thermal includes Renewable <strong>Energy</strong> Sources also.Source : Central Electricity Authority.FOREIGN TRADE IN CONVENTIONAL SOURCES OF ENERGY 30