Energy_Statistics_2013
Energy_Statistics_2013
Energy_Statistics_2013

Create successful ePaper yourself
Turn your PDF publications into a flip-book with our unique Google optimized e-Paper software.
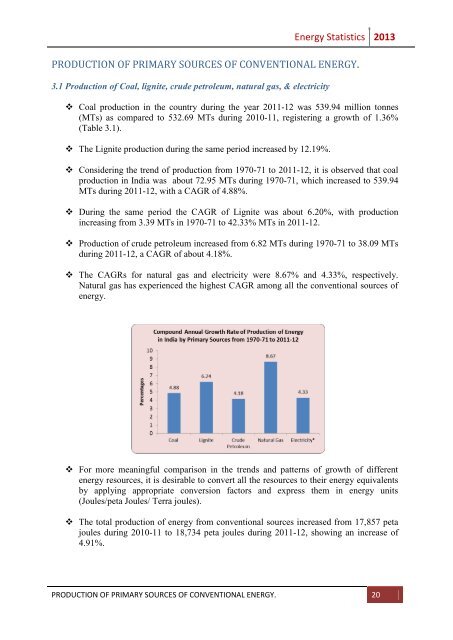
<strong>Energy</strong> <strong>Statistics</strong> <strong>2013</strong>PRODUCTION OF PRIMARY SOURCES OF CONVENTIONAL ENERGY.3.1 Production of Coal, lignite, crude petroleum, natural gas, & electricity Coal production in the country during the year 2011-12 was 539.94 million tonnes(MTs) as compared to 532.69 MTs during 2010-11, registering a growth of 1.36%(Table 3.1). The Lignite production during the same period increased by 12.19%. Considering the trend of production from 1970-71 to 2011-12, it is observed that coalproduction in India was about 72.95 MTs during 1970-71, which increased to 539.94MTs during 2011-12, with a CAGR of 4.88%. During the same period the CAGR of Lignite was about 6.20%, with productionincreasing from 3.39 MTs in 1970-71 to 42.33% MTs in 2011-12. Production of crude petroleum increased from 6.82 MTs during 1970-71 to 38.09 MTsduring 2011-12, a CAGR of about 4.18%. The CAGRs for natural gas and electricity were 8.67% and 4.33%, respectively.Natural gas has experienced the highest CAGR among all the conventional sources ofenergy. For more meaningful comparison in the trends and patterns of growth of differentenergy resources, it is desirable to convert all the resources to their energy equivalentsby applying appropriate conversion factors and express them in energy units(Joules/peta Joules/ Terra joules). The total production of energy from conventional sources increased from 17,857 petajoules during 2010-11 to 18,734 peta joules during 2011-12, showing an increase of4.91%.PRODUCTION OF PRIMARY SOURCES OF CONVENTIONAL ENERGY. 20