Energy_Statistics_2013
Energy_Statistics_2013
Energy_Statistics_2013
You also want an ePaper? Increase the reach of your titles
YUMPU automatically turns print PDFs into web optimized ePapers that Google loves.
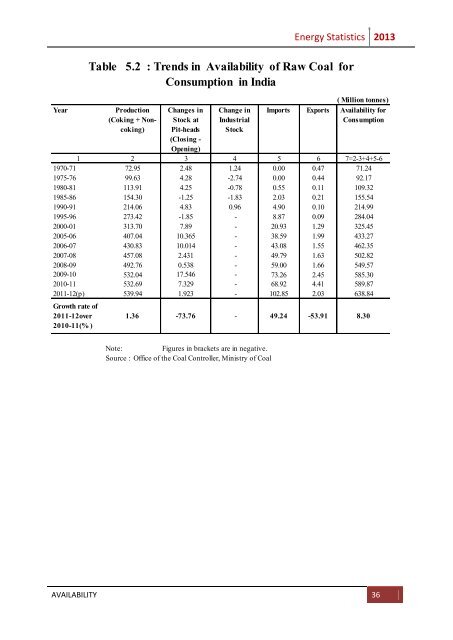
YearProduction(Coking + Noncoking)Changes inStock atPit-heads(Closing -Opening)Change inIndustrialStock<strong>Energy</strong> <strong>Statistics</strong> <strong>2013</strong>( Million tonnes)Imports Exports Availability forConsumption1 2 3 4 5 6 7=2-3+4+5-61970-71 72.95 2.48 1.24 0.00 0.47 71.241975-76 99.63 4.28 -2.74 0.00 0.44 92.171980-81 113.91 4.25 -0.78 0.55 0.11 109.321985-86 154.30 -1.25 -1.83 2.03 0.21 155.541990-91 214.06 4.83 0.96 4.90 0.10 214.991995-96 273.42 -1.85 - 8.87 0.09 284.042000-01 313.70 7.89 - 20.93 1.29 325.452005-06 407.04 10.365 - 38.59 1.99 433.272006-07 430.83 10.014 - 43.08 1.55 462.352007-08 457.08 2.431 - 49.79 1.63 502.822008-09 492.76 0.538 - 59.00 1.66 549.572009-10 532.04 17.546 - 73.26 2.45 585.302010-11 532.69 7.329 - 68.92 4.41 589.872011-12(p) 539.94 1.923 - 102.85 2.03 638.84Growth rate of2011-12over2010-11(% )Table 5.2 : Trends in Availability of Raw Coal forConsumption in India1.36 -73.76 - 49.24 -53.91 8.30Note:Figures in brackets are in negative.Source : Office of the Coal Controller, Ministry of CoalAVAILABILITY 36


