Q-Mode and R-Mode Factor Analysis in Quantitative Studies of ...
Q-Mode and R-Mode Factor Analysis in Quantitative Studies of ...
Q-Mode and R-Mode Factor Analysis in Quantitative Studies of ...

Create successful ePaper yourself
Turn your PDF publications into a flip-book with our unique Google optimized e-Paper software.
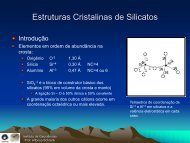
Q-<strong>Mode</strong> And R-<strong>Mode</strong> <strong>Factor</strong> <strong>Analysis</strong> In <strong>Quantitative</strong> <strong>Studies</strong> Of Micr<strong>of</strong>ossilsTERRÆ 7(1-2):41-49, 2010Table 2 – PC-01 Q-mode factor scores<strong>Factor</strong> 1 <strong>Factor</strong> 2C. pelagicus 0,27847 -0,88416G. oceanica 2,28384 -0,66537C. leptoporus -0,44095 0,00033C. murrayi -0,37657 -0,38970C. cristatus -0,53419 -0,24565H. carteri var.carteri 0,55436 -1,28724H. carteri var.hyal<strong>in</strong>a -0,66931 0,40111H. carteri var.wallichii -1,36503 0,98580R. clavigera -0,22248 0,31391P. lacunosa -0,38871 -0,48826F. pr<strong>of</strong>unda 1,40932 2,52329Pontosphaera spp. -0,52875 -0,26405Table 3 – PC-01 R-mode factors <strong>and</strong> their eigenvalues,variance <strong>and</strong> cumulative variance<strong>Factor</strong> Eigenvalue Variance (%)3.2. SAN-76 (planktonic foram<strong>in</strong>ifera based)3.2.1. Q-mode factor analysisCumulativeVariance1 3,272724 27,27270 27,27272 1,915284 15,96070 43,23343 1,424801 11,87334 55,10674 1,346172 11,21810 66,32495 1,031411 8,59509 74,91996 0,832165 6,93471 81,8547Among 34 extracted factors, only two <strong>of</strong> themwere reta<strong>in</strong>ed for further paleoenvironmental<strong>in</strong>terpretation. <strong>Factor</strong> 1 alone expla<strong>in</strong>ed 93.72%<strong>of</strong> the total variance <strong>of</strong> the planktonic foram<strong>in</strong>iferadata set, while factor 2 responded for 3.61%(Table 4). The results <strong>of</strong> Q-mode factor analysisare given by figures 5 <strong>and</strong> 6. The later correlatesfactor load<strong>in</strong>gs, oxygen isotopic data <strong>and</strong> biozonesY <strong>and</strong> Z throughout SAN-76. <strong>Factor</strong> 1 <strong>and</strong> factor2 contributions (factor scores) to each foram<strong>in</strong>iferaspecies is demonstrated <strong>in</strong> figure 7 (histograms),outst<strong>and</strong> values were referred <strong>in</strong> figure 5 (Globiger<strong>in</strong>babulloides, Globiger<strong>in</strong>oides ruber, Globiger<strong>in</strong>itaglut<strong>in</strong>ata <strong>and</strong> Globorotalia <strong>in</strong>flata).Key: C.pel, Coccolithus pelagicus; G.ocn, Gephyrocapsa oceanica;C.lept, Calcidiscus leptoporus; C.murr, Calciosolenia murray; C.crist,Ceratolithus cristatus; H.cart cart, Helicosphaera carteri carteri; H.carthyal, Helicosphaera carteri hyal<strong>in</strong>a; H.cart wall, Helicosphaera carteriwallichi; R.clav, Rhabdosphaera clavigera; P.lacun, Pseudoemilianialacunosa; F.pr<strong>of</strong>, Florisphaera pr<strong>of</strong>unda <strong>and</strong> Pontos.spp, Pontosphaeraspp.Figure 3 – PC-01 Q-mode factor 1 <strong>and</strong> 2 histograms<strong>in</strong>dicat<strong>in</strong>g factor scores <strong>of</strong> the taxa analysedreta<strong>in</strong>ed factor were used for factors <strong>in</strong>terpretations<strong>and</strong> labels. Figure 4 illustrates factor scores<strong>of</strong> each factor throughout the core with planktonicforam<strong>in</strong>ifera zones Y2, Y1 <strong>and</strong> Z <strong>in</strong>dicated.Table 4 – SAN-76 Q-mode factors <strong>and</strong> their eigenvalues,variance <strong>and</strong> cumulative variance<strong>Factor</strong> Eigenvalue Variance (%)CumulativeVariance1 40,29992 93,72074 93,72072 1,55204 3,60940 97,33013 0,45800 1,06511 98,39523.2.2. R-mode factor analysisEleven factors were reta<strong>in</strong>ed from 35 extracted.They accounted for 76.08% <strong>of</strong> the total variance<strong>of</strong> the planktonic foram<strong>in</strong>ifera data set (Table 5).Figure 8 reported factors <strong>in</strong>fluence throughoutthe core (factor scores), plotted together withplanktonic foram<strong>in</strong>ifera zones Y <strong>and</strong> Z <strong>and</strong> oxygenisotopic data.44a5_t7.<strong>in</strong>dd 44 27/01/2011 11:28:01
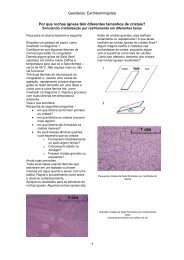
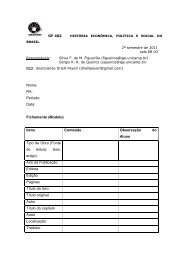
TERRÆ 7(1-2):41-49, 2010Hirama, M. V., Toledo, F. A. de L., Junior, E. C., Costa, K. B., Quadros, J. P. deFigure 4 – PC-01 R-mode factor 1, 2, 3 <strong>and</strong> 4 scores <strong>and</strong> planktonicforam<strong>in</strong>ifera determ<strong>in</strong>ed zones Z (<strong>in</strong>terglacial), Y1 <strong>and</strong> Y2 (glacial)4. Discussion4.1. Q-mode PC-01Accord<strong>in</strong>g to factor load<strong>in</strong>gs most <strong>of</strong> the PC-01sediment samples were strongly <strong>in</strong>fluenced byfactor 1 (Figure 1), however 17 samples were <strong>in</strong>agreement with factor 2: 5 cm, 25 to 85 cm, 115cm, 125 cm, 145 cm, 165 cm, 205 cm, 225 cm <strong>and</strong>465 to 485 cm. As reported <strong>in</strong> figure 1 higher factorscore for factor 1 was related to G. oceanica (2.28)while F. pr<strong>of</strong>unda (2.52) associated to factor 2. Thesevalues <strong>in</strong>dicate factor 1 had <strong>in</strong>fluenced G. oceanicatemporal distribution along PC-01 <strong>and</strong> factor 2controlled F. pr<strong>of</strong>unda. G. oceanica tend to be veryabundant <strong>in</strong> nutrient-rich waters (Br<strong>and</strong>, 1994),this species exhibits preference for neritic environmentsby reduc<strong>in</strong>g its abundance with depth.At the same time F. pr<strong>of</strong>unda is known as a pelagicdeep-liv<strong>in</strong>g species <strong>in</strong>creas<strong>in</strong>g its abundance<strong>in</strong> proportion to water depth (Okada, 1992).The nutrient availability is controlled bythe depth <strong>of</strong> the nutricl<strong>in</strong>e, which can bemonitored by the abundance <strong>of</strong> F. pr<strong>of</strong>unda(Molf<strong>in</strong>o & McIntyre, 1990; K<strong>in</strong>kel et al.,2000). Tak<strong>in</strong>g these ecological preferences<strong>in</strong>to account, factor 1 was <strong>in</strong>terpreted assurface water productivity whereas factor2 was labeled as nutricl<strong>in</strong>e depth variation.In accordance with figure 2 surface waterproductivity (factor 1) was more prom<strong>in</strong>entdur<strong>in</strong>g glacial <strong>in</strong>terval (biozone Y2 <strong>and</strong> Y1).Conversely, through <strong>in</strong>terglacial <strong>in</strong>terval(biozone Z) nutricl<strong>in</strong>e depth (factor 2)seems to display a significant role.Figure 5 – SAN-76 Q-mode factor 1 <strong>and</strong> 2 correlation. Plots representsamples <strong>and</strong> species numerical data refer to Table 9454.2. Q-mode SAN-76Expla<strong>in</strong><strong>in</strong>g 97.33% <strong>of</strong> the total variance,the two factors considered <strong>in</strong> thisanalysis are represented <strong>in</strong> figure 5.Follow<strong>in</strong>g PC-01 pattern the majority<strong>of</strong> SAN-76 samples are characterizedby the dom<strong>in</strong>ant factor 1, but ten <strong>of</strong>them are <strong>in</strong>fluenced by the secondfactor: 241 cm, 342 cm, 353 cm, 364cm, 403 cm, 408 cm, 412 cm, 416 cm<strong>and</strong> 419 cm, which are clustered alongglacial <strong>in</strong>terval (biozone Y) (Figure 6).Regardless <strong>of</strong> its dom<strong>in</strong>ance throughoutthe core, factor 1 has shown itsgreatest values dur<strong>in</strong>g <strong>in</strong>terglacial<strong>in</strong>terval (biozone Z). Accord<strong>in</strong>g to factorscontribution (factor scores) on each species itis possible to verify that G. ruber was chiefly <strong>in</strong>fluencedby factor 1 followed by G. glut<strong>in</strong>ata, whilstG. bulloides <strong>and</strong> G. <strong>in</strong>flata (m<strong>in</strong>or) were addressed t<strong>of</strong>actor 2 (Figure 7). Thus, as the former two speciesare abundant <strong>in</strong> the ocean mixed layer (Fairbanks etal. 1982; Ravelo et al., 1990; Andreasen & Ravelo,1997), we <strong>in</strong>terpreted factor 1 as mixed layer. Onthe other h<strong>and</strong> G. bulloides <strong>and</strong> G. <strong>in</strong>flata are morecommon <strong>in</strong> cold <strong>and</strong> productive waters (Hemlebenet al., 1989; Hilbretch, 1996; Toledo, 2000).Therefore, factor 2 can be designed as surfacetemperature or productivity, which is consistentwith glacial conditions.4.3. R-mode PC-01The first factor extracted by this analysis wasstrongly associated to Coccolithus pelagicus (negativea5_t7.<strong>in</strong>dd 45 27/01/2011 11:28:02
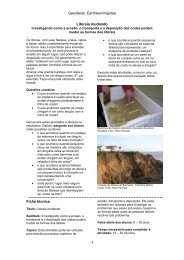
TERRÆ 7(1-2):41-49, 2010Hirama, M. V., Toledo, F. A. de L., Junior, E. C., Costa, K. B., Quadros, J. P. dedepths dur<strong>in</strong>g their reproduction period <strong>in</strong> w<strong>in</strong>ter,when the vertical density gradient is reduced. G.ruber (p<strong>in</strong>k) <strong>and</strong> G. <strong>in</strong>flata were also associated t<strong>of</strong>actor 3 to stratified waters (Hilbrecht, op.cit.). Asa consequence <strong>of</strong> G. truncatul<strong>in</strong>oides <strong>and</strong> G. <strong>in</strong>flatatolerance to little variation <strong>in</strong> sal<strong>in</strong>ity, factor 3 canbe related to sal<strong>in</strong>ity as well. Both forms <strong>of</strong> Globiger<strong>in</strong>oidessacculifer, which have a preference for themixed layer (Fairbanks et al. 1982; Ravelo et al.,1990; Andreasen e Ravelo, 1997), were the greatestcontribution to factor 5. Thus it was <strong>in</strong>terpreted asmixed layer factor. F<strong>in</strong>ally, factor 9 was regarded astemperature <strong>in</strong>fluenced because <strong>of</strong> warm speciesG. menardii tumida <strong>and</strong> G. menardii flexuosa relationship(Hemleben et al., 1989). When taken factorscores <strong>in</strong>to account along with biostratigraphiczones Y <strong>and</strong> Z <strong>and</strong> oxygen isotopic data (Figure 8)thermocl<strong>in</strong>e (factor 1) seems to go along with theoxygen trend. Thermocl<strong>in</strong>e factor behaviour followedthe temperate water conditions (factor 2)<strong>in</strong> the course <strong>of</strong> biozone Y. The factor <strong>in</strong>terpretedas stratification or sal<strong>in</strong>ity variation (factor 3) presentedan opposite tendency to factor 4 (l<strong>in</strong>ked toGlobiger<strong>in</strong>ella digitata <strong>and</strong> Hastiger<strong>in</strong>a digitata). Frombase-core to about 20,000 years ago (biozone Y)mixed layer control (factor 5) seems to mirror factor6 (Turborotalia qu<strong>in</strong>queloba <strong>and</strong> Globoturborotalitatenella), from then on, the two curves appearedco<strong>in</strong>cident. There were not comparative patternsobserved among the other factors.Figure 7 – SAN-76 Q-mode factor 1 <strong>and</strong> 2 histograms<strong>in</strong>dicat<strong>in</strong>g factor scores <strong>of</strong> the taxa analysed5. Conclusionthe application <strong>of</strong> Q- <strong>and</strong> R-mode factor analysisto micr<strong>of</strong>ossil compositional data sets was usefulto reconstruct the most prom<strong>in</strong>ent environmentalparameters <strong>in</strong>herent to planktonic foram<strong>in</strong>ifera orcalcareous nann<strong>of</strong>ossils fluctuations <strong>in</strong> the past.Greater correlation coefficients (0.9 to average)confers more reliability to the Q-mode techniquecompared to the R-mode for which only a third <strong>of</strong>the correlation coefficients were higher than 0.3.Additionally, the amount <strong>of</strong> R-mode statisticallysignificant factors was larger. This is consistentwith natural conditions where several parametersact simultaneously <strong>in</strong> a given community. However,<strong>in</strong>terpretations <strong>of</strong> these factors could be ahard task s<strong>in</strong>ce factors correlate to species whoseecological preferences are unclear or unknown. Areduced amount <strong>of</strong> reta<strong>in</strong>ed factors <strong>of</strong> Q-modeshow a relationship with the most abundant species,yield<strong>in</strong>g easier <strong>in</strong>terpretation parameters.Compar<strong>in</strong>g the application <strong>of</strong> both techniqueson calcareous nann<strong>of</strong>ossils <strong>and</strong> planktonicforam<strong>in</strong>ifera it was possible to recognize some similaritiesamong factors. The significance <strong>of</strong> PC-01factor 1 <strong>and</strong> SAN-76 factor 2 Q-mode results areanalogous <strong>and</strong> related to the same time <strong>in</strong>terval:glacial period <strong>in</strong>fluenced by surface water productivity.Along these l<strong>in</strong>es PC-01 factor 2 (nutricl<strong>in</strong>e/thermocl<strong>in</strong>e) <strong>and</strong> SAN-76 factor 1 (mixed layer)<strong>in</strong>dicates the control <strong>of</strong> water stratification dur<strong>in</strong>gthe <strong>in</strong>terglacial.Temperature-related R-mode factors (PC-01factor 1; SAN-76 factor 2 <strong>and</strong> 9) attend to the samebiota response although any temporal connectioncould be found. In this way PC-01 factor 2 <strong>and</strong>SAN-76 factor 1 <strong>and</strong> 5 l<strong>in</strong>ked to water stratification.These factors showed oscillat<strong>in</strong>g curves throughoutthe cores, but could be associated to majorrelevance <strong>in</strong> biozone Y. F<strong>in</strong>ally PC-01 factor 4 <strong>and</strong>SAN-76 factor 3 should be considered <strong>in</strong>dicat<strong>in</strong>gequivalent conditions s<strong>in</strong>ce they dwell on productivity<strong>in</strong>ductions (lower vertical gradient) or sal<strong>in</strong>ityissues for both groups <strong>of</strong> organisms.The lack <strong>of</strong> correspondence between Q-modereta<strong>in</strong>ed factor <strong>and</strong> those from R-mode approach47a5_t7.<strong>in</strong>dd 47 27/01/2011 11:28:06
Q-<strong>Mode</strong> And R-<strong>Mode</strong> <strong>Factor</strong> <strong>Analysis</strong> In <strong>Quantitative</strong> <strong>Studies</strong> Of Micr<strong>of</strong>ossilsTERRÆ 7(1-2):41-49, 2010can be expla<strong>in</strong>ed by their different function. Once<strong>in</strong>terested <strong>in</strong> along time samples <strong>in</strong>ter-relationshipsQ-mode technique should be chosen, however, ifspecies <strong>in</strong>ter-relationship is enquired, then R-modewould be more appropriate.We believe that as long as we are <strong>in</strong>terested <strong>in</strong>improv<strong>in</strong>g paleoceanographic <strong>in</strong>ferences based onmar<strong>in</strong>e micropaleontological quantitative data sets,Q-mode factor analysis is recommended. Q-modetemporal elucidation, its higher reliability regard<strong>in</strong>gcorrelation coefficients <strong>and</strong> its f<strong>in</strong>est <strong>in</strong>terpretableresults are some advantages po<strong>in</strong>ted out over theR-mode technique.The complete data set from statistical analysisare available at: http://lapas-io.blogspot.com/2010/10/tabelas-do-artigo-hirama-et-al-2010.html6. AcknowledgmentsWe would like to express our thanks to MariaGomez Pivel for helpful discussions on earlierversion <strong>of</strong> this manuscript. This study was f<strong>in</strong>anciallysupported by FAPESP (Fundação de Amparoà Pesquisa do Estado de São Paulo), process04/02819-8. We thank Petrobras for provid<strong>in</strong>g thesamples. This is Laboratório de Paleoceanografia doAtlântico Sul (LaPAS) contribution number 13.Figure 8 – SAN-76 R-mode factors 1 to 11 scores, oxygenisotopic curve <strong>and</strong> planktonic foram<strong>in</strong>ifera determ<strong>in</strong>edzones Z (<strong>in</strong>terglacial) <strong>and</strong> Y (glacial)7. ReferencesAndreasen, D.J. & Ravelo, A.C. 1997. Tropical PacificOcean thermocl<strong>in</strong>e depth reconstructions forthe last glacial maximum. Paleoceanography, 12(3): 395-413.Andruleit, H., Rogalla, U. & Stäger, S. 2004. Fromliv<strong>in</strong>g communities to fossil assemblages: orig<strong>in</strong><strong>and</strong> fate <strong>of</strong> coccolithophores <strong>in</strong> the northernArabian Sea. Micropaleontology, 50 (1), 5-21.Bown, P.R. & Young, J.R. 1998. Techniques. In: P.R.Bown (Ed.). Calcareous Nann<strong>of</strong>ossil Biostratigraphy.Kluwer Academic Publishers. p. 16-28.Bradley, R.S. 1999. Mar<strong>in</strong>e sediments <strong>and</strong> corals. In:R.S. BRADLEY. Paleoclimatology – reconstruct<strong>in</strong>gclimates <strong>of</strong> the Quaternary. Burl<strong>in</strong>gton: ElsevierAcademic Press. p.191-283.Br<strong>and</strong>, L.E. 1994. Physiological ecology <strong>of</strong> mar<strong>in</strong>ecoccolithophores. In: A. W<strong>in</strong>ter & W. Siesser(eds.). Coccolithophores. Cambridge: CambridgeUniversity Press, p. 39-49.48a5_t7.<strong>in</strong>dd 48 27/01/2011 11:28:07
TERRÆ 7(1-2):41-49, 2010Hirama, M. V., Toledo, F. A. de L., Junior, E. C., Costa, K. B., Quadros, J. P. deBuccheri, G., Capretto, G., Di Donato, V., Esposito,P., Ferruzza, G., Pescatore, T., Ermolli, E. R.,Senatore, M. R., Sprovieri, M., Bertoldo, M.,Carella, D. & Madonia, G. 2002. A high resolutionrecordo f the last deglaciation <strong>in</strong> the southernTyrrhenian Sea: environmental <strong>and</strong> climaticevolution. Mar<strong>in</strong>e Geology, 186:447-470.Buccianti, A. & Esposito, P. 2004. Insights <strong>in</strong>toLate Quaternary calcareous nannoplanktonassemblages under the theory <strong>of</strong> statisticalanalysis for compositional data. Palaeogeography,Palaeoclimatology, Palaeoecology, 202:209-227.CLIMAP. 1981. Seasonal Reconstructions <strong>of</strong> theEarth’s Surface at the Last Glacial Maximum.Geological Society <strong>of</strong> America Map <strong>and</strong> Chart Series,MC-36: 1-18.Fairbanks, R.G.; Sverdlove, M.; Free, R.; Wiebe,P.H.; & Be, A.W.H. 1982. Vertical distribution<strong>and</strong> isotopic fractionation <strong>of</strong> liv<strong>in</strong>g planktonicforam<strong>in</strong>ifera from the Panama Bas<strong>in</strong>. Nature,298: 841-844.Figueiredo, N. M. S. 1996. <strong>Mode</strong>rnização, distribuiçãoda renda e pobreza na agricultura brasileira 1975,1980 e 1995. Piracicaba: Escola Sup. Agric. “Luizde Queirós”, Univ. de São Paulo. 248p. (TeseDout.).Gouvêa, M. A. 2003. Análise fatorial. Nível pósgraduação.São Paulo: Fac. Economia eAdm<strong>in</strong>istração, Universidade de São Paulo.Gupta, B.K.S. 1999. <strong>Mode</strong>rn Foram<strong>in</strong>ifera. KlüwerAcademic Publishers. 372p.Harman, H. H. 1976. <strong>Mode</strong>rn factor analysis. Chicago:Univ. <strong>of</strong> Chicago Press.Heleben, C., Sp<strong>in</strong>der, M. & Eerson, O.R. 1989.<strong>Mode</strong>rn Planktonic Foram<strong>in</strong>ifera. Spr<strong>in</strong>ger-Verlag,Berl<strong>in</strong>.Hilbrecht, H. 1996. Extant planktic foram<strong>in</strong>ifera <strong>and</strong> thephysical environment <strong>in</strong> the Atlantic <strong>and</strong> Indian Oceans.Mitteilungen aus dem Geologisschen Institutder Eidgen. Zürich, Technischen Hochschuleund der Universität Zürich, Neue Folge. n.3000, 93 p.K<strong>in</strong>kel, H., Baumann, K.-H. & Cepek, M. 2000.Coccolithophores <strong>in</strong> the equatorial AtlanticOcean: response to seasonal <strong>and</strong> Late Quaternarysurface water variability. Mar<strong>in</strong>e Micropaleontology,39:87-112.Kucera, M. 2003. Numerical approach to micr<strong>of</strong>ossilproxy data. Lecture notes for Summer SchoolPaleoceanography: theory <strong>and</strong> field evidence. IAMCGeomare 2003, pp.66-90.Molf<strong>in</strong>o, B. & McIntyre, A. 1990. PrecessionalForc<strong>in</strong>g <strong>of</strong> Nutricl<strong>in</strong>e Dynamics <strong>in</strong> the EquatorialAtlantic. Science, 249:766-769.Okada, H. 1992. Biogeographic control <strong>of</strong> modernnann<strong>of</strong>ossil assemblages <strong>in</strong> surface sediments <strong>of</strong>Ise Bay, Mikawa Bay e Kumano-Nada, <strong>of</strong>f coast<strong>of</strong> central Japan. Memorie di Scienze Geologiche,43:431-449.Okada, H. & Honjo, S. 1973. The distribution <strong>of</strong>oceanic coccolithophorids <strong>in</strong> the Pacific. Deep-Sea Research, 20:355-374.Ravelo, A.C., Fairbanks, R.G. & Phil<strong>and</strong>er, S.G. 1990.Reconstruct<strong>in</strong>g tropical Atlantic hydrographyus<strong>in</strong>g planktonic foram<strong>in</strong>ifera <strong>and</strong> an oceanmodel. Paleoceanography, 5(3):409-431.Roth, P. 1994. Distribution <strong>of</strong> coccoliths <strong>in</strong> oceanicsediments. In: A. W<strong>in</strong>ter & W. Siesser (eds.).Coccolithophores. Cambridge: Cambridge Univ.Press. p. 199-218.Schmidt, D. A., Renaud, S., Bollmann, J., Schiebel,R. & Thierste<strong>in</strong>, H. R. 2003. Size distribution<strong>of</strong> Holocene planktic foram<strong>in</strong>ifer assemblages:biogeography, ecology <strong>and</strong> adaptation. Mar<strong>in</strong>eMicropaleonology, 956:1-20.Toledo, F.A.L. 2000. Variações Paleoceanográficas nosúltimos 30.000 anos no oeste do Atlântico Sul: isótoposde oxigênio, assembléias de foram<strong>in</strong>íferos planctônicose nan<strong>of</strong>ósseis calcários. Porto Alegre: Inst. Geoc.Universidade Federal do Rio Gr<strong>and</strong>e do Sul.245p. (Tese Dout.)Toledo, F.A.L., Cachão, M., Costa, K.B. & Pivel,M.A.G. 2007. Planktonic foram<strong>in</strong>ifera, calcareousnannoplankton <strong>and</strong> ascidian variations dur<strong>in</strong>g the last 25kyr <strong>in</strong> the Southwestern Atlantic: a paleoproductivitysignature? Mar<strong>in</strong>e Micropaleontology, doi: 10.1016/j.marmicro.2007.03.001.Toledo, F.A.L., Ayup-Zoua<strong>in</strong>, R.N. & Costa, K.C. 1999.Análise fatorial (modo-Q) em estudos quantitativosde nan<strong>of</strong>ósseis calcários do Quaternário superiorem um testemunho da Bacia de Campos, RJ-Brasil.Pesquisas, 26(2):62-72.49a5_t7.<strong>in</strong>dd 49 27/01/2011 11:28:08