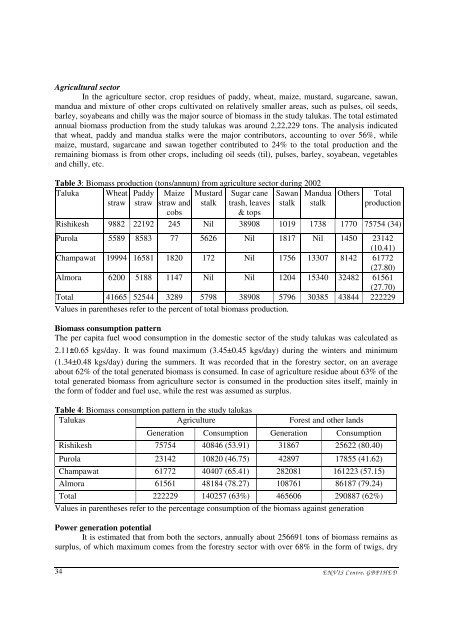
Agricultural sectorIn the agriculture sector, crop residues of paddy, wheat, maize, mustard, sugarcane, sawan,mandua and mixture of other crops cultivated <strong>on</strong> relatively smaller areas, such as pulses, oil seeds,barley, soyabeans and chilly was the major source of biomass in the study talukas. The total estimatedannual biomass producti<strong>on</strong> from the study talukas was around 2,22,229 t<strong>on</strong>s. The analysis indicatedthat wheat, paddy and mandua stalks were the major c<strong>on</strong>tributors, accounting to over 56%, whilemaize, mustard, sugarcane and sawan together c<strong>on</strong>tributed to 24% to the total producti<strong>on</strong> and theremaining biomass is from other crops, including oil seeds (til), pulses, barley, soyabean, vegetablesand chilly, etc.Table 3: Biomass producti<strong>on</strong> (t<strong>on</strong>s/annum) from agriculture sector during 2002Taluka Wheat Paddy Maize Mustard Sugar cane Sawan Manduastraw straw straw andcobsstalk trash, leaves& topsstalk stalkOthersTotalproducti<strong>on</strong>Rishikesh 9882 22192 245 Nil 38908 1019 1738 1770 75754 (34)Purola 5589 8583 77 5626 Nil 1817 Nil 1450 23142(10.41)Champawat 19994 16581 1820 172 Nil 1756 13307 8142 61772(27.80)Almora 6200 5188 1147 Nil Nil 1204 15340 32482 61561(27.70)Total 41665 52544 3289 5798 38908 5796 30385 43844 222229Values in parentheses refer to the percent of total biomass producti<strong>on</strong>.Biomass c<strong>on</strong>sumpti<strong>on</strong> patternThe per capita fuel wood c<strong>on</strong>sumpti<strong>on</strong> in the domestic sector of the study talukas was calculated as2.11±0.65 kgs/day. It was found maximum (3.45±0.45 kgs/day) during the winters and minimum(1.34±0.48 kgs/day) during the summers. It was recorded that in the forestry sector, <strong>on</strong> an averageabout 62% of the total generated biomass is c<strong>on</strong>sumed. In case of agriculture residue about 63% of thetotal generated biomass from agriculture sector is c<strong>on</strong>sumed in the producti<strong>on</strong> sites itself, mainly inthe form of fodder and fuel use, while the rest was assumed as surplus.Table 4: Biomass c<strong>on</strong>sumpti<strong>on</strong> pattern in the study talukasTalukasAgricultureForest and other landsGenerati<strong>on</strong> C<strong>on</strong>sumpti<strong>on</strong> Generati<strong>on</strong> C<strong>on</strong>sumpti<strong>on</strong>Rishikesh 75754 40846 (53.91) 31867 25622 (80.40)Purola 23142 10820 (46.75) 42897 17855 (41.62)Champawat 61772 40407 (65.41) 282081 161223 (57.15)Almora 61561 48184 (78.27) 108761 86187 (79.24)Total 222229 140257 (63%) 465606 290887 (62%)Values in parentheses refer to the percentage c<strong>on</strong>sumpti<strong>on</strong> of the biomass against generati<strong>on</strong>Power generati<strong>on</strong> potentialIt is estimated that from both the sectors, annually about 256691 t<strong>on</strong>s of biomass remains assurplus, of which maximum comes from the forestry sector with over 68% in the form of twigs, dry34E N V IS C entre, G B P IH E D
anches, roots and wood chips etc. Due to limited area under agriculture, biomass producti<strong>on</strong> as wellas surplus in this sector is very low, which accounts remaining 32% to the total surplus biomass,generated mainly in the form of stalks, husk, cobs, etc.Using the formula worked out by MNES, it was calculated that at a collecti<strong>on</strong> efficiency ofabout 75%, annually about 14.65 MW of electricity could be generated from the overall surplusbiomass <strong>on</strong> sustainable basis in the study talukas.Table 5: Power generati<strong>on</strong> potential from surplus biomassTalukaSurplus biomass (t<strong>on</strong>s)Total surplus(t<strong>on</strong>s)Annual power generati<strong>on</strong>potential (MW)Agriculture ForestryRishikesh 34908 (42.58) 6245 (3.57) 41553 2.37 (16.18)Purola 12322 (15.03) 25042 (14.34) 37364 2.13 (14.55)Champawat 21365 (26.06) 120858 (69.17) 142223 8.11 (55.40)Almora 13377 (16.32) 22574 (12.92) 35951 2.05 (14.00)Total 81972 174719 256691 14.65Values in parentheses refer percentage of the total generati<strong>on</strong>DISCUSSIONThe situati<strong>on</strong> of rural electrificati<strong>on</strong> in the country remains to be more challenging than eversince of about 80,000 villages in the country that are yet to be electrified, about 18,000 are in remoteand inaccessible areas (IEA, 2002). These villages remain difficult to be electrified in thec<strong>on</strong>venti<strong>on</strong>al manner by extending the grid because of difficult locati<strong>on</strong>s such as forests, islands,deserts and hilly areas. To provide electrify to such villages, Ministry of N<strong>on</strong>-c<strong>on</strong>venti<strong>on</strong>al EnergySources (MNES), in its Draft Renewable Energy Policy 2000 document (MNES, 2002) has decided touse renewable energy technologies as potential alternatives to meet the energy demand in the ruralareas of the country. Accordingly, Tenth Five Year Plan (2002-2007) has set a target of electrifyingabout 5000, out of 18000 un-electrified villages in the country by the year 2012, using mainly SolarPhotovoltaics (PV), Biomass and Small Hydro Power technologies (GoI, 2001).Though, it is stated that Uttranchal is a power surplus state in the sense that even currentlevels of generati<strong>on</strong> are in excess of demand, the fact remains that the rural electrificati<strong>on</strong> figurespaint a grim picture since about 3287 villages in the state are yet to be electrified(http://powermin.nic.in/uttaranchal.htm). Irregular and insufficient power supply in the electrifiedvillages worsens the situati<strong>on</strong> of power in the state. Such a situati<strong>on</strong> calls for promoting the renewablesources of energy in the rural areas, especially those, which are difficult to c<strong>on</strong>nect to the grid due toinaccessible terrain and lack of basic infrastructure. Viability of grid based village electrificati<strong>on</strong>decreases with increasing distance from the approach road and altitude. With its rich forest resources,Uttaranchal, therefore has huge opportunities for electrificati<strong>on</strong> through gasificati<strong>on</strong>, a comparativelycheaper, easily accessible and durable technology.The present study has estimated a total producti<strong>on</strong> of about 14.65 MW of electricity from thesurplus biomass in the study talukas. These results are indicative of the potential of electrifying therural areas in the state, especially those, which are extremely tough to approach due to physical andother natural barriers. For example, the Champawat taluka in the present study has <strong>on</strong> <strong>on</strong>e hand hasmaximum number of un-electrified villages, while <strong>on</strong> the other also has the highest potential of powergenerati<strong>on</strong>, mainly because of relatively large extent of the forest land.Such an attempt needs to be backed up by instituti<strong>on</strong>alizing the whole process of collecti<strong>on</strong> ofsurplus biomass to the maximum extent possible and capacity building of the rural mass to use thetechnology to produce electricity at local level (TERI, 2003). We attempted to explore theE N V IS B ulletin : H im alayan E cology 12(2), 2004 35
- Page 6 and 7: after year (Gosh, 1984). In North E
- Page 8 and 9: Future thrustThe followings are the
- Page 10 and 11: Table 1: State wise area and produc
- Page 12 and 13: Table 2: Performance of tomato vari
- Page 14 and 15: durable, about 5-6 times costlier,
- Page 16 and 17: IS GOAT FARMING A THREAT TO ECOLOGY
- Page 18 and 19: Bank officers’ viewAll the bank o
- Page 20: FOREST FRAGMENTATION : A THREAT TO
- Page 23 and 24: (ii)(iii)(iv)Area insensitive speci
- Page 25 and 26: ability to nest in the matrix area
- Page 27 and 28: Management actionsLand management e
- Page 29 and 30: Laurance, W. F and Bierregaard, Jr.
- Page 31 and 32: Sample surveyThe present study is b
- Page 33: Agricultural sectorBiomass from agr
- Page 37 and 38: GoI, 2001. Report of the Working Gr
- Page 39 and 40: over use and misuse of forests but
- Page 41 and 42: has ensured their survival in extre
- Page 43 and 44: Kar, A. 2004. Common wild vegetable
- Page 45 and 46: test sites at Shimla and Nahan usin
- Page 47 and 48: performance for drought tolerance)
- Page 49 and 50: een assigned to different preceding
- Page 51 and 52: of Himalayan Environment and Develo
- Page 53 and 54: (2%). Total protein content varied
- Page 55 and 56: wheat flour slurry) and 'Malera' (p
- Page 57 and 58: Uniyal, V.P. 2004. Butterflies of N
- Page 59 and 60: N ew s & V iew sNumber of leopards
- Page 61 and 62: also discourage them intake thes dr
- Page 63 and 64: and fauna, Sikkim is redited with h
- Page 65 and 66: i{kksa ij v/;;u fd, tk pqds gSA Hkw
- Page 67 and 68: laLFkku caxykSj esa izksQslj fouksn
- Page 69 and 70: aa/kku dh ikjEifjd iztkfr;ksa ds la
- Page 71 and 72: aaQwyksyksaa dh ?kkVh% % ,d izLrkfo
- Page 73: dVku dks viuh ewlyknkj tM+ksa ds dk