Annual Meeting - SCEC.org
Annual Meeting - SCEC.org
Annual Meeting - SCEC.org

Create successful ePaper yourself
Turn your PDF publications into a flip-book with our unique Google optimized e-Paper software.
38˚<br />
36˚<br />
34˚<br />
32˚<br />
38˚<br />
36˚<br />
34˚<br />
32˚<br />
freed<br />
2nd invariant (nanostrain/yr)<br />
1 10 100 1000<br />
harvard<br />
2011<br />
2nd invariant (nanostrain/yr)<br />
1 10 100 1000<br />
shen<br />
2nd invariant (nanostrain/yr)<br />
1 10 100 1000<br />
bird<br />
Southern California Earthquake Center<br />
<strong>Annual</strong> <strong>Meeting</strong><br />
2nd invariant (nanostrain/yr)<br />
1 10 100 1000<br />
holt<br />
2nd invariant (nanostrain/yr)<br />
1 10 100 1000<br />
UCERF2<br />
−120˚ −118˚ −116˚ −114˚ −120˚ −118˚ −116˚ −114˚ −120˚ −118˚ −116˚ −114˚<br />
Proceedings and Abstracts, Volume XXI<br />
September 11-14, 2011<br />
S C E C<br />
an NSF+USGS center
Center Organization<br />
<strong>SCEC</strong>3 ORGANIZATION<br />
Center Director, Tom Jordan<br />
Deputy Director, Greg Beroza<br />
Associate Director for Administration, John McRaney<br />
Associate Director for Communication, Education, &<br />
Outreach, Mark Benthien<br />
Associate Director for Information Technology,<br />
Phil Maechling<br />
Special Projects & Events Coordinator, Tran Huynh<br />
Research Contracts & Grants Coordinator, Karen Young<br />
Administrative Coordinator, Deborah Gormley<br />
Education Programs Manager, Robert de Groot<br />
Digital Products Manager, John Marquis<br />
Research Programmers, Scott Callaghan, Sandarsh Kumar,<br />
Maria Liukis, Kevin Milner, Patrick Small<br />
Systems Administrator, John Yu<br />
<strong>SCEC</strong>3 PLANNING COMMITTEE<br />
Chair, Greg Beroza<br />
Seismology, Egill Hauksson, Elizabeth Cochran<br />
Tectonic Geodesy, Jessica Murray-Moraleda, Rowena<br />
Lohman<br />
Earthquake Geology, Mike Oskin, James Dolan<br />
Unified Structural Representation, John Shaw, Kim Olsen<br />
Fault and Rupture Mechanics, Judith Chester, Ruth Harris<br />
Crustal Deformation Modeling, Liz Hearn, Kaj Johnson<br />
Lithospheric Architecture & Dynamics, Paul Davis,<br />
Thorsten Becker<br />
Earthquake Forecasting & Predictability, Terry Tullis,<br />
Jeanne Hardebeck<br />
Ground Motion Prediction, Brad Aagaard, Rob Graves<br />
Seismic Hazard & Risk Analysis, Paul Somerville, Nico<br />
Luco<br />
Southern San Andreas Fault Evaluation, Tom Rockwell,<br />
Kate Scharer<br />
Working Group on California Earthquake Probabilities,<br />
Ned Field<br />
Collaboratory for the Study of Earthquake Predictability,<br />
Tom Jordan, Danijel Schorlemmer<br />
Extreme Ground Motion, Tom Hanks<br />
Community Modeling Environment, Phil Maechling<br />
ii | Southern California Earthquake Center<br />
<strong>SCEC</strong>3 ADVISORY COUNCIL<br />
Jeffrey Freymueller, Chair, U. Alaska<br />
Gail Atkinson, U. Western Ontario<br />
Roger Bilham, U. of Colorado<br />
Donna Eberhart-Phillips, UC Davis<br />
John Filson, U.S. Geological Survey (Emeritus)<br />
Jim Goltz, CalEMA<br />
Bob Lillie, Oregon State University (new member 2011)<br />
Anne Meltzer, Lehigh University<br />
Dennis Mileti, U. Colorado (Emeritus)<br />
M. Meghan Miller, UNAVCO<br />
Farzad Naeim, John A. Martin & Associates<br />
John Vidale, U. Washington<br />
Andrew Whittaker, U. Buffalo<br />
<strong>SCEC</strong>3 BOARD OF DIRECTORS<br />
Tom Jordan, Chair, USC<br />
Lisa Grant-Ludwig, Vice-Chair, UCI (At-Large Member)<br />
Ralph Archuleta, UCSB<br />
Peter Bird, UCLA<br />
David Bowman, CSUF (At-Large Member)<br />
Tom Brocher, USGS Menlo Park<br />
Emily Brodsky, UCSC<br />
Glenn Biasi, UNR<br />
Steve Day, SDSU<br />
James Dieterich, UCR<br />
Yuri Fialko, UCSD<br />
Tom Herring, MIT<br />
Ken Hudnut, USGS Pasadena<br />
Nadia Lapusta, CalTech<br />
Jim Rice, Harvard<br />
Paul Segall, Stanford<br />
Bruce Shaw, Columbia<br />
Jill McCarthy, USGS Golden<br />
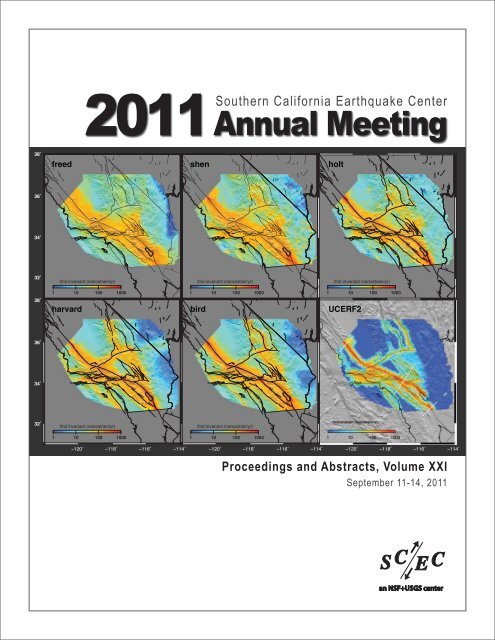
Cover Image: Southern California deviatoric strain rate fields generated by five models compared against earthquake<br />
probabilities from the Uniform California Earthquake Rupture Forecast, Version 2 (UCERF2). Geodetic surface deformation<br />
data will be incorporated in the next generation California earthquake hazard assessment (UCERF3). [Figure from David<br />
Sandwell (UCSD) with contributions from the UCERF3/GPS Technical Activity Group.]
Table of Contents<br />
Table of Contents<br />
<strong>SCEC</strong> ANNUAL MEETING PROGRAM ............................................................................................................................... 1<br />
Sunday, September 11 th ............................................................................................................................................... 1<br />
Monday, September 12 th .............................................................................................................................................. 5<br />
Tuesday, September 13 th .............................................................................................................................................. 8<br />
Wednesday, September 14 th ...................................................................................................................................... 12<br />
STATE OF <strong>SCEC</strong>, 2011 ..................................................................................................................................................... 14<br />
REPORT OF THE ADVISORY COUNCIL .......................................................................................................................... 22<br />
<strong>SCEC</strong> COMMUNICATION, EDUCATION, AND OUTREACH ........................................................................................... 32<br />
RESEARCH ACCOMPLISHMENTS .................................................................................................................................. 40<br />
Disciplinary Activities ............................................................................................................................................... 40<br />
Seismology ........................................................................................................................................................... 40<br />
Tectonic Geodesy .................................................................................................................................................. 43<br />
Earthquake Geology ............................................................................................................................................. 49<br />
Disciplinary Activities ............................................................................................................................................... 52<br />
Unified Structural Representation ...................................................................................................................... 52<br />
Fault and Rupture Mechanics ............................................................................................................................. 56<br />
Crustal Deformation Modeling ........................................................................................................................... 68<br />
Lithospheric Architecture and Dynamics ............................................................................................................ 75<br />
Earthquake Forecasting and Predictability .......................................................................................................... 78<br />
Ground-Motion Prediction .................................................................................................................................. 81<br />
Seismic Hazard and Risk Analysis ...................................................................................................................... 86<br />
Special Projects ............................................................................................................................................................ 89<br />
Southern San Andreas Fault Evaluation ............................................................................................................ 89<br />
Working Group on California Earthquake Probabilities ..................................................................................... 91<br />
Collaboratory for the Study of Earthquake Predictability ................................................................................... 92<br />
Community Modeling Environment ................................................................................................................... 95<br />
DRAFT 2012 SCIENCE PLAN ......................................................................................................................................... 101<br />
I. Preamble ................................................................................................................................................................. 101<br />
II. Guidelines for Proposal Submission ................................................................................................................. 101<br />
III. <strong>SCEC</strong> Organization ............................................................................................................................................ 103<br />
IV. Proposal Categories ........................................................................................................................................... 103<br />
V. Evaluation Process and Criteria ........................................................................................................................ 104<br />
VI. Coordination of Research between <strong>SCEC</strong> and USGS-EHRP ....................................................................... 105<br />
VII. <strong>SCEC</strong>4 Fundamental Problems of Earthquake Physics: Research Priorities and Requirements .......... 106<br />
VIII. Disciplinary Activities ..................................................................................................................................... 108<br />
A. Seismology .................................................................................................................................................... 109<br />
B. Tectonic Geodesy ........................................................................................................................................... 109<br />
C. Earthquake Geology ...................................................................................................................................... 110<br />
2011 <strong>SCEC</strong> <strong>Annual</strong> <strong>Meeting</strong> | iii
Table of Contents<br />
D. Computational Science ................................................................................................................................. 111<br />
IX. Interdisciplinary Focus Areas ........................................................................................................................... 113<br />
A. Unified Structural Representation (USR) .................................................................................................... 113<br />
B. Fault and Rupture Mechanics (FARM) ....................................................................................................... 113<br />
C. Stress and Deformation Over Time (SDOT) ................................................................................................ 114<br />
D. Earthquake Forecasting and Predictability (EFP) ........................................................................................ 115<br />
E. Ground-Motion Prediction (GMP) ............................................................................................................... 115<br />
F. Southern San Andreas Fault Evaluation (SoSAFE) ..................................................................................... 116<br />
G. Earthquake Engineering Implementation Interface (EEII) ........................................................................... 117<br />
X. Special Projects and Initiatives ........................................................................................................................... 118<br />
A. Working Group on California Earthquake Probabilities (WGCEP) ............................................................ 118<br />
B. Collaboratory for the Study of Earthquake Predictability (CSEP) ............................................................... 119<br />
C. Community Modeling Environment (CME) ................................................................................................ 120<br />
D. National Partnerships through EarthScope ................................................................................................. 121<br />
XI. <strong>SCEC</strong> Communication, Education, and Outreach ......................................................................................... 121<br />
CEO Focus Area Objectives ......................................................................................................................... 121<br />
POSTER PRESENTATIONS: GROUP A ......................................................................................................................... 122<br />
Communication, Education, Outreach (CEO) ...................................................................................................... 122<br />
Community Modeling Environment (CME) ........................................................................................................ 123<br />
Earthquake Early Warning (EEW) ......................................................................................................................... 123<br />
Earthquake Geology / Southern San Andreas Fault Evaluaton (SoSAFE) ...................................................... 123<br />
Fault Rupture and Mechanics (FARM) ................................................................................................................. 125<br />
Tectonic Geodesy ...................................................................................................................................................... 127<br />
Undergraduate Studies in Earthquake Information Technology (USEIT) ........................................................ 129<br />
POSTER PRESENTATIONS: GROUP B ......................................................................................................................... 130<br />
Crustal Deformation Modeling (CDM) ................................................................................................................. 130<br />
Earthquake Forecasting & Predictability (EFP) .................................................................................................... 131<br />
Ground Motion Prediction (GMP) ......................................................................................................................... 132<br />
Lithospheric Architecture & Dynamics (LAD) .................................................................................................... 133<br />
Seismic Hazard & Risk Analysis (SHRA) ............................................................................................................. 133<br />
Seismology ................................................................................................................................................................. 134<br />
Unified Structural Representation (USR) .............................................................................................................. 137<br />
POSTER ABSTRACTS .................................................................................................................................................... 138<br />
MEETING PARTICIPANTS .............................................................................................................................................. 262<br />
iv | Southern California Earthquake Center
<strong>SCEC</strong> <strong>Annual</strong> <strong>Meeting</strong> Program<br />
Sunday, September 11th<br />
07:00 – 18:30 Registration Check-In (Hotel Lobby)<br />
07:00 – 08:00 Breakfast (Poolside)<br />
08:00 – 12:00 WORKSHOP: Source Inversion Validation<br />
Conveners: P. Martin Mai (KAUST), M<strong>org</strong>an Page (USGS), and Danijel Schorlemmer (USC/GFZ)<br />
Location: Palm Canyon Room<br />
SUNDAY | <strong>Meeting</strong> Program<br />
The 2011 Source Inversion Validation (SIV) workshop will focus on the inversion results for the first test inversion<br />
problem, which is based on a dynamic rupture for an M ~6.6 strike-slip earthquake, embedded in a layered media.<br />
Synthetics at 40 sites are to be used for the inversion, forward-prediction from the obtained model at additional 16 sites<br />
are required to help assess the quality and robustness of the solution. Additionally, we will discuss the modelers<br />
experience with the SIV-wiki and the newly created benchmarking site in order to streamline the dissemination of<br />
future exercises (data and descriptions) and the upload and automated analysis and comparison capacities of the online<br />
toolbox.<br />
We hope that many source-modeling teams will present their results and experience with the SIV exercise. However,<br />
general contributions on recent developments for source-inversion strategies are welcome as well. We also encourage<br />
presentations on finite-fault source studies for recent well-recorded earthquakes that highlight the challenges in<br />
kinematic rupture inversions.<br />
08:00 Introduction<br />
08:10 Recent Developments in the SIV Portal and Its Benchmarking Tools (M. Mai, KAUST)<br />
08:20 SIV Modeling Teams on Their Results for Exercise: in1_dip (15 minutes per group)<br />
09:20 Discussion: SIV Portal, Exercise inv1_dip, Future SIV Exercises<br />
10:00 Break<br />
10:15 Source Studeis of the Sept 2010 M 7.1 and Feb M 6.3 Earthquakes in New Zealand (GNS Researchers)<br />
10:45 High Frequency Aspects of Earthquake Rupture Imaged By Back-Projection of Seismic Array Data<br />
(J.-P. Ampuero, Caltech)<br />
11:15 Discussion: Back-Projection Constraints for Finite-Fault Inversion, New Data for SIV Exercises<br />
12:00 Adjourn<br />
08:00 – 12:00 WORKSHOP: El Mayor-Cucapah Science and Earthquake Response<br />
Conveners: Mike Oskin (UC Davis), Sinan Akciz (UC Irvine), and Ramon Arrowsmith (ASU)<br />
Location: Horizon Ballroom<br />
More than a year has passed after the M7.2 El Mayor Cucupah earthquake. The event provided a view of a major<br />
earthquake in Southern California and opportunities for new discoveries in earthquake science and for reflection on<br />
future earthquake response activities. The event also engendered important cross border scientific collaborations. Our<br />
goals for this workshop are to review the recent research results as well as to take away lessons for the next major<br />
Southern California earthquake. Strict time constraints for the presentations will be enforced with 10 minutes on<br />
science and 3 minutes on lessons for response.<br />
Introduction<br />
08:05 The 4 April 2010 El Mayor-Cucapah earthquake source, from initial glimpse to synoptic overview<br />
(K. Hudnut, USGS)<br />
Seismology<br />
08:20 The 4 April 2010 El Mayor - Seismological evidence and dynamic model of reverse rupture propagation<br />
during the 2010 M7.2 El Mayor Cucapah earthquake (L. Meng, Caltech)<br />
08:35 Seismic field response to the El Mayor - Cucapah earthquake (E. Cochran, USGS)<br />
2011 <strong>SCEC</strong> <strong>Annual</strong> <strong>Meeting</strong> | 1
<strong>Meeting</strong> Program | SUNDAY<br />
08:50 Spatial distribution of the 4 April, 2010 (Mw7.2) El Mayor-Cucapah seismic sequence using a local network<br />
(R. Castro, CICESE)<br />
GPS/InSAR Geodesy<br />
09:05 Postseismic deformation following the El Mayor-Cucapah earthquake from GPS and InSAR<br />
(A. Gonzalez, CICESE)<br />
09:20 Crustal deformation associated with the Mw7.2 2010 El Mayor-Cucapah earthquake from GPS geodesy<br />
(J. Spinler, Arizona)<br />
09:35 Satellite SAR geodetic imaging response and joint geodetic-teleseismic inversion for fault slip evolution<br />
models of the El Mayor-Cucapah earthquake (E. Fielding, JPL)<br />
09:50 Break<br />
LiDAR and UAVSAR<br />
10:00 Airborne lidar of the El Mayor-Cucapah surface rupture: Rapid fault mapping and discovery of hidden<br />
structures and distributed deformation (M. Oskin, UC Davis)<br />
10:15 Horizontal and vertical deformation induced by the 2010 El-Mayor-Cucapah earthquake, as observed from<br />
SPOT and LiDAR imagery using COSI-Corr (S. Leprince, Caltech)<br />
10:30 Assessment of coseismic slip variation from terrestrial LiDAR scans of the El Mayor-Cucapah surface<br />
rupture (P. Gold, UC Davis)<br />
10:45 UAVSAR Observations of the 2010 M 7.2 El Mayor-Cucapah Earthquake (A. Donnellan, JPL)<br />
Surface Rupture Mapping<br />
11:00 UAVSAR as an Aid to Fault Rupture Mapping in the Yuha Desert (J. Treiman, CGS)<br />
11:15 Structural Controls on the Surface Rupture Associated with the Mw7.2 El Mayor-Cucapah Earthquake of 4<br />
April 2010: A Comparative Analysis of Scarp Array Kinematics, Orientation, Lithology and Width (O.<br />
Teran, CICESE)<br />
11:30 Rupture Pattern of the 1892 Laguna Salada Earthquake: A precursor to 2010 El Mayor-Cucapah<br />
(K. Mueller, U Colorado)<br />
11:45 Discussion<br />
12:00 Adjourn<br />
12:00 – 13:00 Lunch (Poolside / Terrace)<br />
12:00 – 15:00 <strong>SCEC</strong> Board of Directors Lunch <strong>Meeting</strong> (Tapestry Room)<br />
13:00 – 17:00 <strong>SCEC</strong> CME Leadership <strong>Meeting</strong> (Oasis Room III)<br />
13:00 – 17:00 Teacher Workshop (Oasis Room II)<br />
13:00 – 17:00 WORKSHOP: Automating the Transient Detection Process<br />
Conveners: Rowena Lohman (Cornell) and Jessica Murray-Moraleda (USGS)<br />
Location: Palm Canyon Room<br />
The next phase of the Transient Detection effort within <strong>SCEC</strong> addresses the goal of implementing a geodetic transient<br />
detector by the end of <strong>SCEC</strong> III. In this workshop we will demonstrate the use of the CSEP-style infrastructure that can<br />
be used by Transient Detection participants once their code has been automated. Participants are encouraged to discuss<br />
any automated or retrospective algorithms that they've developed, as well as the results from these on the synthetic test<br />
data sets or on real geodetic data. Discussions will focus on the issues that face researchers who seek to automate their<br />
approaches, as well as the priorities for the next year.<br />
13:00 Introduction (R. Lohman, Cornell)<br />
13:30 Presentations on Individual Algorithms<br />
15:00 Break<br />
2 | Southern California Earthquake Center
15:15 Introduction to the Automatic Testing Facility and Example Algorithm and Codes<br />
SUNDAY | <strong>Meeting</strong> Program<br />
16:00 Discussion 1: Barriers in the Way of Implementing Codes, Suggestions for Changes to the Testing Facility<br />
16:30 Discussion 2: What are Our Priorities for the Next Several Years?<br />
17:00 Adjourn<br />
13:00 – 17:00 WORKSHOP: Southern San Andreas Fault Evaluation (SoSAFE)<br />
Conveners: Kate Scharer (USGS) and Ramon Arrowsmith (ASU)<br />
Location: Horizon Ballroom<br />
The primary goal of the Southern San Andreas Fault Evaluation (SoSAFE) project is to understand the timing of and<br />
slip due to earthquakes that occurred along the southern San Andreas and San Jacinto faults over the last 2000 years.<br />
This workshop will combine both individual presentations summarizing major SoSAFE research results and group<br />
discussion about the implications and use of these results. Discussions are designed to address field- and technologyrelated<br />
challenges in paleoseismology and slip rate studies, as well as wider discussion on the scope and priorities of<br />
SoSAFE in future years.<br />
13:00 Introduction<br />
13:15 Talk 1: Evidence from Parkfield Study: Implication of Extreme Events (N. Toke, Utah Valley)<br />
13:30 Group Discussion<br />
13:40 Talk 2: New Work on the San Jacinto (N. Onderdonk, CSULB)<br />
13:55 Group Discussion<br />
14:05 Talk 3: Long-Term Slip Rates on the San Jacinto (K. Blisniuk, UC Davis)<br />
14:20 Group Discussion<br />
14:30 Talk 4: Short-Term Slip Rates on the San Jacinto (J. Spinler, Arizona)<br />
14:45 Group Discussion<br />
14:55 Break<br />
15:10 Talk 5: Slip/Event Data Compilation: What Do We Know About the Slip History of the SAF System?<br />
(R. Arrowsmith, ASU and R. Weldon, Oregon)<br />
15:30 Group Discussion<br />
- Is the SAF/SJF system generally characteristic in slip at a point?<br />
- Are these faults really segmented?<br />
- What is the largest earthquake that can occur along the system based on the paleoseismic record?<br />
-What do geomorphic offsets represent, or more importantly, how we can use such data to develop rupture<br />
histories when it can be shown that not all earthquakes are clearly recorded as separate offsets.<br />
15:45 Talk 6: Earthquake Response Given Large Southern California Event – Background and Existing Plans:<br />
USGS (K. Hudnut), CGS Plans (J. Treiman), CalEMA (J. Goltz) - 15 minutes each<br />
16:30 Group Discussion<br />
- Given experience in recent earthquakes, what technologies should be adopted?<br />
- Should we assign areas or other coordination given likely limitations to internet access?<br />
-Coordination with other groups/agencies?<br />
16:45 Discussion and Feedback<br />
17:00 Adjourn<br />
- What are the priorities for SoSAFE for the next several years?<br />
- How shall we coordinate field review?<br />
13:00 – 17:00 Poster Set-Up: Group A (Plaza Ballroom)<br />
2011 <strong>SCEC</strong> <strong>Annual</strong> <strong>Meeting</strong> | 3
<strong>Meeting</strong> Program | SUNDAY<br />
17:00 – 18:00 SPECIAL INVITED TALK: The Great 2011 Tohoku, Japan Earthquake (Mw9.0) – An Unexpected Event<br />
Presenter: James Mori (DPRI, Kyoto University)<br />
Location: Horizon Ballroom<br />
On March 11, 2011, the northeast coast of Honshu experienced the largest historical earthquake for Japan (Mw9.0).<br />
Based on about 400 years of historical records that included 18 M7 to 8 earthquakes, there was thought to be fairly good<br />
knowledge of the expected sizes and locations of expected large events in the Tohoku region of Japan. So this event was a<br />
shocking surprise to the seismological community. The unprecedented size of the earthquake caused very large<br />
tsunamis that inundated coastal regions, which were probably among the best tsunami-prepared regions in the world.<br />
Tsunami heights of 15 to 30 meters topped sea walls that were typically about 10 meters high. The effects of the<br />
tsunami were amplified by large subsidence of much of the coastal areas by up to 2 meters. Most of the extensive<br />
damage (US$200 to 300 billion) and loss of lives (over 27,000) that occurred on the east coast of Honshu were due to<br />
the tsunami and not the strong shaking.<br />
There is a strong frequency dependence to the spatial distribution of the radiation of seismic waves. The largest slip and<br />
source of the long-period waves originate on the shallow portion of the thrust plane close to the Japan trench. In<br />
contrast, the short-period radiation has strong sources deeper on the fault plane to the west of the hypocenter.<br />
The mainshock has triggered other earthquake activity across Japan with increases in seismicity in many regions,<br />
including 13 volcanoes. There have been at least 8 crustal earthquakes in the M5.0 to M6.7 range outside of the<br />
immediate aftershock zone, which are apparently related to the Tohoku earthquake. These events are likely due to both<br />
static and dynamic stress changes caused by the mainshock.<br />
The society and infrastructure of Japan is struggling to recover from the widespread effects of this earthquake. Power<br />
shortages, nuclear power plant issues, and the large number of displaced people have caused severe problems for the<br />
country.<br />
18:00 – 20:00 <strong>SCEC</strong> <strong>Annual</strong> <strong>Meeting</strong> Welcome Dinner (Poolside / Terrace)<br />
18:30 – 20:30 <strong>SCEC</strong> Advisory Council Dinner <strong>Meeting</strong> (Tapestry Room)<br />
20:00 – 22:30 POSTER SESSION I: Group A (Plaza Ballroom)<br />
4 | Southern California Earthquake Center
Monday, September 12th<br />
07:00 – 08:00 Registration Check-In (Hotel Lobby)<br />
07:00 – 08:00 Breakfast<br />
08:00 – 10:30 PLENARY SESSION I: State of the <strong>SCEC</strong><br />
Location: Horizon Ballroom<br />
08:00 Welcome and State of the Center (T. Jordan, <strong>SCEC</strong>/USC)<br />
08:30 Report from NSF (J. Whitcomb, NSF)<br />
08:45 Report from USGS (M. Blanpied/E. Lemersal, USGS)<br />
09:00 Communication, Education, and Outreach Highlights (M. Benthien, <strong>SCEC</strong>/USC)<br />
09:30 <strong>SCEC</strong>3 Science Accomplishments (G. Beroza, Stanford)<br />
10:30 – 11:00 Break<br />
10:30 – 18:30 Registration Check-In (Hotel Lobby)<br />
MONDAY | <strong>Meeting</strong> Program<br />
11:00 – 13:00 PLENARY SESSION II: Science and Engineering Issues from Earthquake and Tsunami Hazards Along<br />
the California Coast<br />
Moderator: J. Baker (Stanford)<br />
Location: Horizon Ballroom<br />
11:00 Offshore Faulting and Associated Hazards Along the Southern California Coast (J. Shaw, Harvard)<br />
Over the past decade, <strong>SCEC</strong> researchers have contributed to a growing understanding of the complex systems of active<br />
faults that lie offshore along the southern California coast. In particular, acquisition and analysis of marine seismic<br />
reflection data has helped to identify and map a series of large strike- and oblique-slip faults, including the Newport-<br />
Inglewood-Rose Canyon, Palos Verdes, San Pedro Bay, San Diego Trough, San Clemente, Santa Catalina, and other<br />
systems. In addition, these data have been used to identify and describe a series of emergent and blind-thrust faults in<br />
the Santa Barbara Channel and Santa Monica Bay (e.g., Pitas Point, Channel islands, Anacapa-Dume) and in the<br />
Inner Borderlands (e.g., Oceanside, Thirtymile Bank, Carlsbad). The offshore thrust systems, in particular, may pose<br />
significant seismic hazards that have not yet been assessed comprehensively. Thrust faults generally represent large,<br />
moderately dipping surfaces that form large earthquake source areas capable of generating moderate to large (M≥7)<br />
earthquakes. Coseismic uplift patterns and accelerations, which are often most intense in the hanging walls of dip slip<br />
systems, could produce hazardous ground shaking along much of the southern California coastline. Many of these<br />
individual structures are aligned along strike with other thrust faults, such as the Channel Islands and Anacapa-Dume<br />
faults, and/or interact with strike-slip fault systems within the seismogenic crust. These cases present the possibility of<br />
larger (M 7.5 to 8+) and more complex multi-segment ruptures. Such events, while perhaps rare, would likely present<br />
extreme levels of ground shaking for coastal southern California, and may also cause seafloor displacements that<br />
generate tsunamis. Despite these potential hazards, there is much that we do not know about these fault systems that is<br />
necessary to properly characterize them. In particular, we lack definitive late Quaternary and Holocene slip rates, as<br />
well as displacements and ages of past earthquakes, on most of these systems.<br />
11:20 Seismic Hazards along the California Coast: Issues for California's Nuclear Power Plants<br />
(N. Abrahamson, PG&E)<br />
Following the 2011 Tohoku earthquake, there has been increased concern with the seismic safety of the California's<br />
nuclear power plants located along the California coast. At low probability levels important for critical structures, the<br />
seismic hazard along the central and southern California coast is dominated by a system of strike-slip faults located 0-<br />
10 km offshore and by thrust faults located both onshore and offshore within 10 km of the coastline.<br />
Because the large magnitude of the Tohoku earthquake was not considered as part of the design basis for Japanese<br />
nuclear plants, there has been a focus on possible large magnitude earthquakes in California. This has focused concern<br />
on earthquakes with larger magnitudes than considered in developing the design ground motions for California nuclear<br />
power plants that could occur for multi-segment ruptures. This focus on earthquake magnitude is missing the key issue<br />
for seismic safety at nuclear power plants. Structures are designed for ground motions, not earthquake magnitudes.<br />
This sounds circular because the design ground motion is developed considering earthquake magnitude, but the<br />
distinction is important. The safety related systems, structures, and components at nuclear power plants are stiff and<br />
respond to high frequency ground motions (typically in the 3-30 Hz range). Both empirical observations and numerical<br />
2011 <strong>SCEC</strong> <strong>Annual</strong> <strong>Meeting</strong> | 5
<strong>Meeting</strong> Program | MONDAY<br />
simulations of ground motions have shown that, for sites located close to faults, the high frequency ground motion<br />
scales only weakly with magnitude for magnitudes greater than 6.5. For probabilistic hazard, the decreased rate for<br />
larger magnitudes required to balance the moment-rate on the fault leads to lower overall hazard (and risk of core<br />
damage) if larger magnitudes are included in the source characterization. Unusually large high frequency ground<br />
motions that would exceed the design basis of nuclear power plants are most likely to come from nearby M6.5-M7<br />
earthquakes that are unusually energetic (ground motions more than 2 standard deviations above the median) rather<br />
than from unusually large magnitudes. In contrast to ground motions, tsunami waves heights scale strongly with<br />
earthquake magnitude or slide dimension. For tsunamis hazard, the possibility of larger magnitude events is a key<br />
factor.<br />
11:40 Group Discussion<br />
12:00 Tsunami Interaction with Nearshore Infrastructure (P. Lynett, USC)<br />
In this talk, the well-established approaches of coupling tsunami generation to seismic seafloor motion and the<br />
following trans-oceanic wave propagation will be briefly introduced. The focus of the presentation will be on the<br />
complex transformation of the tsunami as it approaches very shallow waters, as well as how these possibly large and<br />
fast-moving water waves interact with coastal infrastructure. Two examples of coastal impact will be discussed. First, a<br />
simulation of a tsunami flooding an urban coastal town will be shown, and we the creation and behavior of the many<br />
turbulent wakes that form behind each structure will be discussed. A conclusion of this example is that it is possible to<br />
achieve very high fluid forces away from the immediate shoreline; having a row of structures seaward of a given<br />
location does not necessarily protect against the flow. The second example will look at tsunami-induced currents in<br />
ports and harbors. Tsunamis, or "harbor waves" in Japanese, are so-named due to the common observation of enhanced<br />
damage in harbors and ports. However, the dynamic currents induced by these waves, while regularly observed and<br />
known to cause significant damage, are poorly understood. We will show that the strongest currents in a port are<br />
governed by horizontally sheared and rotational shallow flow with imbedded turbulent coherent structures. Without<br />
proper representation of the physics associated with these phenomena, predictive models may provide drag force<br />
estimates that are an order of magnitude or more in error. Such an error can mean the difference between an unaffected<br />
port and one in which vessels 300 meters in length drift and spin chaotically through billions of dollars of<br />
infrastructure.<br />
12:20 Seismic Risk Challenges at Nuclear Power Plants (G. Hardy, SGH)<br />
Recent earthquakes in Japan have exceeded their seismic design basis. The 2007 Niigataken Chuetsu-Oki Earthquake<br />
(NCO) earthquake affected the Kashiwazaki nuclear power plant with exceedances of more than a factor of two on the<br />
design in-structure accelerations. The process that Japanese utility Tokyo Electric Power has undergone to establish the<br />
seismic safety of the Kashiwazaki plants (largest nuclear plant in the world with 7 units) has ramifications for all<br />
nuclear plants, including SONGS and Diablo Canyon in California. Likewise, the 2011 Tohoku earthquake resulted in<br />
ground motions at several of the Japanese nuclear power plants that exceeded their new seismic design basis which had<br />
been increased following the NCO earthquake. The Nuclear Regulatory Commission as well as the nuclear utility<br />
industry are studying the results of the Tohoku earthquake and the resulting tsunami on the nuclear power industry.<br />
Lessons learned will help reduce risks in the US in the future.<br />
This presentation will focus on the lessons learned from these recent earthquakes affecting nuclear power plants in<br />
Japan. The focus will be on characterizing the nature of the design basis exceedances, the seismic upgrades that were<br />
required at these Japanese plants, and the expected ramifications for US nuclear power plants.<br />
12:40 Group Discussion<br />
13:00 – 14:30 Lunch (Poolside / Terrace)<br />
13:00 – 14:30 “What’s Next?” Student Luncheon (Tapestry Room)<br />
14:30 – 16:00 POSTER SESSION II: Group A (Plaza Ballroom)<br />
16:00 – 18:00 PLENARY SESSION III: Are We Properly Characterizing Extreme/Rare Events?<br />
Moderator: J. Hardebeck (USGS)<br />
Location: Horizon Ballroom<br />
16:00 22 February 2011 Christchurch Earthquake (B. Bradley, Cantebury)<br />
An overview of the 22 February 2011 Christchurch earthquake is presented in the context of characterization of<br />
extreme/rare events. Focus is given to the earthquake source, observed near-source strong ground motions, and effects<br />
of site response, while structural response and consequences are mentioned for completeness. For each of the above<br />
topics comparisons and discussions are made with predictive models for each of phenomena considered. In light of the<br />
6 | Southern California Earthquake Center
MONDAY | <strong>Meeting</strong> Program<br />
observations and predictive model comparisons, the author’s opinion on improving the characterization of such<br />
extreme/rare events, and their appropriate consideration in seismic design is presented.<br />
16:30 Structural Linkage of Onshore and Offshore Thrust Systems Across the Ventura Fault and Prospects for<br />
Large Earthquakes in the Transverse Ranges (J. Hubbard, Harvard)<br />
The Ventura Avenue anticline, western Transverse Ranges, is one of the fastest uplifting structures in southern<br />
California, rising at ~5 mm/yr (Rockwell et al., 1988). However, there is disagreement about whether this structure<br />
poses a seismic hazard, due to uncertainty about the nature of the Ventura fault, which lies along its southern margin.<br />
Either the Ventura fault extends to seismogenic depth beneath the anticline (e.g. Sarna-Wojcicki et al., 1976), or it is a<br />
shallow, bending-moment fault that does not pose a hazard (e.g. Yeats, 1982). Seismic data across the tip of the fault<br />
suggest that it deforms late Pleistocene and younger strata, implying that the fault is active. Given that the fault trace<br />
extends directly through Ventura, CA, distinguishing between these two interpretations is very important for seismic<br />
hazard assessment.<br />
We use well data, industry seismic reflection profiles, and two seismic profiles acquired by our group in 2010, to<br />
construct a more complete 3D model of the system. Based on dipmeter logs and seismically-imaged stratigraphic cutoffs,<br />
we show that the N-dipping Ventura fault extends to seismogenic depth beneath the anticline. Fault offset increases<br />
with depth, implying that the fault has propagated upward over time. We interpret the Ventura Avenue anticline to be<br />
a fault-propagation fold underlain by an active thrust ramp. A decrease in the uplift rate at 30 ka (Rockwell et al.,<br />
1988) is consistent with a breakthrough of the fault at that time, although it is still buried by sedimentary cover.<br />
The Ventura fold trend continues offshore and coincides with a set of oil fields. A 3D seismic dataset across the Dos<br />
Cuadras field, which lies along the trend, shows that it is a fault-propagation fold, underlain by the N-dipping Pitas<br />
Point thrust. Based on our and others’ mapping, the Ventura and Pitas Point faults form an en echelon system that<br />
extends >40 km offshore. Other regional faults, including the San Cayetano and Red Mountain faults, link with this<br />
system; we suggest that at 15 km depth, these faults may form a continuous surface. Linkage of the Ventura/Pitas<br />
Point fault could generate a M7.3 earthquake, while rupture with other regional faults could produce larger events. We<br />
provide 3D models of these faults and estimate the magnitudes of potential multi-segment earthquakes. Finally, we<br />
show that GPS data are consistent with a high shortening rate (>6 mm/yr) across the anticline, reinforcing its<br />
hazardous nature.<br />
17:00 Large Co-Seismic Uplift of Coastal Terraces Across the Ventura Avenue Anticline: Implications for the<br />
Size of Earthquakes and the Potential for Tsunami Generation (T. Rockwell, SDSU)<br />
Much of the crustal shortening in the western Transverse Ranges near Ventura is accommodated by the Ventura<br />
Avenue anticline, a propagation thrust that deforms every geomorphic landform into the late Holocene. A sequence of<br />
late Pleistocene fluvial terraces are folded across the anticline along Ventura River and record uplift for the past ~100<br />
ka. The “bedrock” itself that forms the core of the fold are marine sediments that are as young as 200-300 ka, and these<br />
sediments have experienced as much as 2.7 km of structural relief, making this one of the fastest growing folds in<br />
southern California. At Pitas Point, the presence of 4-5 emergent Holocene marine terraces, with the highest reaching<br />
an elevation of nearly 40 m, demonstrate that fold growth has continued to the present. The first emergent terrace has a<br />
back-edge (paleo-shoreline) at about 8-9 m elevation, whereas the modern shoreline reaches to about 1-2 m. This<br />
requires uplift of 6-8 m of this paleo-shoreline. Radiocarbon dates from an archeological site with house structures on<br />
the paleo-shoreface show that the site and associated beach date to about 0.5-0.9 ka B.P. and were abandoned after<br />
emergence. An older, abandoned village site sits on the fore-edge of the 2nd emergent terrace at about 15-20 m elevation,<br />
and radiocarbon ages place the age of this terrace at about 2-2.2 ka. These observations argue that the Holocene terraces<br />
record discrete uplift events, accompanied by village abandonment, with uplift in the range of 6-8 m per event. The<br />
recurrence for such events appears to be on the order of 1 ka. For a 45° dipping fault at depth, this requires<br />
displacements to be in the range of 8-10 m, which are typical for earthquakes in the M7.5-7.8 range but suggests that<br />
the VAA may not act alone. As the anticline trends offshore at Pitas Point, such co-seismic uplift events will directly<br />
displace large volumes of water and potentially generate tsunamis with wave heights that are similar in magnitude to<br />
the uplift; this tsunami would be focused southward towards Los Angeles. This may constitute an extreme event if it<br />
were to occur today, but appears to be typical for this structure.<br />
17:30 Group Discussion<br />
16:00 – 21:00 Poster Removal: Group A / Poster Set-Up: Group B (Plaza Ballroom)<br />
19:00 – 21:00 <strong>SCEC</strong> Honors Banquet (Poolside)<br />
21:00 – 22:30 POSTER SESSION III: Group B (Plaza Ballroom)<br />
2011 <strong>SCEC</strong> <strong>Annual</strong> <strong>Meeting</strong> | 7
<strong>Meeting</strong> Program | TUESDAY<br />
Tuesday, September 13th<br />
07:00 – 08:00 Breakfast<br />
08:00 – 09:00 PLENARY SESSION IVA: Operational Earthquake Forecasting - State of Knowledge and Issues for<br />
Implementation<br />
Moderator: A. Michael (USGS)<br />
Location: Horizon Ballroom<br />
08:00 Operational Earthquake Forecasting and Decision-Making in a Low-Probability Environment: Lessons<br />
from L’Aquila and Application in California (T. Jordan, <strong>SCEC</strong>/USC)<br />
Operational earthquake forecasting (OEF) is the dissemination of authoritative information about the time dependence<br />
of seismic hazards to help communities prepare for potentially destructive earthquakes. Most previous work on the<br />
public utility of OEF has anticipated that forecasts would deliver high probabilities of large earthquakes; i.e.,<br />
deterministic predictions with low error rates (false alarms and failures-to-predict) would be possible. This expectation<br />
has not been realized; the seismic cycle is very unsteady, and the search for diagnostic precursors has not yet produced<br />
successful short-term prediction schemes. An alternative to deterministic prediction is probabilistic forecasting based<br />
on empirical statistical models of aftershock triggering and seismic clustering. During periods of high seismic activity,<br />
short-term earthquake forecasts can attain prospective probability gains in excess of 100 relative to long-term forecasts.<br />
The utility of such information is by no means clear, however, because even with hundredfold increases, the<br />
probabilities of large earthquakes typically remain small, rarely exceeding a few percent over forecasting intervals of<br />
days or weeks. Civil protection agencies have been understandably cautious in implementing OEF in this sort of “lowprobability<br />
environment.”<br />
The need to move more quickly has been underscored by recent seismic crises, such as the 2009 L’Aquila earthquake<br />
sequence, in which an anxious public was confused by informal and inaccurate earthquake predictions. After the<br />
L’Aquila disaster, the Italian Department of Civil Protection appointed an International Commission on Earthquake<br />
Forecasting (ICEF), which I chaired, to review the state of knowledge and recommend guidelines for OEF utilization.<br />
Our report has just been published (Ann. Geophys., 54, 4, 2011; doi: 10.4401/ag-5350;<br />
http://www.annalsofgeophysics.eu/index.php/annals/article/view/5350). This presentation will review the ICEF<br />
guidelines and comment on their application in California. I will emphasize how authoritative statements of increased<br />
hazard, even when the absolute probability is low, can provide a psychological benefit to the public by filling<br />
information vacuums that lead to informal predictions and misinformation. Formal OEF procedures based on<br />
probabilistic forecasting appropriately separate hazard estimation by scientists from the decision-making role of civil<br />
protection authorities. The prosecution of seven Italian scientists on manslaughter charges stemming from their actions<br />
before the L’Aquila earthquake makes clear why this separation should be explicit in defining OEF protocols.<br />
08:30 Group Discussion<br />
09:00 – 10:00 PLENARY SESSION IVB: Ground Motion Simulation Validation<br />
Moderators: N. Luco (USGS) and K. Olsen (SDSU)<br />
Location: Horizon Ballroom<br />
<strong>SCEC</strong> has established a Technical Activity Group (TAG) focused on Ground Motion Simulation Validation (GMSV)<br />
in order to develop and implement testing/rating methodologies via collaboration between ground motion modelers and<br />
engineering users. A <strong>SCEC</strong> workshop was held in January 2011 to kick off the GMSV TAG. During this workshop, the<br />
discussion included selection of ground motion simulation scenarios, simulation models, goodness-of-fit methodologies<br />
and metrics, engineering application targets, archival and distribution of the simulations/validations, appropriate<br />
platform(s) for the validations, and operational issues (including funding issues and possible coordination with<br />
OpenSees and NGA-E). During this plenary session the recommendations from the workshop will be reviewed and<br />
opened up for additional input from interested <strong>SCEC</strong> participants.<br />
10:00 – 10:30 Break<br />
10:30 – 12:30 PLENARY SESSION V: How Do We Develop the Community Stress Model?<br />
Moderator: T. Becker (USC)<br />
Location: Horizon Ballroom<br />
10:30 Fault Stress Heterogeneity and Implications for Rupture Dynamics (J.-P. Ampuero, Caltech)<br />
I will present and discuss theoretical constraints and observational evidence on the spatial distribution of stress in<br />
active fault zones, with emphasis on the statistical description of stress heterogeneities over a broad range of length<br />
scales. I will illustrate through dynamic rupture simulations the possible implications of such heterogeneities on the<br />
8 | Southern California Earthquake Center
TUESDAY | <strong>Meeting</strong> Program<br />
evolution of earthquake rupture and on the induced strong ground motions. One of the key issues raised by the recent<br />
Tohoku-Oki earthquake is the possibility of a very different frequency content of slip in different areas of a fault. I will<br />
offer an interpretation of this observation, although non-unique, in terms of rupture proagation through the residual<br />
stress field left by previous seismicity.<br />
11:00 Earthquake Focal Mechanisms Imply Homogeneous Stress at Seismogenic Depths (J. Hardebeck, USGS)<br />
Stress at seismogenic depths is often thought to be heterogeneous, based on the variety of earthquake focal mechanisms<br />
present in some catalogs. However, when differences in tectonic regime and the sizable focal mechanism uncertainties<br />
are accounted for, the focal mechanisms appear more uniform. On average, the closer two events are in space, the more<br />
similar their focal mechanisms, so comparing events over a large area increases the apparent heterogeneity.<br />
Additionally, even relatively well-constrained focal mechanisms may have uncertainties of 25° or more; these errors<br />
increase the apparent focal mechanism variability, especially for similar mechanisms. It has been proposed that<br />
homogeneous focal mechanisms could be compatible with an extremely heterogeneous crustal stress field. The<br />
hypothesis is that the stress field contains significant heterogeneity in stress orientation, and earthquakes preferentially<br />
occur where the local stress tensor aligns with the stressing rate tensor, which loads the faults that are well-oriented in<br />
those areas. Earthquake focal mechanisms would reflect the stressing rate tensor, and uniform tectonic loading would<br />
produce relatively uniform focal mechanisms. A testable prediction of this model is that focal mechanisms before and<br />
just after a large earthquake should align with different stress fields: the tectonic loading and the mainshock static<br />
stress perturbation, respectively. I test this prediction using aftershocks of the Landers earthquake. The observed<br />
rotation of focal mechanisms near the mainshock rupture could represent a true coseimic stress rotation, so I limit my<br />
test to aftershocks far enough away from the mainshock that the stress change is too small to rotate the stress field. I<br />
identify the aftershock zone as the region where post-Landers events are significantly more consistent with triggering<br />
by the Landers-induced static stress perturbation than the pre-Landers events. I find that these aftershocks also align<br />
with the same stress field as the pre-Landers mechanisms, contradicting the heterogeneous stress model. The aftershocks<br />
occurred on faults that were well oriented for failure in the pre-Landers background stress field and further loaded by<br />
the Landers-induced static stress change. The heterogeneous stress model, if it applies anywhere, should apply to the<br />
complex active fault system in southern California. This counterexample is evidence that the heterogeneous stress<br />
model is not widely applicable.<br />
11:30 Strain-Based Interpretation of Southern California Focal Mechanism Data and Implications for a<br />
Community Stress Model (I. Bailey, USC)<br />
The observations based on recorded motion (e.g. seismograms and geodetic data) that are typically used to constrain the<br />
crustal stress field are more directly related to strain. Studying these data directly in terms of strain can help to better<br />
understand the degree to which we can constrain crustal stress. Here, we examine characteristics of focal mechanisms<br />
of small earthquakes (ML
<strong>Meeting</strong> Program | TUESDAY<br />
15:30 – 17:00 PLENARY SESSION VIA: New Directions in Earthquake Forecasting<br />
Moderator: I. Zaliapin (UNR)<br />
Location: Horizon Ballroom<br />
15:30 UCERF3 – Progress on an Operational Earthquake Forecast for California (E. Field, USGS)<br />
The Working Group on California Earthquake Probabilities (WGCEP) is actively building the 3rd Uniform California<br />
Earthquake Rupture Forecast (UCERF3). The main innovations for this model will be: 1) the relaxation of fault<br />
segmentation assumptions and the inclusion of multi-fault ruptures; and 2) the addition of spatiotemporal clustering<br />
(earthquake triggering and aftershocks), which will form the basis of an operational earthquake forecast. Our plan for<br />
both these enhancements was bolstered tragically by the 2011 Tōhoku, Japan and Christchurch, New Zealand<br />
earthquakes. In addition to giving an overview and progress report on the UCERF3 development, this talk will strive to<br />
emphasize the following more general themes: a) building a useful, state-of-the-art, system-level model inevitably leads<br />
to unearthing deep and interesting scientific questions; b) object-oriented design and programming, plus high<br />
performance computing, are key to success; c) physics-based simulators are becoming more and more critical to the<br />
forecasting enterprise; and d) none of this could happen without <strong>SCEC</strong> (including the intern program).<br />
16:00 Group Discussion<br />
16:15 The Future of Earthquake Forecasting: The Role of Earthquake Simulators (J. Dieterich, UCR)<br />
Earthquake simulators provide a physics-based and self-consistent framework for generating region-specific models of<br />
earthquake occurrence. Simulations typically consist of ≥100,000 events and span tens of thousands of years.<br />
Earthquake simulation capabilities are rapidly evolving – current capabilities now include detailed portrayals of<br />
geometrically complex fault systems at regional scales that incorporate physics-based representations of earthquake slip<br />
(including space-time clustering effects) slow slip events, and continuous fault creep. Some areas where simulators<br />
may make unique contributions to earthquake forecasting include 1) deterministic modeling of short-term clustering of<br />
large events that is linked to material parameters and evolving stress conditions; 2) integration of the short-term<br />
(minutes to years) predictability of earthquakes, and long-term processes (100-1000 years) that condition fault systems<br />
to fail in great earthquakes; 3) characterization of possible location-specific interactions that control the statistics of<br />
earthquake occurrence; 4) statistical characterizations of earthquake occurrence over time scales that greatly exceed our<br />
observational record (which is short compared to the typical recurrence times for large and great earthquakes); 5)<br />
possible precursory, or triggering, interactions between slow slip events and great earthquakes in subduction zones; 6)<br />
generation of multiple synthetic catalogs to test proposed forecasting algorithms.<br />
16:45 Group Discussion<br />
17:00 – 18:30 PLENARY SESSION VIB: SDOT Interdisciplinary Group - What Is Needed To Make Progress On<br />
Understanding Stress Transfer From Plate Motion To Crustal Faults?<br />
Moderator: K. Johnson (Indiana)<br />
Location: Horizon Ballroom<br />
17:00 An Integrated View of the Mw 6 Earthquake Sequence at Parkfield (S. Barbot, Caltech)<br />
Advances in geophysical monitoring now provide an extensive set of observations of all aspects of the earthquake cycle.<br />
Yet, unifying physical models that connect these observations into a coherent picture are lacking. At the same time,<br />
laboratory experiments and theoretical developments provide an increasingly detailed understanding of the fault<br />
physics, offering the basis for an extrapolation to natural conditions.<br />
In this study, we bridge the gap between observations and fault physics by developing the first model of the full<br />
earthquake cycle that explains a number of interesting and robust observations of the crustal dynamics at Parkfield.<br />
Despite the similarities between the repeating Mw 6 earthquakes and their short recurrence times (from 12 to 32 years<br />
for 5 events until 1966), the latest rupture of 2004 defied the odds by taking place a decade later than anticipated and<br />
initiating at the south end to propagate northward, contrarily to all previous events.<br />
We build our model of fault friction using the spatial patterns of microseismicity, the time series of GPS displacements<br />
in the 1999-2010 period, the InSAR data, and the GPS offsets of the 2004 earthquake. We also consider the slip<br />
distribution of the 1966 event and the historical catalog of recurrence times and hypocenter locations. We show the<br />
special role of microseismicity, which marks the transition between stable and unstable friction and circumscribes the<br />
seismogenic zone. We use the program BICYLE (Boundary Integral Cycles of Earthquakes) of Lapusta & Liu (2009) to<br />
solve the elasto-dynamic equations that govern the fault slip evolution. We obtain a sequence of Mw~6 earthquakes<br />
that can explain the observed variability of hypocenters and reproduce the geodetic observations of surface deformation<br />
in the co- and postseismic periods associated with the 2004 event. The change of hypocenter between 1966 and 2004<br />
and the delay of the latest event is consistent with the occurrence of a swarm of smaller-magnitude earthquakes during<br />
the 1992-1994 period and these two locations being close to the boundary of the seismogenic zone. Our study<br />
introduces a methodology capable of integrating seismological and geodetic observations into a coherent physical model<br />
of the earthquake cycle. Our approach can serve as an important tool to investigate the effect of other components of<br />
earthquake physics and to help understand and mitigate seismic hazards around active faults.<br />
10 | Southern California Earthquake Center
TUESDAY | <strong>Meeting</strong> Program<br />
17:20 Dramatic Lithospheric Thinning Beneath Rifted Regions of Southern California (V. Lekic, Brown)<br />
Although rifting is fundamental to the evolution of the continental lithosphere, what happens to the underlying mantle<br />
lithosphere during rifting is poorly known, in large part because seismologists have yet to directly image lithospheric<br />
variations across an active rift system. Indeed, constraints on the kinematics and dynamics of rifting are almost<br />
exclusively provided by surface geologic and geochemical observations combined with geophysical imaging of the crust.<br />
Here, we detect mode conversions of teleseismic shear waves (Sp phases) across the lithosphere-asthenosphere boundary<br />
(LAB) beneath Southern California, and present maps of lithospheric thickness that resolve variations on lengthscales<br />
relevant for constraining continental rifting. LAB depth varies from ~90 to ~40 km below the region, with thick<br />
lithosphere present beneath the Peninsular and Transverse Ranges, and thin lithosphere beneath the Salton Trough and<br />
the Continental Borderland. Although variations in LAB depth appear to occur across some major faults, particularly<br />
those associated with extension at some point in their history, no discernible change in LAB depth is observed across<br />
many faults in the region.<br />
In the Salton Trough, assuming that pre-rift lithosphere exists, apparent mantle lithospheric thinning is substantially<br />
greater than crustal thinning. The two can be reconciled if either substantial loss of mantle lithosphere or crustal<br />
addition through mafic underplating / intrusion and/or metamorphosis of sediment into basement rock has occurred.<br />
On the other hand, if the thinned regions represents newly formed lithosphere, our results imply ~150 km of opening<br />
across the Salton Trough in the direction of present-day extension. Shallow LAB depths beneath the Inner Continental<br />
Borderland are consistent with a deformation history that involves substantial extension, which likely occurred during<br />
the Miocene in wake of the rotation of the Western Transverse Range block.<br />
Our results demonstrate that lithospheric thinning occurs over very similar lengthscale as and is not systematically<br />
offset with respect to surficial and crustal expressions of rifting, consistent with a mode of deformation that is either<br />
pure-shear or simple-shear along steeply dipping shear zones. Furthermore, rapid horizontal variations in lithospheric<br />
thinning suggest efficient strain localization within the lithosphere, which may point to the role of a strain-weakening<br />
rheology or active asthenospheric upwelling.<br />
17:40 Long-Term Fault Strength Evolution: The Examples of Subduction Zones and Ductile Shear Zone<br />
(L. Lavier, UT Austin)<br />
We present 2 examples of fault strength evaluation to foster discussions on long-term fault strength evolution. 1-<br />
Frictional resistance to the relative motion between the upper and lower plates at subduction zones generates great<br />
earthquakes along the subduction interface. It has been noted that regions with a negative trench-parallel gravity<br />
anomaly are more likely to have great earthquakes. It is believed that strong coupling along the subduction interface<br />
drags down the fore-arc region of the overriding plate. This generates the observed gravity and topography anomalies,<br />
and possibly stores more strain energy to be released during a great earthquake. We developed a 2D numerical thermomechanical<br />
code for modeling subduction. The cohesion and friction angle are reduced with increasing plastic strain<br />
after yielding. To track different petrologic phases, Lagrangian particles are distributed in the domain. Interestingly,<br />
our numerical models show that the degree of coupling negatively correlates with the coefficient of friction. For t low<br />
friction, the subduction interface has very shallow dipping angle, which helps to couple plastically the upper and lower<br />
plates. The topography and gravity anomalies of the low friction case are consistent with observations indicate strong<br />
coupling between plates. 2- Geological observations point to variations in fault slip rate over paleoseismological (10 3<br />
yrs) and midterm geomorphological (10 4 to 10 5 yrs) time-scales. We present a model for fault zone dynamics in which<br />
longtime scale changes in fault strength and slip rate arise as a consequence of shear failure in brittle-ductile shear<br />
zones. These faults extend through the brittle plastic transition through zones of anastomosing narrow ductile shear<br />
zones behaving in a semi-brittle manner. We show that a shear stress drops (fracture) generated by elastic unloading in<br />
the rigid brittle parts of the media results in transient slip events. These slip events are damped by viscoelastic flow in<br />
the ductile viscous part of the shear zone. We apply this model to well documented slip rate variations occurring over<br />
long time scales along the Wasatch fault zone. We show that slow fracture events occurring in ductile shear zone at the<br />
brittle-plastic transition can reproduce large variations in strain accumulations on a 10 kyr timescale with low strain<br />
accumulation rates on the 100 kyr timescale.<br />
18:00 Group Discussion<br />
19:00 – 21:00 Dinner (Poolside / Terrace)<br />
20:00 – 22:00 <strong>SCEC</strong> Advisory Council Executive Session (Executive Boardroom)<br />
21:00 – 22:30 POSTER SESSION V: Group B (Plaza Ballroom)<br />
2011 <strong>SCEC</strong> <strong>Annual</strong> <strong>Meeting</strong> | 11
<strong>Meeting</strong> Program | WEDNESDAY<br />
Wednesday, September 14th<br />
07:00 – 08:30 Breakfast<br />
07:00 – 08:30 <strong>SCEC</strong> Planning Committee Breakfast <strong>Meeting</strong> (Palm Canyon A)<br />
07:00 – 08:30 <strong>SCEC</strong> Board Breakfast <strong>Meeting</strong> (Palm Canyon B)<br />
07:00 – 08:30 Remove Posters (Group B)<br />
08:30 – 10:00 PLENARY SESSION VII: How Can Increasingly Complex Community Models Continue To Evolve?<br />
Moderator: B. Aagaard (USGS)<br />
08:30 The Salton Seismic Imaging Project (SSIP): Active Rifting and Strike-Slip Faulting in the Salton Trough,<br />
California (J. Hole, Virginia Tech)<br />
The Salton Seismic Imaging Project (SSIP) acquired seismic data in and across the Salton Trough in southern<br />
California and northwestern Mexico in March 2011. SSIP is investigating both rifting processes at the northern end of<br />
the Gulf of California extensional province and earthquake hazards at the southern end of the San Andreas Fault<br />
system. SSIP acquired seven lines of land refraction and low-fold reflection data in the Coachella, Imperial, and<br />
Mexicali Valleys, airguns and OBS data in the Salton Sea, onshore-offshore data, and a line of broadband stations<br />
across the trough. Seismometers were temporarily deployed at over 4200 onshore locations at 50-500 m spacing, and at<br />
78 locations on the floor of the Salton Sea. Broadband seismometers have been deployed for 18 months at 42 sites along<br />
one of the controlled-source lines. These arrays and permanent network seismographs recorded up to 126 large<br />
explosive shots onshore and 2300 airgun shots offshore. Data were acquired inline for dense 2-D coverage and in grids<br />
for 3-D coverage. The project utilized over 130 field personnel from 31 colleges and universities, a majority of whom<br />
were student volunteers.<br />
Previous studies suggest that North American lithosphere has been rifted completely apart in the Salton Trough. Based<br />
primarily on a 1979 seismic refraction project, the ~22 km thick crust is apparently composed entirely of new crust<br />
added by magmatism from below and sedimentation from above. Between the major transform faults, active rifting is<br />
manifested by faults observed in modern sediment, seismicity in the Brawley seismic zone, volcanism at the Salton<br />
Buttes, very high heat flow and geothermal energy production. The new data will constrain the style of continental<br />
breakup, the role and mode of magmatism, the effects of rapid Colorado River sedimentation upon extension and<br />
magmatism, and the partitioning of oblique extension. To improve earthquake hazard models, SSIP is producing<br />
images of the geometry of the San Andreas, Imperial and other faults; the structure of sedimentary basins in the Salton<br />
Trough; and three-dimensional seismic velocity of the crust and uppermost mantle. Preliminary results of seismic<br />
velocity analyses will be presented.<br />
09:00 Mechanical Investigations of 3D Fault Complexity in Southern California (M. Cooke, UMass)<br />
Fault geometry has a first-order influence on the partitioning of deformation among faults and as off-fault deformation.<br />
By creating a Community Fault Model, <strong>SCEC</strong> has been a leader in assembling an open repository of community vetted<br />
three-dimensional surfaces of active faults in southern California [Plesch et al, 2007]. The CFM provides a tremendous<br />
opportunity to investigate the role of fault geometry on fault system deformation. However, the primary challenge to<br />
using the CFM remains implementing the 3D surfaces into an appropriate model. Finite Element Method models<br />
require volumetric meshes that struggle with some of the more complex fault shapes within the CFM. Meanwhile block<br />
models, which are very well-suited for incorporating GPS data, require connected faults that bound closed volumes; an<br />
unnatural fault configuration in some complexly faulted regions. Several advantages of the Boundary Element Method<br />
(BEM) code Poly3D for examining issues of fault complexity include: 1) only the fault surfaces are meshed into<br />
triangular elements that preserve fault surface complexity 2) faults need not be connected and 3) faults slip in response<br />
to both applied loading and mechanical interaction with each other. Since the start of the CFM development ~11 years<br />
ago, my students, colleagues and I have been using CFM-based BEM models to investigate the effects of fault geometry<br />
on deformation associated with both geologic and interseismic time scales [e.g. Cooke & Marshall, 2006; Marshall et al.,<br />
2009]. Our studies of the Los Angeles basin, Ventura basin, San G<strong>org</strong>onio Pass region and Eastern California Shear<br />
Zone have revealed that variations to fault geometry and connectivity produce observable differences in uplift pattern<br />
and fault slip rates [Griffith & Cooke, 2004; Meigs et al. 2008; Marshall et al , 2008; Dair & Cooke, 2009; Cooke &<br />
Dair, 2011; Herbert & Cooke, <strong>SCEC</strong> 2011]. These studies show that we should expect slip rates to vary with position,<br />
even along any one fault segment. Consequently, a characteristic slip rate for each fault segment may be both difficult<br />
to determine from only one site investigation and potentially misleading for seismic hazard analysis. The studies also<br />
demonstrate that models with over-connected and over-simplified faults will produce slip rates that are too high. This<br />
has important implications for block models that in their goals of modeling large areas, compromise accuracy by<br />
connecting and smoothing fault surfaces. The current CFM is a representation of the active fault configuration in<br />
southern California but is probably incorrect in many places. To avoid propagating the errors of fault geometry into<br />
12 | Southern California Earthquake Center
WEDNESDAY | <strong>Meeting</strong> Program<br />
seismic hazard analysis of southern California, <strong>SCEC</strong> should continue to test the CFM and alternatives to the presently<br />
preferred CFM geometry and we should gather new data to constrain fault geometry.<br />
09:30 Group Discussion<br />
10:00 – 10:30 Break<br />
10:30 – 12:00 PLENARY SESSION VIII: Wrap-Up<br />
Location: Horizon Ballroom<br />
10:30 2012 Science Collaboration and RFP (G. Beroza, Stanford)<br />
11:00 Report from the <strong>SCEC</strong> Advisory Council (J. Freymueller, Alaska)<br />
11:30 Concluding Remarks (T. Jordan, <strong>SCEC</strong>/USC)<br />
12:00 Adjourn<br />
12:30 – 14:00 Lunch (Tapestry Room / Terrace)<br />
13:00 – 17:00 WORKSHOP: Strategies for Implementing a Community Stress Model<br />
Conveners: Bruce E. Shaw, Jeanne L. Hardebeck, Brad Aagaard, John H. Shaw, and Thorsten W. Becker<br />
Location: Horizon Ballroom<br />
The community stress model is one of the more high risk targets of <strong>SCEC</strong> IV but its hypothetical end-product, a model<br />
or suite of models for the 4D stress tensor in the California lithosphere, might be useful for a range of <strong>SCEC</strong> core<br />
science issues. This workshop is intended to kick-start the discussion between observationalists and modelers as to how<br />
a long term strategy can be implemented, which short-term achievable goals can be implemented via an RFP, and what<br />
kinds of stress models are desired by the users.<br />
13:00 Introduction<br />
13:10 Talk 1: Stress Required for Rupture Dynamics Models (B. Aagaard, USGS)<br />
13:25 Talk 2: Stress Required for Fault Loading Models (B. Meade, Harvard)<br />
13:40 Talk 3: Stress Required for Simulators (K. Richards-Dinger, UCR)<br />
13:55 Group Discussion and 5-Minute Presentations<br />
14:45 Break<br />
15:00 Talk 4: Alternative Stress Observations from Boreholes, etc. (N. Davatzes, Temple)<br />
15:15 Talk 5: Stress Observations from Seismicity (E. Hauksson, Caltech)<br />
15:30 Talk 6: Connecting Stress Models to Real World Measurements (D. Sandwell, UCSD)<br />
15:45 Discussion<br />
17:00 Adjourn<br />
- What Do Users Want?<br />
- How Do We Implement the Database?<br />
- Can We Self-Organize into Smaller Working Groups?<br />
- What are CSM Targets for 2012?<br />
2011 <strong>SCEC</strong> <strong>Annual</strong> <strong>Meeting</strong> | 13
Report | <strong>SCEC</strong> Director<br />
State of <strong>SCEC</strong>, 2011<br />
Thomas H. Jordan<br />
<strong>SCEC</strong> Director<br />
Welcome to the 2011 <strong>Annual</strong> <strong>Meeting</strong><br />
The next five-year phase of the Southern California Earthquake Center (<strong>SCEC</strong>4) will officially begin on February 1, 2012. The<br />
21 st <strong>SCEC</strong> <strong>Annual</strong> <strong>Meeting</strong> will therefore be a transitional meeting with two main goals: to share research results related to the<br />
<strong>SCEC</strong>3 science objectives, and to incorporate new ideas and collaboration plans into the preparations for <strong>SCEC</strong>4.<br />
The <strong>SCEC</strong> Planning Committee, under the leadership of our Deputy Director, Greg Beroza, has put together an outstanding<br />
program that features some thought-provoking talks by keynote speakers, discussion sessions on major science themes, poster<br />
sessions on research results, technical demonstrations, education & outreach activities, and social gatherings. Five workshops<br />
and several project-coordination sessions are scheduled before and after the main meeting. Be prepared for a busy few days!<br />
Much has happened in the world of earthquakes since our last meeting, and the agenda reflects these events. Sunday<br />
afternoon, Professor Jim Mori of Kyoto University’s Disaster Prevention Research Institute will kick off the program with a<br />
plenary presentation on the Great Tohoku Earthquake of March 11, 2011. Monday features two related sessions, Science and<br />
Engineering Issues from Earthquake and<br />
Tsunami Hazards Along the California<br />
Coast and Are We Properly<br />
Characterizing Extreme/Rare Events?,<br />
followed on Tuesday by two<br />
sessions on the science and practice<br />
of earthquake forecasting.<br />
The week’s activities will bring<br />
together one of the largest<br />
collaborations in geoscience: over<br />
560 people have pre-registered<br />
(Figure 1), and almost 300 poster<br />
abstracts have been submitted. This<br />
year’s pre-registrants include more<br />
than 160 first-time attendees, so we<br />
will welcome many new scientists<br />
and proto-scientists!<br />
<strong>SCEC</strong>3 Accomplishments<br />
Greg and the PC have put together an impressive annual research report, which is included in your online meeting volume,<br />
highlighting the science projects supported by <strong>SCEC</strong> during the past year. This annual report demonstrates substantial<br />
progress in attaining the basic <strong>SCEC</strong>3 objectives. Greg will summarize the research results in his plenary address on Monday<br />
morning. The poster presentations at the <strong>Annual</strong> <strong>Meeting</strong> will provide a forum for more detailed discussions and interchange<br />
of ideas.<br />
The <strong>SCEC</strong>4 Transition<br />
A primary focus of this transition meeting will be on long-range planning for the five-year <strong>SCEC</strong>4 program. Thanks to<br />
tremendous efforts by many people, the <strong>SCEC</strong>4 proposal process, which began in 2009, was very successful. At last year’s<br />
<strong>Annual</strong> <strong>Meeting</strong>, we were informed by our agency representatives that, based on a rigorous sequence of mail and panel<br />
14 | Southern California Earthquake Center<br />
Figure 1. Registrants at <strong>SCEC</strong> <strong>Annual</strong> <strong>Meeting</strong>s 1991-2011. Number for 2011 (562) is preregistrants.
<strong>SCEC</strong> DIrector | Report<br />
reviews, both the National Science Foundation and U.S. Geological Survey were going to commit substantial resources to the<br />
next five years of the <strong>SCEC</strong> program.<br />
In late May, we were given the panel reviews and official agency letters of commitment. Our NSF program officer Greg<br />
Anderson stated:<br />
“I am very pleased to inform you that your proposal ‘The Southern California Earthquake Center, Phase 4 (<strong>SCEC</strong>4):<br />
Tracking Earthquake Cascades’ has successfully undergone review by NSF, in cooperation with our USGS partners…<br />
I intend to recommend funding for this proposal as a cooperative agreement with a five-year duration beginning 1<br />
February 2012, at an annual anticipated funding level of $3,000,000 (total of $15,000,000 over the award duration).”<br />
UGSG contracting officer Margaret Eastman stated:<br />
“Your proposal submitted to USGS for support of <strong>SCEC</strong>4 has been favorably reviewed and is recommended for five<br />
years of funding at the requested level of $1,340,000 for the first year, pending availability of funds. USGS may not be<br />
able to support the requested inflationary increases in years two through five as our budgets typically do not include<br />
such inflationary increases.”<br />
Separate panel reviews were conducted by the NSF and USGS. The review summaries, which totaled 26 pages, contain<br />
detailed and generally favorable evaluations of <strong>SCEC</strong>3 progress and the <strong>SCEC</strong>4 proposal. The panels made a series of<br />
thoughtful recommendations to improve <strong>SCEC</strong> interactions, especially with groups external to <strong>SCEC</strong>. For example, the NSF<br />
panel recommended that a special advisory structure be created to help our well-regarded Communication, Education, and<br />
Outreach (CEO) program set up and evaluate progress toward new milestones and measures-of-success. CEO Associate<br />
Director Mark Benthien and I have asked the <strong>SCEC</strong> Advisory Council to consider what type of structure under its umbrella<br />
would be most appropriate to implement this recommendation.<br />
From the perspective of this meeting, the most important conclusion of the reviews was the acceptance by both panels of the<br />
science plan articulated in the<br />
<strong>SCEC</strong>4 proposal. The <strong>SCEC</strong>4<br />
scientific program is framed in<br />
terms of a very challenging, longterm<br />
research goal: to understand<br />
how seismic hazards change across<br />
all time scales of interest, from<br />
millennia to seconds. This problem<br />
is well suited to <strong>SCEC</strong>’s<br />
integrated approach to<br />
earthquake system science.<br />
Earthquakes emerge from<br />
complex, multiscale interactions<br />
within active fault systems that<br />
are opaque, and are thus difficult<br />
to observe. They cascade as<br />
chaotic chain reactions through<br />
the natural and built<br />
environments, and are thus<br />
difficult to predict. The practical<br />
goals of <strong>SCEC</strong>4 research program<br />
are focused on time-dependent<br />
seismic hazard analysis—the<br />
geoscience required to “track<br />
earthquake cascades” (Figure 2).<br />
Figure 2. Earthquake processes (in blue) cascade through the natural and built environments,<br />
depicted here for a single damaging event on a nonlinear time line. Advancing the science behind<br />
long-term hazard modeling, operational earthquake forecasting, earthquake early warning, and<br />
delivery of post-event information (in red) will help reduce seismic risk and improve community<br />
resilience.<br />
The <strong>SCEC</strong>4 science plan was developed by the Center’s Board of Directors and Planning Committee with broad input from the<br />
<strong>SCEC</strong> community. A committee chaired by Nadia Lapusta assessed the basic research that will be needed to move towards the<br />
Center’s scientific goals, identifying six fundamental problems in earthquake physics (Table 1).<br />
2011 <strong>SCEC</strong> <strong>Annual</strong> <strong>Meeting</strong> | 15
Report | <strong>SCEC</strong> Director<br />
These problems are interrelated and require an interdisciplinary, multi-institutional approach. Each was described in the<br />
proposal by a short problem statement, a set of <strong>SCEC</strong>4 objectives, and a listing of priorities and requirements (a copy of the<br />
complete <strong>SCEC</strong>4 proposal can be downloaded from http://www.scec.<strong>org</strong>/aboutscec/documents/index.html).<br />
16 | Southern California Earthquake Center<br />
Table 1. Fundamental Problems of Earthquake Science for <strong>SCEC</strong>4<br />
1. Stress transfer from plate motion to crustal faults: long-term fault slip rates<br />
2. Stress-mediated fault interactions and earthquake clustering: evaluation of mechanisms<br />
3. Evolution of fault resistance during seismic slip: scale-appropriate laws for rupture modeling<br />
4. Structure and evolution of fault zones and systems: relation to earthquake physics<br />
5. Causes and effects of transient deformations: slow slip events and tectonic tremor<br />
6. Seismic wave generation and scattering: prediction of strong ground motions<br />
We developed a coherent set of interdisciplinary research initiatives that will focus on special fault study areas, the<br />
development of a Community Geodetic Model for Southern California (which will combine GPS and InSAR data), and a<br />
Community Stress Model. The latter will provide a new platform for the integration of various constraints on earthquakeproducing<br />
stresses. Improvements will be made to <strong>SCEC</strong>’s unified structural representation and its statewide extensions.<br />
Our <strong>org</strong>anizational structure, reformulated in accordance with the overall <strong>SCEC</strong>4 research plan, comprises disciplinary<br />
working groups, interdisciplinary<br />
focus groups, special projects, and<br />
technical activity groups (Figure 3).<br />
A set of special projects funded<br />
separately by the NSF, USGS, and<br />
other agencies (the pink boxes in<br />
Figure 3) will continue to leverage<br />
core research support.<br />
The Planning Committee has<br />
<strong>org</strong>anized a series of talks coupled<br />
with group discussions that<br />
emphasize new elements in the<br />
<strong>SCEC</strong> research program and are<br />
designed to encourage <strong>SCEC</strong>4<br />
planning. The <strong>SCEC</strong>4 objectives will<br />
be incorporated into the 2012<br />
Science Plan. A draft of this plan<br />
prepared by Deputy Director Greg<br />
Beroza and the Planning Committee<br />
is included in the online meeting<br />
volume. An objective of this<br />
meeting is to get community input<br />
into this plan, which will be<br />
finalized by the beginning of<br />
October.<br />
Organization and Leadership<br />
Figure 3. The <strong>SCEC</strong>3 <strong>org</strong>anization chart, showing the disciplinary committees (green), focus<br />
groups (yellow), special projects (pink), CEO activities (orange), management offices (blue), and<br />
the external advisory council (white).<br />
<strong>SCEC</strong> is an institution-based center, governed by a Board of Directors, who represent its members. The membership currently<br />
stands at 17 core institutions and 58 participating institutions (Table 2). <strong>SCEC</strong> currently involves more than 800 scientists and<br />
other experts in active <strong>SCEC</strong> projects. A key measure of the size of the <strong>SCEC</strong> community—registrants at our <strong>Annual</strong><br />
<strong>Meeting</strong>s—is shown for the entire history of the Center in Figure 1. By this measure, participation in <strong>SCEC</strong> has grown by onethird<br />
during the five years of <strong>SCEC</strong>3.
<strong>SCEC</strong> DIrector | Report<br />
The current core institutions have all committed resources to <strong>SCEC</strong>4. The California Geological Survey (CGS), a long-standing<br />
participant in <strong>SCEC</strong>, was admitted as a new core institution at the February meeting of the Board of Directors. A consortium<br />
of California State Universities (members of the nation’s largest university system) is being formed as a “distributed” core<br />
institution in <strong>SCEC</strong>4. The CSU initiative, led by Prof. David Bowman of CalState Fullerton, will benefit an outstanding group<br />
of faculty and students who have contributed substantially to the <strong>SCEC</strong> research program.<br />
Table 2. <strong>SCEC</strong> Institutions (June 1, 2011)<br />
Core Institutions (16) Participation Institutions (58)<br />
California Geological Survey<br />
California Institute of Technology<br />
Columbia University<br />
Harvard University<br />
Massachusetts Institute of Technology<br />
San Diego State University<br />
Stanford University<br />
U.S. Geological Survey, Golden<br />
U.S. Geological Survey, Menlo Park<br />
U.S. Geological Survey, Pasadena<br />
University of California, Los Angeles<br />
University of California, Riverside<br />
University of California, San Diego<br />
University of California, Santa Barbara<br />
University of California, Santa Cruz<br />
University of Nevada, Reno<br />
University of Southern California (lead)<br />
Proposed: CalState Consortium<br />
Appalachian State University; Arizona State University;<br />
Berkeley Geochron Center; Boston University; Brown<br />
University; Cal-Poly, Pomona; Cal-State, Chico; Cal-State,<br />
Long Beach; Cal-State, Fullerton; Cal-State, Northridge; Cal-<br />
State, San Bernardino; California Geological Survey; Carnegie<br />
Mellon University; Case Western Reserve University; CICESE<br />
(Mexico); Cornell University; Disaster Prevention Research<br />
Institute, Kyoto University (Japan); ETH (Switzerland);<br />
Ge<strong>org</strong>ia Tech; Institute of Earth Sciences of Academia Sinica<br />
(Taiwan); Earthquake Research Institute, University of Tokyo<br />
(Japan); Indiana University; Institute of Geological and<br />
Nuclear Sciences (New Zealand); Jet Propulsion Laboratory;<br />
Los Alamos National Laboratory; Lawrence Livermore<br />
National Laboratory; National Taiwan University (Taiwan);<br />
National Central University (Taiwan); Ohio State University;<br />
Oregon State University; Pennsylvania State University;<br />
Princeton University; Purdue University; SUNY at Stony<br />
Brook; Texas A&M University; University of Alaska;<br />
University of Arizona; UC, Berkeley; UC, Davis; UC, Irvine;<br />
University of British Columbia (Canada); University of<br />
Cincinnati; University of Colorado; University of Illinois;<br />
University of Massachusetts; University of Miami; University<br />
of Missouri-Columbia; University of New Hampshire;<br />
University of Oklahoma; University of Oregon; University of<br />
Texas-El Paso; University of Utah; University of Western<br />
Ontario (Canada); University of Wisconsin; University of<br />
Wyoming; URS Corporation; Utah State University; Woods<br />
Hole Oceanographic Institution<br />
Board of Directors. Under the <strong>SCEC</strong>3 by-laws, each core institution appoints one member to the Board of Directors, and two<br />
at-large members are elected by the Board from the participating institutions. The Board is chaired by the Center Director,<br />
who also serves as the USC representative; the Vice-Chair is Lisa Grant Ludwig. The complete Board of Directors is listed on<br />
page ii of the meeting volume. Policies regarding the at-large members for <strong>SCEC</strong>4 will be discussed at the Board of Directors<br />
meeting on Wednesday, and your thoughts about this representation would be valued.<br />
Advisory Council. The <strong>SCEC</strong>4 external Advisory Council will be chaired by Dr. Jeffrey Freymueller of the University of<br />
Alaska. The AC is charged with developing an overview of <strong>SCEC</strong> operations and advising the Director and the Board. Since<br />
the inception of <strong>SCEC</strong> in 1991, the AC has played a major role in maintaining the vitality of the <strong>org</strong>anization and helping its<br />
leadership chart new directions. A verbatim copy of the AC’s 2010 report follows this report in the meeting volume.<br />
Kudos go to our distinguished colleagues who are rotating off the AC Members, Dennis Mileti (emeritus professor of the<br />
University of Colorado) and Stephen Mahin (director of the Pacific Earthquake Engineering Research Center). We also<br />
welcome Bob Lillie (Oregon State), who will be joining the AC this year.<br />
Working Groups. The <strong>SCEC</strong> <strong>org</strong>anization comprises a number of disciplinary committees, focus groups, special project teams,<br />
and technical activity groups. These working groups have been the engines of its success. The discussions <strong>org</strong>anized by the<br />
working-group leaders at the <strong>Annual</strong> <strong>Meeting</strong> provide critical input to the <strong>SCEC</strong> planning process. The structure proposed for<br />
<strong>SCEC</strong>4 is shown in Figure 3.<br />
2011 <strong>SCEC</strong> <strong>Annual</strong> <strong>Meeting</strong> | 17
Report | <strong>SCEC</strong> Director<br />
The Center supports disciplinary science through standing committees in Seismology, Tectonic Geodesy, and Earthquake<br />
Geology. A new disciplinary committee in Computational Science has been added for <strong>SCEC</strong>4. These groups (green boxes of<br />
Figure 3) are responsible for disciplinary activities relevant to the <strong>SCEC</strong> Science Plan, and they make recommendations to the<br />
Planning Committee regarding the support of disciplinary research and infrastructure.<br />
<strong>SCEC</strong> coordinates earthquake system science through interdisciplinary focus groups (yellow boxes). Four of these groups<br />
existed in <strong>SCEC</strong>3: Unified Structural Representation (USR), Fault & Rupture Mechanics (FARM), Earthquake Forecasting &<br />
Predictability (EFP), and Ground Motion Prediction (GMP). The Southern San Andreas Fault Evaluation (SoSAFE) project,<br />
funded by the USGS Multi-Hazards Demonstration Project for the last four years, has been transformed into a standing<br />
interdisciplinary focus group to coordinate research on the San Andreas and the San Jacinto master faults. A new focus group<br />
called Stress and Deformation Through Time (SDOT) will merge the activities of two <strong>SCEC</strong>3 focus groups, Crustal<br />
Deformation Modeling and Lithospheric Architecture and Dynamics. Research in seismic hazard and risk analysis will be<br />
bolstered through a reconstituted Implementation Interface (an orange box in Figure 3) that will include educational as well as<br />
research partnerships with practicing engineers, geotechnical consultants, building officials, emergency managers, financial<br />
institutions, and insurers.<br />
18 | Southern California Earthquake Center<br />
Table 3. <strong>SCEC</strong>4 Working Group Leadership<br />
Disciplinary Committees<br />
Geology Lisa Grant Ludwig*<br />
Mike Oskin<br />
Seismology Egill Hauksson*<br />
Cochran<br />
Geodesy Jessica Murray-‐Moraleda*<br />
Dave Sandwell<br />
Computational Science Yifeng Cui*<br />
Eric Dunham<br />
Focus Groups<br />
Structural Representation John Shaw*<br />
Brad Aagaard<br />
Fault & Rupture Mechanics Judi Chester*<br />
Jean-Paul (Pablo) Ampuero<br />
Southern San Andreas Fault Evaluation Kate Scharer*<br />
Ramon Arrowsmith<br />
Stress & Deformation Over Time Kaj Johnson*<br />
Thorsten Becker<br />
Earthquake Forecasting & Predictability Jeanne Hardebeck*<br />
Ilya Zaliapin<br />
Ground Motion Prediction Kim Olsen*<br />
Rob Graves<br />
Engineering Implementation Interface Jack Baker*<br />
Jacobo Bielak<br />
Special Project Groups<br />
Community Modeling Environment Phil Maechling*<br />
WG on Calif. Earthquake Probabilities Ned Field*<br />
Collaboratory for Study of Earthquake Predictability Tom Jordan<br />
Danijel Schorlemmer*<br />
* Planning Committee members<br />
<strong>SCEC</strong> sponsors Technical Activity Groups (TAGs), which self-<strong>org</strong>anize to develop and test critical methodologies for solving<br />
specific problems. TAGs have formed to verify the complex computer calculations needed for wave propagation and dynamic<br />
rupture problems, to assess the accuracy and resolving power of source inversions, and to develop geodetic transient detectors<br />
and earthquake simulators. TAGs share a modus operandi: the posing of well-defined “standard problems”, solution of these<br />
problems by different researchers using alternative algorithms or codes, a common cyberspace for comparing solutions, and
<strong>SCEC</strong> DIrector | Report<br />
meetings to discuss discrepancies and potential improvements. An important new TAG in <strong>SCEC</strong>4 will be the Ground Motion<br />
Simulation Validation (GMSV) group, led by Nico Luco, which began to develop plans for the validation of numerical<br />
earthquake simulations last January.<br />
The <strong>SCEC</strong>4 Leadership Group is listed in Table 3. We welcome the new members with high hopes for the future and thank<br />
those who are rotating off with a deep appreciation of their service and accomplishments on behalf of the <strong>SCEC</strong> community.<br />
Planning Committee. The <strong>SCEC</strong> Planning Committee (PC) is chaired by the <strong>SCEC</strong> Deputy Director, Greg Beroza, and<br />
comprises the leaders of the <strong>SCEC</strong> science working groups—disciplinary committees, focus groups, and special project<br />
groups—who together with their co-leaders guide <strong>SCEC</strong>’s research program (Table 3).<br />
The PC has the responsibility for formulating the Center’s science plan, conducting proposal reviews, and recommending<br />
projects to the Board for <strong>SCEC</strong> support. Its members will play key roles in formulating the <strong>SCEC</strong>4 proposal. Therefore, I urge<br />
you to use the opportunity of the <strong>Annual</strong> <strong>Meeting</strong> to communicate your thoughts about future research plans to them.<br />
Center Budget and Project Funding<br />
In 2011, <strong>SCEC</strong> received $3.0M from NSF and $1.1M from the USGS under the fifth year of the current cooperative agreements<br />
with these two agencies. These agreements will be renewed for <strong>SCEC</strong>4 next year. Supplementing the $4.1M in base funding<br />
was $240K from the USGS Multi-Hazards Demonstration Project for SoSAFE and $40K from Pacific Gas & Electric Company<br />
for the rupture dynamics project. Other funds available for core projects included $100K from the geodesy royalty funds and<br />
$111K from the UCERF3 project. Therefore, <strong>SCEC</strong> core funding for 2011 totaled $4,591K, down slightly from $4,778K in 2010.<br />
The base budget approved by the Board of Directors for this year allocated $3,272K for science activities managed by the <strong>SCEC</strong><br />
Planning Committee; $35K (including $25K for intern programs) for communication, education, and outreach activities,<br />
managed by the CEO Associate Director, Mark Benthien; $200K for information technology, managed by Associate Director<br />
for Information Technology, Phil Maechling; $304K for administration and $250K for meetings, managed by the Associate<br />
Director for Administration, John McRaney; and $130K for the Director's reserve account.<br />
Structuring of the <strong>SCEC</strong> program for 2011 began with the working-group discussions at our last <strong>Annual</strong> <strong>Meeting</strong> in September,<br />
2010. An RFP was issued in October, 2010, and 172 proposals (including collaborative proposals) requesting a total of $5,270K<br />
were submitted in November, 2010. All proposals were independently reviewed by the Director and Deputy Director. Each<br />
proposal was also independently reviewed by the leaders and/or co-leaders of three relevant focus groups or disciplinary<br />
committees. (Reviewers were required to recuse themselves when they had a conflict of interest.) The Planning Committee<br />
met on January 13-14, 2011, and spent two days discussing every proposal. The objective was to formulate a coherent, budgetbalanced<br />
science program consistent with <strong>SCEC</strong>'s basic mission, short-term objectives, long-term goals, and institutional<br />
composition. Proposals were evaluated according to the following criteria:<br />
1. Scientific merit of the proposed research<br />
2. Competence and performance of the investigators, especially in regard to past <strong>SCEC</strong>-sponsored research<br />
3. Priority of the proposed project for short-term <strong>SCEC</strong> objectives as stated in the RFP<br />
4. Promise of the proposed project for contributing to long-term <strong>SCEC</strong> goals as reflected in the <strong>SCEC</strong>3 science plan<br />
5. Commitment of the P.I. and institution to the <strong>SCEC</strong> mission<br />
6. Value of the proposed research relative to its cost<br />
7. Ability to leverage the cost of the proposed research through other funding sources<br />
8. Involvement of students and junior investigators<br />
9. Involvement of women and underrepresented groups<br />
10. Innovative or "risky" ideas that have a reasonable chance of leading to new insights or advances in earthquake<br />
physics and/or seismic hazard analysis.<br />
11. The need to achieve a balanced budget while maintaining a reasonable level of scientific continuity given very<br />
limited overall center funding.<br />
The recommendations of the PC were reviewed by the <strong>SCEC</strong> Board of Directors at a meeting on January 23-24, 2011. The<br />
Board voted unanimously to accept the PC's recommendations. After minor adjustments and a review of the proposed<br />
program by the NSF and USGS, I as Center Director approved the final program in March 2011. This year proved more<br />
difficult than usual to manage as final funding from NSF did not come through until July.<br />
2011 <strong>SCEC</strong> <strong>Annual</strong> <strong>Meeting</strong> | 19
Report | <strong>SCEC</strong> Director<br />
Communication, Education, and Outreach<br />
Through its CEO Program, <strong>SCEC</strong> offers a wide range of student research experiences, web-based education tools, classroom<br />
curricula, museum displays, public information brochures, online newsletters, workshops, and technical publications.<br />
Highlights of CEO activities for the past year are reported in the meeting volume by the Associate Director for CEO, Mark<br />
Benthien, who will present an oral summary on Monday morning.<br />
<strong>SCEC</strong> has led the development of the Earthquake Country Alliance (ECA), an umbrella <strong>org</strong>anization, now statewide, that<br />
includes earthquake scientists and engineers, preparedness experts, response and recovery officials, news media<br />
representatives, community leaders, and education specialists. The ECA has become our primary framework for developing<br />
partnerships, products, and services for the general public. <strong>SCEC</strong> maintains the ECA web portal (www.earthquakecountry.<strong>org</strong>),<br />
which provides multimedia information about living in earthquake country, answers to frequently asked questions, and<br />
descriptions of other resources and services provided by ECA members. Mark is the ECA Executive Director.<br />
A major focus of the CEO program since 2008 has been <strong>org</strong>anizing the Great California ShakeOut drills and coordinating closely<br />
with ShakeOuts in other states and countries. The purpose of the Shakeout is to motivate all Californians to practice how to<br />
protect ourselves during earthquakes (“Drop, Cover, and Hold On”), and to get prepared at work, school, and home. 7.9<br />
million people participated in the 2010 ShakeOut, up from 6.9 million in 2009. More than 500 TV and radio news stories across<br />
the state and country aired in the days surrouding the drill, including a lengthy story on CBS Sunday Morning, and over 300<br />
print stories appeared, including a front-page photo in the New York Times. Recruitment is well underway for the 2011<br />
ShakeOut, with over 7.1 million participants registered as of August 31; the goal is to exceed 9 million. I would like to<br />
encourage California members of the <strong>SCEC</strong> community to register for the ShakeOut (at www.shakeout.<strong>org</strong>) and to encourage<br />
their institutions to join USC and others that are already registered.<br />
ShakeOut has spread across the country and around the world. In October 2010 Nevada and Guam joined with California. In<br />
January 2011, Oregon and British Columbia held drills to commemorate the anniversary of the 1700 Cascadia earthquake. In<br />
April 2011, eleven states of the Central and Southern U.S. commemorated the 1811-1812 New Madrid earthquake bicentennial<br />
with a ShakeOut drill involving 3 million participants. Idaho will hold its first ShakeOut in October 2011 and Utah in April<br />
2012. Other areas considering ShakeOut drills include Washington (2012), Alaska (2014), as well as Hawaii, Puerto Rico, New<br />
Zealand (2012), and Turkey. The ECA is now collaborating with colleagues in Tokyo, to help them coordinate their first<br />
ShakeOut on the one-year anniversary of the great Tohoku earthquake and tsunami of March 11, 2011.<br />
<strong>SCEC</strong> CEO staff continues to work with museums and other informal education venues to develop content and programs for<br />
earthquake education and to distribute <strong>SCEC</strong> resources, such as the extensive set of publications that has grown out of Putting<br />
Down Roots in Earthquake Country. In 2008, <strong>SCEC</strong> <strong>org</strong>anized a group of museums and other locations interested in earthquake<br />
education into a network of Earthquake Education and Public Information Centers (Earthquake EPIcenters), which has since been<br />
expanded to over 60 venues distributed throughout California. The EPIcenters are essential partners in the ShakeOut, as many<br />
hold public events on drill day, and help promote participation.<br />
<strong>SCEC</strong> is very active in the earth science education community, participating in <strong>org</strong>anizations such as the National Association<br />
of Geoscience Teachers, the Coalition for Earth System Education, and local and national science educator <strong>org</strong>anizations (e.g.<br />
NSTA). <strong>SCEC</strong> Education Programs Manager Bob de Groot leads these efforts and runs the <strong>SCEC</strong> Teacher Workshops and K-12<br />
partnerships. <strong>SCEC</strong> is collaborating with IRIS and EarthScope in developing the content for the San Andreas fault Active Earth<br />
Kiosk, building on a workshop <strong>SCEC</strong> co-<strong>org</strong>anized in 2009. Last year Arizona State University, the OpenTopography Facility,<br />
and <strong>SCEC</strong> developed three earth science education products to inform students and other audiences about LiDAR and its<br />
application to active tectonics research.<br />
Bob de Groot is also skillfully leading <strong>SCEC</strong>’s Office for Experiential Learning and Career Development. His office manages<br />
two <strong>SCEC</strong> intern programs: Summer Undergraduate Research Experiences (SURE, 221 interns since 1994), Undergraduate<br />
Studies in Earthquake Information Technology (USEIT, 167 interns since 2002). The ELCA office promotes diversity in the<br />
scientific workforce and the professional development of early-career scientists (Figure 4). As someone very involved in these<br />
intern programs, I really enjoy seeing the students grapple with the tough but engaging problems of cutting-edge earthquake<br />
science. For example, the “grand challenge” for this year’s USEIT program was to develop a Seismic Sequence Visualization System<br />
based on <strong>SCEC</strong>-VDO and GIS that can display earthquake sequences, monitor their evolution in space and time, and assess their hazards<br />
and risks. Many of the summer interns will be presenting their work at this meeting, and I hope you’ll have the opportunity to<br />
check out their posters and demos.<br />
20 | Southern California Earthquake Center
A Word of Thanks<br />
Figure 4. This "Brady Bunch" picture shows the students from around the country who participated in<br />
the 2011 UseIT summer program at USC. Many will be attending the <strong>Annual</strong> <strong>Meeting</strong> to present<br />
posters, demos, and animations.<br />
<strong>SCEC</strong> DIrector | Report<br />
As <strong>SCEC</strong> Director, I want to express my deep appreciation to all of you for your attendance at the <strong>Annual</strong> <strong>Meeting</strong> and your<br />
sustained commitment to the collaboration. Greg Beroza and the PC have developed an outstanding program, so the entire<br />
meeting should be a pleasant experience. I’d especially like to thank Tran Huynh, the <strong>SCEC</strong> Special Projects and Events<br />
Coordinator, and her diligent associates, Deborah Gormley, John Marquis, and Matt Goldberg, for their hard work and<br />
exceptional skill in <strong>org</strong>anizing this meeting and arranging its many moving parts. Please do not hesitate to contact me, Greg,<br />
Tran, or other members of the <strong>SCEC</strong> team if you have questions or comments about our meeting activities and future plans.<br />
Now please enjoy the sessions, the meals, and the pool in the spectacular tectonic setting of Palm Springs!<br />
2011 <strong>SCEC</strong> <strong>Annual</strong> <strong>Meeting</strong> | 21
Report | <strong>SCEC</strong> Advisory Council<br />
Report of the Advisory Council<br />
Southern California Earthquake Center<br />
2010 <strong>SCEC</strong> <strong>Annual</strong> <strong>Meeting</strong><br />
Advisory Council Membership*<br />
Mary Lou Zoback, Chair, Risk Management Solutions-RMS<br />
Gail Atkinson, University of Western Ontario<br />
Roger Bilham, University of Colorado<br />
John Filson, USGS (Emeritus)<br />
Jeffrey T. Freymueller, University of Alaska<br />
Jim Goltz, CA Emergency Management Agency<br />
Anne Meltzer, Lehigh University<br />
Dennis Mileti, University of Colorado, Boulder (Emeritus)<br />
Steve Mahin, Pacific Earthquake Engineering Research Center (PEER)<br />
Farzad Naeim, John A. Martin & Associates<br />
John Vidale, University of Washington<br />
Andrew Whitaker, University of Buffalo<br />
Introduction<br />
*Members highlighted in bold attended the 2010 <strong>Annual</strong> <strong>Meeting</strong> and contributed<br />
to this report. Gail Atkinson was unable to attend but did contribute to the report.<br />
The Advisory Council of the Southern California Earthquake Center (<strong>SCEC</strong>) met during the 2010 <strong>SCEC</strong> <strong>Annual</strong> <strong>Meeting</strong>, held<br />
in Palm Springs, California, 12-15 September 2010. The principal meeting of the Advisory Council (AC) was during the<br />
afternoon and early evening of 14 September; an earlier session was held prior to the start of the <strong>Annual</strong> <strong>Meeting</strong> on 12<br />
September to outline areas of focus. The incoming Council chair, Jeff Freymueller, summarized the principal Council findings<br />
and recommendations in an oral report delivered during the closing session of the <strong>Annual</strong> <strong>Meeting</strong> on the morning of 15<br />
September.<br />
Prior to the <strong>Annual</strong> <strong>Meeting</strong> on 10 September the <strong>SCEC</strong> Director circulated to the Advisory Council a confidential report<br />
summarizing how <strong>SCEC</strong> had responded to Advisory Council recommendations from the previous year and raised a number<br />
of new and continuing issues warranting Council attention. Those issues included:<br />
• Evaluation of the Communication, Education, and Outreach (CEO) Program<br />
• Input on Collaboratory for the Study of Earthquake Predictability (CSEP) and operational earthquake forecasting<br />
• Advice on initiatives in earthquake simulation and ground motion prediction and interface with the earthquake<br />
engineering community<br />
• Documenting <strong>SCEC</strong> earthquake system science accomplishments in an integrated report<br />
• Advisory Council structure/representation<br />
• Input and reaction to the <strong>SCEC</strong>4 proposal<br />
• Advice on leadership development and succession planning within <strong>SCEC</strong><br />
• <strong>SCEC</strong>’s role in international collaborations<br />
22 | Southern California Earthquake Center
<strong>SCEC</strong> Advisory Council | Report<br />
After some general introductory remarks, we provide input on these issues raised by the Director. We also comment on some<br />
topics raised by the AC--some are new and some are recurring:<br />
• Increasing the visibility of workshops within <strong>SCEC</strong> and awareness of their outcomes<br />
• Input on the effectiveness of annual meeting sessions for science planning<br />
• Reflections on the size of the annual meeting<br />
Finally, we note that in this year’s AC report we include some recommendations for the USGS in areas where their<br />
programmatic interests strongly overlap with those of <strong>SCEC</strong>.<br />
Some General Impressions<br />
Congratulations are in order on multiple fronts. Foremost, at the 2010 meeting we celebrated <strong>SCEC</strong>’s 20th anniversary and<br />
were thrilled to learn that both the USGS and NSF have agreed to fund <strong>SCEC</strong>4. We applaud the herculean scientific planning<br />
and proposal writing effort produced an on time submittal despite the occurrence of the M7 Haiti earthquake in January and<br />
the M9.2 Chile earthquake just days before the deadline. By all accounts the June site visit to <strong>SCEC</strong> by both USGS and NSR<br />
review panels was extremely well <strong>org</strong>anized and succeeded in portraying the many facets of <strong>SCEC</strong> and hence was critical in<br />
assuring the continued funding.<br />
We also applaud the <strong>SCEC</strong> CEO’s initiative in building a statewide coalition of regional earthquake alliances that helped plan<br />
and promote an all-California ShakeOut drill in October 2010 which engaged more than 7.9 million state residents. In addition,<br />
the Earthquake Country Alliance, under Mark Benthien’s able leadership, is actively exporting the ShakeOut exercise to both<br />
other regions of the U. S. and to at least one international site, New Zealand. We view the ShakeOut exercise as a unique<br />
scientific leadership and effective outreach outcome that was only possible as a result of the shared vision, the stature, strong<br />
participatory spirit, and integrative <strong>org</strong>anization of <strong>SCEC</strong> as a dedicated science center.<br />
We also want to strongly commend the outstanding, on-going commitment to involving undergrads in <strong>SCEC</strong> research<br />
through intern programs under the leadership of Bob de Groot. The enthusiasm, breadth and diversity of the outstanding<br />
undergrads getting an opportunity to participate directly in earth science research are inspiring. The entire <strong>SCEC</strong> community<br />
benefits from energy and stimulation these students bring to the <strong>Annual</strong> <strong>Meeting</strong> through their participation and presentation<br />
posters on their work.<br />
All these CEO efforts were all highlighted in a very positive review of the effectiveness of the CEO program conducted by an<br />
independent review panel in the fall of 2009. The review panel’s report was included in the <strong>SCEC</strong>4 proposal.<br />
Since members of the Advisory Council are not members of <strong>SCEC</strong>, the <strong>Annual</strong> <strong>Meeting</strong> provides an important opportunity for<br />
Council members to assess the community’s annual progress on the Center’s goals and programs. The 2010 meeting and<br />
associated workshops proved again to be impressive demonstrations of the energy and enthusiasm of the <strong>SCEC</strong> community.<br />
The 160 registrants who were attending their first <strong>SCEC</strong> <strong>Annual</strong> <strong>Meeting</strong> (nearly 30% of the 545 total registrants), including<br />
many students and interns, provided heartening evidence of the center’s growing participation and its compelling mission.<br />
The Advisory Council also lauds the entire <strong>SCEC</strong> membership for its persistently selfless community spirit which enables<br />
considerable progress in developing communal, system-level models and representations that are advancing the goals of both<br />
fundamental and applied earthquake system science. In particular, we would like to recognize Deputy Director Greg Beroza’s<br />
superb leadership of the science collaboration process. Beroza’s kickoff keynote on <strong>SCEC</strong> scientific accomplishment did a<br />
superb job of highlighting breakthrough science and the progress made towards <strong>SCEC</strong>3 goals.<br />
Finally, the Advisory Council would like to particularly acknowledge Tom Jordan’s exemplary leadership of <strong>SCEC</strong> over the<br />
past 10 years. Tom arrived in 2000 and brought an infusion of energy and creative ideas to <strong>SCEC</strong> as it went into its <strong>SCEC</strong>2<br />
planning process. Under his direction the <strong>SCEC</strong>2 proposal was funded and numerous new research directions were launched.<br />
Tom’s vision and ability to cultivate and seize funding opportunities outside of the core support has brought new perspectives,<br />
expertise and tools to address earthquake system science. Under Tom’s initiative and leadership, <strong>SCEC</strong> now leads the<br />
earthquake science community in active engagement of the high performance computing community. The California<br />
Earthquake Authority was so impressed with the joint <strong>SCEC</strong>-USGS-CGS’ UCERF2 uniform statewide assessment of<br />
earthquake likelihood analysis that they have funded a UCERF3 proposal to address a number of key issues and uncertainties<br />
leading to an improved assessment.<br />
2011 <strong>SCEC</strong> <strong>Annual</strong> <strong>Meeting</strong> | 23
Report | <strong>SCEC</strong> Advisory Council<br />
As Tom is always the first to admit, the outstanding staff support provided by John McRaney, <strong>SCEC</strong>’s Associate Director of<br />
Administration and Tran Huynh, Special Project Manager, are vital to the success of <strong>SCEC</strong>. John and Tran keep <strong>SCEC</strong> running<br />
smoothly and money flowing to researchers in a timely fashion, and they make sure workshops are easy to <strong>org</strong>anize and run<br />
flawlessly. We especially thank them for providing all manner of cheerful and indefatigable assistance while managing all the<br />
details involved in carrying out another highly successful <strong>Annual</strong> <strong>Meeting</strong>.<br />
Evaluation of the Communication, Education and Outreach (CEO) Program<br />
The Advisory Committee makes a number of recommendations regarding the CEO program:<br />
1. Carry out a “forward-looking” Phase II CEO Review<br />
2. Develop <strong>SCEC</strong>4 CEO Program targets and create metrics to track program progress toward targets<br />
3. Expand oversight of and input to the <strong>SCEC</strong> CEO program<br />
4. Deepen the CEO’s relationship with FEMA.<br />
5. Institute risk communication training for <strong>SCEC</strong> members likely to speak with the media<br />
6. Bring the latest social science research on risk communication to operational earthquake forecasting and the<br />
Collaboratory for the Science of Earthquake Prediction (CSEP) activities<br />
Each of the six recommendations is discussed in more detail below.<br />
Carry out a” forward-looking” Phase II CEO Review<br />
The Advisory Council continues to call for a “forward-looking “ Phase II review of the <strong>SCEC</strong> CEO Program (as opposed to the<br />
retrospective review carried out in the Fall of 2009). We recommend the review panel be comprised of a broad range of<br />
disciplinary experts, e.g. marketing and/or advertising, psychology, risk communication, and more. The purpose of the<br />
review would be to detect and explore potential new ideas for the <strong>SCEC</strong>4 CEO workplan, activities and directions. This review<br />
might best occur if it were phased as follows: (1) add a new disciplinary member to the Advisory Council as described in a<br />
later section, (2) involve new and existing Advisory Council members in planning the review, and (3) conduct the review in a<br />
meeting format and compile its results. The critical time issue is that the Phase II review happens in time to have the<br />
maximum impact on all of <strong>SCEC</strong>4 CEO activities.<br />
Develop <strong>SCEC</strong>4 CEO program targets and create metrics to track program progress toward<br />
targets<br />
The Advisory Committee recommends that the CEO program develop a comprehensive list of <strong>SCEC</strong>4 targets—those that are<br />
“social process orientated” as well as those with more readily quantified targets. The targets should first be generated and<br />
then metrics should be developed to measure progress toward them. This could be done by <strong>SCEC</strong> CEO staff with input from<br />
external outreach experts (including social scientists, practitioners, and education experts). It would ideally be informed by the<br />
forward-looking review recommended above.<br />
Examples of such targets include:<br />
• Prepare and Distribute a “Baseline Public Preparedness Summary”. The State of California funded a recently<br />
completed scientifically-based study to measure the state of adoption by households of 40+ <strong>SCEC</strong> CEOrecommended<br />
preparedness and mitigation actions for earthquakes. Data was gathered on three California<br />
populations: (1) high risk southern California counties, (2) high risk northern California counties, and (3) the rest of<br />
the state. This study was intended to provide a baseline against which the impact of the 2008 Shake Out and others<br />
could be assessed. <strong>SCEC</strong> CEO should synthesize, distribute, and use this baseline against which to evaluate past,<br />
present and future Shake Out and other public information dissemination activities. The distribution of these<br />
baseline data could be used to motivate others to provide or procure funds to replicate the study to determine the<br />
impacts of subsequent efforts to motivate household preparedness and mitigation action-taking.<br />
• Prepare, Distribute and Use a “Motivating Public Preparedness Metric”. A definitive study of what factors motivate<br />
public preparedness and mitigation has recently been funded by the Department of Homeland Security. It produced<br />
clear, certain, and replicated scientific conclusions for all hazards on the entire population of the U.S., high risk cities,<br />
24 | Southern California Earthquake Center
<strong>SCEC</strong> Advisory Council | Report<br />
and the nation’s major racial and ethnic minority groups. This study’s findings about “what works” and “what does<br />
not work” to motivate public preparedness and mitigation should be clearly synthesized into a metric. This metric(s)<br />
should be disseminated, and used to inform choices about future <strong>SCEC</strong> outreach activities.<br />
Many other <strong>SCEC</strong> CEO public information and education targets should be catalogued and metrics developed to track<br />
progress toward them. Among these is clarification regarding the program’s mission in southern California versus in other<br />
regions.<br />
Expand oversight of and input to the <strong>SCEC</strong> CEO Program<br />
The Advisory Council recommends that <strong>SCEC</strong> incorporate a broader range of disciplines to better evaluate <strong>SCEC</strong> CEO<br />
activities and potentially to provide input more frequently. Specific recommendations are:<br />
• Expand Disciplinary Membership by adding an additional Advisory Council member, to represent other CEOrelevant<br />
disciplines beyond those of the disciplines of sociology and emergency management currently on the AC.<br />
<strong>SCEC</strong> might also consider an advisory committee specifically for CEO activities, involving, but not exclusive to, AC<br />
members. Suggested additional disciplines include:<br />
o advertising and/or marketing<br />
o the psychology of risk communication<br />
o public science education<br />
• Expand CEO Oversight. Structure whereby an increased number and more diverse set of outreach and education<br />
experts can offer advice and oversight to the <strong>SCEC</strong> CEO Program more than once a year as is now the case. This<br />
could possibly be done through a dedicated subcommittee reporting to the AC.<br />
Deepen the CEO Program’s Relationship with FEMA<br />
The Advisory Council notes that <strong>SCEC</strong>’s CEO Program is likely the most successful CEO Program in the nation, and perhaps<br />
the world. We are proud of the progress that its Director has made in the last year to increase funding for CEO activities from<br />
groups such as FEMA. But we recommend that a more aggressive set of activities be put in place to cultivate <strong>SCEC</strong> CEO<br />
relationships with FEMA. There are a number of possible projects that might be appropriate to pursue with FEMA. However,<br />
the following ShakeOut related projects are “prime candidates” and should be pursued first.<br />
• Leverage the <strong>SCEC</strong> ShakeOut with FEMA as a Best Practice. The ShakeOut model is now being emulated by other<br />
places, states, nations, and other hazards (the Great Hurrican Blowout is being run for hurricane awareness, see<br />
http://www.greathurricaneblowout.<strong>org</strong>). A long-standing practice in FEMA is to identify “a national best practice” and<br />
then export it. This is already underway at FEMA but could be upgraded. First, <strong>SCEC</strong> CEO should seek FEMA<br />
funding for an individual to distinguish and write-up the ShakeOut’s design parameters and implementation<br />
procedures to enhance its export by FEMA to other entities (e.g.,produce a briefing book to spread the ShakeOut<br />
approach as a FEMA “best practice”). This project should be pursued with the endorsement and cooperation of the<br />
USGS and Cal-EMA.<br />
• Rigorously evaluate the effectiveness of the ShakeOut program. <strong>SCEC</strong> CEO should s FEMA to evaluate the<br />
effectiveness of the ShakeOut program to determine what about it works best and what does not. This would be easy<br />
to accomplish because of the baseline data described above. Such an evaluation would enable the Shake Out to adjust<br />
its approach, if needed, and fine-tune details about its export to other places so that its effectiveness is maximized.<br />
Institute risk communication training for <strong>SCEC</strong> members likely to speak with the media<br />
The Advisory Council continues to recommend that risk communication training be sought and delivered to <strong>SCEC</strong> members<br />
likely to talk about earthquakes or earthquake hazard in southern California on the radio, in front of a television camera, or on<br />
other public media. It would be appropriate to involve new Advisory Council or subcommittee member(s) in the discipline of<br />
risk communication to help <strong>org</strong>anize this training. Different levels and types of training are likely appropriate for different<br />
types and levels of <strong>SCEC</strong> participants.<br />
2011 <strong>SCEC</strong> <strong>Annual</strong> <strong>Meeting</strong> | 25
Report | <strong>SCEC</strong> Advisory Council<br />
Bring latest social science research on risk communication to operational earthquake<br />
forecasting and the Collaboratory for the Science of Earthquake Prediction (CSEP) activities<br />
Two areas of knowledge in the social sciences can inform CSEP and operational earthquake forecasting activities. The<br />
Advisory Council recommends an active two-part role for CEO in helping craft operational earthquake forecasting<br />
communication for both <strong>SCEC</strong> and the USGS:<br />
• Transfer of existing knowledge and stimulating new research. There is a rich research literature in the social and<br />
behavioral sciences regarding risk communication (including changed probabilities and public warning statements)<br />
conducted primarily in this nation, but also internationally. The topics covered include:<br />
o public warning information system design to assure that rarely used systems are highly reliable<br />
o public messaging and the importance of the words that are made public to maximize societal benefits and<br />
minimize societal disruptions<br />
o the best methods to accomplish public education activities to upgrade what the public know about such<br />
topics<br />
The CEO should explore formats to isolate applicable knowledge from this research and to clarify new formal social<br />
science research needed to support the emergence of operational earthquake forecasting (OEF) practices. Possible<br />
formats include:<br />
o request that either NEHRP or the USGS fund an NRC/NAS Committee to review the relevant literature and<br />
make recommendations on needed research (e.g., a study similar to the NRC effort evaluating the National<br />
Tsunami Warning Program, report released September 27, 2010).<br />
o Alternatively, a group of social science experts on these topics could be assembled for a workshop.<br />
The range of research topics that might emerge are likely to be varied including message testing in psychological<br />
laboratories, the role of social media in influencing what people hear, think, and do, and many more.<br />
• Take advantage of cutting edge research in peripheral fields. Public risk communication is in a state of rapid change<br />
related to the advent of Web 2.0 and rapidly expanding use of social media (e.g., people are warning themselves and<br />
their friends). The role of social media in the domain of risk communication is one of the hottest research topics in<br />
risk communication today, well-funded by the Department of Homeland Security. <strong>SCEC</strong> and the USGS would do<br />
well to reach out to researchers in this field to be informed by new discoveries applicable to CSEP/OEF. A key<br />
research center is the START Center of Research Excellence at the University of Maryland at College Park. There is no<br />
reason to duplicate this research, but there is strong reason to know what their research is revealing.<br />
Input on the Collaboratory for the Study of Earthquake Predictability (CSEP) and Operational<br />
Earthquake Forecasting<br />
We applaud <strong>SCEC</strong> for its continued progress in developing CSEP and in promoting test centers in other countries--special<br />
congratulations are due for establishing a CSEP test center in China. CSEP uniquely fulfills the role of open, scientifically<br />
rigorous and consistent evaluation of earthquake prediction methodologies.<br />
Despite its successes, the enterprise is currently at risk, as the Keck seed funding expired in 2010 and funding is scarce in the<br />
USGS, the natural home for the operational side of this effort.<br />
The Advisory Council recommends the following actions to the <strong>SCEC</strong> leadership:<br />
1. The AC strongly endorses the continuation of the CSEP, as this program is a well- conceived, well-executed, and<br />
critical step toward quantifying the temporal variations in earthquake hazard. It is particularly critical as prediction<br />
methodologies are far from mature, and new evidence such as deformation and paleoseismology are continually<br />
expanding the measurements being monitored, and early warning systems and aftershock probabilities estimates are<br />
coming to fruition.<br />
2. CSEP should continue to avoid monitoring responsibilities and focus only on evaluation of forecasts.<br />
26 | Southern California Earthquake Center
<strong>SCEC</strong> Advisory Council | Report<br />
3. CSEP should evolve from its current development phase to one of sustained operations as a matter of economy. This<br />
may involve reducing or curtailing of investment of resources in international collaborations. Nevertheless, CSEP is to<br />
be strongly commended for having helped to launch a suite of international efforts with similar goals.<br />
4. As the goals of CSEP are directly aligned with NEHRP statutory evaluation of hazard and public safety<br />
responsibilities, we strongly urge USGS take a leadership role within NEHRP in securing funding to sustain CSEP<br />
operations.<br />
5. CSEP should be the scientific element of an end-to-end operational earthquake forecasting system that is informed by<br />
risk communication science (see specific recommendations in the CEO section). CSEP should work with USGS and<br />
state agencies to implement an OEF plan.<br />
Advice on initiatives in earthquake simulation and ground motion prediction and building<br />
collaboration with the earthquake engineering community<br />
The Advisory Council commends <strong>SCEC</strong> for its continued progress in broadband and large-scale ground motion simulations.<br />
Significant progress has been made in confirmation of these simulations through comparison with recorded data and through<br />
assessments of the consistency and accuracy of results from various investigators.<br />
The scientific foundations and methods used in this work are solid and the potential applications, as a supplement to recorded<br />
data, are significant. With regard to the science, the Advisory Council notes that studies of recent earthquakes in Haiti, Chile,<br />
and northwestern Mexico (Sierra El Mayor) discovered unexpected complexities of the earthquake source. Such complexities<br />
may be necessary to take into account in ground motion simulations and the study of the variability in these simulations.<br />
The utilization of ground motion simulations within engineering practice remains a challenge. Despite the wide range of<br />
scenarios for which simulations can be computed, far exceeding the number of events with recorded data, their acceptance by<br />
the engineering community has remained muted. Without general acceptance by the engineering profession, the ground<br />
motion simulation projects of <strong>SCEC</strong> will remain an exercise of great interest to some but will not realize their full potential.<br />
The reservations of the engineering profession regarding simulated ground motions may have several causes, including:<br />
• The difficulty in assuring practitioners of the consistency of the simulations with existing recordings of strong<br />
motions.<br />
• The difficulty in capturing the sensitivity of simulations to the range of unpredictable parameters, i.e., quantifying<br />
the uncertainty in a useful way.<br />
• Lack of knowledge of the scientific underpinnings of the simulation methods.<br />
• Lack of awareness of recent advances in simulation studies.<br />
• Lack of general availability of “user-friendly” access and well-documented sets of simulations that are readily<br />
useable by the research engineering community in comparative studies of the applicability of such simulations<br />
relative to “real” recordings.<br />
The needed level of engineering acceptance would be accelerated by proactive outreach, indeed a campaign, by <strong>SCEC</strong> to<br />
engage the engineering community to address these issues.<br />
The Advisory Council recommends the following actions to the <strong>SCEC</strong> leadership:<br />
1. Create a technical activity group (TAG) specifically charged to engage the engineering community. This group<br />
should be comprised of ground motion model developers and earthquake engineers. The TAG should convene, early<br />
on, a topical workshop on engineering needs, the status of ground motion simulation, and means to establish a<br />
sustained and energetic dialog between the scientific and engineering interest in this topic. One promising<br />
mechanism for this dialog of might be for <strong>SCEC</strong> to participate in the Ground Motion Selection and Modification<br />
group at PEER.<br />
2. Investigate methods of delivering and promoting simulations to the engineering community by making them more<br />
comprehensive and accessible. As an example, a recent PEER initiative provides a web tool by which engineers can<br />
2011 <strong>SCEC</strong> <strong>Annual</strong> <strong>Meeting</strong> | 27
Report | <strong>SCEC</strong> Advisory Council<br />
search and/or scale a database of time histories to match given target scenarios and conditions. Perhaps a similar<br />
database could be compiled (and accessed through the same or similar tool) for simulated time histories; this would<br />
make it apparent how these simulations “fleshed out” the recorded time histories, and also enable comparisons. It<br />
would also provide a good vehicle for collaboration with PEER.<br />
3. Motivate and facilitate active participation of members of the engineering community in the Advisory Council. A<br />
meeting of the Advisory Council at a different time from the <strong>Annual</strong> <strong>Meeting</strong> to discuss means of building rapport<br />
with the engineering community may be necessary.<br />
4. Actively seek to involve young engineering students in <strong>SCEC</strong>’s student intern programs to build more integration<br />
into the next generation of engineers.<br />
Documenting <strong>SCEC</strong> earthquake system science and outreach accomplishments in<br />
an integrated report<br />
The Advisory Council was asked to consider how the <strong>SCEC</strong> story might be told, and how its findings might be integrated in<br />
an appropriate publication.<br />
The two decades of <strong>SCEC</strong>s unique existence have resulted in a sequence of findings that many perceive justifies an equally<br />
unique report. This report will be eagerly awaited by not only by the <strong>SCEC</strong> community and by funding bodies, but also by the<br />
international science community. The success or otherwise of <strong>SCEC</strong>'s systems approach to science and embedded outreach<br />
justifies a full account - what worked, what didn’t, and where would earthquake science be without <strong>SCEC</strong>.<br />
The committee discussed conventional journal reporting versus a monograph, or possibly a book. The anticipated scope was<br />
considered inappropriate and too wide ranging for most journals, with the possible exception of Reviews of Geophysics, but a<br />
length limitation in that journal would restrict a full treatment of the motivation behind, and the successes ensuing from<br />
<strong>SCEC</strong>'s unusual interdisciplinary collaboration and its system-level approach to earthquake science.<br />
The Advisory Committee recommends:<br />
1. <strong>SCEC</strong> consider a full length monograph, e.g. AGU's Geodynamic series, or a dedicated book as the best setting for<br />
telling the integrated story of <strong>SCEC</strong> - from conception, to evolution, to results. Such a comprehensive report would be<br />
a formidable undertaking for <strong>SCEC</strong> leadership, but it should be possible to lessen the burden through shared<br />
authorship and dedicated editing.<br />
Advisory Council<br />
In past years, the Advisory Council has done essentially all its business at the <strong>SCEC</strong> <strong>Annual</strong> <strong>Meeting</strong>. As <strong>SCEC</strong> has grown, this<br />
model has been increasingly strained. Given the time constraints at the meeting, it is difficult for the AC to do more than<br />
discuss items brought to it by the <strong>SCEC</strong> leadership, plus a few of the most pressing issues that may be raised or observed at<br />
the meeting. Probably we could do a bit more if we received some materials farther in advance of the meeting, but this would<br />
only reduce rather than eliminate the time crunch. It may be time to augment the AC meeting at the <strong>Annual</strong> <strong>Meeting</strong> with a<br />
shorter, focused meeting at USC during a less hectic period. Ideally, this would also mean a lighter workload for the AC at the<br />
<strong>Annual</strong> <strong>Meeting</strong>.<br />
There has been a pattern of irregular AC attendance in certain disciplines (for example, engineering). Holding a ~1-day<br />
meeting at USC in addition to the <strong>Annual</strong> <strong>Meeting</strong> might help reduce this problem, especially if the time of the meeting was<br />
flexible. Other suggestions outlined earlier in this report may also help as well. The suggested Technical Activity Group on<br />
ground motion simulations and their use may also provide an additional hook to draw further participation from the<br />
engineering community. Providing progress reports and soliciting specific advice from the AC on this endeavor may be an<br />
effective way to increase participation (if not, you may need to choose different people from the engineering community).<br />
As mentioned before, the <strong>SCEC</strong> AC could use additional expertise on CEO matters. Adding several CEO-focused members<br />
would result in a lack of balance in the AC, but adding one more would be a positive step. Through the forward-looking CEO<br />
evaluation that we have recommended, <strong>SCEC</strong> has an opportunity to engage experts in a broader range of disciplines and these<br />
people could be asked to provide advice on an ongoing basis to <strong>SCEC</strong> (directly or through the AC) on specific CEO-related<br />
topics.<br />
28 | Southern California Earthquake Center
Input and reaction to the <strong>SCEC</strong>4 Proposal<br />
<strong>SCEC</strong> Advisory Council | Report<br />
We thank <strong>SCEC</strong> for the copy of the <strong>SCEC</strong>4 proposal, and we congratulate <strong>SCEC</strong> on another success! Time has not yet allowed<br />
us to make serious comments about the final submitted proposal, which we received in the packet for the <strong>Annual</strong> <strong>Meeting</strong>. In<br />
any case, it may be more important for <strong>SCEC</strong> to get our input to the proposal once the peer and panel reviews have been<br />
received. We recommend that <strong>SCEC</strong> ask for further input in the spring once these reviews have been received.<br />
Most likely, <strong>SCEC</strong> will have to make some difficult choices in its prioritization of activities under <strong>SCEC</strong>4, given that the<br />
funding level will be lower than requested. In 2008 the Advisory Council was told that the <strong>SCEC</strong> Planning Committee would<br />
be tracking progress toward the achievement of the 19 <strong>SCEC</strong>3 research objectives. We have yet to receive the results of this<br />
tracking or a report on the status of progress on the various <strong>SCEC</strong>3 goals. We suggest again that such a report be generated,<br />
not as a bean-counting exercise but as a helpful self-assessment of <strong>SCEC</strong>3 successes (and remaining challenges) that will aid in<br />
the prioritization of <strong>SCEC</strong>4 research priorities. To some extent this self-assessment was done in the <strong>SCEC</strong>4 planning process.<br />
We recommend:<br />
1. An annual report tracking progress toward the achievement of the <strong>SCEC</strong>4 research objectives, even if only for<br />
internal use.<br />
Advice on Leadership Development and Succession Planning within <strong>SCEC</strong><br />
The AC was delighted that Tom Jordan committed to continue to lead <strong>SCEC</strong> through the <strong>SCEC</strong>4 proposal process. However,<br />
with Tom Jordan’s stated desire to step down from the directorship, the challenges of attracting a new director remain. The<br />
AC strongly recommends that a plan be defined as soon as possible for recruiting a new director with a specific time table. The<br />
plan should also include strategies for cultivating a pool of potential candidates such as engaging them in <strong>SCEC</strong> by inviting<br />
potential candidates to serve on the Advisory Council, or by inviting them to attend <strong>SCEC</strong> meetings and workshops. It will<br />
also be important to consider alternate leadership structures for the future as an element of this succession planning. For<br />
example, the leadership should consider the possibility that there could be separate directors of special projects that are not<br />
funded through the core science budget. This kind of thinking might be important both to the future growth of <strong>SCEC</strong> and to<br />
attracting a new director with management strengths different from the current director.<br />
Defining <strong>SCEC</strong>’s role in international collaborations<br />
The Advisory Council was asked to consider when it might be appropriate for <strong>SCEC</strong> to expand its research activities beyond<br />
the confines of California.<br />
The AC recommends that <strong>SCEC</strong> should clearly focus its international efforts on partnerships that support its core science<br />
mission. Although it is tempting to export <strong>SCEC</strong> findings to address similar tectonic settings elsewhere in the world, <strong>SCEC</strong>'s<br />
motivation in such involvement should lie in identifying opportunities that are perceived to complement or advance ongoing<br />
<strong>SCEC</strong> research tasks. Examples include:<br />
• Fault networks in Southern California that extend beyond the US national border. One cannot conceive of studying<br />
the fault systems of southern California in isolation. Ties and collaborative projects with Mexican scientists should be<br />
pursued with vigor especially in the aftermath of the El Mayor-Cucapah earthquake. Methods to exchange seismic<br />
and fault slip data transparently and in a timely fashion are recognized as especially important.<br />
• Partnerships with other <strong>org</strong>anizations working on operational earthquake forecasting are clearly beneficial to <strong>SCEC</strong>.<br />
In this case the societal complexities of “uncertain information” communication have common ground in numerous<br />
countries.<br />
• One can envisage that future opportunities may arise to study scientific problems that <strong>SCEC</strong> cannot solve locally – in<br />
these instances international partnerships would be of benefit. An example might be the availability of deep<br />
boreholes elsewhere in the world that might illuminate the physics of hypocentral processes, or the physics of fault<br />
slip.<br />
2011 <strong>SCEC</strong> <strong>Annual</strong> <strong>Meeting</strong> | 29
Report | <strong>SCEC</strong> Advisory Council<br />
• <strong>SCEC</strong> provides an unusual but exemplary template for innovative coordinated science that might benefit other<br />
regions. <strong>SCEC</strong> may thus have an international role in showcasing its methodology to a worldwide scientific<br />
community.<br />
• <strong>SCEC</strong> may have an important advisory role in guiding international efforts at the design stage (e.g., acquisition of<br />
new forms of remotely sensed data suited to the study of earthquake processes).<br />
Increasing the visibility of workshops within <strong>SCEC</strong> and awareness of their outcomes<br />
<strong>SCEC</strong> fills a tremendous need of the community by facilitating easy-to-convene topical workshops in a short time frame. The<br />
Advisory Council has noted that while many <strong>SCEC</strong> members are aware of recent workshops in a related area, in general they<br />
are not very aware of the workshop outcomes if they did not personally attend. These workshops are a tremendous resource<br />
for the entire community, and the benefit will be enhanced if the outcomes are better publicized.<br />
Expanding on the AC focus on this issue for the past two years, we recommend:<br />
1. Continue <strong>SCEC</strong>-wide promotion of workshop opportunities (this part of the process seems to be working well)<br />
2. Provide brief oral summaries of outcomes of the pre-annual meeting workshops as part of each <strong>Annual</strong> <strong>Meeting</strong><br />
program<br />
3. Provide a tab on the <strong>SCEC</strong> website to provide easy access to information upcoming as well as past workshops.<br />
4. Require all <strong>SCEC</strong> workshop conveners to submit a brief summary of workshop outcomes for posting online within 45<br />
days of the workshop. An email notification to the <strong>SCEC</strong> community to alert them to the posting with a link to the<br />
summary would enhance the impact of the workshop discussions on the broader <strong>SCEC</strong> community.<br />
Input on the effectiveness of science planning at annual meeting sessions<br />
The <strong>SCEC</strong> annual meeting exists as a forum for presenting cutting edge scientific results and for planning future year’s<br />
activities. The advisory committee was asked to comment on the success of the meeting format for addressing those two goals.<br />
During the 2010 meeting a number of the plenary sessions were <strong>org</strong>anized to focus on emerging new results and potential<br />
future science directions. The keynote presentations in these discussion sessions were uniformly interesting and informative.<br />
There was, however, more variability in the 1.5 hour science planning discussion sessions that followed.<br />
The discussions that were most successful were those that placed the scientific presentation and issues raised in it directly in<br />
the context of a <strong>SCEC</strong> planning process. The most effective of these discussions were those that followed a template of<br />
prearranged questions designed to seed and stimulate audience participation. Plenary sessions that were aimed at general<br />
science topics rather than focused <strong>SCEC</strong> collaboration goals, though interesting, were perceived to be less successful.<br />
Size of the annual meeting<br />
The <strong>SCEC</strong> meeting is very popular, and continues to grow in size each year. On the positive side, this reflects the steady<br />
growth in interest in <strong>SCEC</strong> and <strong>SCEC</strong> activities. On the negative side, the meeting is already much larger than a “small<br />
30 | Southern California Earthquake Center
<strong>SCEC</strong> Advisory Council | Report<br />
meeting”, and if the meeting grows too much larger it may be difficult to manage. Yet any attempt to limit the size of the<br />
meeting would require difficult and awkward choices.<br />
When thinking about the size and scope of the annual meeting the most critical question to keep in mind is whether this<br />
meeting continues to meet the focused needs of the <strong>SCEC</strong> collaboration. In our assessment, it still does even at the present size,<br />
although science planning sessions are difficult with such a large group. That was not a serious problem this year, but because<br />
the next meeting or two will focus on <strong>SCEC</strong>4 plans and priorities it will be important to ensure that there is still an effective<br />
forum for participating <strong>SCEC</strong> scientists to provide input and feedback on the collaboration science plans and priorities.<br />
Otherwise, the general participants could begin to feel that these are set behind closed doors rather than in an open process.<br />
Final Comments<br />
It is the current sense of the Advisory Council that the researchers and, particularly, the senior leadership of <strong>SCEC</strong> are doing<br />
an outstanding job. The many individuals now leading committees and focus groups constitute a broadly diverse, extremely<br />
able, and committed group. The Advisory Council applauds <strong>SCEC</strong>'s continued role in catalyzing and supporting special<br />
projects such as UCERF3, high performance computing, and CSEP. Developing new support for these kinds of activities are<br />
essential to growing the community of scientists who are engaged in earthquake science and to leverage the knowledge and<br />
understanding developed in <strong>SCEC</strong>.<br />
The Advisory Council is pleased to continue to provide assistance to <strong>SCEC</strong> in its efforts to formulate and accomplish the<br />
center’s major goals. At any time the Council welcomes comments, criticism, and advice from the <strong>SCEC</strong> funders as well as the<br />
seismological community, including individuals and groups both inside and outside <strong>SCEC</strong> membership, on how best to<br />
provide that assistance.<br />
The Advisory Council welcomes new members Roger Bilham, University of Colorado; Meghan Miller, UNAVCO; Farzad<br />
Naeim, John A. Martin & Associates; John Vidale, University of Washington; Andrew Whitaker, University of Buffalo. We<br />
regretfully say goodbye to Patti Guatteri, Swiss Re; John Rudnicki, Northwestern University; and Lloyd Cluff; Pacific Gas and<br />
Electric. Patti and John in particular have been very active members of AC for a number of years and we will miss their input<br />
and perspective. We all look forward to working with <strong>SCEC</strong> leadership in helping successfully launching <strong>SCEC</strong>4 and in<br />
helping ensure that the products and accomplishments of the center are well-documented and widely disseminated.<br />
Finally, on a personal note, as of this meeting Mary Lou Zoback is stepping down from the AC and as the chair. This transition<br />
is bittersweet; I am balancing the value of rotational leadership with the opportunity to be part of the exciting scientific dialog<br />
that is the <strong>SCEC</strong> collaboration. It has been an honor and a privilege to serve <strong>SCEC</strong> in this capacity. I depart the AC knowing I<br />
leave it in the very able hands of Jeff Freymueller.<br />
2011 <strong>SCEC</strong> <strong>Annual</strong> <strong>Meeting</strong> | 31
Report | Communication, Education, and Outreach<br />
<strong>SCEC</strong> Communication, Education, and Outreach<br />
Mark Benthien / Robert de Groot<br />
CEO Director for <strong>SCEC</strong> / CEO Education Programs Manager<br />
Introduction<br />
The <strong>SCEC</strong> Communication, Education, and Outreach (CEO) program has four long-term goals:<br />
• Coordinate productive interactions among a diverse community of <strong>SCEC</strong> scientists and with partners in science,<br />
engineering, risk management, government, business, and education;<br />
• Increase earthquake knowledge and science literacy at all educational levels, including students and the general<br />
public;<br />
• Improve earthquake hazard and risk assessments; and<br />
• Promote earthquake preparedness, mitigation, and planning for response and recovery.<br />
These goals are pursued through activities <strong>org</strong>anized within four CEO focus areas: Research Partnerships coordinated within<br />
the <strong>SCEC</strong> Seismic Hazard & Risk Analysis focus group; Knowledge Transfer activities with practicing professionals,<br />
government officials, scientists and engineers; Public Outreach activities and products for the general public, civic and<br />
preparedness groups, and the news media; Education programs and resources for students, educators, and learners of all ages,<br />
including the Experiential Learning and Career Advancement office which coordinates undergraduate and graduate<br />
internships and support for early career scientists. Many activities span more than one CEO focus area.<br />
Partnerships are key to achieving <strong>SCEC</strong>’s mission, research objectives, and outreach goals. These partners include other<br />
science <strong>org</strong>anizations (e.g. IRIS, EarthScope, and UNAVCO), engineering <strong>org</strong>anizations (e.g. PEER and EERI), education<br />
<strong>org</strong>anizations (e.g. Los Angeles County Unified School District, California Department of Education, museums, and the<br />
National Association of Geoscience Teachers), and public service / risk management <strong>org</strong>anizations (e.g. California Emergency<br />
Management Agency, the California Earthquake Authority, FEMA, and the American Red Cross).<br />
Immediately following the 2009 <strong>SCEC</strong> <strong>Annual</strong> <strong>Meeting</strong>, a major review meeting was held of the <strong>SCEC</strong> CEO program. An<br />
extensive evaluation document was prepared in summer 2009 by evaluation consultants, which an external review panel used<br />
as the basis of its analysis. The review panel’s report was quite thorough and provided several excellent recommendations.<br />
Overall, they concluded that “It is the strong consensus of the review committee that the <strong>SCEC</strong> CEO program has been an<br />
overwhelming success both in terms of breadth and impact.” The <strong>SCEC</strong> Advisory Council commented that “the review<br />
strongly indicates that <strong>SCEC</strong> has demonstrated success in meeting the Broader Impacts criterion of NSF reviews, has become a<br />
leading force in education and outreach efforts related to earthquake science in Southern California, and has set a standard for<br />
others to emulate in all of California or elsewhere.” The review was very important to the <strong>SCEC</strong>4 proposal process and was<br />
supported with funding from the NSF.<br />
The following are highlights of <strong>SCEC</strong>’s Public Outreach and Education activities in the last year.<br />
Public Outreach Activities<br />
Great (Southern & Statewide) California ShakeOut. A major focus of the CEO<br />
program since 2008 has been <strong>org</strong>anizing the Great California ShakeOut drills and<br />
coordinating closely with ShakeOuts in other states and countries. The purpose of the<br />
Shakeout is to motivate all Californians to practice how to protect ourselves during<br />
earthquakes (“Drop, Cover, and Hold On”), and to get prepared at work, school, and<br />
home.<br />
Immediately following the 2008 ShakeOut (initially conceived as a “once-in-a-lifetime”<br />
32 | Southern California Earthquake Center
Communication, Education, and Outreach | Report<br />
event), participants began asking for the date of the 2009 ShakeOut. After significant discussion among ECA partners and<br />
state agencies, the decision was made to <strong>org</strong>anize an annual, statewide Shakeout drill to occur on the third Thursday of<br />
October (October 20th1in 2011). This date is ideal for our school partners and follows National Preparedness Month in<br />
September, which provides significant exposure prior to the drill (in 2011 we are partnering with FEMA for a “National<br />
ShakeOut Registration Week” at the end of September, to encourage participation in all planned ShakeOuts).<br />
The initial statewide expansion was more complicated than simply deleting the word “Southern” from all materials and<br />
webpages. The 2008 ShakeOut was based on a single earthquake scenario, which does not apply to the entire state. Thus, 11<br />
“ShakeOut Information Areas” were created, based on earthquake hazards, geography, media markets, and other factors, to<br />
provide local hazard information for participants throughout California. The redesigned ShakeOut.<strong>org</strong> website contains a<br />
description of each area’s earthquake hazard and ShakeOut registration statistics down to the county level.<br />
In addition, expanding statewide required considerable partnership development with state agencies and regional alliances.<br />
As described below, the Earthquake Country Alliance, which has also expanded statewide, is the primary <strong>org</strong>anization behind<br />
the ShakeOut, connecting four regional alliances. The group works together to coordinate messaging and develop resources.<br />
7.9 million people participated in the 2010 ShakeOut, up from 6.9 million in 2009. Many participants renew their participation<br />
each year, with nearly 5.5 million being staff and students from K-12 schools. The rest are people and <strong>org</strong>anizations that<br />
typically do not have earthquake drills. . In addition to registered participants, millions more see or hear about the ShakeOut<br />
via the news media. A list of over 300 print and online news stories is available on the ShakeOut web page, which in 2010<br />
included a front-page photo in the New York Times. More than 500 TV and radio news stories across the state and country<br />
aired in the days surrouding the drill. A lengthy story on CBS Sunday Morning featured the ShakeOut.<br />
Recruitment is well underway for the 2011 ShakeOut, with over 7.1 million participants registered as of August 31. The goal is<br />
to exceed at least 9 million.<br />
The ShakeOut’s impact has been more than just as a one-day event. Each registered participant receives periodic reminders<br />
leading up to the ShakeOut as well as drill instructions, preparedness information and access to a host of resources available<br />
on the ShakeOut website. Participants can download a soundtrack to play during their Drop, Cover, and Hold On Drill,<br />
ShakeOut posters and flyers, and web banners to place on their own websites encourage others to participate. ShakeOut flyers<br />
are available in many versions including custom flyers for schools, individuals and families, businesses, state and local<br />
government, retirement communities, museums and libraries and many other participant categories. We have also made<br />
information available in Spanish, Korean, Vietnamese, and Chinese. The ECA has also created several drill manuals for<br />
schools, non-profits, businesses, and government agencies, respectively. Each version of the manual has information specific<br />
to the type of institution and has multiple drill levels, from a simple drill, to an advanced emergency simulation drill. These<br />
manuals include topics for discussion among the <strong>org</strong>anizations leaders, evacuation procedures, and suggestions for making<br />
the simulation more engaging for employees or students.1Access to these important earthquake resources is one of the most<br />
important benefits of being involved in the ShakeOut.<br />
The ShakeOut has been so successful that it has spread across the<br />
country, and even around the world. In October 2010 Nevada<br />
(110,000 participants) and Guam (38,000) joined with California, In<br />
January 2011, Oregon (38,000) and British Columbia (470,000) held<br />
drills to commemorate the anniversary of the 1700 Cascadia<br />
earthquake, and in April 2011 eleven states of the Central and<br />
Southern U.S. (Alabama, Arkansas, Ge<strong>org</strong>ia, Illinois, Indiana,<br />
Kentucky, Mississippi, Missouri, Oklahoma, South Carolina, and<br />
Tennessee) commemorated the 1811-1812 New Madrid earthquake<br />
bicentennial with a ShakeOut drill that grew to 3 million<br />
participations. Idaho will hold its first ShakeOut in October 2011 and<br />
Utah in April 2012. All of these areas are now holding ShakeOut drills<br />
annually (see www.shakeout.<strong>org</strong>/regions). Other areas considering<br />
ShakeOut drills include Washington (2012), Alaska (2014), and also Hawaii, Puerto Rico, New Zealand (2012), and Turkey.<br />
The ECA is now collaborating with colleagues in Tokyo, to help them coordinate their first ShakeOut on the one-year<br />
2011 <strong>SCEC</strong> <strong>Annual</strong> <strong>Meeting</strong> | 33
Report | Communication, Education, and Outreach<br />
anniversary of March 2011 devastating earthquake and tsunami. ShakeOut is changing the way people and <strong>org</strong>anizations are<br />
approaching the problems of earthquake preparedness.<br />
The ShakeOut has been the focus of significant media attention and has gone a long way to encourage dialogue about<br />
earthquake preparedness in California. Through the ShakeOut, the ECA does more than simply inform Californians about<br />
their earthquake risk. The ShakeOut teaches people a life-saving response behavior while fostering a sense of community that<br />
facilitates further dialogue and preparedness, and as such is an effective structure for advocacy of earthquake preparedness<br />
and mitigation.<br />
Putting Down Roots in Earthquake Country. In 1995 <strong>SCEC</strong>, the USGS, and a large group of partners led by Lucy Jones<br />
(USGS) developed and distributed 2 million copies of a 32-page color handbook on earthquake science, mitigation and<br />
preparedness. Funding was primarily from the National Science Foundation and USGS. The booklet was distributed through<br />
libraries, preparedness partners, cities, companies, and directly to individuals through <strong>SCEC</strong>.<br />
The creation of the Earthquake Country Alliance in 2003 was concurrent with the desire to update<br />
Putting Down Roots in advance of the 10th anniversary of the Northridge earthquake. The process<br />
brought the ECA together to develop consensus messaging and notably introduced the “Seven Steps<br />
to Earthquake Safety,” which has become a standard approach to <strong>org</strong>anizing earthquake<br />
preparedness messaging. Since 2004, the booklet has undergone six additional revisions and<br />
printings. The Fall, 2008, version included the ShakeOut Scenario and an overview of the Uniform<br />
California Earthquake Rupture Forecast study led by <strong>SCEC</strong>. The April, 2011, version includes new<br />
tsunami science and preparedness content.<br />
Putting Down Roots has been widely distributed through newspaper inserts, museums, schools, at<br />
events <strong>org</strong>anized by <strong>SCEC</strong> and ECA partners, and via an online order form. Over 2.5 million copies<br />
have been distributed since 2004, and an additional 1.25 million copies in Spanish have been distributed. Printing and<br />
distribution of the booklet was made possible by generous support of the California Earthquake Authority and additional<br />
funding from the Federal Emergency Management Agency (FEMA), and the USGS. The handbook is available at<br />
www.earthquakecountry.info/roots as an online version and downloadable PDF, and printed copies can be ordered for free<br />
through an online request form.<br />
Putting Down Roots is the principal <strong>SCEC</strong> framework for providing earthquake science, mitigation, and preparedness<br />
information to the public. The “Roots” framework extends beyond the distribution of a printed brochure and the online<br />
version. For example, the Birch Aquarium in San Diego developed an earthquake exhibit that featured a “Seven Steps” display,<br />
similar to <strong>SCEC</strong>’s “ShakeZone” exhibit at the Fingerprints Youth Museum in Hemet, CA. The Emergency Survival Program<br />
(managed by LA County) based its 2006 and 2009 campaigns around the “Seven Steps.”<br />
The new version of Putting Down Roots was designed to allow other regions to adopt and adapt its structure<br />
to create additional versions. The first is a Greater San Francisco Bay Area version produced by a<br />
partnership led by the USGS with <strong>SCEC</strong>, local and state emergency managers, the Red Cross and<br />
many other <strong>org</strong>anizations. Over 2.3 million copies have been printed, many distributed in<br />
newspapers, with funding from the California Earthquake Authority, USGS, FEMA, Red Cross,<br />
OES, CGS, and several others). In addition, a new booklet, Protecting Your Family From<br />
Earthquakes–The Seven Steps to Earthquake Safety, was produced in 2006 as part of the Putting<br />
Down Roots series, in two versions - English and Spanish in one booklet, and English, Chinese,<br />
Korean, and Vietnamese in another booklet. All Bay Area booklets can also be accessed from<br />
www.earthquakecountry.info/roots. All printings of the Bay Area version to date have been coordinated<br />
through <strong>SCEC</strong>.<br />
Other versions have also been produced, and can be downloaded from the Roots website:<br />
• The Utah Seismic Safety Commission in 2008 produced the first version of Putting Down Roots outside of California,<br />
which in turn was adapted in 2010 by the State of Idaho for their version of Putting Down Roots.1Also in 2010, the<br />
USGS developed a1Central United States version in time for the New Madrid Bicentennial.<br />
34 | Southern California Earthquake Center
Communication, Education, and Outreach | Report<br />
• Living on Shaky Ground, an update to the well-known earthquake booklet for California’s North Coast, now including<br />
the Seven Steps to Earthquake Safety, has been in development for several years and is subtitled “Part of the Putting<br />
Down Roots in Earthquake Country Series.”1This booklet has also been adapted by Oregon.1<br />
Finally, <strong>SCEC</strong> and ECA partners have developed a new supplement to Putting Down Roots (and the<br />
Living on Shaky Ground booklets as well), titled The Seven Steps to an Earthquake Resilient Business, an<br />
exciting new 16-page guide for businesses to develop comprehensive earthquake plans, printed in Fall,<br />
2008. This booklet is the first non-regional publication, created as a supplement to all Putting Down<br />
Roots or other materials that include the Seven Steps to Earthquake Safety. It can be also downloaded<br />
and ordered from www.earthquakecounty.info/roots.<br />
Earthquake Country Alliance. The ECA is a public-private partnership of people, <strong>org</strong>anizations, and<br />
regional alliances, each of which are committed to improving preparedness, mitigation, and<br />
resiliency.1The ECA was created in 2003 to coordinate efforts in southern California, and grew statewide in early 2009 in<br />
partnership with similar groups in the Bay Area and North Coast. People, <strong>org</strong>anizations, and regional alliances of the ECA<br />
collaborate in many ways: sharing resources; committing funds; and volunteering significant time towards common<br />
activities.1ECA’s mission is to support and coordinate efforts that improve earthquake and tsunami resilience. The Earthquake<br />
Country Alliance is now the primary <strong>SCEC</strong> mechanism for maintaining partnerships and developing new products and<br />
services for the general public.<br />
<strong>SCEC</strong> has played a key role in the development of the ECA, beginning in 2003 when <strong>SCEC</strong> convened formative meetings with<br />
many key partners at USC and created the original ECA website, in advance of the ten-year anniversary of the Northridge<br />
earthquake. This role has continued as materials, activities, and new partnerships have been developed and expanded.1<strong>SCEC</strong><br />
develops and maintains all ECA websites (www.earthquakecountry.<strong>org</strong>, www.shakeout.<strong>org</strong>, www.dropcoverholdon.<strong>org</strong>, and<br />
www.terremotos.<strong>org</strong>), has managed the printing of the “Putting Down Roots” publication series throughout the state, and<br />
coordinated key aspects of ShakeOut recruitment, content development, and customer support, including support for<br />
ShakeOut efforts in other regions.<br />
Feedback from selected ECA members collected through interviews in 2009 indicate that the foundation and development of<br />
the ECA benefited greatly from <strong>SCEC</strong>’s leadership, credibility and reputation as a trusted science and research consortium. As<br />
a non-governmental entity, <strong>SCEC</strong> is viewed as a ‘neutral’ and trusted leader, who employs a collaborative model for<br />
<strong>org</strong>anizing stakeholders around a common cause. <strong>SCEC</strong> brings value to the collaborative by providing science-based<br />
information about earthquakes, incorporating this information in the development of materials and tools, and contributing<br />
human and material resources.<br />
ECA members have also commented that the grassroots approach employed by <strong>SCEC</strong> in the development of the ECA has<br />
created a ‘flexible’ environment, with added value for its members that include: a) networking, b) coordination, c) ability to<br />
participate at different levels and in varying roles over time (fluid participation), d) opportunities to contribute to the dialogue<br />
about hazard preparedness, response and mitigation, e) ability to adapt information and materials to local contexts and for<br />
local audiences, f) and publicity.<br />
In November 2010, the ECA held a Strategic Planning Workshop to discuss next steps for the <strong>org</strong>anization’s expanding<br />
programs and to increase engagement in the planning, management, and funding of initiatives. In this Workshop, the five<br />
researched solutions presented and discussed included the ECA becoming a 1) 501(c)(3) non-profit; 2) a 501(c)(4) non-profit; 3)<br />
a 501(c)(6) non-profit; 4) remaining as the same structure- a loosely <strong>org</strong>anized confederation that cannot accept/administer<br />
grant funds directly; or, 5) becoming a program of <strong>SCEC</strong> under as part of <strong>SCEC</strong>’s USC-based structure. Pros and cons were<br />
listed for all options looking at management, funding/budget, legal, governmental requirements, and other implications. The<br />
unanimous consensus of ECA leadership was to <strong>org</strong>anize the ECA at USC to be administered by <strong>SCEC</strong>, under the direction of<br />
a statewide Steering Committee made up of regional ECA leaders, with these considerations:<br />
• Recognize the diverse and voluntary nature and size of ECA’s component <strong>org</strong>anizations and allow participation<br />
by the widest possible net of stakeholders, with an emphasis on regional groupings;<br />
• Acknowledge that although most ECA Associates represent <strong>org</strong>anizations, certain <strong>org</strong>anizations need a role in<br />
the management structure;<br />
2011 <strong>SCEC</strong> <strong>Annual</strong> <strong>Meeting</strong> | 35
Report | Communication, Education, and Outreach<br />
• Minimize the size and role of the statewide effort in favor of supporting and connecting component<br />
<strong>org</strong>anizations and regional alliances;<br />
• Foster information sharing and provide effective and direct means of communication within and among ECA<br />
groups.<br />
ECA Associates benefit from their participation by coordinating their programs with larger activities to multiply their impact;<br />
being recognized for their commitment to earthquake and tsunami risk reduction; having access to a variety of resources on<br />
earthquake and tsunami preparedness; networking with earthquake professionals, emergency managers, government officials,<br />
business and community leaders, public educators, and many others; and connecting with ECA sector-based committees to<br />
develop customized materials and activities. To participate, visit www.earthquakecountry.<strong>org</strong>/alliance/join.html.<br />
Media Relations. <strong>SCEC</strong> engages local, regional and national media <strong>org</strong>anizations (print, radio and television) to jointly<br />
educate and inform the public about earthquake-related issues. The goal has been to communicate clear, consistent messages<br />
to the public–both to educate and inform, and to minimize misunderstandings or the perpetuation of myths. <strong>SCEC</strong> CEO<br />
encourages scientists who are interested in conducting interviews with media reporters and writers to take advantage of short<br />
courses designed and taught by public information professionals.<br />
Education Program<br />
<strong>SCEC</strong> and its expanding network of education partners are committed to fostering increasing earthquake knowledge and<br />
science literacy at all grade levels and in a variety of educational environments.<br />
The <strong>SCEC</strong> Education program uses the research literature (science education, learning psychology, sociology, etc.) and<br />
evaluation methodology to:<br />
• Develop new materials and products (e.g. lesson plans, evaluation instruments, websites) where needed.<br />
• Collaborate with partner <strong>org</strong>anizations to enhance existing materials or products to meet the needs for <strong>SCEC</strong>’s<br />
Earthquake Program mission.<br />
• Utilize and promote existing materials that coincide with or complement <strong>SCEC</strong>’s earthquake K-12 Education<br />
Program mission.<br />
• Provide innovative experiential learning opportunities to undergraduate and graduate students during the<br />
summer and year-round.<br />
<strong>SCEC</strong> Education programs include internship programs, facilitated activities at museum exhibits, earthquake education<br />
workshops, public earthquake talks, and activities at conferences such as the National Science Teachers Association. <strong>SCEC</strong><br />
Education programs and products are implemented in a variety of educational environments- any place, situation, or context<br />
where the transmission of knowledge to learners is taking place.<br />
<strong>SCEC</strong> Experiential Learning and Career Advancement<br />
Programs<br />
Since 1994, <strong>SCEC</strong> has provided 457 internships to undergraduate and graduate<br />
students (some students participate in multiple years and are counted each<br />
time), with 384 internships since 2002 (charts included here are for 2002-2009<br />
only). <strong>SCEC</strong> currently offers two summer internship programs (<strong>SCEC</strong>/SURE<br />
and <strong>SCEC</strong>/UseIT) and in 2010 completed a year-round program for both<br />
undergraduate and graduate students (ACCESS). These programs are the<br />
principal framework for undergraduate student participation in <strong>SCEC</strong>, and<br />
have common goals of increasing diversity and retention. In addition to their<br />
research projects, participants come together several times during their<br />
internship for orientations, field trips, and to present posters at the <strong>SCEC</strong><br />
<strong>Annual</strong> meeting. Students apply for both programs at<br />
www.scec.<strong>org</strong>/internships.<br />
36 | Southern California Earthquake Center
Communication, Education, and Outreach | Report<br />
The <strong>SCEC</strong> Summer Undergraduate Research Experience (<strong>SCEC</strong>/SURE) has supported 221 students to work one-on-one as<br />
student interns with1<strong>SCEC</strong> scientists since 1994 (150 since 2002). <strong>SCEC</strong>/SURE has supported students working on numerous<br />
projects in earthquake science, including the history of earthquakes on faults, risk mitigation, seismic velocity modeling,<br />
science education, and earthquake engineering.<br />
The <strong>SCEC</strong> Undergraduate Studies in Earthquake Information Technology (<strong>SCEC</strong>/UseIT) program, unites undergraduates<br />
from across the country in an NSF REU Site at USC. <strong>SCEC</strong>/UseIT interns interact in a team-oriented research environment<br />
with sme of the nation's most distinguished geoscience and computer science researchers. Since 2002, 167 students have<br />
participated. Research activities are structured around “Grand Challenges” in earthquake information technology. Each<br />
summer the interns build upon the foundation laid by previous intern classes to design and engineer increasingly<br />
sophisticated visualization tools.<br />
Our UseIT and CME experience identified a “weak link” in cyberinfrastructure (CI)-related career pathways: the transition<br />
from discipline-oriented undergraduate degree programs to problem-oriented graduate studies in earthquake system science.<br />
We worked to address this educational linkage problem through a CI-TEAM implementation project entitled the<br />
Advancement of Cyberinfrastructure Careers through Earthquake System Science (ACCESS) which ended in late 2010 with 29<br />
internships having been awarded. The objective of the ACCESS project was to provide a diverse group of students with<br />
research experiences in earthquake system science that will advance their careers and encourage their creative participation in<br />
cyberinfrastructure development. Its overarching goal was to prepare a diverse, CI-savvy workforce for solving the<br />
fundamental problems of system science. Undergraduate (ACCESS-U) internships support CI-related research in the <strong>SCEC</strong><br />
Collaboratory by undergraduate students working toward senior theses or other research enhancements of the bachelor’s<br />
degree. Graduate (ACCESS-G) internships supported up to one year of CI-related research in the <strong>SCEC</strong> Collaboratory by<br />
graduate students working toward a master’s thesis.<br />
Earthquake Exhibits and Museum Partnerships<br />
Recognizing the key role that museums have in engaging communities not often reached by schools, <strong>SCEC</strong> facilitates a<br />
network of museums and other locations interested in providing earthquake education programming. These <strong>org</strong>anizations<br />
also serve as a distribution point for <strong>SCEC</strong> resources such as Roots. <strong>SCEC</strong> has worked with some of these partners for many<br />
years, and in summer 2008 they have been <strong>org</strong>anized as Earthquake Education and Public Information Centers (Earthquake<br />
EPIcenters). The concept emerged during the planning of the 2008 Great Southern California ShakeOut, and the need to<br />
<strong>org</strong>anize museums for the ShakeOut has evolved into a year-round interaction with the ShakeOut being the culminating<br />
community event for the year. The ShakeOut has provided a basis for institutions to share resources and expertise<br />
Northern California respectively.<br />
EPIcenters share a commitment to demonstrating and<br />
encouraging earthquake preparedness. They help coordinate<br />
Earthquake Country Alliance activities in their county or region<br />
(including the ShakeOut), lead presentations or <strong>org</strong>anize events<br />
in their communities, or in other ways demonstrate leadership in<br />
earthquake education and risk reduction. EPIcenters are found in<br />
a variety of public meeting places such as museums, science<br />
centers, libraries, and universities. Just as the ShakeOut became a<br />
statewide effort in 2009 so did the EPIcenter Network. Currently<br />
over 60 free-choice learning institutions statewide participate in<br />
the ShakeOut and other activities throughout the year. The<br />
statewide Network is coordinated by <strong>SCEC</strong> Education Program<br />
Manager Robert de Groot with Kathleen Springer (San<br />
Bernardino County Museum) and Candace Brooks (The Tech<br />
Museum) coordinating Network activities in Southern and<br />
<strong>SCEC</strong>’s first major project in the development of a free choice-learning venue was the Wallace Creek Interpretive Trail. In<br />
partnership with the Bureau of Land Management (BLM), <strong>SCEC</strong> designed an interpretive trail along a particularly spectacular<br />
and accessible 2 km long stretch of the San Andreas Fault near Wallace Creek. Wallace Creek is located on the Carrizo Plain, a<br />
3-4 hour drive north from Los Angeles. The trail opened in January 2001. The area is replete with the classic landforms<br />
2011 <strong>SCEC</strong> <strong>Annual</strong> <strong>Meeting</strong> | 37
Report | Communication, Education, and Outreach<br />
produced by strike-slip faults: shutter ridges, sag ponds, simple offset stream channels, mole tracks and scarps. <strong>SCEC</strong> created<br />
the infrastructure and interpretive materials (durable signage, brochure content, and a website at www.scec.<strong>org</strong>/wallacecreek<br />
with additional information and directions to the trail). BLM has agreed to maintain the site and print the brochure into the<br />
foreseeable future.<br />
The ShakeZone Earthquake Exhibit at Fingerprints Youth Museum in Hemet, CA was developed originally in 2001, was<br />
redesigned in 2006, and was retired from display in 2011. The redesigned version of the exhibit is based on <strong>SCEC</strong>’s Putting<br />
Down Roots in Earthquake Country handbook. Major partners involved in the exhibit redesign included Scripps Institution of<br />
Oceanography and Birch Aquarium at Scripps. With funding from the United Way and other donors ShakeZone will be<br />
expanded in 2010 to include a section on Earthquake Engineering.<br />
In 2006 <strong>SCEC</strong> has embarked on a long-term collaboration with the San Bernardino County Museum (SBCM) in Redlands,<br />
California. <strong>SCEC</strong> participated in the development and implementation of Living on the Edge Exhibit. This exhibit explains<br />
and highlights natural hazards in San Bernardino County (e.g. fire, floods, and earthquakes). <strong>SCEC</strong> provided resources in the<br />
development phase of the project and continues to supply the exhibit with copies of Putting Down Roots in Earthquake Country.<br />
As a result of the successful collaboration on Living on the Edge, <strong>SCEC</strong> was asked to participate in the development of SBCM’s<br />
Hall of Geological Wonders. To be completed in 2012, the Hall is a major expansion of this important cultural attraction in the<br />
Inland Empire. One of the main objectives of the Hall is to teach about the region from a geologic perspective. The museum is<br />
devoting a large space to the story of Southern California's landscape, its evolution and dynamic nature. <strong>SCEC</strong> has played an<br />
ongoing advisory role, provided resources for the development of the earthquake sections of the exhibit, and will have an<br />
ongoing role in the implementation of educational programming<br />
The most recent debut of an EPIcenter earthquake display is the Earthquake Information Center at the Rancho Mirage Public<br />
Library in Rancho Mirage, CA. This exhibit, created in partnership with the City of Rancho Mirage, features a computer screen<br />
showing recent worldwide and local earthquakes. Located in the computer resource room this exhibit also displays the seven<br />
steps to earthquake safety and components of a basic earthquake disaster supply kit. Many hundreds of local residents from<br />
the desert communities pass by the exhibit every day on their way to accessing other resources in the library. Recently,<br />
the1Development of other EPIcenter exhibits and resource areas are occurring at the The California Science Center, Los<br />
Angeles, and the Natural History Museum of Los Angeles County.<br />
K-12 Education Partnerships and Activities<br />
Partnerships with Science Education Advocacy Groups and Organizations with Similar Missions. <strong>SCEC</strong> is an active<br />
participant in the broader earth science education community including participation in <strong>org</strong>anizations such as the National<br />
Association of Geoscience Teachers, the Coalition for Earth System Education, and local and national science educator<br />
<strong>org</strong>anizations (e.g. NSTA). Improvement in the teaching and learning about earthquakes hinges on improvement in earth<br />
science education in general. Hence, <strong>SCEC</strong> contributes to the community through participation on outreach committees<br />
wherever possible, co-hosting meetings or workshops, and building long-term partnerships. An example of a current project is<br />
a partnership with EarthScope to host a San Andreas Fault workshop for park and museum interpreters that was held in<br />
Spring 2009. In 2010 <strong>SCEC</strong> is collaborating with IRIS and EarthScope in developing the content for the San Andreas fault<br />
Active Earth Kiosk. The Active Earth Kiosk is an interactive website where visitors learn about earth hazards in a particular<br />
region. EarthScope is creating an Active Earth Kiosk for each of the regions covered by its Interpretive Workshops. Also in<br />
2010 Arizona State University, the OpenTopography Facility, and <strong>SCEC</strong> developed three earth science education products to<br />
inform students and other audiences about LiDAR and its application to active tectonics research. First, a 10-minute<br />
introductory video titled LiDAR: Illuminating Earthquakes was produced and is freely available online. The second product is<br />
an update and enhancement of the Wallace Creek Interpretive Trail website. LiDAR topography data products have been<br />
added along with the development of a virtual tour of the offset channels at Wallace Creek using the B4 LiDAR data within<br />
the Google Earth environment. Finally, the virtual tour to Wallace Creek is designed as a lab activity for introductory<br />
undergraduate geology courses to increase understanding of earthquake hazards through exploration of the dramatic offset<br />
created by the San Andreas Fault (SAF) at Wallace Creek and Global Positioning System-derived displacements spanning the<br />
SAF at Wallace Creek. This activity is currently being tested in courses at Arizona State University. The goal of the assessment<br />
is to measure student understanding of plate tectonics and earthquakes after completing the activity. Including high-<br />
38 | Southern California Earthquake Center
Communication, Education, and Outreach | Report<br />
resolution topography LiDAR data into the earth science education curriculum promotes understanding of plate tectonics,<br />
faults, and other topics related to earthquake hazards.<br />
Teacher Workshops. <strong>SCEC</strong> offers teachers 2-3 professional development workshops each year with one always held at the<br />
<strong>SCEC</strong> <strong>Annual</strong> <strong>Meeting</strong>. The workshops provide connections between developers of earthquake education resources and those<br />
who use these resources in the classroom. The workshops include content and pedagogical instruction, ties to national and<br />
state science education standards, and materials teachers can take back to their classrooms Workshops are offered concurrent<br />
with <strong>SCEC</strong> meetings, at National Science Teachers Association annual meetings, and at the University of Southern California.<br />
In 2003 <strong>SCEC</strong> began a partnership with the Scripps Institution of Oceanography Visualization Center to develop teacher<br />
workshops. Facilities at the Visualization Center include a wall-sized curved panorama screen (over 10m wide). The most<br />
recent teacher workshop held in partnership with Mt. San Antonio College was held in April 2010 at the GSA Cordilleran<br />
Section meeting.<br />
Since 2009, <strong>SCEC</strong> has been collaborating with the Cal State San Bernardino/EarthScope RET program led by Sally McGill.<br />
During the course of the summer 7-10 high school teachers and their students conduct campaign GPS research along the San<br />
Andreas and San Jacinto faults. <strong>SCEC</strong> facilitates the education portion of the project through the implementation of the<br />
professional development model called Lesson Study. This allows for interaction with the teachers for an entire year following<br />
their research. For the second year all of the members of the RET cohort participate in the <strong>SCEC</strong> <strong>Annual</strong> <strong>Meeting</strong> by doing<br />
presentation of their research, participating in meeting activities such as talks and works culminating in presenting their<br />
research at one of the evening poster sessions.<br />
Sally Ride Science Festivals. Attended by over 1000 middle school age girls (grades 5–8) at each venue, Sally Ride Science<br />
Festivals offer a festive day of activities, lectures, and social activities emphasizing careers in science and engineering. Since<br />
2003, <strong>SCEC</strong> has presented workshops for adults and students and participated in the Festival’s “street fair,” a popular venue<br />
for hands-on materials and science activities. At the street fair <strong>SCEC</strong> demonstrates key concepts of earthquake science and<br />
provides copies of Putting Down Roots in Earthquake Country. The workshops, presented by female members of the <strong>SCEC</strong><br />
community share the excitement and the many career opportunities in the Earth sciences.<br />
National Science Teachers Association and California Science Teachers Association. Earthquake concepts are found in<br />
national and state standards documents. For example, earthquake related content comprises the bulk of the six grade earth<br />
science curriculum in California. <strong>SCEC</strong> participates in national and statewide science educator conferences to promote<br />
innovative earthquake education and communicate earthquake science and preparedness to teachers in all states.<br />
Development of Educational Products<br />
Earthquake Country - Los Angeles Video Kit. The video, produced by Dr. Pat Abbott of<br />
SDSU, tells the story of how the mountains and valleys of the Los Angeles area formed, and the<br />
important role of earthquakes. The video features aerial photography, stunning computer<br />
animations (some produced by <strong>SCEC</strong>’s USEIT interns), and interviews with well-known experts.<br />
<strong>SCEC</strong> developed an educator kit for school and community groups, available online and<br />
provided at <strong>SCEC</strong>’s teacher workshops.<br />
Plate Tectonics Kit. This new teaching tool was created to make plate tectonics activities more<br />
accessible for science educators and their students. <strong>SCEC</strong> developed a user-friendly version of<br />
the This Dynamic Earth map, which is used by many educators in a jigsaw-puzzle activity to<br />
learn about plate tectonics, hot spots, and other topics. At <strong>SCEC</strong>’s teacher workshops, educators<br />
often suggested that lines showing the location of plate boundary on the back of the maps<br />
would make it easier for them to correctly cut the map, so <strong>SCEC</strong> designed a new (two-sided)<br />
map and developed an educator kit.<br />
2011 <strong>SCEC</strong> <strong>Annual</strong> <strong>Meeting</strong> | 39
Report | <strong>SCEC</strong> Research Accomplishments<br />
Research Accomplishments<br />
Southern California Earthquake Center<br />
2011 <strong>Annual</strong> Report<br />
This section summarizes the main research accomplishments and research-related activities during 2009 and the early months<br />
of 2010. The research reported here was funded by <strong>SCEC</strong> with 2010 research funds. While the presentation is <strong>org</strong>anized<br />
sequentially by disciplinary committees, focus groups, and special project working groups, it is important to note that most<br />
<strong>SCEC</strong> activities are crosscutting and could be presented under multiple focus groups.<br />
Disciplinary Activities<br />
The following reports summarize recent progress in the three main infrastructural activities and the discipline-oriented<br />
research, Seismology, Geodesy, and Geology.<br />
Seismology<br />
The objectives of the Seismology group are to gather data on the range of seismic phenomena observed in southern California<br />
and to integrate these data into physics-based models of fault slip. Researchers investigate seismicity across the network of<br />
southern California faults to explore spatial and temporal distribution of earthquakes and tremor, associated stress drops, and<br />
triggering etc. New methods are being developed to search for unusual signals using combined seismic, GPS, and borehole<br />
strainmeter data. In addition, near-fault crustal properties, fault structural complexity, and constraints on crustal structure and<br />
the state of stress are being explored. The seismology group is committed to the enhancement and continued operation of the<br />
SCEDC and other existing <strong>SCEC</strong> facilities particularly the near-real-time availability of earthquake data from SCEDC and<br />
automated access. Related work includes the enhancement of capability for earthquake early warning (EEW) systems and<br />
densification of seismic instrumentation. Below we highlight a subset of the recent research accomplishments.<br />
Seismicity Studies<br />
Figure 1. Major earthquake swarms in the Salton Trough since 1981. Examples<br />
of estimated seismicity migration vectors are plotted in red. These generally<br />
trend SW– NE at velocities of 0.1 to 0.5 km/hr.<br />
Shearer and Hauksson are producing an updated relocated reference catalog<br />
that will include accurate error estimates. More than 500,000 earthquakes are<br />
included between 1981-2010. The effort required the development of new<br />
analysis methods to mine efficiently the large dataset. Shearer et al. also<br />
explored major earthquake swarms that occurred in the Salton Trough since<br />
1981. They found that swarms typically last 1-20 days and that seismicity<br />
during a swarm migrates with time. Analysis of the migration shows that<br />
swarm migrations typically trend SW-NE at a rate of 0.1 to 0.5 km/hr (Figure 1).<br />
Hauksson et al. examine the Mw7.2 El Mayor-Cucapaph mainshock and<br />
aftershock sequence that began on 4 April 2010. They found that the mainshock<br />
was complex and triggered earthquakes to the north along the Elsinore and San<br />
Jacinto faults (Figure 2). The focal mechanisms of the mainshock and M4+<br />
aftershocks exhibit mostly northwest to west- northwest-striking dextral strikeslip<br />
faulting, although the faulting in the Yuha basin is in a region of northwest<br />
and northeast striking faults.<br />
40 | Southern California Earthquake Center<br />
Figure 1. Major earthquake swarms in the<br />
Salton Trough since 1981. Examples of<br />
estimated seismicity migration vectors are<br />
plotted in red. These generally trend SW–<br />
NE at velocities of 0.1 to 0.5 km/hr.
<strong>SCEC</strong> Research Accomplishments | Report<br />
Figure 2. (Left) Map of El Mayor sequence and the background seismicity from 1 Jan. to 21 Nov. 2010. (Right) Time-space<br />
plot of latitude versus time of El Mayor aftershocks triggered earthquakes to the north along the San Jacinto and Elsinore<br />
fault zones.<br />
Observations of Tremor in California<br />
Bürgmann et al. examine triggering of tremor and<br />
repeating earthquake sequences (RES) at Parfield. They<br />
explore whether tidal triggering of tremor occurs by<br />
comparing the timing of 600,000 low-frequency<br />
earthquakes (LFEs) reported in the Shelly and<br />
Hardebeck [2010] catalog. They find that the shear stress<br />
perturbations correlate with tremor occurrence better<br />
than normal stress perturbations (Figure 3). They also<br />
find that short-term triggering may occur between<br />
neighboring events as shown by the joint occurrence of<br />
RES and nearby background earthquakes. The<br />
immediate triggering of few second to minutes can<br />
happen when the separation distance is within a few km.<br />
When earthquakes are farther apart, triggering is less<br />
efficient.<br />
Peng et al. explore and compare triggered tremor in<br />
California. They find that along the San Andreas fault<br />
triggering generally occurs after the S-wave arrival with<br />
the most intense triggering during large-amplitude<br />
Figure 3. Along-fault section near Parkfield showing LFE locations colored<br />
by the percent excess value (Nex), the difference between the actual and<br />
expected number of events that occur under a particular tidal loading<br />
condition divided by the expected number of events. Positive Nex values<br />
indicate a surplus of events and negative values, a deficit. Values<br />
representing correlation of LFE occurrence with right-lateral shear stress<br />
(RLSS, top) and fault normal stress (FNS, bottom) are shown.<br />
2011 <strong>SCEC</strong> <strong>Annual</strong> <strong>Meeting</strong> | 41
Report | <strong>SCEC</strong> Research Accomplishments<br />
surface wave arrivals. They find an apparent migration of<br />
triggered LFEs along strike at 80 km/hr. The observation of<br />
triggered tremor on northern and southern California faults is<br />
less frequent and these tremor episodes have lower<br />
amplitudes (Figure 4).<br />
Cochran et al. are developing a neural network approach to<br />
detect tremor within continuous data. The approach uses Self<br />
Organizing Maps (SOMs) based on the work of Köhler et al<br />
[2009] to classify the time-series data into prototype vectors<br />
based on waveform characteristics including frequency<br />
content, amplitude, and polarization. These prototype vectors<br />
can then be associated with different signal types including<br />
earthquakes, tremor, and noise. The method is being applied<br />
to data collected during a temporary deployment of<br />
broadband instruments near Cholame, California.<br />
Fault Structure and Damage Zones<br />
Li et al. completed a detailed study of the on- and near-fault<br />
damage and healing at the San Andreas fault (SAF) Parkfield<br />
and the Longmen-Shan Fault (LSF) in Sichuan, both of which<br />
ruptured in the recent major earthquakes. Along the SAF,<br />
they find a waveguide that is interpreted to be a damage zone<br />
of reduced seismic velocities with a width of 100-200 m that<br />
extend to at least 7 km depth (Figure 5). The Wenchuan fault<br />
is found to have a 200-400 m wide damage zone with<br />
velocities reduced by up to 50% at shallow depths.<br />
Ma modeled the effect of heterogeneity of fault geometry on<br />
rupture dynamics in three dimensions with off-fault<br />
plasticity (Figure 6). He finds that fault roughness results in<br />
irregular rupture fronts that could result in greater highfrequency<br />
radiation. In addition, he finds that fault roughness<br />
results in more pulse-like ruptures due to rapid healing.<br />
Duan models the effect of off-fault damage and pore-pressure<br />
variations on the dynamics of parallel strike-slip faults. He<br />
finds that when effects of off-fault plastic yielding and timedependent<br />
pore pressure changes are combined, the effect of<br />
time-dependent pore-pressure dominates, while off-fault<br />
plastic yielding only exerts a second-order effect.<br />
References<br />
Aiken, C., Z. Peng, and C. Wu (2011), Dynamic triggering of<br />
microearthquakes at three geothermal regions in<br />
California, Seismological Society of America <strong>Annual</strong><br />
<strong>Meeting</strong>, Memphis, TN.<br />
Aguiar, A. C., J. R. Brown, and G. C. Beroza (2009), Nonvolcanic<br />
tremor near the Calaveras Fault Triggered by<br />
Mw~8 Teleseisms, Eos Trans. AGU, 90(54), Fall Meet.<br />
Suppl., Abstract T23E-06.<br />
Chao, K., Z. Peng, A. Fabian, and L. Ojha (2011),<br />
Comparisons of Triggered Tremor in California, Seis. Res.<br />
42 | Southern California Earthquake Center<br />
Figure 4. Median amplitude of the high-frequency envelope<br />
functions versus the peak surface wave amplitudes measured at<br />
the broadband station PKD in central California for teleseismic<br />
earthquakes. The values measured during the surface waves<br />
and before the P-wave.<br />
Figure 5. (a) Observed and synthetic vertical-component<br />
seismograms for an on-fault aftershock recorded at an array near<br />
Parkfield, showing fault-zone guided waves. Seismograms have<br />
been
Lett., Seismological Society of America <strong>Annual</strong><br />
<strong>Meeting</strong>, Memphis, TN.<br />
Chen, K. H., Bürgmann, R., and Nadeau, R. M. (2010),<br />
Triggering effect of M 4-5 earthquakes on the<br />
earthquake cycle of repeating events at Parkfield,<br />
Bull. Seism. Soc. Am., 100, 2,<br />
doi:10.1785/0120080369.<br />
Fabian, A., L. Ojha, Z. Peng, and K. Chao (2009),<br />
Systematic search of remotely triggered tremor in<br />
Northern and Southern California, Eos Trans.<br />
AGU, 90(54), Fall Meet. Suppl., Abstract T13D-<br />
1916.<br />
Hauksson, E., J. Stock, K. Hutton, W. Yang, A. Vidal,<br />
and H. Kanamori, The 2010 Mw7.2 El Mayor-<br />
Cucapah Earthquake Sequence, Baja California,<br />
Mexico and Southernmost California, USA: Active<br />
Seismotectonics Along the Mexican Pacific Margin,<br />
Pure Appl. Geophys, Topical Issue: Geodynamics<br />
of the Mexican Pacific Margin, DOI<br />
10.1007/s00024-010-0209-7, 2010.<br />
Horstmann, T., Harrington, R.M., Cochran, E.S., Wang,<br />
T., Potier, C.E. (2010), Automatic tremor detection<br />
and waveform component analysis using a neural<br />
network approach, Abstract S23A-2122, 2010 Fall<br />
<strong>Meeting</strong>, American Geophysical Union.<br />
<strong>SCEC</strong> Research Accomplishments | Report<br />
Li, Y. G., P. Malin, and E. Cochran, High-Resolution Characterization of the Damage Zone on the Parkfield San Andreas Fault<br />
at Depth from Fault-Zone Trapped Waves, Book of Frontiers in Seismology, China High-Education Press, Beijing , in<br />
press, 2011<br />
Ma, S., and D. J. Andrews (2010), Inelastic off-fault response and three-dimensional earthquake rupture dynamics on a strikeslip<br />
fault, J. Geophys. Res., 115, B04304, doi:10.1029/2009JB006382.<br />
Peng, Z., D. P. Hill, D. R. Shelly and C. Aiken (2010), Remotely triggered microearthquakes and tremor in Central California<br />
following the 2010 Mw8.8 Chile Earthquake, Geophys. Res. Lett., 37, L24312, doi:10.1029/2010GL045462.<br />
Peng, Z., C. Wu, and C. Aiken (2011), Delayed triggering of microearthquakes by multiple surface waves circling the Earth,<br />
Geophys. Res. Lett., Geophys. Res. Lett., 38, L04306, doi: 2010GL046373.<br />
Shelly, D. R., Z. Peng, D. P. Hill and C. Aiken (2011), Delayed dynamic triggering of tremor and implications for triggered<br />
creep and earthquakes, Nature Geosci., accepted.<br />
Shelly, D. R., and J. L. Hardebeck (2010), Precise tremor source locations and amplitude variations along the lower␣crustal<br />
central San Andreas Fault, Geophys. Res. Lett., 37, L14301, doi:10.1029/2010GL043672.<br />
Tectonic Geodesy<br />
Figure 6. Accumulated plastic strain in logarithmic scale at a cross<br />
section 15 km from the epicenter from a model using a fractal fault<br />
geometry. The curved black line shows the fault trace at this cross<br />
section. The right side of the fault is a extensional regime, where the<br />
plastic strain is larger.<br />
Introduction<br />
The tectonic geodesy community within <strong>SCEC</strong> has again focused its efforts on inter-related combinations of data gathering<br />
and interpretation. The validation and application of transient detection algorithms was again a major effort, with a wide<br />
range of algorithms being tested against real and synthetic data. We are currently on track to having several detectors running<br />
in a <strong>SCEC</strong>-supported testing framework before the end of the year.<br />
Transient Detection<br />
Duncan Agnew made his FAKENET software available to the community, both for internal testing of detection algorithms as<br />
well as for the generation of new synthetic test data. Some of the major changes this year allowed inclusion of more realistic,<br />
non-sinusoidal seasonal signals and volume sources that imitate the effects of groundwater withdrawal and recharge. Herring<br />
2011 <strong>SCEC</strong> <strong>Annual</strong> <strong>Meeting</strong> | 43
Report | <strong>SCEC</strong> Research Accomplishments<br />
also supported the effort through the ongoing generation of a merged geodetic data product. The initial phase of “automated”<br />
detections will be performed on the PBO data product.<br />
Approaches used in transient detection fall generally into strain-based, “menu function”-based (i.e., various flavors of Kalman<br />
filters), and eigenvector/principle component decomposition-based families. Holt’s strain-based approach uses a polynomial<br />
interpolation and appears to be fairly sensitive to the background strain field used in the analysis and to variations in<br />
temporal coverage caused by stations coming in and out of the network. However, it did detect some signals that were not<br />
found by other approaches. Segall et al’s Network Inversion Filter performed well on the blind test exercise this year, and they<br />
continue to work on rigorously assessing the statistical significance of detections. McGuire, Wei and Segall apply their<br />
Network Strain filter to data from the Tohoku earthquake and find that their approach would have detected slow slip in the 48<br />
hours before the mainshock. They also suggest that offshore pressure gauge data may have allowed further confidence in<br />
identifying the precursory slip.<br />
Ji and Herring’s principal component approach<br />
has been, in general, the most successful of the<br />
decomposition-based approaches, and they have<br />
applied it to real data from Akutan Volcano, in<br />
Alaska. They perform their PCA analysis on<br />
data that has already been filtered using a state<br />
estimation that is part of a Kalman filter.<br />
Lipovsky & Funning use eigenfunctions with<br />
and without filtering of the noise and find that<br />
they are unable to detect most of the synthetic<br />
test signals (Figure 7). They also apply their<br />
approach to InSAR data in the Bay Area, and<br />
find that it is very sensitive to seasonal, aquiferrelated<br />
signals. Empirical Mode Decomposition<br />
and autoregressive processes are explored by<br />
Becker et al., but to date they have not proved<br />
useful for applications on large networks with<br />
real data. Kreemer et al. use a decomposition<br />
into piecewise-linear segments, which may<br />
potentially be very efficient. However, they do<br />
not think that their approach will be viable for<br />
automatic detections, as it does still require<br />
some manual intervention and is not ideal in<br />
regions with a large station spacing.<br />
Data Collection and Analysis<br />
Marshall et al. continued development of a GPS dataset for the Western Transverse Ranges by filtering data to remove offsets<br />
and seasonal signals. They are currently processing InSAR data, which will be used to identify and mitigate any remaining<br />
signals in the GPS data related to anthropogenic sources, such as aquifer draw-down. These observations, along with geologic<br />
slip rates, will be used to constrain Boundary Element Method models of the Ventura basin (employing the CFM) that account<br />
for the different geodetic and geologic time scales.<br />
Sandwell et al. continued rapid-static GPS surveys of the Brawley seismic zone in order to understand better how strain is<br />
partitioned in this region. The growing dataset records the 2005 Obsidian Buttes earthquake swarm, highlighting a northeast<br />
striking fault at the location of the observed strain anomaly. If the swarm were due to slip on this fault, the data suggest that 9<br />
mm/yr of left lateral motion occurred between 2003 and 2009. The dense geodetic array developed for this work also has<br />
provided the opportunity to observe triggered slip due to the El Mayor Cucapah earthquake. In addition to this work,<br />
Sandwell et al. have established 17 new GPS monuments across the Imperial fault and launched an intense field effort to<br />
collect data both north and south of the Mexico border following the El Mayor Cucapah event, building on an existing<br />
collaboration with scientists at CISESE through which they were already collecting interseismic data in this region (Figure 8).<br />
44 | Southern California Earthquake Center<br />
Figure 7. Seasonal deformation from a subset of the ERS T70 InSAR dataset.<br />
The deformation pattern shows a confined aquifer that is bounded by two<br />
previously unknown faults. Known faults are shown with thin, black lines.<br />
(Funning and Lipovsky, 2010)
Funning et al. resurveyed 19 GPS<br />
sites in the Anza gap region along<br />
the San Jacinto fault and processed<br />
these data to extend position time<br />
series for these sites. These data<br />
have made possible new or revised<br />
velocity calculations for GPS sites<br />
in this region. In the event of a San<br />
Jacinto fault earthquake, these<br />
velocities will be required in order<br />
to obtain accurate coseismic and<br />
postseismic displacement<br />
measurements. Improved<br />
interseismic velocities will also<br />
prove valuable for refining models<br />
strain accumulation, and thus<br />
seismic hazard, in the vicinity of<br />
the San Jacinto fault.<br />
GPS data collection in the Anza<br />
gap region is complemented by the<br />
variety of observations recorded at<br />
the Piñon Flat Observatory (PFO).<br />
With partial support from <strong>SCEC</strong>,<br />
Wyatt et al. maintained and<br />
operated the PFO, which includes a<br />
longbaseline strainmeter, assisted<br />
other groups with operation and<br />
testing of various seismic<br />
instruments, and continued<br />
<strong>SCEC</strong> Research Accomplishments | Report<br />
Figure 8. M7.2 El Mayor-Cucupah coseismic displacements (black arrows) from campaign<br />
GPS surveys.(Sandwell et al., 2010)<br />
processing and archiving longbaseline strain data. These data show intriguing trends during the initial months following the<br />
El Mayor Cucapah earthquake that may reflect slow slip on the San Jacinto fault.<br />
Oskin et al. developed a test to distinguish between two end-member models of long-term earthquake temporal clustering<br />
and applied it to the southern San Jacinto fault. One end-member is that clustering occurs due to changes in the brittle fault<br />
strength, and this would predict anti-correlated slip rate behavior of individual fault strands. Alternatively, clustering can<br />
result from changes in loading by the ductile lower crust which would predict correlated slip rate behavior of fault strands. To<br />
test these models they estimated slip rates at six sites along strands of the San Jacinto fault using two independent dating<br />
techniques to reduce potential bias in the results. Their results indicate there is a strong slip rate gradient along the San Jacinto<br />
fault with the slip rate decreasing to the southeast where slip is transferred from the Clark fault strand to the Coyote Creek<br />
fault and Salton Trough. The slip rates estimated for the Clark and Coyote Creek faults both show an increase over time<br />
suggesting that the change is due to an increase in fault zone loading.<br />
Weldon et al. completed mapping of the north branch of the San Andreas fault in the San Bernardino Valley and prepared for<br />
sample collection for cosmogenic dating to be conducted in the summer of 2011. These data will be used to determine the slip<br />
rate on this fault branch, a structure for which little slip rate information exists despite its important role in assessing the<br />
geodetic/geologic slip rate discrepancy and seismic hazard in this region.<br />
Kilb inspected the spectra for triggered earthquakes in the wavetrain of large amplitude teleseismic events and demonstrated<br />
that these triggered events are similar to typical shallow earthquakes in the same region (the Salton Sea) rather than having<br />
frequency characteristics expected of triggered tremor.<br />
2011 <strong>SCEC</strong> <strong>Annual</strong> <strong>Meeting</strong> | 45
Report | <strong>SCEC</strong> Research Accomplishments<br />
San Andreas Fault System Modeling<br />
Figure 9. Interseismic stressing rate and seismicity on San Andreas fault derived from estimated slip rates for all southern<br />
California faults. Seismicity correlates with sections of fault for which neighboring faults make substantial contribution to<br />
interseismic stressing. (Meade et al., 2010)<br />
Platt and Becker used GPS data to investigate strain partitioning around the Garlock fault as a pilot study designed to<br />
understand better the mechanics of sinistral faults that occur in the dominantly dextral San Andreas Fault system. They found<br />
that the Garlock Fault slips left-laterally at ~7.5 mm/yr and rotates counterclockwise at 5.2°/m.y.<br />
Figure 9. Interseismic stressing rate and seismicity on San<br />
Andreas fault derived from estimated slip rates for all southern<br />
California faults. Seismicity correlates with sections of fault for<br />
which neighboring faults make substantial contribution to<br />
interseismic stressing. (Meade et al., 2010)<br />
Modeling Fault Zone Behavior<br />
46 | Southern California Earthquake Center<br />
Hooks et al. developed a new 3D finite difference model for<br />
the southern San Andreas Fault system in order to<br />
investigate vertical deformation. The <strong>SCEC</strong> geological<br />
vertical motion database provided long-term vertical<br />
deformation rates to refine the model. The resulting model<br />
successfully reproduces the general patterns of horizontal<br />
velocity (from the PBO data) and strain rate. Current work<br />
is focused on assessing the model resolution and influence<br />
of boundary conditions. They plan to integrate the results<br />
from the dynamic model with the results from their semianalytic<br />
crustal deformation models.<br />
Bennett et al. developed geodetically-constrained block<br />
models to investigate four possible fault-block geometries<br />
in the Eastern Transverse Ranges in an effort to constrain<br />
better slip-rate estimates for the southernmost San Andreas<br />
Fault (SSAF). While no model provided a statistically better<br />
fit to the data than the others, for all geometries considered,<br />
the results suggest that the SSAF has a strong along-strike<br />
slip rate gradient with rates decreasing from ~23 mm/yr to<br />
< 10 mm/yr as one moves northwest while the estimated<br />
San Jacinto slip rate is ~12 mm/yr.<br />
In another application of block modeling, Meade et al. used<br />
southern California fault slip rates estimated from a<br />
geodetically constrained block model that includes all<br />
major regional fault structures to calculate fault stressing<br />
rates resulting from interseismic fault system interactions<br />
(Figure 9). Their results suggest that interseismic stressing<br />
over the course of the earthquake cycle is as significant as<br />
co-seismic and postseismic stress changes and that seismic<br />
hazard assessment should consider stressing due to<br />
interseismic fault interactions rather than simply the slip<br />
rates on individual faults.<br />
Efforts at modeling more realistic fault zone behaviors, such as damage regions, progressed significantly this year, with codes<br />
including fault stepovers and dipping faults instead of the simple straight, vertical strike slip faults examined previously.<br />
Hearn &Vaghri explore the effects of lateral rheological contrasts in suites of strike-slip faults as well as deep, viscous shear<br />
zones and their effects on modeling of interseismic geodetic data. Duan et al., 2011, find that triggered elastic and inelastic<br />
deformation on nearby fault zones can occur coseismically when the pre-seismic stress level is comparable to the strength of<br />
the fault zones, and that the sense of inelastic deformation can be the opposite from the elastic deformation that would be<br />
predicted based on the coseismic Coulomb stress change (Figure 10). Fialko et al. explore 2D numerical models that<br />
investigate the origin of shallow slip deficits that appear in many inversions of coseismic data associated with large strike-slip
earthquakes. They find that plastic yielding can produce a<br />
shallow slip deficit, although they also find that the<br />
inversion approaches used on the coseismic data need<br />
further analysis. Fialko and Barbot continue development of<br />
their semi-analytical approach to modeling time-dependent<br />
deformation, which reproduces fairly similar results to<br />
ABAQUS for a simple strike-slip case. Meade et al. explored<br />
how the quasi-static earthquake cycle modeling that is now<br />
commonplace may be biased when inaccurate fault models<br />
are used or viscoelastic deformation is neglected.<br />
Geologic/geodetic slip discrepancies in the San Bernadino<br />
region are a key motivation for this study.<br />
Seismic Hazard Assessment<br />
With 2010 <strong>SCEC</strong> funding, Thatcher et al. held the first of<br />
several workshops focusing on how GPS constraints on<br />
strain rates and fault slip rates can be more directly<br />
<strong>SCEC</strong> Research Accomplishments | Report<br />
Figure 10. Fault-parallel component of the residual displacement<br />
field after an earthquake on the fault (solid black line) within a<br />
low-velocity fault zone FZ2. Motion across FZ1 is retrograde<br />
along AA', while it is sympathetic along BB'. They correspond to<br />
elastic and inelastic response of FZ1 to the rupture, respectively.<br />
(Duan et al., 2011)<br />
incorporated in the UCERF3 seismic hazard assessment. During this workshop, participants reviewed existing studies and<br />
developed a consensus assessment of which results were sufficiently well-developed and accepted to be included in UCERF3.<br />
They also identified new <strong>SCEC</strong> research objectives that would result in additional geodetically constrained rate estimates<br />
being usable for UCERF3. These research directions included extension of strain and slip rate modeling to additional regions<br />
of California, better assessment of rate uncertainties (including epistemic uncertainty), and quantification of postseismic<br />
effects on rate estimates.<br />
Ward has further developed approaches to incorporating geodetic data in seismic hazard assessment both through new<br />
methods for estimating the strain rate from GPS velocities and new ways to incorporate geodetic data into earthquake<br />
simulators. This year’s work has employed the CMM4 velocity field, and a focus of current work is transitioning to using a<br />
new, more physically realistic and detailed, fault model in the ALLCAL earthquake simulator as well as testing and tuning<br />
ALLCAL. This work was highlighted in presentations in Italy and Japan during 2010.<br />
Publications and Presentations of Results<br />
Barbot, S. and Y. Fialko, Constraints on rheological structure of the lithosphere from geodetic observations of postseismic<br />
transients due to the Landers and Hector Mine earthquakes, Southern California, submitted.<br />
Barbot, S. and Y. Fialko, A unified continuum representation of postseismic relaxation mechanisms: Semi-analytic models of<br />
afterslip, poroelastic rebound and viscoelastic flow, Geophys. J. Int., 182, 1124-1140, 2010.<br />
Barbot, S. and Y. Fialko, Fourier-domain Green function for an elastic semi-infinite solid under gravity, with applications to<br />
earthquake and volcano deformation, Geophys. J. Int., 182, 568-582, 2010.<br />
Cooke, M.L., Herbert, J., Marshall, S.T., 2010. Spatially Varying Slip Rates on the Southern San Andreas Faults Reflect Fault<br />
Geometry and Interaction. Southern California Earthquake Center Workshop on Integrating Geodesy into the UCERF3,<br />
Pomona, CA<br />
Del Pardo, C., B.P. Hooks, B.R. Smith-Konter, L. Serpa, and T.L. Pavlis, 2010, Three-dimensional thermo-mechanical modeling<br />
of the Death Valley Fault Zone, Southern California Earthquake Center <strong>Annual</strong> <strong>Meeting</strong>, Proceedings and Abstracts, v. 20<br />
p. 206.<br />
Del Pardo, C., B. P. Hooks, B. Smith-Konter, L. Serpa, and T.L. Pavlis, Numerical modeling of strain accumulation within the<br />
Death Valley Fault Zone, to be submitted to J. Geophys. Res.<br />
Doran, A.K., Z. Peng, C. Wu, and D. Kilb (2010). Dynamic Triggering of Shallow Earthquakes in the Salton Sea Region of<br />
Southern California, <strong>SCEC</strong> <strong>Annual</strong> <strong>Meeting</strong> 2010, poster 2-099.<br />
Doran, A., X. Meng, Z. Peng, C. Wu, D. L. Kilb, (2010). Dynamic Triggering of Earthquakes in the Salton Sea Region of<br />
Southern California from Large Regional and Teleseismic Earthquakes. American Geophysical Union, Fall <strong>Meeting</strong> 2010,<br />
Abstract #S33B-2104.<br />
Doran, A. K., Z. Peng, X. Meng, C. Wu, D. Kilb (2011). Dynamic Triggering of Earthquakes in the Salton Trough of Southern<br />
California, Seis. Research Letters, 82.<br />
2011 <strong>SCEC</strong> <strong>Annual</strong> <strong>Meeting</strong> | 47
Report | <strong>SCEC</strong> Research Accomplishments<br />
Duan, B. (2010), Inelastic response of compliant fault zones to nearby earthquakes, Geophys. Res. Lett., 37, L16303,<br />
doi:10.1029/2010GL044150.<br />
Duan, B., J. Kang, and Y.-G. Li (2011), Deformation of compliant fault zones induced by nearby earthquakes: Theoretical<br />
investigations in two dimensions, J. Geophys. Res., 116, xxxxxx, doi:10.1029/2010JB007826, in press.<br />
Fialko, Y., A. Gonzalez, J J Gonzalez-Garcia, S. Barbot, S. Leprince, D. T. Sandwell, D. Agnew, Static Rupture Model of the 2010<br />
M7.2 El Mayor-Cucapah Earthquake from ALOS, ENVISAT, SPOT and GPS Data, Abstract T53B-2124, presented at 2010<br />
Fall <strong>Meeting</strong>, AGU, San Francisco, Calif., 13-17 Dec.<br />
Hooks, B.P., B.R. Smith-Konter, 2010, Numerical Modeling of the San Andreas Fault System: Comparison with analytical<br />
solutions and geological observations, Southern California Earthquake Center <strong>Annual</strong> <strong>Meeting</strong>, Proceedings and<br />
Abstracts, v. 20, p. 226.<br />
Hooks, B.P., B.R. Smith-Konter, 2010, Preliminary strain results from 3D continuum mechanics models (FLAC3D) of the San<br />
Andreas Fault System , Southern California Earthquake Center Workshop on Incorporating Geodetic Surface<br />
Deformation Data into UCERF3, Pomona, CA, 1-2 April 2010.<br />
Hooks, B.P., and B.R. Smith-Konter, 2010, 3D numerical mechanical modeling of the southern San Andreas Fault system, 2010<br />
Workshop on Crustal Deformation Modeling, sponsored by Southern California Earthquake Center and Computational<br />
Infrastructure for Geodynamics, Golden, CO. 18 June 2010.<br />
Hooks, B.P., and B. Smith-Konter, Dynamic 3D mechanical numerical modeling of the long-term evolution of the Southern San<br />
Andreas Fault System, to be submitted to J. Geophys. Res.<br />
Gonzalez, A, J J Gonzalez-Garcia, D T Sandwell, Y Fialko, D Agnew, B. Lipovsky, J. Fletcher, F. A. Nava Pichardo, GPS<br />
coseismic and postseismic surface displacements of the El Mayor-Cucapah earthquake, Abstract T53B-2125, presented at<br />
2010 Fall <strong>Meeting</strong>, AGU, San Francisco, Calif., 13-17 Dec.<br />
Kaneko, Y. and Y. Fialko, Shallow slip deficit due to large strike-slip earthquakes in dynamic rupture simulations with elastoplastic<br />
response, Geophys. J. Int., submitted.<br />
Kaneko, Y. and Y. Fialko, Modeling shallow slip deficit in large strike-slip earthquakes using simulations of spontaneous<br />
earthquake sequences in elasto-plastic media, Eos Trans. AGU, 91(55), T33B-2248, 2010.<br />
Kaneko, Y. and Y. Fialko, Modeling shallow slip deficit in large strike-slip earthquakes using simulations of spontaneous<br />
earthquake sequences in elasto-plastic media, <strong>SCEC</strong> annual meeting, 2010.<br />
Marshall, S.T., Owen, S.E., Funning, G.J. 2010 The Ups and Downs of Geodetically-Derived Deformation Rates in the Western<br />
Transverse Ranges Region, CA. Eos, Transactions of the American Geophysical Union.<br />
Marshall, S.T., Owen, S.E., Funning, G.J. 2010 Separating Seasonal, Anthropogenic, and Tectonic Deformation in the Western<br />
Transverse Ranges Region, CA. Southern California Earthquake Center <strong>Annual</strong> <strong>Meeting</strong>, Palm Springs, CA.<br />
Marshall, S.T., Cooke, M.L. 2010. Interseismic Deformation along Finite and Intersecting Faults: Application to the Los<br />
Angeles and Ventura Regions, CA. Southern California Earthquake Center Workshop on Integrating Geodesy into the<br />
UCERF3, Pomona, CA.<br />
Morris, A.C., Marshall, S.T. 2010 Spatial Variations in Slip on Corrugated Reverse Fault Surfaces. Eos, Transactions of the<br />
American Geophysical Union.<br />
Sandwell, D., T. Becker, P. Bird, J. Bormann, A. Freed, M. Hackl, B. Meade, W. Holt, B. Hooks, S. Kedar, C. Kreemer, R.<br />
McCaffrey, T. Parsons, F. Pollitz, Z-K. Shen, B. Smith-Konter, C. Tape, and Y. Zeng, 2010, Comparison of 16 strain rate<br />
maps for southern California, Southern California Earthquake Center <strong>Annual</strong> <strong>Meeting</strong>, Proceedings and Abstracts, v. XX,<br />
p. 271.<br />
Sandwell, D T , R. Mellors, X. Tong, M. Wei, P. Wessel, GMTSAR Software for Rapid Assessment of Earthquakes, G13A-0651,<br />
presented at 2010 Fall <strong>Meeting</strong>, AGU, San Francisco, Calif., 13-17 Dec.<br />
Spinler, J. C., R. A. Bennett, M. L. Anderson, S. F. McGill, S. Hreinsdóttir, and A. McCallister (2010), Present‐day strain<br />
accumulation and slip rates associated with southern San Andreas and eastern California shear zone faults, J. Geophys.<br />
Res., 115, B11407, doi:10.1029/2010JB007424.<br />
Wei, M., D. Sandwell, Y. Fialko, and R. Bilham Slip on faults in the Imperial Valley triggered by the 4 April 2010 Mw 7.2 El<br />
Mayor-Cucapah earthquake revealed by InSAR, Geophys. Res. Lett., doi:10.1029/2010GL045235, in press. (accepted 19<br />
November 2010).<br />
48 | Southern California Earthquake Center
Earthquake Geology<br />
<strong>SCEC</strong> Research Accomplishments | Report<br />
The <strong>SCEC</strong> geology disciplinary group coordinates diverse field-based investigations of the Southern California natural<br />
laboratory. The majority of Geology research accomplishments fall under two categories: (1) focused studies of the southern<br />
San Andreas and San Jacinto faults in coordination with the SoSAFE (Southern San Andreas Fault Evaluation) special project;<br />
and (2) studies of other portions of the southern California fault network aimed at a better understanding fault system<br />
behavior. Geology also contributes to earthquake response efforts and supports field observations related to several focusgroup<br />
activities (e.g., USR, WGCEP, FARM, GMP, LAD, CDM). Additional goals include longer-term slip rates and long,<br />
multi-event paleoseismologic records that have a high impact on seismic hazard assessments. In support to these efforts the<br />
Geology group coordinates geochronology infrastructure resources that are shared among various <strong>SCEC</strong>-sponsored projects.<br />
SoSAFE Special Project<br />
The primary goal of the SoSAFE project is to document the timing of large paleoearthquakes and amount of slip released by<br />
the southern San Andreas and San Jacinto faults over the past 2000 years. Additional goals include examination of longer-term<br />
slip rates and modeling studies that directly impact seismic hazard assessments. The SoSAFE project has become the<br />
dominant focus of geological investigations under <strong>SCEC</strong>3. The numerous accomplishments of this program are described in<br />
detail in the Special Projects section, below.<br />
Fault System Behavior<br />
A major emphasis of the Geology group has been to characterize patterns in fault system behavior that could significantly<br />
affect earthquake hazards. Recent efforts, focused on the San Cayetano-Ventura reverse fault system, aim to understand fault<br />
linkage and potential earthquake magnitude along the rapidly converging northern margin of the Ventura basin. Analysis of<br />
well data, industry seismic reflection profiles, and four high-resolution seismic profiles acquired in 2010 have allowed<br />
Hubbard, Shaw, Dolan, McAuliffe and Pratt to construct a more complete 3D model of the system (Figure 11). These data<br />
suggest that the Ventura Fault, previously interpreted by some as a shallow, bending-moment fault that does not pose a<br />
seismic hazard, is in fact a major, through-going thrust ramp that extends to seismogenic depths. Slip on the Ventura ramp has<br />
generated the prominent Ventura Avenue anticline, which<br />
Hubbard et al. (in prep.) interpret as a fault-propagation<br />
fold. Moreover, the structural similarity of the Ventura<br />
Avenue anticline and the Dos Cuadras structure offshore<br />
to the west suggests that these major structures form an en<br />
echelon system that could potentially link together to form<br />
large-magnitude thrust earthquakes. Similarly, the<br />
southern, blind San Cayetano Fault to the east of Ventura<br />
is a north-dipping thrust ramp overlain by a large anticline<br />
that appears to be part of this same system. Rupture of this<br />
entire system could generate a very large-magnitude event,<br />
similar to the 2008 Mw 7.9 Wenchuan earthquake.<br />
Significant portions of such a rupture would lie offshore,<br />
resulting in the potential for generation of large, nearshore<br />
tsunamis that could affect coastlines throughout<br />
southern California. Ongoing analysis of the 2010 highresolution<br />
seismic reflection data, coupled with shallow<br />
Figure 11. High-resolution seismic profile acquired across the active<br />
fold limb and synclinal axial surface associated with the tipline of the<br />
blind, southern San Cayetano Fault along the northern edge of the<br />
Ventura basin. The upper figure shows the locations of continuously<br />
cored boreholes and cone-penetration tests drilled across the zone of<br />
active folding during Summer 2011 to define precisely the geometry<br />
of strata folded in recent earthquakes and to sample dateable<br />
material to define paleo-earthquake ages.<br />
borehole data collected during Summer 2011 across the<br />
locus of active folding above the Ventura and western San<br />
Cayetano anticlines, should reveal the ages and<br />
displacements of recent earthquakes on these major thrust<br />
ramps, which will in turn allow the evaluation of possible<br />
multi-segment ruptures and correlation to the uplifted<br />
Holocene marine terrace record documented by T.<br />
Rockwell.<br />
2011 <strong>SCEC</strong> <strong>Annual</strong> <strong>Meeting</strong> | 49
Report | <strong>SCEC</strong> Research Accomplishments<br />
El Mayor-Cucapah Earthquake<br />
Investigations are maturing in response to the 4 April 2010 El Mayor-Cucapah earthquake in northernmost Baja California.<br />
This is the first earthquake where comprehensive lidar topographic surveys and differential lidar have been available to map<br />
the rupture and constrain near-field deformation (Figure 12). Lidar data collection was supported by an NSF-RAPID grant,<br />
supplemented by <strong>SCEC</strong> funds that allowed for expansion of the survey. Oskin et al. (in review) describe the collection and<br />
Figure 12. A. Elevation difference map (post-pre) generated from lidar surveys obtained before and after the 2010 El Mayor-Cucapah<br />
earthquake. Cross-section shows folding between two dextral oblique normal faults that slipped in this earthquake. B. Elastic model of the<br />
Paso Inferior Accommodation Zone, based on observed fault offsets. Note how the model reproduces observations well along the crosssection<br />
in A (model shown as red dashed line).<br />
first results of this survey, highlights of which include large near-field strains (~10-3) that appear to be elastically generated,<br />
and evidence for a blind strike-slip fault system that slipped beneath the Colorado River delta. Overall, the El Mayor Cucapah<br />
earthquake represents the latest of a class of distributed, multi-fault earthquake ruptures that present difficult-to-quantify,<br />
distributed seismic hazard. Rupture mapping led by a joint USA-Mexico team of Fletcher and Rockwell, has revealed up to<br />
seven fault segments that slipped in this earthquake. A paper summarizing the numerous measurements and lidar-assisted<br />
rupture mapping will soon be submitted for publication. Efforts are ongoing to compare this rupture to previous events,<br />
including the immediately adjacent rupture generated by the 1892 Laguna Salada earthquake. That two earthquakes of similar<br />
size occurred within a few kilometers of each other challenges the role that elastic rebound may play in reducing earthquake<br />
hazard immediately after a nearby event. The latest and ongoing research from the El Mayor-Cucapah earthquake, including<br />
results from analysis of both airborne and terrestrial lidar, will be presented at a workshop at the upcoming 2011 <strong>SCEC</strong> annual<br />
meeting. Current registration for this workshop already exceeds 100 persons.<br />
Shallow Slip Deficits<br />
50 | Southern California Earthquake Center
<strong>SCEC</strong> researchers are also attempting to<br />
determine how representative geologic slip<br />
rates are of the true slip rate of fault slip at<br />
depth. Although surface fault slip<br />
measurements are commonly used to infer<br />
seismic hazard, it has long been noted that<br />
surface slip during earthquakes is often<br />
smaller than slip at depth determined from<br />
inversion of geodetic and seismologic data. If<br />
this shallow slip deficit is due to significant<br />
off-fault deformation in the near-surface<br />
region, as suggested by earlier <strong>SCEC</strong>supported<br />
studies (e.g. Shelef and Oskin, 2010),<br />
then geological surface slip measurements will<br />
systematically underestimate fault slip at<br />
depth. Consequently, seismic hazard inferred<br />
from these measurements will also be<br />
underestimated. In an effort to determine if<br />
this shallow slip deficit varies as a function of<br />
measureable fault characteristics such as total<br />
fault slip or near-surface geology, Haravitch<br />
<strong>SCEC</strong> Research Accomplishments | Report<br />
and Dolan (in prep.) have systematically compared the co-seismic surface displacements in six, large-magnitude (Mw ≥7)<br />
strike-slip earthquakes with static inversions of geodetic data for slip at 3-6 km depth. Their study reveals a striking<br />
correspondence between the degree to which fault slip remains localized to the surface and the structural maturity of the fault,<br />
as defined by cumulative fault displacement. For example, ruptures on faults with ≤10 km of cumulative fault slip typically<br />
manifest only ~40-60% of slip at 3-6 km depth as discrete surface fault slip, in contrast to ruptures on structurally mature<br />
faults, which manifest 80-95% of slip at depth as discrete surface fault slip (Figure 13). This pattern extends to smaller scales,<br />
and comparisons of slip at the surface with slip at depth for any point along these ruptures reveals the same basic trend when<br />
structurally simple and structurally complicated sections of the surface ruptures are examined separately. These observations<br />
have basic implications for probabilistic seismic hazard assessment, which depends strongly on geologic fault slip rates as a<br />
primary input, and provide a way forward to potentially defining a multiplier based on measurable fault parameters (e.g.,<br />
cumulative fault slip) that can be used to<br />
correct geologic slip rates to account for the<br />
amount of deep fault slip that is distributed in<br />
the near surface.<br />
Geochronology Infrastructure<br />
The geochronology infrastructure program<br />
pools dating funds at various participating<br />
laboratories. This approach leads to greater<br />
efficiency in allocating resources, as most<br />
projects cannot fully anticipate their dating<br />
requirements ahead of time. Nearly 900<br />
Figure 13. Comparison of Surface Slip Ratio (SSR) with cumulative displacement of<br />
six faults that produced earthquakes M≥7. Comparisons are based on geologic<br />
surface offset data, geodetic estimations of slip at depth and geologic estimation of<br />
cumulative displacement.<br />
Figure 14. Sampling profile and shape model for Grass Valley Rock GV-2. Modeling<br />
the 3-D exposure history reveals that this rock has been precarious for 18.0 ± 2.5 kyr.<br />
geochronology analyses have been completed thus far under the <strong>SCEC</strong>3 program. 600 of these have been 14C, spread roughly<br />
equally between Lawrence Livermore National Lab (LLNL) and U.C. Irvine labs. Cosmogenic 10Be (measured at LLNL)<br />
comprises most of the remaining analyses (227 dates) followed by optically stimulated luminescence (52 OSL dates, measured<br />
at University of Cincinnati and Utah State). 76% of 14C, 65% of 10Be, and 60% of OSL dates have been expended on SoSAFE<br />
projects, reflecting the high impact this special program has had on <strong>SCEC</strong>3 geology. The geochronology program has also<br />
spawned new collaborations to advance dating methodologies. One rapidly advancing technique melds the 10Be and U-series<br />
dating approaches to date alluvial fans. This has been applied to date offsets along the San Andreas Fault at Biskra Palms<br />
(Behr et al., 2010; Fletcher et al., 2010) and at several sites along the southern San Jacinto Fault (Blisniuk et al., in preparation).<br />
2011 <strong>SCEC</strong> <strong>Annual</strong> <strong>Meeting</strong> | 51
Report | <strong>SCEC</strong> Research Accomplishments<br />
Another advance has been the application of multiple 10Be surface exposure dates to model the onset of fragility of<br />
precariously balanced rocks (Figure 14), recently published in Quaternary Geochronology (Balco et al., 2011).<br />
References<br />
Balco, G., Purvance, M., and Rood, D. (2011) Exposure dating of precariously balanced rocks, Quaternary Geochronology, v. 6,<br />
p. 295-303.<br />
Behr, W., Rood, D., Fletcher, K., Guzman, N., Finkel, R., Hanks, T., Hudnut, K., Kendrick, K., Platt, J., Sharp, W., Weldon, R.,<br />
and Yule, J. (2010) Uncertainties in slip-rate estimates for the Mission Creek strand of the southern San Andreas fault at<br />
Biskra Palms Oasis, southern California, Geological Society of America Bulletin, vol. 122, p. 1360-1377.<br />
Fletcher, K., Sharp, W., Kendrick, K., Behr, W., Hudnut, K., and Hanks, T. (2010) 230Th/U dating of a late Pleistocene alluvial<br />
fan along the southern San Andreas fault, Geological Society of America Bulletin, v. 122, p. 1347-1359.<br />
Oskin, M., Arrowsmith, J., Hinojosa, A., Elliott, A., Fletcher, M., Fielding, E., Gold, P., Gonzalez, J, Hudnut, K., Liu-Zheng, J.,<br />
and Teran, O., (2010) Near-field deformation from the El Mayor-Cucapah earthquake quantified with airborne LiDAR,<br />
submitted to Nature Geoscience.<br />
Shelef, E., and Oskin, M., (2010) Deformation processes adjacent to active faults: Examples from Eastern California, Journal of<br />
Geophysical Research – Solid Earth, Vol. 115, B05308, 24 pp., doi:10.1029/2009JB006289.<br />
Disciplinary Activities<br />
Within the <strong>SCEC</strong> structure, the focus groups are responsible for coordinating interdisciplinary activities in six major areas of<br />
research: Unified Structural Representation, Fault and Rupture Mechanics, Crustal Deformation Modeling, Lithospheric Architecture<br />
and Dynamics, Earthquake Forecasting and Predictability, Ground Motion Prediction, and Seismic Hazard and Risk Analysis. The<br />
following sections summarize the year’s activities in each of these areas.<br />
Unified Structural Representation<br />
The Unified Structural Representation (USR) Focus Area develops models of crust and upper mantle structure in California<br />
for use in a wide range of <strong>SCEC</strong> science, including strong ground motion prediction, earthquake hazards assessment, and fault<br />
systems analysis. These efforts include the development of Community Velocity Models (CVM-S, CVM-SI, & CVM-H) and<br />
Community Fault Models (CFM, CFM-R, SCFM), which together comprise a USR. In partnership with other working groups<br />
in <strong>SCEC</strong>, the USR Focus Area also helps support the evaluation and improvement of these models through ground motions<br />
simulations, 3D waveform tomography, earthquake relocations, and fault systems modeling.<br />
1. This past year’s accomplishments include:<br />
2. Development of new versions of the <strong>SCEC</strong> Community Velocity Model (CVM-H 11.2 and 11.9), which include new<br />
representations of the San Bernardino and offshore Santa Maria basins;<br />
3. Development of a new version of the <strong>SCEC</strong> Community Velocity Model (CVM-SI), which includes perturbations to<br />
an existing model (CVM-S) as a result of iterative inversion simulations by Chen et al (2011) and Lee et al (2010). A<br />
similarly refined CVM-H model was released as versions 11.2 to 11.9, and is currently being updated.<br />
4. Support for the development of the statewide<br />
UCVM by the <strong>SCEC</strong> CME group, which includes<br />
these latest southern California model versions<br />
(CVM-S, CVM-SI, CVM-H) along with other<br />
alternative and complimentary regional velocity<br />
models in a common delivery platform.<br />
5. Implementation of a new CVM evaluation system by<br />
the <strong>SCEC</strong> CME that uses wave propagation<br />
simulations of moderate magnitude historical<br />
earthquakes and goodness-of-fit (GOF)<br />
measurements that compare simulated and<br />
52 | Southern California Earthquake Center<br />
Figure 15. Map of difference in Vs between CVM-SI i5-i0 and CVM-S<br />
4.0 at depth 0m (after Chen et al., 2011; Lee et al., 2010).
observed waveforms (after Olsen and Mayhew, 2010).<br />
<strong>SCEC</strong> Research Accomplishments | Report<br />
6. Development of a new version of the <strong>SCEC</strong> Community Fault Model (CFM 4.0) for southern California that includes<br />
updates based on relocated seismicity catalogs and detailed fault traces in the USGS Quaternary Fault and Fold<br />
database.<br />
7. Development of a new version of the statewide Community Fault Model (SCFM 2.0) in coordination with the<br />
California Geological Survey and the USGS in support of the UCERF3 project.<br />
Community Velocity Models (CVM, CVM-SI, CVM-H)<br />
A series of improvements were made to the <strong>SCEC</strong> Community Velocity Models this past year to improve their performance in<br />
strong ground motion simulations and a range of other applications. These efforts included 3D waveform tomographic<br />
inversions using the F3DT scattering integral method that evaluated the longstanding CVM-S model (Chen et al., 2011, and<br />
Lee et al., 2010). Based on comparisons of observed and synthetic waveforms, perturbations were applied to this model to<br />
generate a revised velocity description (Figure 15). The model is expressed as a 3D grid of 1536 x 992 x 100 cells with a grid<br />
spacing of 500 m and is available as a C/Fortran code and associated files that are downloaded, compiled, and run locally.<br />
This improved model has been imported into UCVM and is referenced with the model label CVM-SI.<br />
In addition, we developed updated versions of the CVM-H (11.2 and 11.9) that are also released as part of UCVM. The latest<br />
version of this model includes a newly compiled Moho surface, addition of the offshore Santa Maria basin, a new detailed<br />
representation of the San Bernardino basin, and much smoother transitions between low and high resolution regions of the<br />
model. The new Moho surface was compiled by Carl Tape from a large number of data sources, including receiver functions<br />
and active-source studies. Improvements to the offshore Santa Maria basin representation in the CVM-H included a revised<br />
definition of the basement surface using reflection seismic data that extends to the western margin of the model. The new<br />
model also includes a representation for the San Bernardino basin that was developed using gravity (Anderson, 2000) and<br />
seismic reflection data (Stephenson et al., 2002). The velocity structure (Vp) in the basin is defined by stacking velocities<br />
(Stephenson et al., 2004) and a 1D velocity profile (Graves, 2008) combined to a basin thickness-depth-velocity function.<br />
Finally, the transitions from the high to the low resolution models were revised by introducing a new smoothing velocity<br />
gradient. This latest model version is being quantitatively assessed by performing seismic wavefield simulations based on<br />
unstructured hexahedral meshing (GEOCUBIT) and the spectral-element method (SPECFEM3D) using a database of synthetic<br />
seismograms for 234 reference earthquakes in southern California (Tape et al., 2011). These synthetic seismograms are filtered<br />
over different period ranges and then compared with observed seismograms using a variety of misfit functions. The misfit<br />
analysis provides an earthquake-based perspective of the quality of CVM-H, and will be used to revise the velocity<br />
parameterizations in future model releases.<br />
Planning for the future of <strong>SCEC</strong> Community Velocity Models<br />
Comparisons of observed and synthetic waveforms for earthquakes in southern California demonstrate that the <strong>SCEC</strong><br />
Community Velocity Models (Magistrale et al., 2000; Süss and Shaw, 2003; Plesch et al., 2009) perform much better than simple<br />
1-D velocity models in accurately simulating seismic wave propagation and forecasting the distribution of hazardous ground<br />
shaking (e.g., Komatitsch et al., 2004; Chen et al., 2007; Olsen and Mayhew, 2010). Furthermore, the new 3D waveform<br />
tomographic inversion methods that are being used to evaluate and improve the current velocity models offer great promise<br />
of offering further improvements in model performance. To help facilitate the process of evaluating and improving these<br />
models, the USR Focus Area has worked closely with <strong>SCEC</strong> CME group over this past year to coordinate model releases,<br />
enhance the code that delivers the models, and provide tools that can help in evaluating model performance.<br />
Specifically, the UCVM framework now provides a common platform that can be used to access all of community velocity<br />
model versions (CVM-S, CVM-SI, CVM-H), along with other alternative and complementary regional velocity models. This<br />
helps to facilitate direct comparisons between models, as well as use of alternative models in various seismological and hazard<br />
assessment studies that explore the significance of differences between current model versions. In addition, the CME group<br />
has implemented a CVM evaluation system that uses wave propagation simulations of moderate magnitude historical<br />
earthquakes and goodness-of-fit (GOF) measurements that compare simulated and observed waveforms (Figure 16). The<br />
system is designed to automate running of multiple earthquake wave propagation simulations, keeping all-aspects of the<br />
simulations identical except the velocity model used. CVM evaluations are run prior to release of new version of CVM-H, or<br />
2011 <strong>SCEC</strong> <strong>Annual</strong> <strong>Meeting</strong> | 53
Report | <strong>SCEC</strong> Research Accomplishments<br />
Figure 16. Example of CVM evaluation, using the 2008<br />
Chino Hills earthquake. (top) Map-based GOF for SA-2s,<br />
and (bottom) bias of spectral accelerations at 65 stations<br />
for periods 2-10s.<br />
regional seismic hazards assessment.<br />
54 | Southern California Earthquake Center<br />
other <strong>SCEC</strong> CVM's. Multiple CVM's are evaluated at one time, so that<br />
performance of a new CVM can be compared to existing, or prior,<br />
CVM versions. The GOF method includes a series of metrics, such as<br />
PGA, PGV, and spectral accelerations (SA) at various periods (Olsen<br />
and Mayhew 2010).<br />
Finally, we recognize that state-of-the-art velocity models do not<br />
resolve small-scale amplification effects in the near-surface sediments,<br />
possibly introducing bias in earthquake ground motion simulations,<br />
as frequencies increase. Preliminary analysis shows that even simple<br />
and rather weak fractal stochastic inhomogenities imply significant<br />
variations in ground motion amplifications (up to a factor of six or<br />
more) as well as de-amplification, including bands of strong<br />
amplification aligned along the average ray path from a 0-2 Hz<br />
horizontally propagating SH-wave source. Simulations with<br />
vertically incident planar SH-wave sources show that the small-scale<br />
heterogeneities included in the upper ~100m of the sediment column<br />
contribute more to the site effects, as compared to small-scale<br />
heterogeneities buried deeper in the sediments. Thus, the USR Focus<br />
Area is supporting efforts to explore how to establish a realistic<br />
stochastic model of near-surface inhomogeneities by comparison of<br />
earthquake ground motion simulations to data and by directly<br />
mapping the statistical properties of shallow Vs estimates. If<br />
incorporated in the CVMs, such models may improve deterministic<br />
ground motion prediction as supercomputers allow the highest<br />
frequency to increase.<br />
Community Fault Model (CFM)<br />
The <strong>SCEC</strong> Community Fault Model (CFM) is an object-oriented, 3D<br />
representation of more than 140 active faults in Southern California,<br />
and includes direct contributions from more than twenty <strong>SCEC</strong><br />
investigators (Plesch et al., 2007). The model consists of triangulated<br />
surface representations (T-surfs) of major faults, which are defined by<br />
surface geology, seismicity, well logs, seismic reflection profiles, and<br />
geologic cross sections. These 3D fault representations are intended to<br />
support <strong>SCEC</strong> research efforts in fault system modeling and<br />
earthquake rupture propagation, as well as to serve as a basis for<br />
This past year, we completed a major update of the model (CFM v.4.0), which incorporates improvements in 3D fault<br />
representations, a detailed fault surface trace layer, and a new naming and numbering scheme for individual 3D fault models<br />
that allows for direct connections to the USGS/CGS Quaternary Fault database (Qfaults) and other <strong>SCEC</strong> data sets (Nicholson<br />
et al., 2011). Fault representations in CFM are now referenced to the modern WG84 datum and the new surface layer in CFM<br />
allows 3D fault models to be registered to the more detailed Qfaults digital trace maps. Systematic revision of CFM 3D fault<br />
segments was required to ensure compatibility between some previous CFM fault representations and the newer Qfaults<br />
surface traces, as well as by the availability of extensive catalogs of relocated earthquake hypocenters to define better the<br />
subsurface geometry of active faults. New 3D fault representations for major fault zones include the San Andreas from San<br />
G<strong>org</strong>onio Pass to the Salton Sea, the Mecca Hills, San Jacinto, Elsinore-Laguna Salada (including El Mayor-Cucapah), and an<br />
Fernando/Sierra Madre fault systems. In addition, a new <strong>SCEC</strong> fault database hierarchical naming and numbering scheme is<br />
implemented that provides unique identifiers (number, name, abbreviation) for each level of the fault hierarchy under which a<br />
particular fault segment is classified. Levels of fault hierarchy include Fault Area, Fault Zone or System, Fault Section, Fault<br />
Name, Fault Strand or Model, and Fault Component. These additional fault hierarchical levels allow for more flexible
<strong>SCEC</strong> Research Accomplishments | Report<br />
database searches and easier identification of fault components, alternative representations, and possible system-level<br />
associations of individual 3D fault elements that comprise CFM.<br />
Finally, we also completed a second version of the statewide Community Fault Model (SCFM 2.0), which includes updates in<br />
the southern California model along with more than 150 new fault representations in northern California (Figure 17). In<br />
conjunction with the California Geological Survey and USGS, the model inventory was expanded to include all of the priority<br />
faults defined by the Uniform California Earthquake Rupture Forecast (UCERF 3) working group. We are currently<br />
coordinating our formal evaluation of the SCFM with the UCERF 3 effort. This will involve a virtual workshop in which<br />
participants evaluate the SCFM 2.0 using the <strong>SCEC</strong> VDO visualization software and be asked to assess the accuracy and<br />
completeness of the representations. This<br />
will involve assigning a quality ranking<br />
to each fault representation based on<br />
criteria used to evaluate the <strong>SCEC</strong> CFM.<br />
These rankings, which largely reflect the<br />
amount of data available to directly<br />
constrain the interpretations, will be<br />
used to rank alternative fault<br />
representations, with the highest ranked<br />
alternative being used to compose the<br />
preferred (versioned) fault model.<br />
References<br />
Anderson, M. L., C. W. Roberts, and R. C.<br />
Jachens, 2000, Principal facts for<br />
Figure 17. Perspective view of the Statewide CFM (SCFM 2.0), which includes more than<br />
gravity stations in the vicinity of San<br />
300 fault representations. Earthquakes are shown from Shearer et al., (2005).<br />
Bernardino, southern California, U.S.<br />
Geol. Surv. Open-File Rept. 00-193, 32 pp.<br />
Chen, P., Lee, E., Jordan, T. H., Maechling, P. J., Denolle, M., & Beroza, G. C., 2011, Full-3D Waveform Tomography for<br />
Southern California, 2011 SSA <strong>Annual</strong> <strong>Meeting</strong>, Memphis, TN.<br />
Chen, P., L. Zhao, Li, T. H. Jordan, 2007, Full 3D tomography for the crustal structure of the Los Angeles region, Bulletin of the<br />
Seismological Society of America, vol.97, no.4, pp.1094-1120.<br />
Graves, R., 2008, The Seismic Response of the San Bernardino Basin Region during the 2001 Big Bear Lake Earthquake,<br />
Bulletin of the Seismological Society of America, Vol. 98, No. 1, pp. 241–252.<br />
Komatitsch, D., Q. Liu, J. Tromp, P. Süss, C. Stidham, and J. H. Shaw, (2004), Simulations of strong ground motions in the Los<br />
Angeles basin based upon the spectral element method, BSSA, Vol. 94, No. 1, pp. 187–206.<br />
Lee, E., Chen, P., Jordan, T. H., Maechling, P. J., Denolle, M., & Beroza, G. C., 2010, Full-3D Waveform Tomography for<br />
Southern California, 2010 AGU Fall <strong>Meeting</strong>, San Francisco, CA.<br />
Magistrale, H., S. Day, R. W. Clayton, and R. Graves, 2001, The <strong>SCEC</strong> Southern California Reference Three-Dimensional<br />
Seismic Velocity Model Version 2: Bulletin of the Seismological Society of America, v. 90, no. 6B, p. S65-S76.<br />
Mayhew, J.E., and K.B. Olsen (2009). Goodness-of-fit criteria for broadband synthetic seismograms, with application to the<br />
2008 Mw5.4 Chino Hills, CA, earthquake, submitted to Seism. Res. Lett.<br />
Nicholson, C., A. Plesch, J.H. Shaw, 2011, CFM v.4.0: Continued upgrades and improvements to the <strong>SCEC</strong> Community Fault<br />
Model and its associated databases, 2011 <strong>SCEC</strong> <strong>Annual</strong> <strong>Meeting</strong>, Palm Springs, CA.<br />
Olsen, K. B., and J. E. Mayhew (2010), Goodness-of-fit criteria for broadband synthetic seismograms, with application to the<br />
2008 Mw 5.4 Chino Hills, California, earthquake, Seis. Res. Lett., 81 (5), 715–718.<br />
Plesch, A., John H. Shaw, Christine Benson, William A. Bryant, Sara Carena, Michele Cooke, James Dolan, Gary Fuis, Eldon<br />
Gath, Lisa Grant, Egill Hauksson, Thomas Jordan, Marc Kamerling, Mark Legg, Scott Lindvall, Harold Magistrale, Craig<br />
Nicholson, Nathan Niemi, Michael Oskin, Sue Perry, Ge<strong>org</strong>e Planansky, Thomas Rockwell, Peter Shearer, Christopher<br />
Sorlien, M. Peter Süss, John Suppe, Jerry Treiman, and Robert Yeats, 2007, Community Fault Model (CFM) for Southern<br />
California, Bulletin of the Seismological Society of America, v. 97, no. 6.<br />
Plesch, A., C. tape, and J.H. Shaw, 2009, CVM-H 6.0: integration of adjoint-based tomography, the San Joaquin basin and other<br />
advances in the <strong>SCEC</strong> community velocity model, <strong>SCEC</strong> <strong>Annual</strong> <strong>Meeting</strong>, Palm Springs, CA.<br />
2011 <strong>SCEC</strong> <strong>Annual</strong> <strong>Meeting</strong> | 55
Report | <strong>SCEC</strong> Research Accomplishments<br />
Shearer, P., E. Hauksson, and G. Lin, Southern California hypocenter relocation with waveform cross correlation: Part 2.<br />
Results using source-specific station terms and cluster analysis, Bull. Seismol. Soc. Am., 95, 904-915, doi:<br />
10.1785/0120040168, 2005.<br />
Stephenson, W. J., J. K. Odum, R. A.Williams, and M. L. Anderson, 2002, Delineation of faulting and basin geometry along a<br />
seismic reflection transect in urbanized San Bernardino valley, California, Bull. Seismol. Soc. Am. 92, 2504–2520.<br />
Süss, M. P., and J. H. Shaw, 2003, P-wave seismic velocity structure derived from sonic logs and industry reflection data in the<br />
Los Angeles basin, California, Journal of Geophysical<br />
Research, 108/B3.<br />
Tape, C., Q. Liu, A. Maggi, and J. Tromp, 2010, Seismic<br />
tomography of the southern California crust based on<br />
spectral-element and adjoint methods, Geophys. J. Int.,<br />
180, 433–462.<br />
Tape, C., Q. Liu, A. Maggi, and J. Tromp, 2009, Adjoint<br />
tomography of southern California, Science, vol 325, p.<br />
988-992.<br />
Fault and Rupture Mechanics<br />
The primary mission of the Fault and Rupture Mechanics<br />
Focus Group is to develop physics-based models of the<br />
nucleation, propagation, and arrest of dynamic rupture to<br />
understand earthquakes in Southern California. Specific<br />
research goals of FARM are to investigate the relative<br />
importance of different dynamic weakening mechanisms,<br />
characterize the constitutive behavior of faults and<br />
develop a capability to incorporate the behavior into<br />
dynamic rupture models, discover the relation of fault<br />
zone structure and earthquake mechanics at all scales, and<br />
determine the extent and causes of rupture directivity.<br />
Over the past year a large number of funded projects have<br />
addressed the research priorities of FARM using a variety<br />
of techniques. For the purpose of reporting research<br />
accomplishments, the projects are loosely categorized into<br />
the themes of fault-slip behavior, the micromechanics of<br />
faulting, the constitutive behavior of fault materials,<br />
advanced dynamic rupture modeling, and the<br />
characteristics of fault-slip and fault structure through<br />
observational studies in the field and laboratory. This<br />
section provides a brief summary of some<br />
accomplishments and research-related activities reported<br />
in March of 2011. Additional accomplishments are<br />
reviewed in other sections of this report. For a complete<br />
review of all FARM-related activities please see the annual<br />
reports for the individual projects posted on the <strong>SCEC</strong><br />
website.<br />
Mechanics-based Analysis of Fault Slip<br />
Behavior<br />
Building off of earlier work of Shearer et al. (2005), Bird<br />
recomputed Brune-type stress drops of magnitude 1.5-3.1<br />
earthquakes occurring in southern California from 1989 to<br />
2001 to test hypotheses relating stress drops to hypocentral<br />
56 | Southern California Earthquake Center<br />
Figure 18. Interpreted stress-drop regimes, based on temperature- and<br />
depth-systematics (from Fig. 3 in <strong>SCEC</strong> Report #10025). Dotted lines<br />
show steady-state geotherms for various heat-flows, based on the<br />
assumed crustal conductivity and radioactivity. Long-dashed curves<br />
show model brittle/ductile transition conditions (for strain rates varying<br />
over 4 orders of magnitude) in the homogeneous crustal rheology<br />
assumed by Liu & Bird [2002], whose models used the same thermal<br />
parameters and map of of heat flow.<br />
Figure 19. (a) The profiles of coseismic displacement on the Earth<br />
surface for the elastic simulation, a plastic simulation, an elastic<br />
prediction for the simulated slip distribution shown in panel b, and the<br />
best fitting model to the plastic response in the inversion. (b) The slip<br />
distribution in the plastic simulation and slip inversions of the surface<br />
displacements. The blue curve is the inverted slip of the surface<br />
displacement of the elastic prediction. The red curve is the inverted slip<br />
of the surface displacement of the simulated plastic response. (c)<br />
Difference between the inverted slip distributions shown in panel b,<br />
indicating that 10% (0.5 m) of the coseismic slip at 3-4 km depths is<br />
due to an artifact of the inversion that is based on the elastic model.
urial depth, long-term tectonic strain-rate, and terrane<br />
composition. He found that stress drops increase with<br />
temperature up to 250 degrees C and are independent of depth,<br />
whereas they decrease above 300 degrees C, showing a positive<br />
correlation with depth. He interprets the low temperature data<br />
to reflect a proportional relation between shallow-crustal stress<br />
drop and interseismic fault healing, consistent with rate and<br />
state theory. In contrast, he suggests that the higher<br />
temperature data reflect preseismic shear stresses controlled by<br />
dislocation creep and mean composition (Figure 18). To<br />
investigate the slip deficit suggested by inversions of geodetic<br />
data, Kaneko and Fialko (2011; 2010) investigated the effect of<br />
inelastic deformation in simulations of dynamic rupture on a<br />
planar, vertical strike-slip fault in 2-D numerical models<br />
following previous studies [e.g., Templeton and Rice, 2008; Ma,<br />
2008]. Kaneko and Fialko’s simulations suggest that shallow<br />
slip is overestimated by as much as 10% of the coseismic slip at<br />
<strong>SCEC</strong> Research Accomplishments | Report<br />
Figure 20. Fault-parallel component of the residual<br />
displacement field after an earthquake on the fault (solid<br />
black line) within a low-velocity fault zone FZ2. Motion<br />
across FZ1 is retrograde along AA', while it is sympathetic<br />
along BB'. They correspond to elastic and inelastic<br />
response of FZ1 to the rupture, respectively (shown in Fig.<br />
2 of <strong>SCEC</strong> Report #10191). (From Duan et al., 2011)<br />
depth if inelastic deformation is ignored (Figure 19), supporting the need to reinterpret existing geodetic data through forward<br />
modeling. Also exploring the effects of inelastic deformation, Duan (2010) and Duan et al. (2011) use dynamic models to<br />
investigate the response of the damage zone of one fault to an earthquake occurring along a nearby fault. For the case of<br />
parallel strike-slip faults, a heterogeneous distribution of triggered elastic and inelastic strain develops, where locally the<br />
inelastic and elastic shear strains can be of opposite sign (Figure 20). These results also have implications for the interpretation<br />
of geodetic (e.g., InSAR) data, and may provide some constraints on absolute stress levels along faults. Important to<br />
understanding slip gradients and slip deficits are sound techniques to estimate surface slip. Shaw (2011) has developed a new<br />
Figure 21. Averaging over slip differences as a function of separation. The different color curves are for each different earthquake. (a) Mean.<br />
(b) Standard deviation. (c) Mean/Standard deviation. The dashed black line shows the ratio for a normal distribution, which is seen to be a<br />
much better fit than either the tick mark below for a heavier tailed exponential distribution, or the tick mark above for a lighter tailed box-car<br />
function. From [Shaw, 2011].<br />
statistical method to infer slip gradients from noisy signals associated with large earthquakes. One important observation is<br />
that the average slip differences increase linearly to length scales of the seismogenic crust, yet when extrapolated back to zero<br />
separation a nonzero intercept results (Figure 21). Shaw's results are consistent with constant stress drop at length scales<br />
smaller than event size.<br />
Several <strong>SCEC</strong> researchers continue to explore tectonic tremor. Through analysis of small-aperture seismic arrays, Ampuero, in<br />
collaboration with Steidl and Vernon, confirmed a deep origin for tremor signals near the Anza gap on the San Jacinto fault<br />
and suggest that tremor swarms migrate rapidly in this region. To understand these migration patterns, and in particular, the<br />
rapid tremor reversals noted by Houston et al. (2011), Ampuero developed numerical simulations of slow slip and tremor<br />
swarms assuming a fault with heterogeneous frictional properties that is populated by a system of brittle asperities. When<br />
2011 <strong>SCEC</strong> <strong>Annual</strong> <strong>Meeting</strong> | 57
Report | <strong>SCEC</strong> Research Accomplishments<br />
subjected to transient creep, asperity failure occurs, initiating tremor sequences. Parametric studies are underway to define the<br />
properties that control the propagation velocity and distance.<br />
Pollard and Madden investigated the effects of non-planar and non-vertical fault geometry on aftershock focal mechanisms<br />
and fault slip distributions for the 1992 Landers earthquake. They analyzed slip distributions compiled and digitized by the<br />
California Geological Survey (CGS) (Bryant, 1992, 1994, 2004; CGS, 2002), used the HASH (Hardebeck and Shearer, 2002)<br />
algorithm and aftershocks relocated by Zanzerkia (2003), and performed numerical modeling using the quasi-static, linear<br />
elastic, boundary element program Poly3D (Thomas, 1993; Maerten et al., 2005). Their 3D characterization suggests that the<br />
orientations of focal mechanisms may reflect the local<br />
stress field produced by slip during the main shock<br />
and are sensitive to fault geometry. They show that<br />
failure is predicted on non-planar faults having a<br />
wide range of orientations (Figure 22 and Figure 23),<br />
not all consistent with the orientation of and sense-ofslip<br />
on the mainshock faults if they were assumed to<br />
be vertical and planar. Also exploring aspects of fault<br />
complexity, Cooke performed claybox models to<br />
study fault formation and demise in restraining<br />
stepovers along strike-slip faults. Part of her efforts<br />
focused on characterizing the rheologic properties of<br />
wet kaolin (in collaboration with van der Elst and<br />
Brodsky) demonstrating that below the yield stress<br />
wet kaolin displays elastic-plastic behavior, and at<br />
failure exhibits velocity weakening rate-and-state<br />
behavior, thereby serving as a sufficient analog<br />
material for upper crustal deformation.<br />
Micromechanics and Constitutive Behavior<br />
Using micromechanical damage mechanics, Sammis et al. have extended their investigation of the effect of strain rate on the<br />
generation of off-fault damage in the process zone of faults. They demonstrate direct agreement with laboratory data on<br />
fracture strength as a function of slip rate from quasistatic to coseismic rates (Figure 24), and are working to extend their<br />
analysis to address the relation of off-fault damage to earthquake rupture mechanics specifically for the case of a large fault<br />
subjected to multiple earthquakes. Oglesby and Beeler are investigating the dependence of fault strength on rapid changes in<br />
normal stress and their implications for<br />
dynamic rupture in the laboratory by<br />
shearing bare granite surfaces at normal<br />
stress between 5 and 7 MPa. They find that<br />
the response of shear stress to changes in<br />
normal stress evolves with time or<br />
displacement, therefore more closely<br />
resembling the results of Prakash (1998)<br />
and that constitutive relationship of<br />
Prakash (1998) provides the best model of<br />
the results (Figure 25). Oglesby and Beeler<br />
interpret these results to reflect the<br />
enhanced resolution and digital recording<br />
capabilities that were not available at the<br />
time of the Linker and Dieterich (1992)<br />
study. Continuing their work investigating<br />
plastic deformation and strain localization<br />
and their implications for dynamic rupture,<br />
Carlson et al. are generalizing their STZ<br />
58 | Southern California Earthquake Center<br />
Figure 22. Preferred model geometry in (a) map view with icons showing<br />
the locations of the analyzed aftershocks, and (b) oblique view, looking<br />
northwest. Vertical bars indicate fault extents.<br />
Figure 23. Normalized preferred model slip distributions along the (a) Johnson<br />
Valley fault, JVF and (b) Homestead Valley fault, HVF. Horizontal bars below the slip<br />
distributions show the extents of faults, as in Figs. 1 and 2 of <strong>SCEC</strong> Report #10035.
<strong>SCEC</strong> Research Accomplishments | Report<br />
theory to include grain fracture and a broad distribution of particle sizes to better represent the microphysical processes<br />
important during formation and shear of<br />
fault gouge (Bouchbinder and Langer<br />
2011a;b).<br />
Dynamic Rupture Modeling<br />
Figure 24. Comparison between experimental measurements of the strength of<br />
Pentelicon marble as a function of loading rate and the predictions of their dynamic<br />
damage mechanics model (Bhat, Rosakis, and Sammis, 2011, in prep.).<br />
2011 <strong>SCEC</strong> <strong>Annual</strong> <strong>Meeting</strong> | 59
Report | <strong>SCEC</strong> Research Accomplishments<br />
Numerous research groups are exploring various topics through dynamic rupture modeling. Segall and Dunham continued<br />
their analysis of thermal pressurization, analyzing its effect through all phases of nucleation and into the early stage of<br />
dynamic rupture using rate and state friction with the aging form of the state evolution law on an infinitely thin fault. Their<br />
simulations begin using a quasi-static nucleation code and switch to an elastodynamic code just before seismic radiation<br />
becomes significant (Schmitt et al. 2011). When they compare purely quasi-dynamic simulations to those incorporating<br />
elastodynamics, they find that the slip distributions are the same, but rupture propagation is about 2.5 times faster in the<br />
quasi-dynamic case. Incorporating elastodynamics slows crack growth to the P-wave speed. For an infinitely thin slip surface,<br />
they find that thermal pressurization begins to dominate fault-weakening at 0.06 mm/s, and once a maximum velocity of 0.2<br />
mm/s is reached, thermal pressurization is the only important weakening term (Figure 26). Inconsistent with observations,<br />
incorporating thermal pressurization in the dynamic simulations results in a total loss of shear strength, an artifact that they<br />
attribute to the spatially uniform stress and shear resistance. They have begun to explore models with two types of<br />
Figure 25. Simulations of the normal stress changes and shear stress response in the experiments that are shown in Fig. 2 of <strong>SCEC</strong><br />
Report #10145. The left 4 panels are using the constitutive relations of Linker and Dieterich (1992), arranged in the same order as in<br />
Fig. 2. Right 4 panels are using the constitutive relations of Prakash (1998).<br />
60 | Southern California Earthquake Center
<strong>SCEC</strong> Research Accomplishments | Report<br />
heterogeneity, a high shear stress<br />
region and a low effective normal<br />
stress region to address this issue,<br />
and intend to incorporate more<br />
realistic conditions to generate stress<br />
heterogeneities and weakness into<br />
their simulations in the future.<br />
Figure 26. Left: The effect of thermal pressurization on aging law nucleation. Lines are<br />
snapshots of slip speed on the fault. In red, snapshots for every 10-fold increase in vmax are<br />
Dunham et al. (2010; 2011a; 2011b)<br />
continued their studies of rupture<br />
along planar and nonplanar faults<br />
governed by strongly rate-weakening<br />
friction and off-fault plasticity. They<br />
shown for nucleation with thermal pressurization. The nucleation zone starts as a growing find that the average rupture length<br />
crack, then shrinks. For comparison, the isothermal profile for a maximum velocity of 100 increases with increasing shear stress<br />
mm/s is shown; crack growth continues in this case. Right: Critical velocity. The two<br />
weakening terms (averaged over the slipping zone) are plotted against the maximum velocity.<br />
Rate/state friction dominates the weakening until a critical velocity of 0.06 mm/s, at which point<br />
and decreases<br />
roughness, and<br />
with<br />
that<br />
increasing<br />
a critical<br />
thermal pressurization becomes the dominant weakening term in the equation of motion. By background stress level is required<br />
the time the maximum velocity reaches 0.2 mm/s, thermal pressurization becomes the only for self-sustaining rupture<br />
weakening term. Rate/state friction becomes strengthening because of its direct velocitystrengthening<br />
component. The dashed line is a reference line with slope -3/2.<br />
propagation (Figure 27). At this stress<br />
level, rupture velocity fluctuates<br />
significantly and propagation becomes notably<br />
sensitive to roughness. Currently, this group is<br />
developing a time-stepping methodology to<br />
explore the evolution of stress states over the<br />
interseismic period and plan to simulate<br />
earthquake cycles with multiple rupture<br />
events. Following Dunham’s work in 2D, Ma<br />
(2010) studied the effects of heterogeneous<br />
fault geometry on rupture dynamics in 3D<br />
with off-fault plasticity. Using his previously<br />
developed finite element code (Ma, 2008; Ma<br />
and Andrews, 2010) and a slip-weakening law<br />
he calculated the rupture dynamics and<br />
seismic radiation, demonstrating that fault<br />
roughness causes small wavelength<br />
irregularity in the rupture fronts that can serve<br />
as a potential source of high-frequency<br />
radiations (Figure 28). Furthermore,<br />
Figure 27. (a) Spatially uniform prestress field with ψ being the angle between the<br />
maximum principal compressive stress and the surface y = 0. (b)-(f) Ensemble<br />
simulations showing extent of earthquake ruptures on 100 randomly generated selfsimilar<br />
faults under different background stress levels. Colors alternate to distinguish<br />
ruptures. Ruptures stop naturally at unfavorable fault bends or reach the end of the<br />
simulation domain. At the lower background stress levels, like in (a), most ruptures<br />
arrest soon after nucleation and large events are the exception.<br />
rapid healing produces a more pulse-like<br />
rupture that is characterized by significant<br />
heterogeneous changes in shear and normal<br />
stress. Higher resolution simulations to<br />
resolve the distributions of plastic yielding<br />
currently are underway. Duan and colleagues<br />
(2010) have continued their investigation of<br />
the effect of off-fault plastic yielding and timedependent<br />
pore pressure variations on<br />
dynamic rupture propagation through stepover<br />
regions between parallel strike-slip faults<br />
using the finite element dynamic code EQdyna.<br />
When compared to simulations in elastic<br />
2011 <strong>SCEC</strong> <strong>Annual</strong> <strong>Meeting</strong> | 61
Report | <strong>SCEC</strong> Research Accomplishments<br />
medium (Harris and Day, 1993), they find that plastic yielding<br />
has little influence on compressional step-over ruptures, but<br />
significantly reduces the along strike overlap required for<br />
jumping and allows for a wider stepover region along<br />
dilatation stepovers (Figure 29). Time-dependent porepressure<br />
changes allow rupture jumping over wider<br />
compressional stepovers, but significantly reduce the ability<br />
Figure 28. Rupture contours every 0.5 s are mapped on the fault.<br />
for rupture jumping at dilatational stepovers. When<br />
considered together, time-dependent pore-pressure changes have the greatest effect on the resultant behavior (Figure 30).<br />
Several research groups examined rupture propagation along branching faults. Rice and colleagues address the physical and<br />
modeling issues associated with rupture propagation through branched triple junctions using 2D finite element methods<br />
(DeDontney et al., 2011). When a non-cohesive<br />
elastic-plastic material is employed, the elevated stresses around the rupture tip and at the branch junction promote material<br />
failure and inhibit opening, especially in the damage zones of mature faults (Figure 31). Opening may occur in intact<br />
crystalline rock and deformed zones that have experienced significant cementation (i.e., rocks having large cohesive strength),<br />
but is accompanied by significant material softening, decreasing the material strength with shear. Off-fault-plasticity also<br />
promotes rupture of extensional side branches and inhibits rupture on compressional side branches. Oglesby and Bowman<br />
continue to use the finite-element method to model the dynamics of branched faults, extending the work of King et al. (2005).<br />
Over the past year, <strong>SCEC</strong> intern Jennifer Tarnowski, investigated how the size and shape of the barrier on the vertical fault<br />
affected rupture propagation to the dipping fault. Her results suggest that the barrier on the vertical fault must be larger than<br />
some minimum area for the rupture to move to the dipping fault (Figure 32). To test the hypothesis that rupture propagation<br />
preferentially occurs in the direction of the more compliant side of a bi-material interface, producing greater damage on the<br />
stiffer side, and to understand the influence of material contrast on fault branching in 2D, DeDontney et al. (2011 in press;<br />
2011; 2011 submitted) examined the role of stress state on the distribution of plastic strain and the direction of rupture<br />
propagation. Their results suggest several factors contribute to determining rupture directivity and branch location. For plastic<br />
deformations, the most critical parameter is the orientation of the greatest compressive stress. DeDontney et al. demonstrate<br />
that plastic yielding is predicted in both the stiff and compliant sides, depending on the stress orientation, and rupture<br />
propagation can occur in the direction of slip displacement in the stiffer material if the most compressive stress is at a low<br />
angle to the master fault. Furthermore, fault branches are more<br />
likely to rupture when the branch is in the more compliant<br />
material, regardless of the stress state (Figure 33). Returning to<br />
the theme of planar faults and bimaterials (e.g., Andrews and<br />
Ben-Zion, 1997; Harris and Day, 1997), Rubin and Wang use<br />
observations to test the hypothesis that directivity is related to<br />
across-fault contrast in elastic properties. They (Wang and<br />
Rubin, 2011) performed inversions of spectral ratios of<br />
microearthquakes on the northern creeping section of the SAF<br />
to determine if SE propagation is favored. The spectral ratio<br />
data were fit with the moving point source model to give<br />
estimates of rupture lengths. The data suggest that of the 40% of<br />
earthquake events that can be classified as bilateral ruptures,<br />
the rupture length of the SE end is longer in ~67% of the cases,<br />
Figure 29. Effects of off-fault off- off fault plastic yielding on locations on fault 2 where<br />
and for rupture segments that can be defined as more nearly<br />
propagating ruptures on fault 1 (blue line) jump onto fault 2 through dilational or unilateral, more than ~75% propagate to the SE, and when<br />
compressional stepovers with different widths. Internal friction of 0.85 and defined, have approximately 10% faster propagation velocities.<br />
cohesion of 25 MPa are used to characterize off-fault rock strength in the models They conclude that the asymmetry in aftershock occurrence and<br />
with off-fault plastic deformation.<br />
SE directivity reflect the across-fault material contrast.<br />
Although the inversion results show that the directivity is<br />
somewhat broadly scattered, their analysis clearly demonstrates<br />
that several SE-propagating, strongly unilateral events do not<br />
have NW-propagating counterparts, regardless of the model<br />
62 | Southern California Earthquake Center<br />
Figure 30. Combined effects of off-fault plastic yielding and time-dependent<br />
pore-pressure on the ability of rupture jumping across a stepover.
Figure 31. Image of the branching junction some time after the<br />
rupture has propagated onto the compressive side branch and a small<br />
distance along the main fault. Contours show the shear stress level.<br />
(a) Opening occurs at the junction for an elastic off-fault material. (b)<br />
Opening does not occur for an incohesive elastic-plastic material.<br />
Figure 32. Ability of rupture to propagate from the vertical to the dipping fault as a function of the<br />
height and width of the barrier on the vertical fault. Dashed curve: best-fitting curve of constant<br />
barrier area, signifying the minimum barrier size for rupture propagation to the dipping fault. Solid<br />
curve: best-fitting curve that separates the part of phase space with dipping fault slip from the part<br />
with only vertical fault slip. A comparison of a) and b) shows that multiplying the slip-weakening<br />
distance by /2 causes the minimum barrier area to double, in agreement with the idea that the<br />
barrier needs to cause a patch of critical area on the dipping fault to exceed its static frictional<br />
stress in order to nucleate spontaneous rupture on the dipping fault.<br />
<strong>SCEC</strong> Research Accomplishments | Report<br />
parameterization (Figure 34). When all well-resolved<br />
events are considered, the data suggest that the tendency<br />
for SE propagation increases with event size (Figure 35).<br />
An additional interesting result is that events with nearby<br />
foreshocks tend to propagate away from their foreshocks.<br />
The multi-investigator Rupture Dynamics Code Validation<br />
project continued to make excellent progress, and the<br />
group's work on verifying the code used to predict extreme<br />
ground motions at Yucca Mountain is being published this<br />
September (Harris et al., 2011). In early 2011, group<br />
members, along with a stealth international following,<br />
tackled a 2D thermal pressurization benchmark. The<br />
results matched well when the codes used an element<br />
spacing smaller than 100 m. The group also worked on two<br />
branched-fault benchmarks, each in 2D and 3D versions.<br />
These latter exercises were the first non-planar fault<br />
geometries to be treated. The results were that the 2D codes<br />
generated better matches than the 3D codes did, and that<br />
some modelers were unable to execute the 3D benchmarks<br />
because of limitations in the computational capacities of<br />
their research institutions. Part of the challenge with the<br />
fault-branch benchmarks was that different codes assume<br />
different locations for edges and<br />
ends of faults. Whereas this was less<br />
of an issue when simulating<br />
ruptures that nucleate in the middle<br />
of planar faults, the fault branch<br />
case includes a fault intersection.<br />
How to numerically handle fault<br />
intersections (and what they look<br />
like in nature) is a topic of<br />
discussion in our community that<br />
will likely continue into <strong>SCEC</strong>4.<br />
DeDontney et al. (2011 submitted)<br />
discusses some of the challenges of<br />
fault-intersection simulations, in 2D.<br />
Upcoming Dynamic Rupture group<br />
plans include exploring 2D and 3D<br />
fault branches with off-fault<br />
yielding, in addition to rupture<br />
simulations on a vertical strike-slip<br />
fault with a heterogeneous initial<br />
on-fault stress condition. The<br />
heterogeneous initial conditions,<br />
planar-fault benchmark(s) will once<br />
again unify the group's efforts in<br />
that all of the participating dynamic earthquake rupture codes can simulate earthquakes on vertical faults. In addition,<br />
describing and quantifying fault stress heterogeneity is an important topic that spans multiple <strong>SCEC</strong> groups, demonstrating<br />
that we are continuing to address critical earthquake-science topics.<br />
2011 <strong>SCEC</strong> <strong>Annual</strong> <strong>Meeting</strong> | 63
Report | <strong>SCEC</strong> Research Accomplishments<br />
Figure 33. Branch activation results. Both compressional side branches (a) and extensional side branches (b) are more likely to<br />
rupture when the branch is in a more compliant ("slower") material.<br />
Figure 34. Inversion results for the directivity of 3103 earthquakes. (a) Central points of the posterior pdfs, color-coded<br />
according to the resolution of directivity (the width of the 90% confidence interval of LSE/[LSE + LNW]). Only events for<br />
which this resolution is < 0.6 are shown. (b) The same but for an inversion where the a priori distribution of rupture<br />
propagation velocities to the SE is 10% faster than that to the NW.<br />
Figure 35. (a) Cumulative number of the 887 well-resolved events in five different regions of Figure FARM16b, indicated<br />
by the dashed lines in that figure. The cumulative events are plotted as function of total inverted rupture length LSE +LNW.<br />
(b) Histograms of LSE/(LSE +LNW) for all the well-resolved events in Figure FARM16b (black) and for those with total<br />
inverted length smaller than 100 m (blue, 444 events) and larger than 100 m (red, 443 events).<br />
64 | Southern California Earthquake Center
<strong>SCEC</strong> Research Accomplishments | Report<br />
Figure 36. Stress redistribution on faults with heterogeneous strength significantly affects the long-term seismic fault<br />
behavior. Left: Model of a rate-and-state fault with non-uniform distribution of normal stress motivated by fault nonplanarity.<br />
Right: Distribution of rupture speeds over the fault for selected events. When the initial shear prestress is arbitrarily<br />
chosen to be uniform, the rupture speed in the 1st event varies significantly over the fault (top panel, the case of 10%<br />
normal stress variation). However, the 5th event of the same simulation (second panel) has nearly constant rupture speed,<br />
similar to the case with uniform normal stress (not shown). The other panels show the 5th events for cases with 20% and<br />
40% variation.<br />
Large-scale dynamic rupture simulations carried out by <strong>SCEC</strong> teams have the potential to provide novel and critical<br />
information for the assessment of seismic hazard in Southern California. It is important to understand how to assign initial<br />
conditions for these simulations that are consistent with other assumed ingredients for dynamic rupture simulations,<br />
including fault geometry, materials, initial stresses, and friction (e.g., Harris, 2004). Several groups are focusing on these<br />
critical issues. As an example, Lapusta and colleagues are studying how dynamic rupture interacts with fault heterogeneity<br />
over many earthquake cycles, taking into account the effect of prior fault slip. Dynamic rupture simulations suggest that both<br />
variations in fault strength and fault prestress can strongly influence the development of dynamic ruptures, e.g. induce or<br />
suppress supershear rupture speeds (e.g., Day, 1982; Madariaga et al., 1998; Madariaga and Olsen, 2000; Fukuyama and Olsen,<br />
2002; Dunham et al., 2003; Liu and Lapusta, 2008). Two distributions – of fault strength and shear stress – are often assumed<br />
independently, but they are related due to prior fault slip. To assess how the distribution of fault strength affects typical fault<br />
prestress before large events, Lapusta’s group simulates long-term slip on a fault segment that includes multiple earthquake<br />
cycles and (i) resolves all the stages of every single earthquake in detail, including earthquake nucleation, dynamic rupture<br />
propagation and arrest, and (ii) reproduces post-seismic slippage and interseismic creep (Lapusta et al., 2000; Lapusta and Liu,<br />
2009). These simulations of faults with heterogeneous normal stress distributions motivated by non-planar faults (Jiang and<br />
Lapusta, AGU, 2010) show that the RMS mismatch between the representative static fault strength and prestress before modelspanning<br />
events evolves to near-constant values in the long-term history of the fault. In a set of models, comparison between<br />
the first simulated earthquake and subsequent events shows that shear stress redistribution over time at least partially<br />
compensates for the heterogeneity in fault strength, diminishing its effect on seismic events (Figure 36). Quantifying the longterm<br />
mismatch between strength and prestress in terms of the model parameters, such as the degree of fault heterogeneity,<br />
could provide physically based guidance for assigning initial conditions in simulations of single dynamic earthquake ruptures.<br />
Observational Studies of Fault Slip and Fault Structure<br />
Wechsler et al. (2011) characterize the composition, structure and particle size distribution (PSD) of pulverized and damaged<br />
granitic rocks in a 42-m-deep core adjacent to the San Andreas Fault near Littlerock, CA. The cored section is composed of<br />
pulverized granites and granodiorites, and is cut by numerous mesoscopic secondary shears. The most pronounced faultrelated<br />
alteration occurs along the shears, and is a function of both composition and depth. Alteration to clay appears to be the<br />
result of fluid–rock interaction and brittle deformation under low temperature conditions, rather than of surface-related<br />
weathering. The zones of pulverization that lack significant weathering likely reflect repeating episodes of dynamic dilation<br />
and contraction. The mean particle size for the majority of pulverized and cataclastic samples falls between 50 and 470 µm,<br />
and PSDs can be fit by a power law, with D-values ranging between 2.5 and 3.1. To better understand the response of damage<br />
2011 <strong>SCEC</strong> <strong>Annual</strong> <strong>Meeting</strong> | 65
Report | <strong>SCEC</strong> Research Accomplishments<br />
zones to movement through bends in fault surfaces, Becker et al. are characterizing the structure and intensity of damage<br />
along the North Branch of the San Gabriel fault, and Evans is focusing on defining deformation mechanisms and slip<br />
processes at high temperature conditions.<br />
References<br />
Andrews, D. J., and Y. Ben-Zion (1997), Wrinkle-like slip pulse on a fault between different materials, J. Geophys. Res., v. 102,<br />
553-571, doi:10.1029/96JB02856<br />
Bouchbinder, E., ,and J. S. Langer (2011), Shear-Transformation-Zone Theory of Linear Glassy Dynamics, Phys. Rev. E 83,<br />
061503. ArXiv:1101.2015<br />
Bouchbinder, E., and J. S. Langer, Linear Response Theory for Hard and Soft Glassy Materials (2011), Phys. Rev. Lett. 106,<br />
148301. ArXiv:1101.3539<br />
Bryant, W. A. (1992), Surface rupture along the Johnson Valley, Homestead Valley, and related faults associated with the M7.5<br />
28 June 1992 Landers Earthquake, Div. of Mines & Geology Fault Evaluation Report 234, 239, CA Dept of Conservation,<br />
Sacramento.<br />
Bryant, W. A. (1994), Surface fault rupture along the Homestead Valley, Emerson, and related faults associated with the M7.3<br />
28 June 1992 Landers Earthquake, Div. of Mines & Geology Fault Evaluation Report 239, CA Dept of Conservation,<br />
Sacramento.<br />
Bryant, W. A. (2004), Surface rupture associated with the June 28, 1992, Mw 7.3 Landers earthquake, Iron Ridge, Fry Mountain,<br />
and Camp Rock Mine 7.5 minute quadrangles, San Bernardino, CA, CA Geological Survey unpublished digital mapping<br />
for the Pacific Earthquake Engineering Research Center, Sacramento.<br />
California Geological Survey (2002), GIS files of official maps of Alquist-Priolo earthquake fault zones, southern region, CA<br />
Geological Survey CD 2001-05, Sacramento.<br />
Day, S. M. (1982), Three-dimensional simulations of spontaneous rupture: The effect of nonuniform prestress. Bull. Seismol.<br />
Soc. Am., 72, 1881–1902.<br />
DeDontney, N., E. L. Templeton-Barrett, J. R. Rice, and R. Dmowska (2011, in press), Influence of Plastic Deformation on<br />
Bimaterial Fault Rupture Directivity, J. Geophys. Res., doi:10.1029/2011JB008417, in press.<br />
DeDontney, N., J. R. Rice, and R. Dmowska (2011), Influence of material contrast on fault branching behavior, Geophys. Res.<br />
Lett., 38, L14305, doi:10.1029/2011GL047849.<br />
DeDontney, N., J. R. Rice, and R. Dmowska (2011, submitted), Finite element model of branched ruptures including off-fault<br />
plasticity, Bull. Seism. Soc. Am.<br />
Duan, B. (2010), Inelastic response of compliant fault zones to nearby earthquakes, Geophys. Res. Lett., 37, L16303,<br />
doi:10.1029/2010GL044150.<br />
Duan, B., J. Kang, and Y.-G. Li (2011), Deformation of compliant fault zones induced by nearby earthquakes: Theoretical<br />
investigations in two dimensions, J. Geophys. Res., vol. 116, B03307, doi:10.1029/2010JB007826.<br />
Dunham, M., P. Favreau, and J. M. Carlson (2003), A supershear transition mechanism for cracks, Science, 299, 1557–1559.<br />
Dunham, E. M., D. Belanger, L. Cong, and J. E. Kozdon (2011), Earthquake ruptures with strongly rate-weakening friction and<br />
off-fault plasticity: 1. Planar faults, Bull. Seism. Soc. Am., in press.<br />
Dunham, E. M., D. Belanger, L. Cong, and J. E. Kozdon (2011), Earthquake ruptures with strongly rate-weakening friction and<br />
off-fault plasticity: 2. Nonplanar faults, Bull. Seism. Soc. Am., in press.<br />
Fukuyama, E., and K.B. Olsen (2002), A condition for supershear rupture propagation in a heterogeneous stress field. Pure.<br />
Appl. Geophys., 157, 2047–2056.<br />
Hardebeck, J. L., and P. M. Shearer (2002), A new method for determining first-motion focal mechanisms, Bull. Seism. Soc.<br />
Am., v. 92; no. 6; p. 2264-2276; DOI: 10.1785/0120010200.<br />
Harris, R. A. (2004), Numerical simulations of large earthquakes: dynamic rupture propagation on heterogeneous faults, Pure<br />
and Applied Geophysics, vol. 161, No.11/12, pp. 2171-2181, DOI: 10.1007/s00024-004-2556-8.<br />
Harris, R. A., and S. M. Day (1993), Dynamics of fault interaction: Parallel strike-slip faults, J. Geophys. Res., 98, 4461-4472.<br />
Harris, R. A., and S. M. Day (1997), Effects of a low-velocity zone on a dynamic rupture, Bull. Seism. Soc. Am., v. 87; no. 5, p.<br />
1267-1280.<br />
Harris, R. A., M. Barall, D. J. Andrews, B. Duan, E. M. Dunham, S. Ma, A.-A. Gabriel, Y. Kaneko, Y. Kase, B. Aagaard, D.<br />
Oglesby, J.-P. Ampuero, T. C. Hanks, and N. Abrahamson (2011), Verifying a computational method for predicting<br />
extreme ground motion, Seism. Res. Lett., Vol. 82, No. 5, September/October 2011.<br />
66 | Southern California Earthquake Center
<strong>SCEC</strong> Research Accomplishments | Report<br />
Hillers, G., and J.-P. Ampuero (2011), Spontaneous harmonic tremors on the San Jacinto fault, southern California, submitted<br />
to Nature Geoscience.<br />
Houston, H., B. G. Delbridge, A. G. Wech and K. C. Creager (2011), Rapid tremor reversals in Cascadia generated by a<br />
weakened plate interface, Nature Geoscience 4, 404–409, doi:10.1038/ngeo1157.<br />
Jiang, J., and N. Lapusta (2010), Dynamic rupture on faults with heterogeneous strength due to non-uniform normal stress:<br />
The effect of stress redistribution by prior events, Abstract S33E-05 presented at 2010 Fall <strong>Meeting</strong>, AGU, San Francisco,<br />
Calif., 13-17 Dec.<br />
Kaneko, Y., and Y. Fialko (2011), Shallow slip deficit due to large strike-slip earthquakes in dynamic rupture simulations with<br />
elasto-plastic response, Geophysical Journal International, doi:10.1111/j.1365-246X.2011.05117.x<br />
Kaneko, Y., and Y. Fialko (2010), Modeling shallow slip deficit in large strike-slip earthquakes using simulations of<br />
spontaneous earthquake sequences in elasto-plastic media, Abstract T33B-2248 presented at 2010 Fall <strong>Meeting</strong>, AGU, San<br />
Francisco, Calif., 13-17 Dec.<br />
King, G. C. P., Y. Klinger, D. Bowman, and P. Tapponnier (2005). Slip-partitioned surface breaks for the Mw 7.8 2001 Kokoxili<br />
Earthquake, China, Bulletin of the Seismological Society of America 95, 731-738, doi:10.1785/0120040101.<br />
Lapusta N., J. R. Rice, Y. Ben-Zion, and G. Zheng (2000), Elastodynamic analysis for slow tectonic loading with spontaneous<br />
rupture episodes on faults with rate- and state-dependent friction, J. Geophys. Res., 105, 23,765-23,789.<br />
Lapusta, N, and Y. Liu (2009), Three-dimensional boundary-integral modeling of spontaneous earthquake sequences and<br />
aseismic slip, J. Geophys. Res., 114, B09303, doi:10.1029/2008JB005934.<br />
Linker, M .F., and J. H. Dieterich (1992), Effects of variable normal stress on rock friction: Observations and constitutive<br />
relations, Journal of Geophysical Research, 97 (B4), 4923-4940.<br />
Liu, Y., and N. Lapusta (2008), Transition of mode II cracks from sub-Rayleigh to intersonic speeds in the presence of favorable<br />
heterogeneity. J. Mech. Phys. Solids, 56, 25–50, doi:10.1016/j.jmps.2007.06.005.<br />
Ma, S. (2008), A physical model for widespread near-surface and fault zone damage induced by earthquakes, Geochem.<br />
Geophys. Geosyst., 9, Q11009, doi:10.1029/2008GC002231.<br />
Ma, S., and D. J. Andrews (2010), Inelastic off-fault response and three-dimensional earthquake rupture dynamics on a strikeslip<br />
fault, J. Geophys. Res., 115, B04304, doi:10.1029/2009JB006382.<br />
Madariaga, R., K. B. Olsen, and R. J. Archuleta (1998), Modeling dynamic rupture in a 3-D earthquake fault model. Bull.<br />
Seismol. Soc. Am., 88, 1182–1197.<br />
Madariaga, R., and K. B. Olsen (2000), Criticality of rupture dynamics in 3D. Pure. Appl. Geophys., 157, 1981–2001.<br />
Maerten, F., P. Resor, D. D. Pollard and L. Maerten (2005). Inverting for slip on three-dimensional fault surfaces using angular<br />
dislocations, Bull. Seismo. Soc. Am. 95 1654-1665.<br />
Prakash, V. (1998), Frictional response of sliding interfaces subjected to time varying normal pressures, Journal of Tribology,<br />
120, 97-102.<br />
Schmitt, S. V., P. Segall, and T. Matsuzawa (2011), Shear heating-induced thermal pressurization during earthquake nucleation,<br />
J. Geophys. Res, 116, B06308, doi:10.1029/2010JB008035<br />
Shaw, B.E. (2011), Surface Slip Gradients of Large Earthquakes, Bulletin of the Seismological Society of America, 101, 792.<br />
Shearer, P., E. Hauksson, and G. Lin (2005), Southern California hypocenter relocation with waveform cross-correlation: Part 2.<br />
Results using source-specific station terms and cluster analysis, Bull. Seismol. Soc. Am., 95, 904-915,<br />
doi:10.1785/0120040168.<br />
Templeton, E. L., and J. R. Rice (2008), Off-fault plasticity and earthquake rupture dynamics, 1. Dry materials or neglect of<br />
fluid pressure changes, J. Geophys. Res., 113.<br />
Thomas, A. L. (1993), Poly3D: a three-dimensional, polygonal element, displacement discontinuity boundary element<br />
computer program with applications to fractures, faults, and cavities in the Earth’s crust, Master’s Thesis, Stanford<br />
University, Stanford, CA.<br />
Wang, E., and A. M. Rubin (2011), Rupture directivity of microearthquakes on the San Andreas Fault from spectral ratio<br />
inversion, Geophys. J. Int., 186, *Wechsler, N., E. E. Allen, T. K. Rockwell, G. Girty, J. S. Chester, Y. Ben-Zion (2011),<br />
Characterization of pulverized granitoids in a shallow core along the San Andreas Fault, Little Rock, CA, Geophys. J. Int.,<br />
V.186, Issue 2, doi: 10.1111/j.1365-246X.2011.05059.x.<br />
Zanzerkia, E. (2003), Towards an understanding of seismic triggering through precise earthquake locations, PhD Thesis,<br />
Stanford University, Stanford, CA.<br />
2011 <strong>SCEC</strong> <strong>Annual</strong> <strong>Meeting</strong> | 67
Report | <strong>SCEC</strong> Research Accomplishments<br />
Zhao, P., Z. Peng, Z. Shi, M. A. Lewis, and Y. Ben-Zion (2010), Variations of the velocity contrast and rupture properties of M6<br />
earthquakes along the Parkfield section of the San Andreas Fault, Geophys. J. Int., 180, 765–780, doi:10.1111/j1365-<br />
246X.2009.04436.x.<br />
Crustal Deformation Modeling<br />
The goal of the <strong>SCEC</strong> Crustal Deformation Modeling (CDM) focus group is gaining an understanding of how faults work<br />
mechanically, during the interseismic interval and over geological time. This provides insights on absolute stresses and<br />
stressing rates in the Earth’s crust (and along active faults in particular). We also use our deformation models to estimate fault<br />
slip rates and other parameters from surface velocity data (e.g. the <strong>SCEC</strong> GPS velocity field), for the UCERF rupture<br />
forecasting process. For 2010, forty <strong>SCEC</strong> proposals were flagged by the PI’s as fitting into the CDM Focus Area, though<br />
perhaps half of these related directly to modeling static deformation of the Earth’s crust. Our activities for 2010 may be<br />
divided loosely into four categories (there is some overlap): (i) conducting workshops, (ii) block and boundary-element<br />
modeling, (iii) modeling long-term deformation (at the regional scale or within individual fault systems), and (iv) modeling<br />
earthquake-cycle deformation. Developing earthquake simulators is a joint undertaking with EFP, so we will summarize just<br />
the workshop here.<br />
Figure 37. Second invariant of the 2D horizontal strain rate tensor, derived from GPS velocity measurements using a variety of approaches.<br />
The original references may be found in the following URL: http://sceccore.usc.edu/proposalfiles/2010reports/Thatcher_10082_report.pdf. The<br />
area shown here is limited to the union of the coverage of all 15 strain rate maps that were submitted by GPS-UCERF workshop participants.<br />
For comparison purposes only, the area distribution of the earthquake probability P of the UCERF-2 earthquake forecast ("UCERF, bottom<br />
right panel) was scaled into strain rate using the following ad-hoc formula: dε/dt = 10P + 3.4 . The 3.4 factor was selected so the variance on<br />
the UCERF2 strain rate matched the median variance of the 15 strain rate maps. From David Sandwell.<br />
68 | Southern California Earthquake Center
Workshops<br />
<strong>SCEC</strong> Research Accomplishments | Report<br />
<strong>SCEC</strong> supported three workshops related to crustal deformation modeling in 2010, covering (i) finite-element deformation<br />
modeling, (ii) integrating GPS into the UCERF3 process, and (iii) comparing earthquake simulators.<br />
The ninth annual Workshop on Crustal Deformation Modeling (June 14-18, 2010, in Golden Colorado) was co-sponsored by<br />
<strong>SCEC</strong> and the Computational Infrastructure for Geodynamics (CIG), and attracted 68 participants. The first two days were<br />
dedicated to training in the use of state-of-the-art finite-element codes for modeling crustal deformation with the remaining<br />
three days filled with science talks and discussions. See http://www.geodynamics.<strong>org</strong>/cig/workinggroups/short/workshops/cdm-<br />
10/agenda for the complete agenda and slides for all of the presentations. This year’s workshop included several presentations<br />
on the recent Haiti, Chile, and El Mayor-Cucapah earthquakes along with talks on fault and bulk rheologies with a focus on<br />
the base of the seismogenic zone. A discussion at the end of the workshop indicated overwhelming support for continuing the<br />
series of annual workshops. In early 2011 the <strong>org</strong>anizing committee decided that in order to keep the scientific agenda fresh<br />
and increase interest among leading researchers, we will switch to biannual meetings and skip holding a workshop in 2011.<br />
Instead we will hold a virtual (online) workshop in 2011 focused solely on training users in the use of PyLith and related codes<br />
for modeling crustal deformation. This experiment with online training should enable us to determine if this approach is<br />
effective and how to distribute our efforts in the future between in-person training at workshops versus online training.<br />
Figure 38. Slip rate estimates on some fault<br />
segments from elastic block models, supplied by<br />
GPS-UCERF workshop participants. Right-lateral<br />
is positive. Left-lateral is negative. Results shown<br />
here were provided by Rob McCaffrey; Brendan<br />
Meade and Jack Loveless; and Kaj Johnson and<br />
Raymond Chuang. From Kaj Johnson. (This<br />
exercise has been superceded by a new block<br />
modeling test exercise, developed in 2011 by Kaj<br />
Johnson.)<br />
In April 2010, the inaugural workshop on incorporating geodetic<br />
surface deformation data into UCERF3 was held in Pomona, California<br />
(42 attendees, by invitation). A number of goals potentially achievable<br />
within a year were identified including (1) slip rate estimates—with<br />
uncertainties or ranges—for all major and some minor faults of the<br />
extended San Andreas system; (2) strain rate estimates or bounds on<br />
rates for selected regions lying off the major faults of the San Andreas<br />
system; and (3) corrections or bounds on perturbing effects of postseismic<br />
deformation and elastic crustal moduli heterogeneities on the<br />
observed GPS velocity field. Test exercises related to these items<br />
included a comparison of southern California strain rate fields<br />
generated by several researchers (coordinated by David Sandwell,<br />
Scripps), a block modeling test exercise, using the <strong>SCEC</strong> GPS velocity<br />
field (version 3) and a specified block model geometry (coordinated by<br />
Kaj Johnson, Indiana U), and an exercise exploring the range of fault<br />
slip rates, locking depths, interseismic moment accumulation that<br />
might be inferred from a GPS velocity profile across a single fault<br />
(coordinated by Elizabeth Hearn, UBC). The results of the former two<br />
activities (Figures 37 and Figure 38) indicated large discrepancies,<br />
which need to be understood before we provide information to<br />
WGCEP.<br />
Immediate follow-on activities were identified to begin implementing<br />
the goals enumerated here. These include tightly focused mini- and<br />
micro- workshops of 5 to 20 participants each that would be oriented<br />
along the same niche specialist lines as the 3 main Pomona workshop<br />
sessions. The first of these workshops was held in Golden, Colorado in<br />
July (a micro-workshop with just the four <strong>org</strong>anizers of the main<br />
workshop, Ned Field (USGS/WGCEP), and a few other participants)<br />
and a mini-workshop with some 20 attendees at the <strong>SCEC</strong> <strong>Annual</strong> <strong>Meeting</strong> in September 2010. In 2011, micro-workshops will<br />
focus on a revised block model comparison exercise, and a range of GPS-inferred slip rates will be delivered to WGCEP well<br />
in advance of the final due date for UCERF3. A detailed summary of the April 2010 GPS-UCERF3 workshop is here:<br />
(http://sceccore.usc.edu/proposalfiles/2010reports/Thatcher_10082_report.pdf). A shorter version of this appeared in Transactions of<br />
the AGU (Hearn et al., 2010).<br />
In July 2010, Terry Tullis lead a workshop for 25 attendees (by invitation). The principal purposes of the workshop were to<br />
allow the participants 1) to compare the results from the first simulations to use our common input and output formats and<br />
2011 <strong>SCEC</strong> <strong>Annual</strong> <strong>Meeting</strong> | 69
Report | <strong>SCEC</strong> Research Accomplishments<br />
output processing tools, and 2) to determine how well the tools are working with a view to improving and adding to them,<br />
and 3) to see what preliminary conclusions we could reach about the ways in which the simulator results are similar and in<br />
what ways they are different, and, if possible, why differences exist, and 4) to plan the next steps in comparing the simulators,<br />
Figure 39. Frequency-magnitude plots for five simulators for the norcal1 model. Workshop participants are still evaluating what factors<br />
make the simulators have the magnitude distributions shown. For example, in the case of VIRTCAL (Virtual California, Yikilmaz et al.,<br />
2010), the lack of small events is due to the intentional use of a dynamic stress concentration factor that makes it easier for adjacent<br />
elements to slip if an event is underway. From Terry Tullis.<br />
in particular what new problems we should consider and how<br />
earthquake simulators might help the ongoing UCERF3 process.<br />
The simulator comparison exercises demonstrated that the input<br />
and output formats that had been prepared by Michael Barall,<br />
after an iterative process via several conference calls and<br />
numerous emails, were very useful. They allowed analysis tools<br />
that were created by Keith Richards-Dinger to process the<br />
output of all the many-fault simulations done by the<br />
participants. For the first time they were able to make side-byside<br />
comparisons of the various results (Figure 39 and Figure<br />
40) show such a comparison for their northern California fault<br />
system test model “NorCal”). Details of all of the results can be<br />
found in the presentations made at the workshop at:<br />
(http://scec.usc.edu/research/eqsims/workshop_2010_07_20.html).<br />
Block and Boundary Element Modeling<br />
3D Fault Kinematics and Geologic Slip Rates<br />
Michelle Cooke and Scott Marshall continued their work on<br />
using elastic boundary-element models to assess whether the<br />
<strong>SCEC</strong> CFM geometry is kinematically consistent with geological<br />
slip rates on individual fault segments (which may vary along<br />
strike). Scott Marshall and collaborators focus on the Ventura<br />
Basin region, and combine this modeling with geodetic data<br />
analysis (InSAR and GPS). They have completed an analysis of<br />
GPS data from 53 sites in the region and have removed seasonal,<br />
anthropogenic, and earthquake-related perturbations to the position time seres. They are currently processing InSAR scenes to<br />
locate localized regions of deformation due, for example, to groundwater pumping, and to correct the GPS data in these areas<br />
or remove them from the velocity field. Their preliminary boundary element deformation models have addressed whether the<br />
CFM fault geometry and velocity boundary conditions are consistent with geological slip rates on individual faults, and they<br />
70 | Southern California Earthquake Center<br />
Figure 40. PDFs of recurrence intervals for four simulators for the<br />
norcal1 model, at two of the six locations having paleoseismic<br />
data. Such plots were generated for many magnitude ranges, but<br />
only this one for M > 7 is shown since smaller events may not<br />
show up in trenches. The red lines show the preferred inter-event<br />
time for these locations from Appendix C of the UCERF2 report<br />
(Field et al., 2008). From Terry Tullis.
<strong>SCEC</strong> Research Accomplishments | Report<br />
plan to continue this work with a revised version of their boundary element model which generates surface velocities that<br />
may be compared with GPS velocities.<br />
Inferring fault slip and stressing rates from<br />
the Southern California GPS Velocity Field<br />
Brendan Meade and Kaj Johnson continued<br />
their research using block models based on<br />
the <strong>SCEC</strong> CFM to infer fault slip and moment<br />
accumulation rates on active faults in<br />
southern California. Both of these PI’s have<br />
also begun to tackle the problem of how<br />
viscoelastic relaxation could affect their<br />
results. Direct, analytical calculation (Okada,<br />
1992) of stress rates along the SAF (in the<br />
context of a block model) inherently<br />
incorporates kinematically consistent fault slip<br />
rates and the influence of all fault segments<br />
considered in the analysis. Brendan Meade<br />
and his student John Loveless (Harvard) have<br />
applied this strategy to the SAF, determining<br />
the shear and Coulomb stressing rates both<br />
due to slip on SAF segments alone (“self<br />
stress”) and due to slip on all segments in the<br />
block model (“total stress”) (Figure 41).<br />
Comparing the self and total shear stress rates,<br />
τSAF and τTOT, respectively, provides<br />
indication of how structures nearby and<br />
intersecting the SAF influence patterns of<br />
stress accumulation (Figure 41). The shear<br />
stress rate difference, defined as Δτ = (τTOT<br />
−τSAF)/τTOT ×100, reaches values of up to<br />
+30% along the Mojave and San Bernardino<br />
segments of the SAF and is nearly zero to the<br />
north along the Carrizo segment and to the<br />
south along the Indio and Imperial segments,<br />
except near the isolated fault junctions. The<br />
enhanced stressing rate along Big Bend<br />
segments demonstrates that interseismic<br />
activity on structures that intersect the SAF,<br />
including the San Gabriel, Garlock, North<br />
Frontal, and Eureka Peak faults, act to<br />
increase the likelihood and/or frequency of<br />
seismic failure as compared to estimates based<br />
on τSAF alone. Interpretations of paleoseismic offset data suggest that Big Bend segments have ruptured in roughly twice the<br />
number of earthquakes as the more isolated Carrizo and Indio segments (Weldon et al., 2004), illustrating a correlation<br />
between long-term, macro-scale seismicity and interseismic stress enhancement due to off-SAF processes (Figure 41).<br />
Long-term deformation with large strains and plastic deformation<br />
Figure 41. Modeled shear stress accumulation rates along the SAF (left panel),<br />
with and without contributions from activity on other faults (left and right color<br />
traces, respectively). The difference reaches values of up to 30% along the Mojave<br />
and San Bernardino segments of the SAF and is nearly zero to the north along the<br />
Carrizo segment and to the south along the Indio and Imperial segments, except<br />
near the isolated fault junctions. The enhanced stressing rate along the Big Bend<br />
segments demonstrates that interseismic activity on structures that intersect the<br />
SAF, including the San Gabriel, Garlock, North Frontal, and Eureka Peak faults,<br />
may act to increase the likelihood and/or frequency of seismic failure as compared<br />
to estimates based on the SAF shear alone. Interpretations of paleoseismic offset<br />
data suggest that Big Bend segments have ruptured in roughly twice the number of<br />
earthquakes as the more isolated Carrizo and Indio segments (Weldon et al.,<br />
2004), illustrating a correlation between long-term, macro-scale seismicity and<br />
interseismic stress enhancement due to off-SAF processes (right panel). From<br />
Brendan Meade.<br />
Regional Scale Models<br />
Benjamin Hooks (UT Martin) and Bridget Smith-Konter (UT El Paso) are developing regional-scale numerical models of longterm<br />
deformation associated with the SAF system and its surroundings.They use FLAC, a 3-D dynamic numerical model (e.g.<br />
Cundall and Board, 1988) to reproduce the first-order vertical deformation associated with the Southern San Andreas Fault<br />
2011 <strong>SCEC</strong> <strong>Annual</strong> <strong>Meeting</strong> | 71
Report | <strong>SCEC</strong> Research Accomplishments<br />
System (from the <strong>SCEC</strong><br />
Geological Vertical Motion<br />
Map). Their models are<br />
driven by applied basal<br />
forces, and they incorporate<br />
layered viscoelasticity and<br />
realistic geometries to model<br />
the deformation of the SAFS<br />
over the past million years (a<br />
schematic is shown on<br />
Figure 42). The crust is either<br />
treated as fault-bounded<br />
elastic blocks, or as an<br />
elastic-plastic continuum, in<br />
which faults are allowed to<br />
develop in response to<br />
imposed velocities at the<br />
edges of the model (so far,<br />
the former approach works<br />
best). Comparisons show horizontal strain rates and long-term uplift rates that are broadly consistent with observations<br />
(Figure 43). The models developed to date are a preliminary step towards a more complete model of the long-term<br />
development of the western North American plate boundary over the last 10 Ma.<br />
Figure 43. Color contour plots of A) semi-analytical (Smith-Konter and Sandwell, 2009) and B) dynamically modeled<br />
strain rate (nanoStrain/yr) of the San Andreas Fault System. Color scale is saturated at 500 nanoStrain/yr. Black lines<br />
indicate the location of major faults for spatial reference. Coastlines are shown in white. From Benjamin Hooks.<br />
72 | Southern California Earthquake Center<br />
Figure 42. Schematic showing the geometry, applied basal kinematic driving force, rheological<br />
stratification, and boundary conditions for Benjamin Hooks' regional-scale, long-term deformation model.<br />
The model encompasses an area of 750 km by 750 km centered on southern California. A relative velocity<br />
of 45 mm/yr across the model is assumed. The model incorporates a pressure-dependent upper crust<br />
rheology (coefficient of friction angle of = 35° with strain-softening conditions), and a plastic-yield lower<br />
crust rheology (based upon published flow laws, e.g. Mackwell et al., 1998). From Benjamin Hooks.
Local-Scale Models<br />
CDM group researchers are also developing<br />
highly focused numerical models of long term<br />
deformation and fault system development,<br />
taking into account plastic deformation and<br />
damage generation. In his research project, which<br />
straddles the FARM and CDM research areas,<br />
Benchuan Duan (TAMU) models plasticity<br />
evolution due to earthquake shaking. He neatly<br />
illustrates how this results in a component of<br />
coseismic strain in nearby fault damage zones<br />
which is consistent with the background stress,<br />
rather than the coseismic stress change (Figure 44;<br />
Duan et al., 2011 ). Together with earlier <strong>SCEC</strong>funded<br />
work (Hearn and Fialko, 2009), this work<br />
highlights the possibility that absolute stress<br />
levels in the upper crust might be inferred from<br />
the coseismic deformation of fault damage zones.<br />
<strong>SCEC</strong> Research Accomplishments | Report<br />
Yuri Fialko and Yoshi Kaneko (Scripps) have also been looking into whether inelastic failure in the shallow crust due to<br />
dynamic earthquake rupture can explain the apparent deficit in shallow slip which is often noted in coseismic ruptures. They<br />
find that the amount of shallow slip deficit is indeed proportional to the amount of inelastic deformation near the Earth's<br />
surface. However, the largest magnitude of slip deficit in models accounting for off-fault yielding is 2-4 times smaller than that<br />
inferred from kinematic inversions of geodetic data (Kaneko and Fialko, 2011).<br />
In addition to the aforementioned numerical studies, Michele Cooke (U M Amherst) is continuing her work with wet kaolin<br />
(clay) analogue models of fault system development, with the goal of understanding the complex geometry of the SAF system<br />
in the Big Bend region. Her models show how faults form and are abandoned at restraining bends under progressive (oblique)<br />
shear strain, and she makes the argument that the chronology of fault formation and abandonment (i.e. development of<br />
secondary faults at progressively increasing distances from the original SAF bend) is consistent with the geologic record.<br />
Viscoelastic models of the earthquake cycle<br />
Two CDM research groups (Brendan Meade at Harvard and Elizabeth Hearn at UBC) tackled the question of how fault slip<br />
rates inferred from classical elastic half-space dislocation models might be affected by viscoelastic earthquake cycle effects,<br />
using earthquake-cycle models. To evaluate the magnitude of the viscoelastic deformation effects, both groups used forward<br />
models of two-dimensional faults with Maxwell and other rheologies to model velocity profiles at different times in the<br />
interseismic interval. These<br />
profiles were inverted for slip<br />
rates on a buried dislocation in an<br />
elastic halfspace, providing an<br />
effective means of assessing the<br />
predicted range of variability in<br />
fault slip rate estimates due to an<br />
idealized rheological<br />
parameterization. Both groups<br />
have found that if earthquake<br />
cycle variability is assumed to<br />
take place entirely within the<br />
upper mantle as a result of stress<br />
relaxation, then certain Burgers<br />
rheologies can simultaneously<br />
explain the general agreement<br />
between geologic and geodetic<br />
Figure 44. Fault-parallel component of the residual displacement field after<br />
an earthquake on the fault (solid black line) within a low-velocity fault zone<br />
FZ2. Motion across FZ1 is retrograde along AA', while it is sympathetic along<br />
BB'. They correspond to elastic and inelastic response of FZ1 to the rupture,<br />
respectively. From Duan et al., 2011.<br />
Figure 45. Predicted and observed variation in geologic/geodetic slip rate estimates as a<br />
function of upper mantle rheology. Left- and right-hand panels are Maxwell and Burgers<br />
rheologies, respectively. Hotter colors indicate larger postseismic deformation signals. Of the<br />
models considered here, only those to the far right hand side of the rightmost figure are<br />
consistent with both the general agreement of between geologic and geodetic slip rate<br />
estimates and the observed magnitude of postseismic deformation. From Brendan Meade.<br />
2011 <strong>SCEC</strong> <strong>Annual</strong> <strong>Meeting</strong> | 73
Report | <strong>SCEC</strong> Research Accomplishments<br />
slip rate estimates and large postseismic transients, while the widely used Maxwell models appear to be less applicable. Figure<br />
45 (from Brendan Meade) is a compact illustration of these results: it clearly shows that inferred slip rates late in the<br />
interseismic interval are too low for models with a large savage parameter (long recurrence interval relative to the Maxwell<br />
time). Hearn and Vaghri note this same effect: early in the cycle, most of their Maxwell viscoelastic models produce velocity<br />
profiles that cannot be fit to elastic dislocation solutions; later, inferred slip rates are too small and locking depths too large to<br />
be even broadly consistent with typical observations (Vaghri and Hearn, 2011, Tables 1-3). Burgers rheology models with a<br />
large evolution in effective viscosity following a stress step can explain both a large transient and stationary and localized<br />
interseismic deformation.<br />
The UBC group has also investigated the effect of a contrast in viscosity structure on earthquake-cycle deformation across a<br />
strike-slip fault (Vaghri and Hearn, 2011). This was motivated by the fact that though elasticity variations for different rock<br />
types under similar ambient conditions are generally modest,<br />
effective viscosity of the crust and mantle may vary over orders of<br />
magnitude. They found that asymmetric surface deformation is<br />
greatest for large contrasts in plate thickness (or in viscosity<br />
structure) across the fault, and for low viscosities. However, these<br />
models produce time-varying and broadly distributed interseismic<br />
deformation, inconsistent with observations from faults such as the<br />
SAF. Not only that, but the sense of asymmetry in the velocity<br />
profiles (relative to a point on the fault) reverses partway through<br />
the cycle (Figure 46). Models that could produce localized<br />
interseismic deformation around the fault (i.e., those with high<br />
substrate viscosities) produced only very modestly asymmetric<br />
interseismic surface deformation. Lateral contrasts in viscosity or<br />
effective plate thickness cannot produce observed, dramatic<br />
asymmetries in GPS surface velocity profiles across some major<br />
strike-slip faults. Large apparent contrasts are more likely due to<br />
small offsets between the mapped fault trace and the fault’s creeping<br />
extension at depth. Deviations from a vertical fault geometry need<br />
not be great to produce this effect, and could easily be missed by<br />
conventional geophysical studies (e.g. seismic profiles or hypocenter<br />
locations). This finding is of obvious importance to inferring slip<br />
rates from block models in areas with many closely-spaced faults.<br />
References<br />
Cundall, P. A., and J. Board (1988) A microcomputer program for modeling large-strain plasticity problems, in Swododa, C.,<br />
editor, Numerical Methods in Geomechanics, Proceedings 6th International Conference on Numerical Methods in<br />
Geomechanics, Innsbruck, Austria, April 11– 15: Rotterdam, Balkema, p. 2101–2108.<br />
Duan, B., J. Kang and Y. Li (2011) Inelastic response of compliant fault zones to nearby earthquakes, J. Geophys. Res., 116,<br />
B03307, 22 PP., 2011 doi:10.1029/2010JB007826.<br />
Field, E. H., et al. (2008), The Uniform California Earthquake Rupture Forecast, Version 2 (UCERF 2), , USGS Open File Report<br />
2007-1437.<br />
Hearn, E. H. and Y. Fialko (2009) Can compliant fault zones be used to measure absolute stresses in the upper crust?, J.<br />
Geophys. Res.,114, B04403, doi:10.1029/2008JB005901.<br />
Hearn, E., K. Johnson and W. Thatcher (2010) Space geodetic data improve seismic hazard assessment in California, EOS Trans.<br />
Am. Geophys. Union, 91, 336.<br />
Kaneko, Y. and Y. Fialko (2011) Shallow slip deficit due to large strike-slip earthquakes in dynamic rupture simulations with<br />
elasto-plastic response, Geophys. J. Int., submitted.<br />
Mackwell, S.J., M.E. Zimmerman, and D.E. Kohlstedt (1998) High temperature deformation of dry diabase with application to<br />
tectonics on Venus, J. Geophys. Res., v. 103, pp. 975– 984.<br />
Okada, Y. (1992) Internal deformation due to shear and tensile faults in a half-space, BSSA, 82, 1018-1040.<br />
74 | Southern California Earthquake Center<br />
Figure 46. Velocity profiles at different times in the<br />
interseismic interval, from an earthquake-cycle model with a<br />
plate-thickness contrast across a vertical strike-slip fault.<br />
Velocities are plotted relative to a point on the fault trace.<br />
Note the reversal in the sense of velocity profile asymmetry<br />
with time. The heavy line shows a velocity profile due to a<br />
dislocation creeping at the a rate of Vo ( 40 mm/yr) below a<br />
depth of 17.5 km (D for this suite of asymmetric models). t<br />
is time since the last major earthquake and Tc is the<br />
recurrence interval. From Vaghri and Hearn, 2011.
<strong>SCEC</strong> Research Accomplishments | Report<br />
Smith-Konter, B., and D. T. Sandwell (2009), Stress evolution of the San Andreas Fault System: recurrence interval versus<br />
locking depth, Geophys. Res. Lett., 36, doi:10.1029/2009GL037235.<br />
Vaghri, A. and E. Hearn (2011) Can lateral viscosity contrasts explain asymmetric interseismic deformation around strike-slip<br />
faults?, Bull. Seis. Soc. Am., MS D-10-00347, in press.<br />
Yikilmaz, B., D. L. Turcotte, G. Yakovlev, J. B. Rundle, and L. H. Kellogg<br />
(2010), Virtual California earthquake simulations: Simple models and<br />
their application to an observed sequence of earthquakes, Geophys. J. Int.,<br />
180(2), 734-742.<br />
Weldon, R., K. Scharer, T. Fumal and G. Biasi (2004), Wrightwood and the<br />
earthquake cycle: What a long recurrence record tells us about how faults<br />
work, GSA Today, 14(9), 10.1130/1052-5173.<br />
Lithospheric Architecture and Dynamics<br />
Section CLM Tomography<br />
3D P S Vp/Vs Tomography Using Body and Surface Waves<br />
Gene Humphreys' group have performed Body Surface wave inversions of<br />
the 3D P and S wave structure of the western US (Figure 47) and confirm the<br />
presence of the now-well known high-velocity deep anomalies: the Isabella<br />
anomaly, the Transverse Ranges, and the Escalante anomaly. Inversions using<br />
Rayleigh waves tend to place the anomaly depths shallower than those based<br />
on body waves. However the lateral positions are generally consistent.<br />
California Lithosphere Model<br />
The California Lithospheric Model CLM is a working ascii file model of<br />
crustal, mantle lithosphere and asthenospheric velocities including anisotropy<br />
(Figure 47). It can be downloaded from http://quake.ess.ucla.edu/CLM. For the<br />
crust it uses the Harvard <strong>SCEC</strong> Velocity model, whereas in deeper regions it<br />
uses the tomographic results from Schmandt and Humphreys (2010). The<br />
anisotropy model has been determined from the surface wave studies of Lin<br />
et al., (2011), Prindle and Tanimoto (2006), Alvizuri and Tanimoto (2011) and<br />
the SKS splitting results of Kosarian et al., (2011).<br />
Fault Related Lithospheric Offsets<br />
Search for Fault-Related Moho Offsets<br />
After the discovery of Moho offsets by Yan and Clayton (2007a,b) at<br />
TA2 (station Table Mountain) receiver functions have been analyzed<br />
as a function of azimuth for stations along the major California faults<br />
(Clayton 2011). This has included all available data from new stations<br />
installed along the southern San Andreas Fault (SAF). While<br />
azimuthal variation is seen in the data, whether is it is due to offset,<br />
dip or anisotropy is difficult to determine. If due to offset, the amount<br />
of offset is less than observed at TA2 and Moho depth appears to<br />
deepen to the East and to decrease southwards towards the Salton Sea<br />
(Figure 48 and Figure 49). The receiver function tau-X stacking method<br />
developed by Helffrich and Thompson, (2010) is used to determine<br />
Vp/Vs ratio and Moho depth, but owing to the azimuthal complexity<br />
of the multiples that go into the stack, the method appears to work on<br />
limited azimuthal ranges only. Using S-receiver functions Meghan<br />
Miller's group have identified a step in the lithosphere-asthenosphere<br />
boundary near the San Jacinto fault (Figure 50 and Figure 51) at a<br />
Figure 47. California Lithosphere Model (CLM)<br />
tomography.<br />
Figure 48. Map of cross-sections.<br />
Figure 49. Moho Offsets from Receiver Functions.<br />
2011 <strong>SCEC</strong> <strong>Annual</strong> <strong>Meeting</strong> | 75
Report | <strong>SCEC</strong> Research Accomplishments<br />
depth of about 70 km (Miller<br />
2011), adding evidence to the<br />
notion that the faulting is<br />
localized from the surface<br />
expression through the<br />
lithosphere.<br />
Lithospheric Scatttering<br />
Role of Seismic Scattering<br />
and the Development of<br />
Coda<br />
Seismic scattering has been<br />
analyzed at CI stations with a<br />
view to examining how<br />
lithospheric structure<br />
contributes to coda (Davis and<br />
Zeng 2011). A full-space<br />
scattering model developed by<br />
Hoshiba (1991) has been applied to coda from stations from the CI network and compared with results from the half-space<br />
layer model developed by Yoshimoto (2000). A comparison has been made between data from Peru, Mexico and California to<br />
assess the role of earthquake depth and lithospheric structure on inferred properties such as scattering, albedo, and mean free<br />
path. The methods seek to separate scattering from intrinsic attenuation (Figure 52 and Figure 53). Intrinsic attenuation<br />
(Figure 53) is significantly less-frequency dependent than scattering attenuation (Figure 52) and may even be frequencyindependent.<br />
Scattering parameters at each station can be used to predict the stochastic part of coda.<br />
Anisotropy<br />
Anisotropy from Mantle Flow Appears Decoupled from Lithospheric<br />
Deformation<br />
The CLM contains estimates of S wave anisotropy to a depth of 635 km<br />
derived from (1) radial anisotropy in the mantle and crust from surface wave<br />
studies (Moschetti et al., 2010) (2) azimuthal anisotropy in the crust and<br />
lithosphere from noise correlation and surface waves (Lin et al., 2011) and (3)<br />
Interpolated SKS estimates in the asthenosphere and lower (Kosarian et al.,<br />
2011). In general SKS directions are parallel to absolute plate motion directions.<br />
Lithospheric azimuthal anisotropy is shown in Figure 54 along withe SKS<br />
splitting. The two disagree in both direction and amplitude with SKS<br />
anisotropy several times larger suggesting splitting originates deeper. The<br />
surface wave anisotropy directions west of the SAF are parallel to the SAF.<br />
This suggests that transpression that has given rise to the San Gabriel Mts in<br />
the big bend region has generated anisotropy in the mantle lithosphere, but<br />
deeper down, absolute plate motion aligns olivines in the asthenosphere.<br />
Figure 55 shows CLM asthenospheric azimuthal anisotropy that has been<br />
extrapolated from the SKS data. Figure 56 (Zandt 2011) is a map of the<br />
southwestern US showing lower crust anisotropy orientations calculated using<br />
receiver functions. Black lines are anisotropy orientations, and red lines are<br />
quaternary fault locations. Blues lines are SKS measurements compiled in<br />
Zandt and Humphreys (2008). Rose diagram shows anisotropy azimuths for<br />
stations in southern California. The length of the lines are related to the plunge<br />
of the fast axis. These data are not yet in the CLM.<br />
76 | Southern California Earthquake Center<br />
Figure 50. Map of sections where<br />
receiver functions are calculated.<br />
Figure 51. Inferred offset of lithosphere beneath<br />
the San Jacinto fault from receiver functions.<br />
Figure 52. Scattering attenuation from coda<br />
Figure 53. Intrinsic attenuation from coda<br />
showing less dependence on frequency<br />
than scattering Q.
Figure 54. CLM splitting from mantle lithosphere compared<br />
with observations showing splitting signal arises from deeper<br />
than 100 km.<br />
Salton Seismic Imaging Project<br />
The LAD group participated in both the active and passive parts of the<br />
Salton Seismic Imaging Project (SSIP) (Figure 57). Fuis et al (2011 AGU<br />
abstract) describes the project: Seismic data were acquired from 2 to 18<br />
March 2011. One hundred and twenty-six borehole explosions (10-1400 kg<br />
yield) were detonated along seven profiles in the Salton Trough region,<br />
extending from area of Palm Springs, California, to the southwestern tip of<br />
Arizona. Airguns (1500 and 3500 cc) were fired along two profiles in the<br />
Salton Sea and at points in a 2-D array in the southern Salton Sea.<br />
Approximately 2800 seismometers were deployed at over 4200 locations<br />
throughout the Salton Trough region, and 48 ocean-bottom seismometers<br />
were deployed at 78 locations beneath the Salton Sea. Many of the onshore<br />
explosions were energetic enough to be recorded and located by the<br />
Southern California Seismograph Network. A line of passive broadband stations will run for a year.<br />
References<br />
Alvizuri, C., and T. Tanimoto, (2011), Azimuthal<br />
anisotropy from array analysis of Rayleigh<br />
waves in Southern California, Geophys. J. Int.<br />
(2011) 186, 1135–1151.<br />
Clayton, R., (2011), Adding the Moho and<br />
Anisotropy to the <strong>SCEC</strong> Community Velocity<br />
Model via the CLM, <strong>SCEC</strong> <strong>Annual</strong> Report 2010.<br />
Davis, P.M. and Y. Zeng, (2011), The dependence of<br />
coda on anisotropic scattering and intrinsic<br />
attenuation, <strong>SCEC</strong> 2010 <strong>Annual</strong> Report.<br />
Helffrich, G., Thompson (2010), D. A stacking<br />
approach to estimate Vp/Vs from receiver<br />
functions. Geophys. J. Int., v. 181, 899-902.<br />
<strong>SCEC</strong> Research Accomplishments | Report<br />
Figure 55. CLM splitting from mantle asthenosphere Z>100<br />
km compared with observations.<br />
Figure 56. Plunge of anisotroic slow axes in<br />
lower crust from receiver function anisotropy<br />
(Zandt 2011).<br />
Figure 57. Salton Seismic Imaging Project SSIP March 2011.<br />
2011 <strong>SCEC</strong> <strong>Annual</strong> <strong>Meeting</strong> | 77
Report | <strong>SCEC</strong> Research Accomplishments<br />
Kosarian, M., P. Davis, T. Tanimoto, and R. Clayton (2011), The relationship between upper mantle anisotropic structures<br />
beneath California, transpression and absolute plate motions, J. Geophys. Res., doi:10.1029/2010JB007742.<br />
Lin, F., Michael H. Ritzwoller, Yingjie Yang, M<strong>org</strong>an P. Moschetti & Matthew J. Fouch, (2011), Complex and variable crustal<br />
and uppermost mantle seismic anisotropy in the western United States, Nature Geoscience 4, 55–61 (2011)<br />
doi:10.1038/ngeo1036.<br />
Miller, M.,(2011) Systematic mapping of the Moho beneath southern California: Towards an understanding of crustal<br />
architecture and strain localization, <strong>SCEC</strong> <strong>Annual</strong> Report, 2010.<br />
Moschetti, M.P., M.H. Ritzwoller, F. Lin and Y. Yang, (2010) Seismic Evidence for widespread western-US deep-crustal<br />
deformation caused by extension, Nature, 464,8 April 2010, 885-889.<br />
Prindle, K., and T. Tanimoto (2006), Teleseismic surface wave study for S-wave velocity structure under an array: Southern<br />
California, Geophys. J. Int., 166(2), 601-621.<br />
Schmandt, B., and E. Humphreys (2010), Seismic heterogeneity and small-scale convection in the southern California upper<br />
mantle, Geochem. Geophys. Geosyst., 11, Q05004, doi:10.1029/2010GC003042.<br />
Yoshimoto K. (2000). Monte Carlo simulation of seismogram envelopes in scattering media. J. Geophys. Res 105, no. B3, 6153-<br />
6161.<br />
Zandt, G., (2011), Lithospheric Anisotropy in Southern California From Receiver Functions: Identification of the Decoupling<br />
Zone. <strong>SCEC</strong> <strong>Annual</strong> Report 2010.<br />
Zeng, Y., F. Su, and K. Aki, (1991),Scattering wave energy propagation in a medium with randomly distributed isotropic<br />
scatterers, I, Theory, J. Geophys. Res., 96, 607-619.<br />
Zeng,Y., and Y. Jing, (2009), A new interpretation on the scattering origin of seismic coda, <strong>SCEC</strong> 2009 <strong>Annual</strong> <strong>Meeting</strong>,<br />
Proceedings and Abstracts, XIX, 238.<br />
Earthquake Forecasting and Predictability<br />
The Earthquake Forecasting and Predictability (EFP) focus group<br />
coordinates four types of research projects: (1) the development of<br />
earthquake forecasting methods to the point that they can be moved to<br />
testing within the framework of the Collaboratory for the Study of<br />
Earthquake Predictability (CSEP), (2) the development of testing<br />
methodologies for evaluating the performance of earthquake forecasts,<br />
(3) studies that aim to obtain fundamental knowledge of earthquake<br />
behavior that may be relevant for forecasting earthquakes, and (4) the<br />
development and use of earthquake simulators to understand<br />
predictability in complex fault networks.<br />
Earthquake Forecasts<br />
The largest earthquakes on mid-ocean ridge transform faults occur<br />
very regularly, and published prospective forecasts of the time of the<br />
next event on transform fault segments have been quite successful so<br />
far (e.g. McGuire, 2008; Figure 58). These forecasts appear to be the<br />
most successful time-dependent earthquake forecasts currently being<br />
made, aside from aftershock rate models. Boettcher et al. (“CSEP<br />
Testing of Seismic Cycles and Earthquake Predictability on Three Mid-<br />
Ocean Ridge Transform Faults”) moved the testing of these forecasts<br />
from informal forecasts in published papers to the more formal testing<br />
framework of CSEP. They developed simple renewal models for five<br />
mid-ocean ridge transform fault segments for testing in CSEP. The<br />
targeted transform faults have short recurrence times, from 5 to 20<br />
years, and four of the segments are expected to produce an earthquake<br />
within the next 5 years. Very narrow recurrence distributions, with<br />
coefficients of variation from 0.05 to 0.2, are being used. The<br />
combination of the short recurrence times and the narrow forecasts<br />
78 | Southern California Earthquake Center<br />
Figure 58. Global CMT catalog events that<br />
occurred on Quebrada, Discovery, and Gofar<br />
transform faults for the time period from 1/1990 to<br />
4/2010. Earthquakes are plotted at their CMT<br />
estimated longitude in the upper panel and both<br />
latitude and longitude in
Figure 59. The short-term rates after 2011/03/09 MW7.5<br />
foreshock and before the MW9.1 Tohoku event – at the<br />
foreshock epicenter the short-term rates are about 100 times<br />
higher than the long-term rates. From annual report of Kagan.<br />
<strong>SCEC</strong> Research Accomplishments | Report<br />
windows mean that the CSEP tests should produce meaningful<br />
results in a reasonable time frame. Kagan (“Testing Global<br />
Long-Term Earthquake Forecasts”) produced an improved<br />
global earthquake forecast that is updated daily. This model is<br />
based on smoothed seismicity, and includes focal mechanism<br />
forecasts. Because of the daily update of the model, it<br />
successfully forecast a high earthquake probability at the<br />
location and time of the 2011 M9.0 Tohoku, Japan, earthquake,<br />
based on the occurrence of the M7.5 foreshock two days earlier<br />
(Figure 59). This model is less successful for great earthquakes<br />
that were not preceded by foreshocks, such as the 2004 M9.3<br />
Sumatra earthquake.<br />
Testing Methodology<br />
One of the concerns about CSEP, particularly for the regional<br />
testing areas such as California, is that the relatively low rate of<br />
earthquakes means that it could take a long time to accumulate<br />
enough events to meaningfully distinguish between models.<br />
Gerstenberger et al. (“How Long Will it Take to Obtain<br />
Meaningful Test Results (and Distinguish Models) in CSEP?”)<br />
quantified how long it would take to distinguish between the 5year<br />
RELM models for southern California, and find that it<br />
would take between 5 and 13 M≥4.95 earthquakes to distinguish<br />
between the spatial distributions of two models, depending on<br />
which two models are being compared, implying that a 5-year<br />
testing period is not enough. They also find that catalog<br />
variations between different 5-year (or longer) testing periods<br />
may lead to substantially different results. These are important considerations for interpreting the results of the RELM and<br />
CSEP tests.<br />
Schoenberg et al. (“Evaluating and improving models for seismicity forecasting using modern residual analysis techniques”)<br />
explored several residual analysis techniques, which are well-suited to exploring where and when an earthquake forecast<br />
model over- or under-predicts the observed earthquake rate. They found that some residual analysis techniques have more<br />
power than the existing CSEP tests. With the large number of earthquake forecasts that are being submitted to CSEP, it’s<br />
important to be able to evaluate the relative strengths and weaknesses of each model. The current tests implemented in CSEP<br />
provide an assessment of the overall performance of each model, while the residual analysis techniques could give the<br />
developers more detailed feedback on how the next generation of their models could be improved.<br />
Additionally, <strong>SCEC</strong> supported travel for international participants in CSEP to attend <strong>SCEC</strong> and CSEP activities, collaborate<br />
with <strong>SCEC</strong> scientists, and work on CSEP development in collaboration with the Southern California CSEP testing center.<br />
<strong>SCEC</strong> supported travel for Gerstenberger and Rhoades of the New Zealand CSEP testing center (“CSEP Forecast Test<br />
Methodology: Development and Participation”) and Werner et al. of the European CSEP testing center in Switzerland (“Travel<br />
Funds for CSEP Integration and Development”).<br />
Observational Constraints<br />
Earthquake forecasts, particularly frequently-updated time-dependent forecasts, could be improved through a better<br />
understanding of what triggers earthquakes. Bürgmann et al. (“Static vs. Dynamic Triggering of Earthquakes and Tremor at<br />
Parkfield”) found that repeating earthquakes at Parkfield tend to be preceded, at higher rates that expected, by up to several<br />
days by earthquake that transfer >1 kPa of static stress. Immediate triggering, within a few seconds to minutes, can happen<br />
when the separation distance is within a few km. Short-term triggering only occurs when the triggered repeating event is<br />
already late in its recurrence cycle, so the regularity of the repeating events is not substantially impacted. Dahmen and Ben-<br />
Zion (“Earthquake nucleation mechanisms and damage healing in heterogeneous fault zones”) studied earthquake triggering<br />
2011 <strong>SCEC</strong> <strong>Annual</strong> <strong>Meeting</strong> | 79
Report | <strong>SCEC</strong> Research Accomplishments<br />
by periodic loading, such as tidal stresses or seasonal stress loads. They find a theoretical frequency-dependent threshold<br />
amplitude for triggering, which agrees with lab experiments. While the over-all behavior of aftershocks sequences is generally<br />
predictable, the behavior of swarms is not. Shearer (“Analysis of Triggering Models and Earthquake Stress Drops in Southern<br />
California”) studied swarms in southern California, in particular identifying characteristic swarm migration rates that might<br />
be useful to distinguish between slow slip and fluid diffusion as triggering mechanisms. They also identify low stress drops in<br />
the Salton Sea area, where swarms are prevalent.<br />
Earthquake Simulators<br />
Earthquake simulators are numerical<br />
models aimed at generating catalogs of<br />
simulated earthquakes over a variety of<br />
spatial and temporal scales. The aim of<br />
these studies is to gain new insight into<br />
the behavior of real earthquakes by<br />
studying the behavior of simulated<br />
earthquakes. For example, one line of<br />
inquiry is to see if patterns of simulated<br />
seismicity in space and time occur that<br />
might also be discovered in real<br />
seismicity. If so, forecasting future<br />
earthquakes might be done by<br />
recognizing ongoing patterns in past<br />
and current seismicity.<br />
The Earthquake Simulator Comparison<br />
Project (Tullis and Ward, “A<br />
Collaborative Project: Comparison and<br />
Validation of Earthquake Simulators”)<br />
has recently focused on comparing the<br />
results of different simulators for two<br />
problems: (1) a single fault with<br />
different strength on its two halves,<br />
with different strength ratios producing<br />
different modes of behavior, and (2)<br />
two faults that are offset, with the goal<br />
of studying under what conditions a<br />
rupture can jump the gap, a problem<br />
that has previously been analyzed with dynamic rupture models, while none of the simulators include fully dynamic ruptures.<br />
The collaboration has also developed a fault model for all of California to be used in simulations, and standardized<br />
input/output formats, to ease comparison between different simulators.<br />
Additional progress has been made on individual simulators. Richards-Dinger (“Application of a Physics-Based Earthquake<br />
Simulator to Southern California”) added creeping faults to the rate-and-state friction-based simulator RSQSim, and modeled<br />
repeating earthquakes as stick-slip patches embedded in a creeping fault (Figure 60). Ward (“ALLCAL – An Earthquake<br />
Simulator for All of California”,“Geodetic Inputs to Seismic Hazard Estimation”) is working to incorporate geodetic data into<br />
the simulator ALLCAL.<br />
Workshops<br />
The “Workshop on Earthquake Simulators, Number 4” was held in July 2010 (Tullis “2010 Earthquake Simulators Workshop<br />
Report”). At this workshop, participants compared the results of their simulators for two benchmark problems outlined at the<br />
previous workshop (a single fault with different strength on its two halves, and a simplified version of the northern California<br />
fault network), and discussed future benchmark tests and standardized input/output formats.<br />
80 | Southern California Earthquake Center<br />
Figure 60. Simulation of earthquake repeaters. (A) Model of fault with repeating<br />
earthquakes on small patches (red) that are surrounded by fault sections that creep<br />
(blue). Fault creep drives recurring slip on the repeater patches a-e. Hence,<br />
accelerated afterslip, which decays with the logarithm of time following mainshocks<br />
on the large seismogenic patch in the right half of the model, result in accelerated<br />
rates of earthquakes on repeater patches. (B) Rates of occurrence of earthquakes<br />
on the repeater patches (as the reciprocal of recurrence time) on the patches<br />
following mainshocks on the large patch. (C) Rates of occurrence on repeaters<br />
following the 1989 Loma Prieta Earthquake from Schaff and others (1998). From<br />
annual report of Richards-Dinger.
<strong>SCEC</strong> Research Accomplishments | Report<br />
A “Workshop on Satellite Observations and Earthquake Predictability” was held in July 2011. This workshop brought together<br />
two separate communities that are active in attempting to understand how and whether it is possible to predict earthquakes.<br />
One is a group of space scientists involved in making satellite-based observations of anomalous electromagnetic and thermal<br />
signals that may be associated with earthquakes. The other consists of earthquake scientists involved in making seismological<br />
and geodetic observations, many of whom are involved with <strong>SCEC</strong>. These communities have had insufficient communication<br />
or collaboration, and bringing them together may<br />
help each understand better each other’s data and<br />
perspectives.<br />
References<br />
McGuire, J. J. (2008), Seismic Cycles and Earthquake<br />
Predictability on East Pacific Rise Transform<br />
Faults, Bull. Seis. Soc. Am., 98(3), 1067-1084, doi:<br />
10.1785/0120070154.<br />
Ground-Motion Prediction<br />
The primary goal of the Ground-Motion Prediction<br />
focus group is to develop and implement physicsbased<br />
simulation methodologies that can predict<br />
earthquake strong-motion waveforms over the<br />
frequency range 0-10 Hz. At frequencies less than 1<br />
Hz, the methodologies deterministically predict the<br />
amplitude, phase and waveform of earthquake<br />
ground motions using fully three-dimensional<br />
representations of Earth structure, as well as<br />
dynamic or dynamically compatible kinematic<br />
representations of fault rupture. At higher<br />
frequencies (1-10 Hz), the methodologies predict the<br />
main character of the amplitude, phase and<br />
waveform of the motions using a combination of<br />
deterministic and stochastic representations of fault<br />
rupture and wave propagation.<br />
Rupture characterization plays a vital role in<br />
ground-motion prediction and significant progress<br />
has been made in the development of more realistic<br />
implementations of dynamic and dynamically<br />
compatible kinematic representations of fault<br />
rupture within ground-motion simulations.<br />
Verification (comparison against theoretical<br />
predictions) and validation (comparison against<br />
observations) of the simulation methodologies<br />
continues to be an important component of this focus<br />
group with the goal being to develop robust and<br />
transparent simulation capabilities that incorporate<br />
consistent and accurate representations of the<br />
earthquake source and three-dimensional velocity<br />
structure. The products of the Ground-Motion<br />
Prediction group are designed to have direct<br />
application to seismic hazard analysis, both in terms<br />
of characterizing expected ground motions in future<br />
Figure 61. Examples of Green's functions derived from abient noise analysis<br />
(black) and synthetic ones from the <strong>SCEC</strong> CVM 4.0 (lower traces) and the<br />
model revised using full waveform tomography (CVM4SI2). The map shows<br />
the epicenter (start) and CMT solution (red beachball) of the Chino Hills<br />
earthquake and the inter-station paths (green lines) for the Green's functions.<br />
Figure 62. Three component (transverse: top, radial: middle, vertical:<br />
bottom) Green's functions for three paths within the waveguide (A-C) and<br />
one outside the waveguide (D). The Green's functions relatively impulsive<br />
for the path outside the waveguide, whereas the Green's functions contain<br />
long duration reverberations for paths within the waveguide, supporting its<br />
presence in the <strong>SCEC</strong> Community Velocity Model.<br />
2011 <strong>SCEC</strong> <strong>Annual</strong> <strong>Meeting</strong> | 81
Report | <strong>SCEC</strong> Research Accomplishments<br />
earthquakes, and in terms of directly interfacing with earthquake engineers in the analysis of built structures. Activities in<br />
these areas are highlighted by the projects described below.<br />
Model Validation<br />
Precariously Balanced Rocks<br />
Recent activity in studying precariously balanced rocks has shifted towards quantifying the dates of the rocks in order to<br />
facilitate comparison with fault behavior. Grant-Ludwig et al. are using Be-10 dating techniques to constrain the ages of<br />
precariously balanced rocks at several locations along the San Andreas and San Jacinto faults. Analysis of one of the Grass<br />
Valley rocks in the western San Bernardino mountains, which lies near the intersection of the San Andreas and San Jacinto<br />
faults, supports the assessment by Bryant (1987) that the Cleghorn fault has not ruptured in the Holocene. Furthermore,<br />
Grant-Ludwig et al. hypothesize that the Grass Valley and other precariously balanced rocks near Silverwood Lake may<br />
indicate that ground motions have been relatively lower near the stepover between the San Andreas and San Jacinto faults<br />
near Cajon Pass as a result of earthquake ruptures jumping between these two faults. If corroborated with additional<br />
observations, these results would directly impact the development of earthquake rupture scenarios and forecasts for these two<br />
major faults as well as the corresponding ground motions.<br />
Ambient Noise Analysis<br />
Several <strong>SCEC</strong> researchers continue to exploit ambient noise analysis in validating <strong>SCEC</strong> Community Velocity Models as a<br />
complement to ground-motion recordings from earthquakes. Chen and Olsen demonstrated improvements made to the <strong>SCEC</strong><br />
Community Velocity Model 4.0 via full waveform tomography analysis through comparison of synthetic Green's functions<br />
derived from the seismic velocity model and those from ambient noise observations (Figure 61). These results suggest that the<br />
revised seismic velocity model will yield more accurate travel times and shaking duration for sites throughout southern<br />
California. Hirakawa and Ma evaluated whether observations derived from ambient noise support the waveguide along a<br />
chain of sedimentary basins from San Bernardino to Los Angeles identified in the TeraShake simulations (Olsen et al., 2006).<br />
From four years of ambient seismic noise correlations for 50 station pairs, they generated 570 Green's functions separated into<br />
four frequency bands. Hirakawa and Ma found reverberations for Green's functions involving propagation paths across the<br />
basins, consistent with the waveguide (Figure 62). However, they caution that these Green's functions also contain noise,<br />
which must be reduced to reach a more definitive conclusion about the the presence or absence of the waveguide.<br />
Nonlinear Site Response<br />
Focus group activities have continued to include efforts to understand the physics involved in ground motion at high<br />
frequencies. Wu and Peng are applying a technique developed using Japanese KIK-Net data to determine the peak ground<br />
acceleration at which nonlinear site response becomes significant. In Japan they found that the threshold appears to be in the<br />
range of 60-100 gal with a logarithmic recovery in time. They hypothesize that smaller nonlinear responses below this<br />
threshold with near instantaneous recovery coincide with pre-existing levels of damage, where as the nonlinear responses<br />
above this threshold reflect development of further damage during strong shaking. Wu and Peng are currently applying this<br />
technique to the El Mayor-Cucapah earthquake sequence to determine if the threshold observed in the KIK-Net data applies to<br />
California as well. These results will have a direct impact on further development of the <strong>SCEC</strong> Broadband Platform, which<br />
relies on stochastic methods and nonlinear site corrections to produce broadband synthetic ground motions.<br />
Ground-Motion Simulations<br />
Broadband Simulations<br />
As described in Section SPECIAL PROJECTS, Community Modeling Environment, the recently released Broadband Platform<br />
provides scientists with a suite of tools to compute broadband synthetic ground motions, including the effects of<br />
heterogeneous rupture propagation and nonlinear site effects. These capabilities continue to be refined as additional studies<br />
provide improved methodologies. Research activities within the last year have focused on nonlinear site response (as<br />
described earlier and in the next paragraph) and rupture model characterization.<br />
Assimaki et al. developed Site 1D as a component of the Broadband Platform in order to provide a more realistic model of<br />
damping in the nonlinear response. Site 1D uses a viscoelastic formulation for frequency-independent Q with a hysteretic<br />
damping scheme. (Li and Assimaki, 2010). In addition to the implementation of the nonlinear site response, the code uses the<br />
peak ground acceleration on rock and a frequency index (FI, a dimensionless quantity that describes the alignment of the site<br />
82 | Southern California Earthquake Center
esponse peaks to the<br />
incident ground motion) to<br />
indicate the potential<br />
presence of nonlinear<br />
effects (Figure 63); this can<br />
be used to a priori<br />
determine whether<br />
nonlinear site response<br />
should be employed for a<br />
given synthetic groundmotion<br />
record. Archuleta<br />
et al. continue to refine<br />
their tools to construct<br />
earthquake rupture models<br />
for large scenario<br />
<strong>SCEC</strong> Research Accomplishments | Report<br />
earthquakes. Their most recent work has focused on quantifying the autocorrelation of parameters in spontaneous rupture<br />
models in order to construct kinematic rupture models with the same properties. Using the autocorrelation of slip as a<br />
reference, they found (Figure 64) initial stress is less correlated<br />
than final slip, rise time correlates with slip, and rupture speed<br />
and peak slip time only weakly depend on the final slip.<br />
Additional analysis also revealed that only the most highly<br />
correlated stress fields produced supershear rupture and these<br />
same ruptures also produced the largest slip amplitudes and slip<br />
rates.<br />
Large-Scale Simulations<br />
The Mw 7.2 El Mayor-Cucapah earthquake generated shaking<br />
that was recorded by over 200 strong motion instruments<br />
throughout northern Baja California and southern California. This<br />
earthquake provides an important opportunity to test our ability<br />
to use scenario rupture models and the <strong>SCEC</strong> Community<br />
Velocity Models to generate synthetic ground motions consistent<br />
with those observed. Graves and Aagaard generated synthetic<br />
long-period (T > 2 s) ground motions using the methodology<br />
proposed by Graves and Pitarka (2010) and two seismic velocity<br />
models (CVM-4m and CVM-H62), as would be done for a<br />
scenario event. For the non-basin regions, simulations with the<br />
CVM-H62 model perform significantly better than those<br />
of CVM-4m, which we attribute to the inclusion of the<br />
Tape et al. (2009) tomographic updates within the<br />
background crustal velocity structure of CVM-H62<br />
(Figure 65 and Figure 66). Within the greater Los<br />
Angeles basin, the CVM-4m model generally matches<br />
the level of observed motions whereas the CVM-H62<br />
model over-predicts the motions in the southernmost<br />
portion of the basin. This over-prediction is created by<br />
the sharp impedance contrast along the southern<br />
margin of the Los Angeles basin in the CVM-H62 model.<br />
Overall, these results are encouraging and provide<br />
confidence in the predictive capabilities of the<br />
simulation methodology, while also suggesting some<br />
regions where the seismic velocity models may need<br />
Figure 63. Deviation of linear elastic predictions from nonlinear site-specific response predictions at three<br />
sites (Class C: stiff soil, Class D: medium stiff soil, and Class E: soft soil) in the Los Angeles basin for a<br />
series of broadband ground-motion synthetics. Large values of the peak ground acceleration and values of<br />
the frequency index close to unity imply the empirical amplification factors do not adequately describe the<br />
site response, and siste-specific analyses should be used.<br />
Figure 64. 2D power spectral decay (slope of the power<br />
spectrum) for initial stress, rise time, rupture velocity, and peak<br />
slip time as a function of the spectral decay for final slip. The<br />
power spectral decay for initial stress and rise time exhibit strong<br />
correlations with power spectral decay for final slip, whereas the<br />
spectral decay for rupture speed and peak slip time show much<br />
weaker correlations.<br />
Figure 65. Residuals of simulated PGV for one rupture scenario using<br />
seismic velocity models CVM-4m (left column) and CVM-H62 (right column).<br />
Residuals are displayed as the base 2 logarithm of the ratio of the simulatedto-observed<br />
value computed for each recording site. The mean (µ) and<br />
standard deviation (σ) of the residuals are indicated above the histogram<br />
and are also shown by the solid and dashed lines, respectively.<br />
2011 <strong>SCEC</strong> <strong>Annual</strong> <strong>Meeting</strong> | 83
Report | <strong>SCEC</strong> Research Accomplishments<br />
Figure 66. Comparison of observed and simulated three-component<br />
ground velocity waveforms for selected sites in the Los Angeles basin<br />
region for one rupture model (same scenario as in FIGURE_GMP5). All<br />
waveforms have been low-pass filtered at f < 0.5 Hz. For each site<br />
waveforms are scaled to the absolute maximum amplitude observed at<br />
that site; the peak amplitude (in cm/s) for each component (simulated or<br />
observed) is indicated at the top right of the observed trace, and the<br />
waveform correlation coefficient computed for the simulated and<br />
observed motion is at left edge of the synthetic traces.<br />
Figure 67. Los Angeles basin excitation sensitivity for slip<br />
perturbations to the ShakeOut rupture scenario that are<br />
parameterized by location (distance along SAF from NW to SE<br />
along the SAF) and rupture velocity. Curves are solid for rupture<br />
from SE to NW, dashed for rupture from NW to SE.<br />
84 | Southern California Earthquake Center<br />
improvement. Simulations of earthquake rupture on the<br />
southern San Andreas fault (SAF) reveal large<br />
amplifications in the San Gabriel and Los Angeles basins<br />
(SGB and LAB) apparently associated with long-range<br />
path effects. Day et al. have developed a method for rapid<br />
calculation of the sensitivity of such predicted wave-field<br />
features to perturbations of the source kinematics, using a<br />
time-reversed (adjoint) wave-field simulation. The<br />
calculations are analogous to those done in adjoint<br />
tomography, and the same time-reversed calculation also<br />
yields path-sensitivity kernels that give further insight<br />
into the excitation mechanism. For rupture on the<br />
southernmost 300 km of SAF, LAB excitation is greatest<br />
for slip concentrated between the northern Coachella<br />
Valley and the Transverse Ranges, propagating to the NE,<br />
and with rupture velocities between 3250 and 3500 m/s<br />
along that fault segment (Figure 67 and Figure 68). That is<br />
within or slightly above the velocity range (between<br />
Rayleigh and S velocities) that is energetically precluded<br />
in the limit of a sharp rupture front, highlighting the<br />
potential value of imposing physical constraints (such as<br />
from spontaneous rupture models) on source<br />
parameterizations. LAB excitation is weak for rupture to<br />
the SW and for ruptures in either direction located north<br />
of the Transverse Ranges, while the Ventura Basin is<br />
preferentially excited by NE ruptures situated north of<br />
the Transverse Ranges. Olsen et al. have continued to<br />
analyze the results from the 0-2 Hz simulation of a Mw 8<br />
San Andreas rupture (see also SPECIAL PROJECTS,<br />
Community Modeling Environment). The 3-D<br />
simulations include strong directivity, rupture<br />
complexity, and basin effects resulting in a much more<br />
complex spatial variation in shaking compared with<br />
empirical ground-motion prediction equations that<br />
estimate median levels of shaking across an ensemble of<br />
events (Figure 69). At rock sites (Vs30 > 1.0 km/s) the<br />
synthetic ground motions exhibit a similar decay in peak<br />
ground velocity with distance from the rupture as the<br />
Boore and Atkinson (2008) and Campbell and Boz<strong>org</strong>nia<br />
(2008) ground-motion prediction equations (Vs30 = 760<br />
m/s). In another study Olsen et al. have started<br />
examining the effects of including small-scale stochastic<br />
variations in elastic properties in seismic velocity models.<br />
Preliminary results indicate that weak fractal spatial variations can generate spatial variations in peak velocity (both<br />
amplification and de-amplification) by up to a factor of six. Figure 70 shows snapshots for a purely elastic (infinite Q), 0-2 Hz<br />
simulation of a horizontally incident SH plane wave propagating through a velocity structure containing fractal<br />
inhomogeneities having a Hurst exponent of 0 and a standard deviation of 10%. This structure is imposed on a background 1D<br />
velocity profile taken from the <strong>SCEC</strong> CVM-S4 for a typical Los Angeles basin site. Ongoing work will examine the tradeoff<br />
between scattering associated with this stochastic variation and intrinsic attenuation associated with anelastic attenuation.
<strong>SCEC</strong> Research Accomplishments | Report<br />
Figure 68. One-km horizontal depth slices (left) and cross-sections (right) of the path sensitivity kernel for S-wave speed in the Los Angeles<br />
basin region. Red lines in the left panel show the cross section locations for the corresponding fence diagrams in the right panel. Since these<br />
kernels are indices of the sensitivity of the LAB excitation to wave-speed perturbations, they illuminate the predominant pathways of seismic<br />
energy entering the basin in the reference scenario.<br />
Figure 69. Peak ground velocity for the Mw 8 San Andreas simulation (right) and Campbell and Boz<strong>org</strong>nia (2008) empirical ground-motion<br />
prediction equation (left). The simulation produces complex spatial variations in amplitude associated with heterogeneous slip and rupture<br />
propagation, rupture directivity, and basin effects, whereas the empirical relation provides the median value (including site effects) across an<br />
ensemble of earthquakes.<br />
2011 <strong>SCEC</strong> <strong>Annual</strong> <strong>Meeting</strong> | 85
Report | <strong>SCEC</strong> Research Accomplishments<br />
Figure 70. Snapshots of cumulative velocity vector magnitude for a simulation with fractal inhomogeneities having a Hurst value of 0 and<br />
standard deviation of 10%. Bands of amplified/deamplified motions develop as the SH/Love waves sweep through the inhomogeneities and<br />
the wave field is locally focused/defocused.<br />
References<br />
Boore, D. M., and G. M. Aktinson (2008). Ground-motion prediction equations for the average horizontal component of PGA,<br />
PGV, and 5%-damped PSA at spectral periods between 0.01 s and 10.0 s, Earthq. Spectra 24, no. 1, 99–138, doi<br />
10.1193/1.2830434.<br />
Bryant, W.A., 1987, Cleghorn and related faults, San Bernardino County: California Division of Mines and Geology Fault<br />
Evaluation Report FER-187, microfiche copy in California Division of Mines and Geology Open-File Report 90-14, 9 p.,<br />
scale 1:24,000.<br />
Campbell, K. W., and Y. Boz<strong>org</strong>nia (2008). NGA ground motion model for the geometric mean horizontal component of PGA,<br />
PGV, PGD and 5% damped linear elastic response spectra for periods ranging from 0.01 to 10 s, Earthq. Spectra 24, no. 1,<br />
139–171, doi 10.1193/1.2857546.<br />
Graves, R. W., and A. Pitarka (2010) Broadband ground-motion simulation using a hybrid approach, Bull. Seismol. Soc. Am.<br />
100, 2095–2123, doi: 10.1785/0120100057.<br />
Li, W. & Assimaki, D. (2010) Site- and Motion-Dependent Parametric Uncertainty of Site-Response Analyses in Earthquake<br />
Simulations, Bull. Seismol. Soc. Am. 100, 995-1009, doi: 10.1785/0120090030.<br />
Olsen, K. B., S. M. Day, J. B. Minster, Y. Cui, A. Chourasia, M. Faerman, R. Moore, P. Maechling, and T. Jordan (2006), Strong<br />
shaking in Los Angeles expected from southern San Andreas earthquake, Geophys. Res. Lett., 33, L07305,<br />
doi:10.1029/2005GL025472.<br />
Tape, C., Q. Liu, A. Maggi, and J. Tromp (2009). Adjoint tomography of the southern California crust, Science 325, 988–992.<br />
Seismic Hazard and Risk Analysis<br />
This report highlights the results of five projects that made significant contributions to seismic hazard and seismic risk<br />
analysis.<br />
86 | Southern California Earthquake Center
Non-Linear Structural Simulations using <strong>SCEC</strong> Simulated Ground Motions<br />
Although substantial progress has been made in physicsbased<br />
ground motion simulations in the recent years, the<br />
engineering community is still reluctant to use simulated<br />
time series for design. One of the reasons for this is a lack<br />
of understanding of how simulated ground motions<br />
compare to recorded ground motions, especially when it<br />
comes to their impact on structural response. There are ongoing<br />
efforts at validation and verification of simulated<br />
ground motions, but these tend to be focused on record<br />
properties or on the response of single-degree-of-freedom<br />
systems. Goulet, Haselton and Bayless (2011) used a<br />
different approach by comparing the nonlinear structural<br />
response of buildings subjected to recorded and simulated<br />
ground motions, given that both sets had similar response<br />
spectral shapes.<br />
<strong>SCEC</strong> Research Accomplishments | Report<br />
The responses of buildings to recorded motions were<br />
already been processed in a project recently completed by the PIs. The recorded set is representative of a magnitude 7<br />
earthquake, rupturing within 20 km from a site in a shallow crustal tectonic environment such as California. The <strong>SCEC</strong><br />
simulated records were selected for the same type of event and distance with spectral shapes that were consistent with the<br />
recorded set. Structural simulations were then performed for three computer-modeled concrete structures, and the response<br />
results from both sets of time series were compared. Figure 71 shows a summary of the maximum inter-story drift ratio<br />
(MIDR) results obtained from the structural simulations. The vertical data stripes correspond to the MIDR results for all three<br />
buildings, for both the recorded and simulated time series. For each stripe, the maximum and minimum values were removed.<br />
For all three buildings, the ranges of MIDR values are similar, but the overall distribution of values for the recorded and<br />
simulated sets tend to differ for a given building. This leads to a large difference in the median MIDR estimate for building B,<br />
but to no statistical difference for building C. The preliminary conclusion based on the two datasets used is that the simulated<br />
ground motions led to structural response that<br />
were consistent with those derived from<br />
recorded motions.<br />
Validation of End-to-End Simulation of<br />
Building Response using Ground<br />
Motion Simulations<br />
This study had the objective of validating the<br />
use of simulated ground motions by<br />
integrating physics-based ground motion<br />
simulation and performance-based damage<br />
estimates and examining, probabilistically,<br />
building response due to both simulated and<br />
recorded ground motions. The research<br />
involved the comparison of building response<br />
to two earthquake scenarios: the 7.8Mw Los<br />
Angeles region ShakeOut scenario developed<br />
by Graves et al. (2008), a repeat of the 1906 San<br />
Francisco earthquake generated by Aagaard et<br />
al. (2009), and the Puente Hills scenario<br />
developed by Graves et al. (2006).<br />
Figure 71. Summary of structural simulation results for buildings B (12<br />
stories), C (20 stories) and E (4 stories) and for both the recorded (Rec)<br />
and simulated (Sim) acceleration time series.<br />
Figure 72. Collapse results of older (top) and modern (bottom) 8-story RC frame for<br />
(left) Northridge earthquake recorded ground motions and (right) ShakeOut scenario<br />
simulated ground motions. Source: Liel and Rowe (2010).<br />
This analysis considered 735 evenly spaced sites for the hypothetical ShakeOut scenario earthquake and 157 sites where the<br />
Northridge earthquake was recorded. As a preliminary check on the simulation results, geographic trends of areas high<br />
2011 <strong>SCEC</strong> <strong>Annual</strong> <strong>Meeting</strong> | 87
Report | <strong>SCEC</strong> Research Accomplishments<br />
collapse risk for both the Northridge and ShakeOut earthquakes were identified as those sites where building simulation<br />
models collapsed, as shown in Figure 72. These figures reveal that, for both the Northridge earthquake and the simulated LA<br />
ShakeOut scenario, the older RC frame building is more likely to collapse than the modern building. This study predicts 12<br />
collapses for the older RC frames during the Northridge earthquake (concentrated in the region shown on the map) and no<br />
collapses for the modern building subjected to the same ground motions. For the ShakeOut scenario, the study predicts 231<br />
failures for the older RC frame and only 51 for the modern building. This difference between older and modern buildings is<br />
expected, due to the stricter building codes governing the seismic detailing of RC structures after 1970, and is consistent with<br />
observed results during the Northridge earthquake, during which very few modern RC buildings collapsed.<br />
Loss Estimates for Kinematic and Dynamic ShakeOut Earthquake Scenarios<br />
The goal of this project was to compare<br />
HAZUS®‐estimated economic loss and<br />
population impacts for six San Andreas Fault<br />
(SAF) scenarios. Long period ground motions<br />
for the SAF ruptures were simulated using<br />
dynamic rupture propagation. Five realizations<br />
of the “ShakeOut” scenario with dynamic<br />
rupture propagation were analyzed. The<br />
synthetic ground motions provided for the loss<br />
estimation within HAZUS® were 0‐10Hz<br />
broadband synthetics generated by combining<br />
long‐period (0‐1Hz) finite‐difference<br />
synthetics with high‐frequency scattering<br />
operators.<br />
Each M7.8 scenario variant was a 300‐km S‐N<br />
rupture on the southernmost San Andreas Fault,<br />
with dynamic source descriptions; the variants<br />
are designated as 2_3, 2_4, G6D3, G7D1 and<br />
V1D3. HAZUS® analyses were conducted for<br />
each of these five scenario variants, for<br />
comparison with the kinematic results. All<br />
“ShakeOut” HAZUS® analyses were conducted with enhanced inventory data. Database enhancements included<br />
improvements to the underlying building inventory data as well as to information utilized by HAZUS® on construction<br />
patterns throughout the eight county study area. As shown in Figure 73, the kinematic simulations produce larger loss<br />
estimates than do the dynamic simulations.<br />
A Nonlinear Site Response Computer Application for the <strong>SCEC</strong> Broadband Ground Motion Simulation<br />
Platform<br />
This project involved the implementation of a nonlinear site response computer application in the <strong>SCEC</strong> Braodband Ground<br />
Motion Simulation Platform. The site response model was developed for nonlinear site response analyses based on a<br />
viscoelastic formulation for frequency-independent Q and a hysteretic model. The model can simulate close to frequencyindependent<br />
viscous damping in the strain range below the linear threshold, and match the nonlinear dynamic soil properties<br />
of soils (G/Gmax and damping) in the intermediate to high strain range (>10-3). The model was implemented into the 1D site<br />
response computational tool “Site1D” of the <strong>SCEC</strong> Broadband Ground Motion Simulation Platform.<br />
Figure 74 shows the deviation of linear elastic prediction from site-specific nonlinear predictions as a function of (PGAROCK,<br />
FI) for three sites in the LA Basin: a stiff (Class C), a medium stiff (Class D) and a soft (Class E) site. As can be seen, the trend is<br />
the same for all three sites. Large PGAROCK and FI close to unity imply that empirical amplification factors do not adequately<br />
describe the site response, and that site-specific analyses should be employed.<br />
88 | Southern California Earthquake Center<br />
Figure 73. HAZUS® Estimates of Building Damage for the ShakeOut Ground Motion<br />
Scenarios. Source: Seligson and Olsen (2010).
<strong>SCEC</strong> Research Accomplishments | Report<br />
Implementation of a generalized conditional intensity measure (GCIM) approach in OpenSHA<br />
The fundamental basis of the GCIM approach is that for a given earthquake scenario (Rup) the joint distribution of a vector of<br />
intensity measures (i.e. IM|Rup) has a multivariate lognormal distribution [1]. Characterisation of IM|Rup, therefore requires<br />
the marginal distributions, IMi|Rup and correlations between IMi and IMj for which several prediction equations already<br />
exist. The total probability theorem<br />
can then be used to construct the<br />
conditional distribution of any<br />
intensity measure given the<br />
occurrence of a specific value of<br />
another intensity measure. Figure 75<br />
illustrates the conditional spectral<br />
acceleration and Arias Intensity<br />
distributions given Sa(1.0) with an<br />
annual exceedance probability of<br />
1/475. This project involved the<br />
implementation of this generalized<br />
conditional intensity measure<br />
(GCIM) approach in OpenSHA.<br />
References<br />
Assimaki, D. (2010). A Nonlinear Site Response Computer Application for the <strong>SCEC</strong> Broadband Ground Motion Simulation<br />
Platform. Report to <strong>SCEC</strong>.<br />
Bradley, B. (2010). Implementation of a generalized conditional intensity measure (GCIM) approach in OpenSHA. Report to<br />
<strong>SCEC</strong>.<br />
Goulet,C., K. Haselton and J.Bayless (2011). Non-linear structural simulations using <strong>SCEC</strong> simulated ground motions – one-toone<br />
comparisons. Report to <strong>SCEC</strong>.<br />
Liel, A.B. and K.L. Rowe (2010). Integration of Physics-Based Ground Motion Simulation and Performance-Based Building<br />
Damage Estimates for Improved Assessment of Seismic Risk. Report to <strong>SCEC</strong>.<br />
Seligson, H. and K.B. Olsen (2010). HAZUS® Loss Estimates for Six Large San Andreas Fault Earthquake Scenarios, including<br />
the Mw8.0 “Wall to Wall.” Report to <strong>SCEC</strong>.<br />
Special Projects<br />
In addition to the disciplinary groups, and cross-cutting focus groups, <strong>SCEC</strong> has undertaken a number of special projects,<br />
which are focused on problems with well-defined short-term research objectives, but are nevertheless consistent with <strong>SCEC</strong><br />
goals. These include the Southern San Andreas Fault Evaluation (SoSAFE), Collaboratory for the study of Earthquake Predictability<br />
(CSEP), Working Group on California Earthquake Probabilities (WGCEP), and Community Modeling Environment (CME).<br />
Southern San Andreas Fault Evaluation<br />
Figure 74. (PGA, FI) criteria<br />
implementation at three sites (Class C,<br />
D and E) in the Los Angeles basin for a<br />
series of broadband ground motion<br />
synthetics. The contour plots indicate<br />
the deviation of linear elastic<br />
predictions from nonlinear site-specific<br />
response predictions. Source:<br />
Assimaki (2010).<br />
Figure 75. Example conditional distributions for a site in Christchurch, New Zealand. Source:<br />
Bradley (2010).<br />
The primary goal of the SoSAFE project is to document the timing of large paleoearthquakes and amount of slip released by<br />
the southern San Andreas and San Jacinto faults over the past 2000 years. Additional goals include examination of longer-term<br />
2011 <strong>SCEC</strong> <strong>Annual</strong> <strong>Meeting</strong> | 89
Report | <strong>SCEC</strong> Research Accomplishments<br />
slip rates and modeling studies that directly impact seismic hazard assessments. Research includes earthquake trenching<br />
studies, radiocarbon dating supported through the geochronology infrastructure funding, geomorphic studies using lidar and<br />
other aerial imagery data in tandem with field measurements, and examination of new methods for analyzing and<br />
incorporating neotectonic data. The annual SoSAFE workshop, highlighting the 2010-2011 accomplishments was held during<br />
the <strong>SCEC</strong> <strong>Annual</strong> <strong>Meeting</strong> in September, and attracted over 120 attendees. This workshop helps to maintain the focused<br />
objectives of the SoSAFE special project, and we anticipate that these activities will continue as SoSAFE is incorporated as a<br />
focus group under <strong>SCEC</strong>4.<br />
San Jacinto - San Andreas Interaction<br />
<strong>SCEC</strong> researchers continue to make significant progress at several sites along the southern San Jacinto fault. Slip rate studies<br />
by Blisniuk et al. (2010), Janecke et al. (2010) and in progress efforts by several researchers indicate that the San Jacinto fault<br />
slips at a rate approaching that of the San Andreas fault in the Salton Trough. The surprising rapidity of slip on this system<br />
(10-14 mm/yr) has several implications. For one, because the San Jacinto fault is more complex and segmented than the San<br />
Andreas fault, it may produce more earthquakes in the mid to low magnitude 7 range, thus increasing its contribution to<br />
hazard regionally. Whether some of these earthquakes propagate onto the San Andreas fault at Cajon Pass is one of the<br />
outstanding questions facing SoSAFE, motivating efforts to uncover the timing of earthquakes at the Mystic Lake paleoseismic<br />
site on the Claremont fault. On-going work by Onderdonk, Rockwell and McGill at Mystic Lake shows that ground-rupturing<br />
earthquakes repeat at an average interval of ~180 years since ca. 500 A.D., and preliminary dating suggests a few events with<br />
strong temporal correlation to published San Andreas fault records from the Mojave section. These few events do not have<br />
strong temporal correlation with the Hog Lake record, (Rockwell and others) indicating that the northern San Jacinto<br />
periodically interacts with the San Andreas fault.<br />
Substantial effort by three groups is underway to study the region around the intersection of the San Andreas and San Jacinto<br />
faults, where these faults become multi-stranded and poorly expressed, respectively. Along the North Branch of the San<br />
Andreas fault (Weldon) and the Claremont fault (McGill, Onderdonk and Rockwell), fieldwork and sampling for cosmogenic<br />
dates of geomorphic surfaces has been completed and should yield new insight into the distribution of slip rates; current slip<br />
rate studies have been inconclusive in these areas. In San G<strong>org</strong>onio Pass, trenching investigations by Heermance and Yule at<br />
key points along this complex fault network indicate that fault slip<br />
rates are low, but preliminary dating and vertical separation on the<br />
thrust faults of 2 m per event, or approximately 5 m of slip, suggest that<br />
infrequent large slip events can rupture through the pass.<br />
Slip-per-event and Slip Rate Implications<br />
New data on the frequency of earthquakes on the San Andreas fault in<br />
the Carrizo Plain (Akciz et al., 2010) have motivated additional<br />
reexamination of the slip rate and slip per earthquake record there. The<br />
paradigm of infrequent, 10 m slip events (Sieh, 1978; Liu et al., 2003)<br />
was overturned with new geomorphic offsets of 5 m found by Zielke et<br />
al. (2010). Even this lower slip-per-event value has been subject to<br />
reexamination because it would imply slips of 5 m approximately every<br />
100 years (Akciz et al., 2010), yielding a slip rate of 50 mm/yr for this<br />
stretch of fault. It is likely that even these smaller offsets are sometimes<br />
a composite of more than one earthquake, too closely spaced in time to<br />
be differentiated in the geomorphic record (Grant-Ludwig et al., 2010).<br />
It is also possible that the long-term slip rate on the San Andreas fault<br />
in the Carrizo plain is higher than the 34 mm/yr found by Sieh and<br />
Jahns (1984) at Wallace Creek. The spectacular 127 m offset of this creek<br />
is not in question, but the timing obtained from conventional<br />
radiocarbon could be affected by inherited (older) charcoal. New efforts<br />
by Grant-Ludwig and Arrowsmith are underway to re-date this site,<br />
and to date other, nearby stream offsets, using modern single-sample<br />
AMS techniques.<br />
90 | Southern California Earthquake Center<br />
Figure 76. Slip distribution graph for the most recent<br />
events on the Clark strand of the central San Jacinto<br />
fault. Data points represent the most reliable and bestpreserved<br />
features (good and excellent) to estimate<br />
displacement. We attribute the 3-4 m offsets through<br />
the Anza region to the most recent, large- scale rupture<br />
event on the Clark fault (black line). We also recognize<br />
the likely rupture from the 21 April 1918 earthquake,<br />
which broke a short ~15-20 km section of the fault (with<br />
an average of 1.25 m of right-lateral displacement - red<br />
line) in Blackburn Canyon, apparently due to lower<br />
displacement in that area in the ca. 1800 event.
<strong>SCEC</strong> Research Accomplishments | Report<br />
Two new regions with geomorphic offsets were studied in 2011. Salisbury et al. (in review) compared field and lidar-based<br />
measurements of hundreds of offsets along the Clark fault, and found that the geomorphic record of slip events favors fairly<br />
regular offsets with maximum displacement near Anza of 3-4 m, and possible evidence for surface rupture associated with the<br />
historical (1918) earthquake, which they relocate to the Clark strand of the San Jacinto fault (Figure 76). New trenching to the<br />
northwest of Hog Lake may support this interpretation. On the San Andreas fault, Williams completed terrestrial lidar scans<br />
of a dozen offset gullies along the Mission Creek section. These offsets are also fairly regularly spaced, lending additional<br />
support for repetition of similar-sized earthquakes along the southernmost San Andreas fault and preference for rupture on<br />
the Mission Creek fault over the San G<strong>org</strong>onio section in most events based on the recurrence data from nearby Thousand<br />
Palms (Fumal et al., 2002).<br />
Synthesis and Proposal Activities<br />
This year the SoSAFE community developed and submitted an NSF Tectonics proposal geared to exploring the spatiotemporal<br />
behavior of the San Andreas and San Jacinto fault systems. A team of PIs from nine institutions worked<br />
collaboratively to identify key gaps in existing coverage of the SAF/SJF system, such as spatial gaps where lower (M7) events<br />
could be overlooked and temporal gaps produced by insufficient dating or stratigraphic context in past projects, with the goal<br />
of developing a full rupture history for the system. Modeling efforts were also included to explore the stress changes over<br />
several earthquake cycles as constrained by paleoseismic data. This proposal received high marks from the external reviews.<br />
Although declined for funding, the actualization of this proposal served to invigorate the SoSAFE community, aided in<br />
identification of new ways to integrate paleoseismic data with other geophysical approaches, and fostered new collaborations<br />
between researchers.<br />
References<br />
Blisniuk, K., Rockwell, T., Owen, L., Oskin, M., Lippincott, C., Caffee, M., and Dorch, J., (2010): Late Quaternary slip-rate<br />
gradient defined using high-resolution topography and 10Be dating of offset landforms on the southern San Jacinto fault,<br />
California, Journal of Geophysical Research – Solid Earth, Vol. 115, B08401, doi:10.1029/2009JB006346<br />
Janecke, S., Dorsey, R., Forand, D., Steely, A., Kirby, S., Lutz, A., Housen, B., Belgarde, B., Langenheim, V., Rittenour, T. (2010)<br />
High Geologic Slip Rates since Early Pleistocene Initiation of the San Jacinto and San Felipe Fault ZOnes in the San<br />
Andreas Fault System: Southern California, USA, Geological Society of America Special Paper 475.<br />
Zielke, O., Arrowsmith, J., Grant-Ludwig, L., and Akciz, S. (2010) Slip in the 1857 and earlier large earthquakes along the<br />
Carrizo Plain, San Andreas fault, Science, v. 327, p. 1119-1121.<br />
Grant-Ludwig, L., Akciz, S., Noriega, G., Zielke, O., and Arrowsmith, J. (2010) Climate-modulated channel incision and<br />
rupture history of the San Andreas fault in the Carrizo Plain, Science, v. 327, p. 1117-1119.<br />
Akciz, S., Grant-Ludwig, L., Arrowsmith, J., and Zielke, O. (2010) Century-long average time intervals between earthquake<br />
ruptures of the San Andreas fault in the Carrizo Plain, California, Geology, v. 38, p. 787-790.<br />
Working Group on California Earthquake Probabilities<br />
The Working Group on California Earthquake Probabilities (http://www.WGCEP.<strong>org</strong>) is actively building the 3rd Uniform<br />
California Earthquake Rupture Forecast (UCERF3). The main innovations for this model will be: 1) the relaxation of fault<br />
segmentation assumptions and the inclusion of multi-fault ruptures; and 2) the addition of spatiotemporal clustering<br />
(earthquake triggering and aftershocks), which will form the basis of an operational earthquake forecast. Our plan for both<br />
these enhancements was bolstered tragically by the 2011 Tōhoku, Japan and Christchurch, New Zealand earthquakes.<br />
The main accomplishment over the last year was the development of our Proposed UCERF3 Plan, which also includes<br />
prototype model components (http://www.wgcep.<strong>org</strong>/sites/wgcep.<strong>org</strong>/files/UCERF3_Project_Plan_v52.pdf).<br />
This was reviewed by the general scientific community at a marathon series of workshops in June, 2011, and a formal review<br />
was conducted by our Scientific Review Panel [1] on June 13th and 14th, 2011. The Final UCERF3 Plan is due at the end of<br />
September, 2011, and the final model is due June 30, 2012. The many details of this project can be found in the preliminary<br />
plan referenced above.<br />
2011 <strong>SCEC</strong> <strong>Annual</strong> <strong>Meeting</strong> | 91
Report | <strong>SCEC</strong> Research Accomplishments<br />
Collaboratory for the Study of Earthquake Predictability<br />
Controversies have clouded research on earthquake prediction and forecasting for at least a century (Hough, 2009). Many<br />
have stemmed from the lack of community standards and an inadequate infrastructure for conducting scientific prediction<br />
experiments (Wyss and Booth, 1997; Jordan, 2006). To improve earthquake forecasting in California, the USGS and <strong>SCEC</strong> set<br />
up a Working Group on Regional Earthquake Likelihood Models. The five-year RELM project, which began in 2006 (Field,<br />
2007), has compared the performance of 19 earthquake forecasting models in California using standardized testing procedures<br />
that assess forecast reliability and skill (Schorlemmer et al., 2010). The RELM mid-term results have been published<br />
(Schorlemmer et al., 2010), and a final report is in preparation (Schorlemmer et al., 2011).<br />
RELM’s success encouraged <strong>SCEC</strong> to initiate CSEP (Jordan, 2006).<br />
Support was provided by a $1.2M, 3-year grant from the W. M. Keck<br />
Foundation, which began on 1 Jan 2006. In the first year, a<br />
computational system comprising four subsystems was developed<br />
(Figure 77), and all of the RELM forecasts were registered into the<br />
nascent W. M. Keck Testing Center at <strong>SCEC</strong>. On 1 Sept 2007, CSEP<br />
began operational prospective testing at <strong>SCEC</strong> using an automated<br />
scientific workflow (Zechar et al., 2009). Since then, updates to the<br />
operational system have been installed at <strong>SCEC</strong> and released to the<br />
other testing centers on a quarterly basis. Careful management of the<br />
Keck funds and leveraging through the <strong>SCEC</strong> base program have<br />
allowed the continuation of CSEP development and operations through<br />
the first half of 2011.<br />
Since it began operations in 2007, CSEP has grown into a global<br />
collaboratory with testing activities in a variety of tectonic<br />
environments, maintained through a series of international agreements.<br />
As currently configured, its infrastructure comprises four primary<br />
components:<br />
• Testing regions: natural laboratories comprising active fault<br />
systems with adequate, authoritative data sources for<br />
conducting prediction experiments.<br />
• Community standards: rules for the registration and<br />
evaluation of scientific prediction experiments.<br />
• Testing centers: facilities with validated procedures for<br />
conducting and evaluating prediction experiments.<br />
• Communication protocols: procedures for conveying<br />
scientific results and their significance to the scientific<br />
community, government agencies responsible for earthquake<br />
hazard information, and the general public.<br />
Current Status<br />
Regional experiments are now underway in California (Zechar et al., 2009), New Zealand (Gerstenberger & Rhoades, 2010),<br />
Italy (Marzocchi et al., 2010), and Japan (Nanjo et al., 2011) and will soon be started in China (Figure 78). A program for global<br />
testing has also been initiated. The testing centers run forecasting experiments using a common software system that<br />
automatically updates short-term, seismicity-based models and evaluates the forecasts on a regular (quarterly) schedule. Both<br />
likelihood-based tests (Schorlemmer et al., 2007) and alarm-based tests (Zechar and Jordan, 2007) have been implemented.<br />
In each of the testing regions, both time-independent and time-dependent models are being evaluated using standardized<br />
seismicity catalogs collected from authoritative sources. For example, CSEP uses the Advance National Seismic System<br />
92 | Southern California Earthquake Center<br />
Figure 76. The four computer subsystems deployed<br />
within the W.M. Keck CSEP Testing Center at<br />
<strong>SCEC</strong> are configured to support the development of<br />
new earthquake forecast models (csep-devel),<br />
certification of these models into a formal testing<br />
environment (csep-cert), operational testing of<br />
registered algorithms (csep-op), and dissemination<br />
of testing results (www.cseptesting.<strong>org</strong>). The CSEP<br />
cyberinfrastructure is described in more detail by<br />
Zechar et al. (2009).
<strong>SCEC</strong> Research Accomplishments | Report<br />
(ANSS) catalog in California, the Japan Meteorological Agency (JMA) catalog for Japan, and the Global Centroid Moment<br />
Tensor (CMT) catalog in the Western Pacific testing region. The CMT catalog is also used for global testing.<br />
Today, 224 forecasting experiments are<br />
being tested worldwide (Figure 79). Two<br />
regions of current interest are New Zealand,<br />
where 15 models were being tested by<br />
CSEP at the time of the 4 Sept 2010 Darfield<br />
earthquake (M7.1), and Japan, where 91<br />
models were under CSEP testing at the<br />
time of the 11 Mar 2011 Tohoku earthquake<br />
(M9.0). The Darfield and Tohoku<br />
earthquake sequences are being observed<br />
by high-quality seismic networks, and they<br />
may lead to a better understanding about<br />
how such sequences could unfold along<br />
other active zones like those in the western<br />
United States.<br />
The CSEP testing procedures follow strict<br />
“rules of the game” that adhere to the<br />
principle of reproducibility: the testing<br />
Figure 78. CSEP testing centers and testing regions as of June 1, 2011, showing the<br />
region, the authoritative data sources,<br />
number of earthquake forecasting models under test in each region.<br />
including the seismicity catalog, and the<br />
conventions for model evaluation are established before and<br />
maintained throughout an experiment. An experiment can be rerun<br />
at any time by any researcher, and it will produce the same<br />
results. All models submitted to CSEP are required to be properly<br />
documented (preferably in the form of source code for the<br />
executable model), and they can be calibrated using retrospective<br />
data for each region; however, any data used for calibrating the<br />
models retrospectively are not employed in model evaluations.<br />
Figure 79. Number of earthquake forecasting experiments under<br />
test in CSEP testing regions worldwide as a function of time from<br />
the initiation of the <strong>SCEC</strong> Testing Center in September, 2007,<br />
through November, 2010. Annotation indicate when new testing<br />
regions were initiated.<br />
Examples of CSEP Results<br />
The catalog latency is variable but generally exceeds the updating<br />
intervals of the shortest-term forecasts; therefore, current CSEP<br />
testing is not strictly prospective. However, the model and any<br />
updating methods are fixed; authors cannot modify or interact<br />
with their models after an experiment has begun, and they are<br />
not involved in conducting the statistical tests. Thus, the forecasts<br />
are truly blind. Although the main focus is on this quasiprospective<br />
testing, the reproducibility of CSEP experiments<br />
provides a unique capability for retrospective testing.<br />
Assessing the quality of a method is a multifaceted problem that can involve many attributes of performance (e.g., Jolliffe and<br />
Stephenson, 2003). The attributes of forecast quality emphasized in the current CSEP testing procedures are reliability and skill.<br />
Reliability is an absolute measure of performance; it evaluates the statistical agreement between the forecast probabilities of<br />
target events and the observed frequencies of those events (e.g., the mean observation conditional on a particular forecast).<br />
Skill, on the other hand, assesses the performance of one method relative to another. Measures of skill can be used to evaluate<br />
a candidate method relative to a standardized reference method; e.g., a short-term earthquake forecast relative to a long-term<br />
forecast. To be useful for operational purposes, a method must demonstrate both reliability and skill.<br />
2011 <strong>SCEC</strong> <strong>Annual</strong> <strong>Meeting</strong> | 93
Report | <strong>SCEC</strong> Research Accomplishments<br />
Figure 80 and Figure 81 illustrate CSEP evaluations of reliability and skill for short-term forecasting models. An important<br />
result is the high performance of the STEP model of Gerstenberger et al. (2005, 2007) in the California testing region, which<br />
supports the USGS use of STEP as an operational forecasting model for California.<br />
Interesting results have also been obtained for the seismic sequence in the Canterbury region of New Zealand, which began<br />
with the MW 7.1 Darfield earthquake of 3 Sept 2010. The time-dependent ETAS model out performs the PPE and other timeindependent<br />
models; probability gains above 1000 have been achieved by ETAS during the Darfield sequence.<br />
New data are also coming in rapidly from the Japan testing region. The aftershock numbers predicted by ETAS models for the<br />
Tohoku sequence are under-estimates of the actual number (Figure 82). These results indicate that the ETAS updating interval<br />
of 1 day is too long to capture the aftershock activity, which decays rapidly after the mainshock. (This conclusion has also been<br />
drawn from the California experiments.) Figure 6 also shows that the aftershock number is higher during the post-interval<br />
relative to pre-event intervals, which may be related to artificially high magnitude cutoffs in the ETAS model of aftershock<br />
productivity.<br />
94 | Southern California Earthquake Center<br />
Figure 80. Examples of CSEP results that assess the absolute<br />
reliability of four models by testing the number of earthquakes<br />
forecast (dots with 95% confidence intervals) against the number<br />
observed (dashed lines) in the New Zealand testing region during<br />
the interval 4 Sept 2010 – 8 Mar 2011. ETAS_1day is a timedependent<br />
(Omori-Utsu) Epidemic Type Aftershock Sequence<br />
model, updated daily, which passes the test (indicated by green<br />
dot). PPE_3month, PPE_1day, and PPE_5year are timeindependent<br />
(Poisson) Proximity to Past Earthquakes models with<br />
updating intervals 1 day, 3 months, and 5 years, respectively, which<br />
fail the test (indicated by red dots). The ETAS and PPE_1day tests<br />
comprised 271 events with M ≥ 4, whereas the PPE_3month and<br />
PPE_5year test comprised 17 events with M ≥ 5. (209 of the 271<br />
events in the former set were aftershocks of the 3 Sept 2010<br />
Darfield earthquake.) Results from the New Zealand Testing Center<br />
are courtesy of D. Rhoades and M. Gerstenberger of GNS Science.<br />
Figure 81. Examples of CSEP testing results that assess the<br />
relative skill of forecasting models. Upper panel: Information gain<br />
(IG) per earthquake of the ETAS_1day model relative to three PPE<br />
models for target events recorded in the New Zealand testing<br />
region during the interval 4 Sept 2010 – 8 Mar 2011. The<br />
PPE_1day comparison comprised 271 events with M ≥ 4, whereas<br />
the PPE_3month and PPE_5year comparisons comprised 17<br />
events with M ≥ 5. (209 of the 271 events in the former set were<br />
aftershocks of the 3 Sept 2010 Darfield earthquake.) In this<br />
experiment, ETAS_1day achieved a probability gain (PG) of 99/eqk<br />
relative to PPE_1day and 1480/eqk relative to PPE_5year, and the<br />
null hypothesis of no probability gain can be rejected (indicated by<br />
red dots with 95% confidence intervals). Results from the New<br />
Zealand Testing Center are courtesy of D. Rhoades and M.<br />
Gerstenberger of GNS Science. Lower panel: IG per earthquake of<br />
Gerstenberger’s STEP_1day model relative to Zuang’s<br />
ETAS_1day model and Zechar & Jordan’s TripleS_1day model for<br />
301 target events with M ≥ 3.95 recorded in the California testing<br />
region during the 3-year interval 2008-2010. All three of the<br />
forecasting models were updated on a daily basis. In this<br />
experiment, STEP_1day achieved a PG of 1.35/eqk relative to<br />
ETAS_1day and 10/eqk relative to TripleS_1day, and the null<br />
hypothesis of no probability gain can be rejected (indicated by red<br />
dots with 95% confidence intervals). STEP and ETAS are timedependent<br />
(Omori-Utsu) models; TripleS and PPE are timeindependent<br />
(Poisson) models. All models were evaluated using a<br />
paired T test, developed by D. Rhoades based on the student’s t<br />
distribution. Information gain is the natural logarithm probability<br />
gain.
References<br />
<strong>SCEC</strong> Research Accomplishments | Report<br />
Gerstenberger, M. C., L. M. Jones, and S. Wiemer (2007). Short-term aftershock probabilities: Case studies in California,<br />
Seismol. Res. Lett., 78, 66-77.<br />
Gerstenberger, M.C. & D. A. Rhoades (2010), New Zealand Earthquake Forecast Testing Centre, Pure Appl. Geophys., 167,<br />
877-892.<br />
Gerstenberger, M. C., S. Wiemer, L. M. Jones, and P. A. Reasenberg (2005). Real-time forecasts of tomorrow's earthquakes in<br />
California, Nature, 435, 328-331.<br />
Field, E. H. (2007). Overview of the working group for the development of regional earthquake likelihood models (RELM),<br />
Seismol. Res. Lett., 78, 7-16.<br />
Jolliffe, I. T., and D. B. Stephenson (2003). Forecast Verification – A Practitioner's Guide in Atmospheric Science, John Wiley &<br />
Sons, Chichester, 254pp.<br />
Jordan, T. H. (2006). Earthquake predictability, brick by brick, Seismol. Res. Lett., 77, 3-6.<br />
Marzocchi, W., D. Schorlemmer & S. Wiemer, eds. (2010), An Earthquake Forecast Experiment in Italy, Special volume, Ann.<br />
Geofisica, 53 (3), 163 pp.<br />
Nanjo, K. Z., H. Tsuruoka, N. Hirata & T. H. Jordan (2011), Overview of the first earthquake forecast testing experiment in<br />
Japan, Earth Planets Space, 63, 159–169, doi:10.5047/eps.2010.10.003.<br />
Schorlemmer, D., M. C. Gerstenberger, S. Wiemer, D. D. Jackson, and D. A. Rhoades (2007). Earthquake likelihood model<br />
testing, Seismol. Res. Lett., 78, 17-29.<br />
Schorlemmer, D., J. D. Zechar, M. J. Werner, E. H. Field, D. D. Jackson, T. H. Jordan, and the RELM Working Group (2010).<br />
First results of the Regional Earthquake Likelihood Models experiment, Pure Appl. Geophys., 167, 859-876,<br />
doi:10.1007/s00024-010-0081-5.<br />
Wyss, M., and D. C. Booth (1997). The IASPEI procedure for the evaluation of earthquake precursors, Geophys. J. Int., 131, 423-<br />
424.<br />
Zechar, J. D., and T. H. Jordan (2008). Testing alarm-based earthquake predictions, Geophys. J. Int., 172, 715-724.<br />
Zechar, J. D., D. Schorlemmer, M. Liukis, J. Yu, F. Euchner, P. J. Maechling, and T. H. Jordan (2010). The Collaboratory for<br />
the Study of Earthquake Predictability perspective on computational earthquake science, Concurr. Comput.-Pract. Exp.,<br />
22, 1836-1847, doi:10.1002/cpe.1519.<br />
Community Modeling Environment<br />
The <strong>SCEC</strong> Community Modeling Environment (CME) collaboration conducts earthquake system science and computational<br />
science research with funding from the National Science Foundation (NSF), the U.S. Geological Survey (USGS), and other<br />
sources. Many important seismic hazard data products are computationally intensive and computational improvements can<br />
lead to improved seismic hazard information. CME researchers are developing new ways to use high performance computing<br />
to advance seismic hazard research. The CME research program provides an avenue through which basic <strong>SCEC</strong> research<br />
advancements can be implemented in computational form and integrated into standard, broad-impact, ground motion<br />
forecast calculations. More than thirty researchers, graduate students, and staff participated in this year’s CME collaborative<br />
research activities. The following sections summarize several CME research accomplishments between August 2010 and<br />
August 2011. More detailed information about these, and other, CME research accomplishments are presented in the <strong>SCEC</strong><br />
<strong>Annual</strong> <strong>Meeting</strong> poster sessions.<br />
California 3D Velocity Model Development<br />
Earthquake simulations require accurate 3D seismic velocity models to produce accurate ground motion estimates. To support<br />
quantitative comparison between alternative CVM’s, we established a standardized and automated velocity model evaluation<br />
system, and we used this system to evaluate existing <strong>SCEC</strong> CVM models. Our CVM evaluation system uses wave propagation<br />
simulations to evaluate 3D velocity models in the following way. Our CVM evaluation system builds a 3D velocity mesh<br />
using the CVM under test, runs a forward wave propagation simulation at 1Hz for a well-recorded southern California<br />
earthquake. The simulated ground motion records (seismograms) are compared to observed seismograms for the event using<br />
standard goodness of fit metrics including map-based plots that show geographical variations in goodness of fit results.<br />
With a CVM evaluation system in place, we developed, evaluated, and released an updated version of CVM-H. Released in<br />
February 2011, CVM-H v11.2 updates an earlier version of the CVM-Harvard velocity model called CVM-H v6.3. CVM-H<br />
2011 <strong>SCEC</strong> <strong>Annual</strong> <strong>Meeting</strong> | 95
Report | <strong>SCEC</strong> Research Accomplishments<br />
v11.2 includes an expanded coverage region and a standardized 350-m geotechnical layer based on the California Geologic<br />
Survey’s statewide mapping of VS30 (average shear velocity in the upper 30 m). This improved geotechnical layer is expected<br />
to improve the modeling of near-surface scattering in high-frequency ground motion simulations.<br />
To support current and future <strong>SCEC</strong> CVM developments, we have developed an integrated software framework, the Unified<br />
Community Velocity Model (UCVM) framework, to support the assembly of a statewide California velocity model from<br />
existing regional models. The UCVM software framework enables users to quickly build, visualize, and validate meshes from<br />
alternative velocity models through an standardized CVM query interface, and it integrates regional 3D models with selected<br />
statewide topography and bathymetry data sets and with the standardized, VS30-based geotechnical layer described above.<br />
The UCVM platform accepts input of material properties in multiple formats, including raster, voxel, and Octree, and it can<br />
export models in multiple formats, including Octree and NetCDF.<br />
Tera3D<br />
A CME group led by P. Chen used the scattering integral method of full-3D tomography to validate and improve CVM-<strong>SCEC</strong><br />
v4 (CVM-S4), a widely used <strong>SCEC</strong> 3D community velocity model for Southern California. The CME Tera3D project has<br />
produced a series of CVM-S improvements, including refinements based on waveform data from moderate California<br />
earthquakes, as well as Green-function time series derived from ambient-noise cross-correlation at station pairs in California.<br />
The Tera3D software has also been applied to the inversion of waveform data to obtain refined estimates of centroid moment<br />
tensors (CMTs) of the earthquake sources, which are then used to produce improved synthetics for structure inversions. These<br />
source inversions have also been extended to finite-source (2nd-moment) parameterizations. One important result has been a<br />
CMT catalog that resolves the fault-plane ambiguity for 40 small earthquakes in Southern California. This catalog is being<br />
used to improve tectonic interpretations of the seismicity.<br />
By combining progress on our UCVM framework, with Tera3D model improvements, an updated version of the CVM-S4<br />
velocity model, currently labeled CVM4-SI5, is now available through the <strong>SCEC</strong> web site. This is an important advance<br />
because it provides the <strong>SCEC</strong> research community with access to the results of the Tera3D inversion performed on the CVM-<br />
S4 velocity model.<br />
Broadband Platform<br />
The scientific and engineering need for higher frequency ground motion simulations has led to the development of the <strong>SCEC</strong><br />
broadband platform. The <strong>SCEC</strong> broadband platform is a software integration effort in which multiple <strong>SCEC</strong> scientific codes<br />
have been integrated together into a “software system”, that is, a single software distribution capable of calculating ground<br />
motions for arbitrary ruptures up to 10Hz. Because of the tremendous computational requirements for 10Hz deterministic<br />
simulations, the <strong>SCEC</strong> Broadband platform calculates low frequency deterministic seismograms (0Hz – 1Hz) and adds<br />
stochastic high frequencies (>1Hz – 10Hz) to produce broadband (0-10Hz) seismograms.<br />
CME researchers released a software distribution of the <strong>SCEC</strong> Broadband platform v11.2 in February 2011. The Broadband<br />
Platform integrates several scientific software elements—pseudo-dynamic rupture generators, deterministic and stochastic<br />
seismogram synthesis codes, and non-linear site effect modeling codes—into a single software distribution capable of<br />
calculating broadband seismograms (0-10 Hz) for kinematic finite-source models. The Broadband Platform distribution<br />
contains a set of earthquake source models of historic validation events including Northridge, Loma Prieta, and Landers. It<br />
can also generate broadband seismograms using user-defined source descriptions of scenario earthquakes. The Broadband<br />
platform was designed for portability and ease-of-use by non-experts, including geoscientists and earthquake engineers. Users<br />
may select among various codebases for rupture generation, 1D low-frequency synthesis, high-frequency synthesis, and<br />
incorporation of non-linear site effects, with the option of running goodness-of-fit comparisons against observed or other<br />
simulated seismograms. The platform produces a variety of ground motion-related data products, including broadband<br />
seismograms, rupture visualizations, and goodness-of-fit plots.<br />
CyberShake Platform<br />
During this year, we continued development of the CyberShake hazard model. The CyberShake platform calculates physicsbased<br />
probabilistic seismic hazard curves for California in which peak ground motion estimates for ruptures are calculated<br />
using wave propagation simulations rather than attenuation relationships. The CyberShake Platform computes synthetic<br />
96 | Southern California Earthquake Center
<strong>SCEC</strong> Research Accomplishments | Report<br />
seismograms for very large ensembles of earthquake ruptures using an efficient algorithm based on the concept of seismic<br />
reciprocity. A pseudo-dynamic rupture generator samples all fault-based ruptures of the uniform California earthquake<br />
rupture forecast (UCERF2), providing for each fault source multiple realizations. From this rupture set, approximately 880,000<br />
horizontal-component seismograms up to seismic frequencies of 0.5 Hz are calculated at each site of interest. The seismograms<br />
are post-processed to obtain single-degree-of-freedom spectral acceleration at various frequencies, and these spectral<br />
accelerations are used to compute hazard curves and hazard maps. Earlier CyberShake hazard curves used the CVM-S4<br />
velocity model to represent 3D structure. During this year, CyberShake models were calculated using an alternative pseudodynamic<br />
rupture generator and the recently released CVM-H v11.2 velocity model.<br />
CyberShake results suggest that the standard attenuation relations used in PSHA, such as the NGA relations used by NSHMP,<br />
significantly underestimate the hazard probabilities in the sedimentary basins of the Los Angeles region. We believe this<br />
underestimation is due to a strong coupling between source directivity effects and basin amplification effects not captured in<br />
the empirical models. The results are significant because most of the population and urban infrastructure, and therefore most<br />
of the earthquake risk, is concentrated in the sedimentary basins. Comparisons between CyberShake hazard models indicate<br />
that the largest epistemic uncertainty in the hazard curves comes from uncertainties in basin structure, suggesting that more<br />
effort should be placed on refining models of basin structure using full-3D tomography and other information.<br />
Broadband CyberShake<br />
During this year, we extended our CyberShake computational capabilities to broadband frequencies by combining two<br />
existing <strong>SCEC</strong> computational capabilities, the CyberShake physics-based PSHA capability, and the Broadband Platform high<br />
frequency seismogram calculation. The <strong>SCEC</strong> Broadband CyberShake Platform can calculate physics-based PSHA hazard<br />
curves that contain frequencies up to 10Hz by combining the 0.5Hz deterministic calculations of the CyberShake platform, and<br />
the 0.5Hz-10Hz stochastic calculations of the <strong>SCEC</strong> Broadband Platform. These higher frequency PSHA calculations provide<br />
PSHA estimates for higher frequency dependent intensity measures, such as Peak Ground Acceleration (PGA), which are<br />
relevant to seismic hazards for stiff structures and precarious rock validation work. The Broad CyberShake platform was used<br />
to calculated new PSHA hazard estimates for selected California sites of interest after the Tohoku earthquake in March 2011.<br />
CME High Performance Computing (HPC)<br />
This year’s CME research activities were partially funded as part of the NSF PetaApps program that has the explicit goal of<br />
preparing science applications that can run at sustained petaflops performance on HPC systems. The research accomplished<br />
with this support has positioned <strong>SCEC</strong> to take advantage of NSF Track 1 and DOE Leadership-class computing systems<br />
scheduled to begin operations in 2012-2013. <strong>SCEC</strong>/CME high performance computing activities during this year include<br />
development of highly parallel computational software including AWP-ODC, Hercules, and SORD, as well as extensive<br />
automation of computational simulations using scientific workflow technologies.<br />
AWP-ODC<br />
The <strong>SCEC</strong> AWP-ODC software is a highly parallel, 4th-order, staggered-grid, finite-difference code parallelized for large-scale<br />
calculations. By running on several generations of NSF and DOE computer hardware, we have developed AWP-ODC into a<br />
highly efficient and scalable code for wide variety of applications, including forward and inverse problems. In 2010, AWP-<br />
ODC achieved nearly ideal speedup between 65,610 and 223,074 cores on NCCS Jaguar and exceptional parallel efficiency—<br />
nearly 90% on 204,800 Jaguar cores. AWP-ODC was used for the M8 simulations described below, attaining a sustained<br />
performance of 220 teraflops in production runs and over 300 teraflops in benchmark runs.<br />
To achieve this level of scalability and performance, <strong>SCEC</strong> researchers made many software improvements: single-CPU<br />
optimization, introducing computation/communication overlap and asynchronous communication, reducing<br />
communications at the algorithm level, and optimizing rank placement remapping. Taken together, these optimizations have<br />
reduced IO time from 49% of wall clock time to less than 1%.<br />
M8 Study<br />
The <strong>SCEC</strong> M8 study comprises a set of scenario earthquake simulations of magnitude 8.0 southern San Andreas ruptures. The<br />
M8 scenario earthquake is an Mw 8.0 earthquake that ruptures the entire 545-km length of the southern San Andreas Fault,<br />
2011 <strong>SCEC</strong> <strong>Annual</strong> <strong>Meeting</strong> | 97
Report | <strong>SCEC</strong> Research Accomplishments<br />
from Cholame in central California to the southern termination of the San Andreas Fault on the Salton Sea. The <strong>SCEC</strong> M8<br />
earthquake scenario represents the outer scale required for standard California seismic hazard calculations because there are<br />
few, if any, larger ruptures in the existing USGS Unified California Earthquake Rupture Forecast (UCERF 2.0).<br />
Running the M8 earthquake simulation involved a two-step process. First, we ran a dynamic rupture simulation, on NICS<br />
Kraken supercomputer, to create a physically realizable slip-time history on the fault. Second, we ran a ground motion<br />
simulation, on NCCS Jaguar supercomputer (the world’s fastest at the time), to model the anelastic seismic wave propagation<br />
from the fault rupture. The latter calculation represented the 3D seismic velocity structure by 436 billion mesh points and ran<br />
for 24 hours on Jaguar at full machine scale (more than 223,000 cores), making it the largest-ever earthquake simulation. The<br />
M8 simulation team, led by Y. Cui, was recognized as an ACM Gordon Bell Finalist in 2010.<br />
The <strong>SCEC</strong> M8 simulations show that <strong>SCEC</strong>’s AWP-ODC deterministic 3D wave propagation software can scale to simulate<br />
any earthquake in the standard California earthquake rupture forecast up to 2Hz. The M8 simulations show that CME<br />
researchers can run well-validated deterministic wave propagation simulations at 2Hz at the scale need to model the “worstcase”<br />
seismic hazard earthquake scenarios in current California Earthquake Rupture Forecasts.<br />
The M8 simulation results have led to several significant scientific conclusions: (1) the likelihood that large ruptures on the San<br />
Andreas fault will transition from sub-shear speeds during rupture propagation; (2) the importance of directivity and basin<br />
effects in ground motion amplification at high frequencies; and (3) the need to model off-fault plastic yielding and non-linear<br />
site effects at frequencies above 1 Hz.<br />
The <strong>SCEC</strong> M8 simulations used an advanced form of earthquake description, one based on dynamic rupture simulation, as<br />
input to the simulation. Dynamic rupture simulations model friction-based slip on a fault so dynamic rupture simulations are<br />
consistent with known physics of fault ruptures. Less physically-accurate, but less computationally intensive, are kinematic<br />
rupture descriptions. Kinematic ruptures are not constrained by friction-based fault slip. Our M8 dynamic rupture simulation<br />
progressed quickly into a Supershear rupture, reduced speed, and then returned to Supershear velocity, all during the course<br />
of a single M8 earthquake. The fact that we observe Supershear velocities in our most physics-based rupture models suggests<br />
that Supershear ruptures are both possible and common. By comparing ground motions from dynamic ruptures and<br />
kinematic ruptures we have begun to establish the significant impact that Supershear rupture velocities have on ground<br />
motions.<br />
Another important result from the <strong>SCEC</strong> M8 simulations relates to the important of non-linear site effects. <strong>SCEC</strong> researchers<br />
have significant experience with deterministic simulations up to 1Hz. However, as our M8 simulation work shows,<br />
deterministic wave propagation simulation results about 1Hz are significantly less mature. M8 results showed unexpectedly<br />
high, near-fault, ground motions. Our analysis of these results point to the need to model less-rigid, more flexible, materials at<br />
the surface when simulating seismic waves at frequencies about 1Hz. Indications are that at frequencies above 1Hz, non-linear<br />
effects become important. Above 1Hz, deterministic ground motion simulation results begin to diverge from observations<br />
especially for intensity measures typically associated with higher frequency motions such as peak acceleration.<br />
These unexpectedly high peak ground motions, at frequencies above 1Hz, indicate a need to model the plastic yielding of near<br />
surface layers at higher frequencies. Until now, <strong>SCEC</strong> deterministic simulations at lower frequencies have not needed to<br />
model this additional non-linear behavior. Results from M8 show that <strong>SCEC</strong> simulations will need to model non-linear<br />
behavior as our deterministic simulations reach frequencies above 1Hz.<br />
Hercules<br />
Hercules simulation software, with development led by J. Bielak, is a finite-element parallel code that relies on an Octreebased<br />
mesher and solves the anelastic wave equations by approximating the spatial variability of the displacements and the<br />
time evolution with piecewise polynomial elements and central differences, respectively. PetaShake project has produced<br />
Hercules improvements in the areas of single-processor tuning, and optimization of the communication topology, message<br />
sizes, and messaging techniques. Checkpointing was implemented to reinitiate computations after unexpected interruptions.<br />
Through these improvements and algorithm improvements, the scalability of Hercules has been established on up to 100,000<br />
compute cores on NICS Kraken, and it has been successfully used in different earthquake validation and verification exercises,<br />
such as the ShakeOut scenario.<br />
98 | Southern California Earthquake Center
<strong>SCEC</strong> Research Accomplishments | Report<br />
Recently improved Hercules algorithms have achieved a 3x speed-up over the conventional element-by-element matrix-vector<br />
multiplication approach, obtaining a quadratic convergence rate in both time and space. More recently, we have incorporated<br />
a quadratic piecewise spatial approximation, which requires fewer nodes per wavelength for a prescribed level of accuracy.<br />
The code uses a plane-wave approximation for the absorbing boundary condition and allows either a Rayleigh bulk<br />
attenuation mechanism or a viscoelastic relaxation (BKT) model that employs Maxwell and Voigt elements. The solver<br />
computes displacements in an element-by-element fashion, scaling the stiffness and lumped mass matrix templates according<br />
to the material properties and octant edge-size. This approach allows Hercules to reduce memory requirements considerably<br />
relative to standard FEM implementations. We also implemented new Octree-based quadratic elements, which allow the<br />
ground motions to be represented much more accurately than the original linear elements with little additional computational<br />
effort.<br />
As a part of our Hercules development, we created e-trees of the <strong>SCEC</strong> Community Velocity Models, CVM-S and CVM-H, up<br />
to extraordinary scales (17 billion octants in 2 TB), allowing us to perform earthquake ground motion simulations of large<br />
areas (150 km × 100 km) to high seismic frequencies with realistic velocities (~200 m/s) for the soft soil layers. For example, we<br />
have simulated the 2008 Chino Hills earthquake with an unprecedented resolution of 4 Hz, spanning frequencies of practical<br />
interest for engineered structures. These improvements bring us closer to being able to simulate destructive earthquakes in<br />
almost real time, which could be of great importance for emergency response, recovery, and reconstruction activities.<br />
SORD<br />
A CME team, led by G. Ely, has developed a structured FE code called Support Operator Rupture Dynamics (SORD). SORD<br />
can simulate dynamic fault ruptures using a logically rectangular hexahedral (structured) mesh that can be distorted to<br />
accommodate non-planar ruptures and surface topography. It employs the Kelvin-Voigt model of viscoelasticity. Besides the<br />
anelastic energy losses (attenuation) provided by this model during wave propagation, the viscosity helps prevent numerical<br />
noise from affecting the nonlinear rupture calculations. Wave motions are computed on a logically rectangular hexahedral<br />
mesh, using the generalized finite difference method of support operators. Stiffness and viscous hourglass corrections are<br />
employed to suppress zero-energy grid oscillation modes. The fault surface is modeled by coupled double nodes, where the<br />
strength of the coupling is determined by a linear slip-weakening friction law. External boundaries may be reflective or<br />
absorbing, and the absorbing boundaries are handled using the PML method. SORD code has been enhanced with scalable IO<br />
through MPI-IO optimizations, adapted from AWP-ODC IO. The hybrid CPU-GPU has been implemented with external<br />
collaboration for efficient speedup on GPU accelerator. SORD is being applied in the <strong>SCEC</strong> Big Ten simulation project, which<br />
uses the CyberShake rupture sets to investigate the most probable large (M > 7) ruptures in Southern California with the<br />
objective of understanding how source directivity, rupture complexity, and basin effects control ground motions.<br />
CyberShake Workflows<br />
<strong>SCEC</strong> scientific workflows manage the scheduling, code and file dependencies, and execution of production runs in both highcapability<br />
and high-capacity computing environments. The complex, multi-stage, HPC requirements of our CyberShake<br />
calculations present our imposing computational challenges, so we have applied workflow technologies to our CyberShake<br />
calculation to establish the scale, throughput, and reliability we need to complete CyberShake physics-based PSHA hazard<br />
calculations.<br />
To execute the workflows on grid resources, CyberShake uses a software stack including the Pegasus Workflow Management<br />
System and Condor. This software enables us to create a generic, high-level workflow description, plan it for execution on a<br />
specific computational resource, and submit and monitor the jobs remotely. Large parallel jobs in the CyberShake workflow<br />
are submitted directly to the batch scheduler on the remote system using grid protocols. However, using a similar approach<br />
for the post-processing workflow resulted in poor performance owing to several factors: (a) grid submission overheads and<br />
queue waiting times greatly exceeded the runtimes of the jobs themselves, resulting in low throughput; (b) many<br />
computational resources have scheduling policies that limit the number of jobs that can be queued simultaneously, resulting<br />
in poor parallelism for serial jobs; and (c) submitting a large number of short-duration jobs often overwhelmed the remote<br />
scheduler, resulting in job failures and other errors. Performance for the post-processing CyberShake workflow was improved<br />
using two optimization techniques. Using an optimization technique called task clustering, Pegasus is now able to group<br />
multiple tasks into a single grid job, reducing the number of jobs to be executed and increasing the average runtime, which<br />
reduces the relative scheduling overhead.<br />
2011 <strong>SCEC</strong> <strong>Annual</strong> <strong>Meeting</strong> | 99
Report | <strong>SCEC</strong> Research Accomplishments<br />
Another optimization technique, called resource provisioning, allows CyberShake to allocate resources ahead of workflow<br />
execution and assume responsibility for matching jobs with resources. Provisioning for CyberShake is enabled using Condor<br />
glide-ins managed by Corral. To provision resources, a glide-in request is submitted to the remote scheduler. Instead of<br />
running an application job, the glide-in reserves the resource and starts a condor daemon that can fetch application jobs<br />
directly from the workflow management system. This approach bypasses the remote scheduler and reduces scheduling<br />
overhead. It also enables one glide-in job to provision multiple resources for a long period, executing many workflow jobs.<br />
Finally, giving the workflow system responsibility for resource management enables CyberShake to use custom scheduling<br />
policies that result in better performance. Corral automates the complex steps required to create glide-in jobs and<br />
automatically resubmits glide-ins as they expire, allowing CyberShake to maintain a fixed-size resource pool over a long<br />
period of time.<br />
Earthquake Simulation Visualizations<br />
CME scenario earthquake simulations show how advanced visualizations of earthquake simulations can effectively<br />
communicate seismic hazards to scientists, educators, and the public. <strong>SCEC</strong> earthquake animations, created in collaboration<br />
with San Diego Supercomputer Visualization Services have been shown worldwide, and these achievements have garnered a<br />
number of scientific visualization awards. During this year, visualizations of the <strong>SCEC</strong> M8 earthquake simulation won<br />
Honorable Mention at International Science & Engineering Visualization Challenges (2010) and SciDAC Office of Advanced<br />
Scientific Computing Research (OASCR) Visualization Awards (2011). Links to these award winning scientific visualizations<br />
are available through the <strong>SCEC</strong> web site.<br />
CME Outreach<br />
CME research accomplishments have resulted in several public references to our research. Our Cui et al paper “Scalable<br />
Earthquake Simulation on Petascale Supercomputers” describing our M8 simulation was a Gordon Bell Award finalist at SC10.<br />
<strong>SCEC</strong> M8 research was presented at SC10 as part of Thomas H. Jordan’s Masterworks presentation. Our M8 and Tera3D<br />
research results were presented at American Geophysical Union (AGU) Fall 2010 meeting. M8 research results were used in<br />
multiple public press coverage of <strong>SCEC</strong> M8 at SC10 as well as AGU 2010 meeting. The scientific results and computational<br />
achievement of <strong>SCEC</strong> M8 were described in an SDSC press release and a DOE highlight article. <strong>SCEC</strong> Broadband Platform<br />
developments were presented at multiple NSF geoscience and computer science workshops including SDSC Data Intensive<br />
Computing Workshop October 2010 and TeraGrid 2011 meeting.<br />
100 | Southern California Earthquake Center
Draft 2012 Science Plan<br />
<strong>SCEC</strong> Planning Committee<br />
September 2011<br />
I. Preamble<br />
Draft 2012 Science Plan<br />
The Southern California Earthquake Center (<strong>SCEC</strong>) coordinates basic research in earthquake science using Southern California<br />
as its natural laboratory. <strong>SCEC</strong> emphasizes the connections between information gathering by sensor networks, fieldwork,<br />
and laboratory experiments; knowledge formulation through physics-based, system-level modeling; improved understanding<br />
of seismic hazard; and actions to reduce earthquake risk and promote resilience. The Center is a consortium of institutions that<br />
coordinates earthquake system science within Southern California. <strong>SCEC</strong>’s long-term goal is to understand how seismic<br />
hazards change across all time scales of scientific and societal interest, from millennia to seconds. <strong>SCEC</strong>4 will move<br />
earthquake science forward through highly integrated collaborations that are coordinated across scientific disciplines and<br />
research institutions and enabled by high-performance computing and advanced information technology. It will focus on six<br />
fundamental problems of earthquake physics:<br />
1. Stress transfer from plate motion to crustal faults: long-term fault slip rates.<br />
2. Stress-mediated fault interactions and earthquake clustering: evaluation of mechanisms.<br />
3. Evolution of fault resistance during seismic slip: scale-appropriate laws for rupture modeling.<br />
4. Structure and evolution of fault zones and systems: relation to earthquake physics.<br />
5. Causes and effects of transient deformations: slow slip events and tectonic tremor.<br />
6. Seismic wave generation and scattering: prediction of strong ground motions.<br />
The six fundamental problems constitute the basic-research focus of <strong>SCEC</strong>. They are interrelated and require an<br />
interdisciplinary, multi-institutional approach. Interdisciplinary research initiatives will focus on special fault study areas, the<br />
development of a community geodetic model for Southern California, and a community stress model. The latter will be a new<br />
platform where the various constraints on earthquake-producing stresses can begin to be integrated. Improvements will be<br />
made to <strong>SCEC</strong>’s unified structural representation and its statewide extensions.<br />
Collaboration Plan. On February 1, 2012, the Southern California Earthquake Center (<strong>SCEC</strong>) transitions from <strong>SCEC</strong>3 to<br />
<strong>SCEC</strong>4 under joint funding from NSF/EAR and the U.S. Geological Survey. <strong>SCEC</strong>4 is funded for the period February 2012<br />
through January 2017. This document, referred to as the collaboration plan, solicits proposals from individuals and groups to<br />
participate in the first year of the <strong>SCEC</strong>4 research program.<br />
II. Guidelines for Proposal Submission<br />
A. Due Date. Friday, November 4, 2011, 5:00 pm PST. Late proposals will not be accepted. Note the different deadline<br />
for submitting annual progress reports below.<br />
B. Delivery Instructions. Proposals must be submitted as PDF documents via the <strong>SCEC</strong> Proposal web site at<br />
http://www.scec.<strong>org</strong>/proposals. Submission procedures, including requirements for how to name your PDF files, will be<br />
found at this web site.<br />
C. Formatting Instructions.<br />
Cover Page. The cover page should be headed with the words "2012 <strong>SCEC</strong> Proposal" and include the project title,<br />
Principal Investigator(s), institutional affiliation, amount of request, and proposal categories (from types listed in<br />
Section IV). List (in order of priority) three science objectives (Section VII) that your proposal addresses, for example<br />
1a, 3c and 4b. Indicate if the proposal should also be identified with one or more of the <strong>SCEC</strong> special projects (see<br />
Section X). Collaborative proposals involving multiple investigators and/or institutions should list all Principal<br />
2011 <strong>SCEC</strong> <strong>Annual</strong> <strong>Meeting</strong> | 101
Draft 2012 Science Plan<br />
Investigators. Proposals do not need to be formally signed by institutional representatives, and should be for one<br />
year, with a start date of February 1, 2012.<br />
Technical Description. Describe in up to five pages (including figures) the technical details of the project and how it<br />
relates to the short-term objectives outlined in the <strong>SCEC</strong> Research Priorities and Requirements (Section VII). If you<br />
have previously been funded by <strong>SCEC</strong>, you must include a one page summary of previous research results in this<br />
section. This summary is part of the five-page limit. References are not included in the five-page limit. See note below<br />
on submission of collaborative proposals.<br />
Budget Page. Budgets and budget explanations should be constructed using NSF categories. Under guidelines of<br />
the <strong>SCEC</strong> Cooperative Agreements and A-21 regulations, secretarial support and office supplies are not allowable as<br />
direct expenses.<br />
Current Support. Statements of current support, following NSF guidelines, should be included for each Principal<br />
Investigator. Any proposal without a current and pending support statement will not be reviewed.<br />
Final <strong>SCEC</strong>3 Report. Scientists funded by <strong>SCEC</strong> in 2011 must submit a report of their progress by 5:00 pm PST<br />
February 29, 2012. Submission of this report is critical to preparing the final <strong>SCEC</strong>3 report to the funding agencies.<br />
2012 proposals approved by the PC will not be funded if this progress report is not submitted on time. Reports<br />
should be up to five pages of text and figures. Reports should include bibliographic references to any <strong>SCEC</strong><br />
publication during the past year (including papers submitted and in review), including their <strong>SCEC</strong> contribution<br />
number. Publications are assigned numbers when they are submitted to the <strong>SCEC</strong> publication database at<br />
http://www.scec.<strong>org</strong>/signin.<br />
Special Note on Workshop Reports. Reports on results and recommendations of workshops funded by <strong>SCEC</strong> in<br />
2012 are to be submitted no later than 30 days following the completion of the workshop. The reports will be posted<br />
on the <strong>SCEC</strong> web site as soon as possible after review by <strong>SCEC</strong> directors.<br />
Labeling the Submitted PDF Proposal. PI's must follow the proposal naming convention. Investigators must label<br />
their proposals with their last name followed by 2012, e.g., Beroza2012.pdf. If there is more than one proposal, then<br />
the file would be labeled as: Beroza2012_1.pdf (for the 1st proposal) and Beroza2012_2.pdf (for the 2nd proposal).<br />
D. Principal Investigator Responsibilities. PI's are expected to interact with other <strong>SCEC</strong> scientists on a regular basis<br />
(e.g., by attending the annual meeting, workshops and working group meetings), and contribute data, analysis<br />
results, and/or models to the appropriate <strong>SCEC</strong> data center (e.g., Southern California Earthquake Data Center—<br />
SCEDC), database, or community model (e.g., Community Velocity Model—CVM). Publications resulting entirely or<br />
partially from <strong>SCEC</strong> funding must include a publication number available at http://www.scec.<strong>org</strong>/signin. By submitting<br />
a proposal, investigators are agreeing to these conditions.<br />
E. Eligibility. Proposals can be submitted by eligible Principal Investigators from:<br />
• U.S. Academic institutions<br />
• U.S. Private corporations<br />
• International Institutions (funding will mainly be for travel and only travel to <strong>SCEC</strong> sponsored meetings in the<br />
US are eligible for support)<br />
F. Collaboration. Collaborative proposals with investigators from the USGS are encouraged. USGS employees should<br />
submit their requests for support through USGS channels. Collaborative proposals involving multiple investigators<br />
and/or institutions are strongly encouraged; these can be submitted with the same text, but with different<br />
institutional budgets if more than one institution is involved.<br />
A collaborative proposal should be submitted only by the lead PI. Information on all co-PI's (including budgets and<br />
current support statements) must be included in one proposal submission. Collaborative proposals may include one<br />
extra page per PI to report results of previous research.<br />
G. Budget Guidance. Typical <strong>SCEC</strong> grants funded under this Science Plan in the past have fallen in the range of<br />
$10,000 to $35,000. This is not intended to limit <strong>SCEC</strong> to a fixed award amount, nor to a specified number of awards,<br />
rather it is intended to calibrate expectations for proposals written by first-time <strong>SCEC</strong> investigators.<br />
102 | Southern California Earthquake Center
Draft 2012 Science Plan<br />
H. Award Procedures. All awards will be funded by subcontract from the University of Southern California. The<br />
Southern California Earthquake Center is funded by the National Science Foundation and the U.S. Geological Survey.<br />
III. <strong>SCEC</strong> Organization<br />
A. Mission and Science Goal. <strong>SCEC</strong> is an interdisciplinary, regionally focused <strong>org</strong>anization with a mission to:<br />
• Gather data on earthquakes in Southern California and elsewhere where such data has direct relevance to<br />
southern California (field research investigations outside southern California will not be supported)<br />
• Integrate information into a comprehensive, physics-based understanding of earthquake phenomena<br />
• Communicate understanding to the world at large as useful knowledge for reducing earthquake risk<br />
<strong>SCEC</strong>'s primary science goal is to develop a comprehensive, physics-based understanding of earthquake phenomena<br />
in Southern California through integrative, multidisciplinary studies of plate-boundary tectonics, active fault systems,<br />
fault-zone processes, dynamics of fault ruptures, ground motions, and seismic hazard analysis.<br />
B. Disciplinary Activities. The Center sustains disciplinary science through standing committees in seismology,<br />
geodesy, geology, and computational science. These committees will be responsible for planning and coordinating<br />
disciplinary activities relevant to the <strong>SCEC</strong> science plan, and they will make recommendations to the <strong>SCEC</strong> Planning<br />
Committee regarding support of disciplinary research and infrastructure. High-priority disciplinary activities are<br />
summarized in Section VIII.<br />
C. Interdisciplinary Focus Areas. Interdisciplinary research is <strong>org</strong>anized within seven science focus areas: 1) Unified<br />
Structural Representation (USR), 2) Fault and Rupture Mechanics (FARM), 3) Stress and Deformation Over Time<br />
(SDOT), 4) Earthquake Forecasting and Predictability (EFP), 5) Ground Motion Prediction (GMP), 6) Southern San<br />
Andreas Fault Evaluation (SOSAFE), and 7) Earthquake Engineering Implementation Interface (EEII). High-priority<br />
activities are listed for each of these interdisciplinary focus areas in Section IX.<br />
D. Technical Activity Groups. Various groups of experts have formed Technical Activity Groups (TAGs) to verify the<br />
complex computer calculations needed for wave propagation and dynamic rupture problems, to assess the accuracy<br />
and resolving power of source inversions, and to develop geodetic transient detectors and earthquake simulators.<br />
TAGs can be thought of as "mini-collaboratories" that pose well-defined “standard problems”, encourage solution of<br />
these problems by different researchers using different algorithms or codes, develop a common cyberspace for<br />
comparing solutions, and facilitate meetings to discuss discrepancies and potential improvements.<br />
E. Communication, Education, and Outreach. The theme of the CEO program during <strong>SCEC</strong>4 is Creating an Earthquake<br />
and Tsunami Resilient California. CEO will continue to manage and expand a suite of successful activities along with<br />
new initiatives, within four CEO interconnected thrust areas:<br />
a. The Implementation Interface connects <strong>SCEC</strong> scientists with partners in earthquake engineering research,<br />
and communicates with and trains practicing engineers and other professionals.<br />
b. The Public Education and Preparedness thrust area educates people of all ages about earthquakes, and<br />
motivates them to become prepared.<br />
c. The K-14 Earthquake Education Initiative seeks to improve earth science education and school earthquake<br />
safety.<br />
d. Finally, the Experiential Learning and Career Advancement program provides research opportunities,<br />
networking, and more to encourage and sustain careers in science and engineering.<br />
Opportunities for participating in the CEO program are described in Section XI.<br />
IV. Proposal Categories<br />
A. Data Gathering and Products. <strong>SCEC</strong> coordinates an interdisciplinary and multi-institutional study of earthquakes<br />
in Southern California, which requires data and derived products pertinent to the region. Proposals in this category<br />
should address the collection, archiving and distribution of data, including the production of <strong>SCEC</strong> community<br />
models that are on-line, maintained, and documented resources for making data and data products available to the<br />
scientific community.<br />
2011 <strong>SCEC</strong> <strong>Annual</strong> <strong>Meeting</strong> | 103
Draft 2012 Science Plan<br />
B. Integration and Theory. <strong>SCEC</strong> supports and coordinates interpretive and theoretical investigations on earthquake<br />
problems related to the Center’s mission. Proposals in this category should be for the integration of data or data<br />
products from Category A, or for general or theoretical studies. Proposals in Categories A and B should address one<br />
or more of the goals in Section VII, and may include a brief description (
B. Proposals may be strengthened by describing:<br />
1. Collaboration<br />
• Within a disciplinary or focus group<br />
• Between disciplinary and/or focus groups<br />
• In modeling and/or data gathering activities<br />
• With engineers, government agencies, and others. (See Section XI)<br />
2. Leveraging additional resources<br />
• From other agencies<br />
• From your institution<br />
• By expanding collaborations<br />
3. Development and delivery of products<br />
• Community research tools, models, and databases<br />
• Collaborative research reports<br />
• Papers in research journals<br />
• End-user tools and products<br />
• Workshop proceedings and CDs<br />
• Fact sheets, maps, posters, public awareness brochures, etc.<br />
• Educational curricula, resources, tools, etc.<br />
4. Educational opportunities<br />
• Graduate student research assistantships<br />
• Undergraduate summer and year-round internships (funded by the project)<br />
• K-12 educator and student activities<br />
• Presentations to schools near research locations<br />
• Participation in data collection<br />
Draft 2012 Science Plan<br />
C. All research proposals will be evaluated by the appropriate disciplinary committees and focus groups, the Science<br />
Planning Committee, and the Center Director. CEO proposals will be evaluated by the CEO Associate Director and<br />
the Center Director.<br />
D. The Science Planning Committee is chaired by the Deputy Director and comprises the chairs of the disciplinary<br />
committees, focus groups, and special projects. It is responsible for recommending a balanced science budget to the<br />
Center Director.<br />
E. Recommendations of the planning committees will be combined into an annual spending plan and forwarded to the<br />
<strong>SCEC</strong> Board of Directors for approval.<br />
F. Final selection of research projects will be made by the Center Director, in consultation with the Board of Directors.<br />
G. The review process should be completed and applicants notified by the end of February, 2012.<br />
VI. Coordination of Research between <strong>SCEC</strong> and USGS-EHRP<br />
Earthquake research in Southern California is supported both by <strong>SCEC</strong> and by the USGS Earthquake Hazards Reduction<br />
Program (EHRP). EHRP's mission is to provide the scientific information and knowledge necessary to reduce deaths, injuries,<br />
and economic losses from earthquakes. Products of this program include timely notifications of earthquake locations, size, and<br />
2011 <strong>SCEC</strong> <strong>Annual</strong> <strong>Meeting</strong> | 105
Draft 2012 Science Plan<br />
potential damage, regional and national assessments of earthquakes hazards, and increased understanding of the cause of<br />
earthquakes and their effects. EHRP funds research via its External Research Program, as well as work by USGS staff in its<br />
Pasadena, Menlo Park, and Golden offices. The EHRP also directly supports <strong>SCEC</strong>.<br />
<strong>SCEC</strong> and EHRP coordinate research activities through formal means, including USGS membership on the <strong>SCEC</strong> Board of<br />
Directors and a Joint Planning Committee, and through a variety of less formal means. Interested researchers are invited to<br />
contact Dr. Ken Hudnut, EHRP coordinator for Southern California, or other <strong>SCEC</strong> and EHRP staff to discuss opportunities<br />
for coordinated research.<br />
The USGS EHRP supports a competitive, peer-reviewed, external program of research grants that enlists the talents and<br />
expertise of the academic community, State and local governments, and the private sector. The investigations and activities<br />
supported through the external program are coordinated with and complement the internal USGS program efforts. This<br />
program is divided into six geographical/topical 'regions', including one specifically aimed at Southern California earthquake<br />
research and others aimed at earthquake physics and effects and at probabilistic seismic hazard assessment (PSHA). The<br />
Program invites proposals that assist in achieving EHRP goals.<br />
The EHRP web page, http://earthquake.usgs.gov/research/external/, describes program priorities, projects currently funded, results<br />
from past work, and instructions for submitting proposals. The EHRP external funding cycle is several months offset from<br />
<strong>SCEC</strong>'s, with the RFP due out in February and proposals due in May. Interested PI's are encouraged to contact the USGS<br />
regional or topical coordinators for Southern California, Earthquake Physics and Effects, and/or National (PSHA) research, as<br />
listed under the "Contact Us" tab.<br />
The USGS internal earthquake research program is summarized by topic at http://earthquake.usgs.gov/research/topics.php.<br />
VII. <strong>SCEC</strong>4 Fundamental Problems of Earthquake Physics: Research Priorities and<br />
Requirements<br />
The six fundamental problems constitute the basic-research focus of <strong>SCEC</strong>4 and are listed in the preamble. They are<br />
interrelated and require an interdisciplinary, multi-institutional approach. Interdisciplinary research initiatives will focus on<br />
special fault study areas, the development of a community geodetic model for Southern California, and a community stress<br />
model. The latter will be a new platform where the various constraints on earthquake-producing stresses can begin to be<br />
integrated. Improvements will be made to <strong>SCEC</strong>’s unified structural representation and its statewide extensions.<br />
1. Stress transfer from plate motion to crustal faults: long-term fault slip rates.<br />
Priorities and Requirements<br />
1a. Mapping and studying faults for which brittle/ductile transitions have been exposed by detachment faulting or<br />
erosion.<br />
1b. Focused laboratory, numerical, and geophysical studies of the character of the lower crust, its rheol- ogy, stress<br />
state, and expression in surface deformation. We will use surface-wave dispersion to im- prove depth resolution<br />
relative to teleseismic studies.<br />
1c. Regional searches for seismic tremor at depth in Southern California to observe if (some) deformation occurs by<br />
slip on discrete structures.<br />
1d. Development of a Community Geodetic Model (CGM) for California, in collaboration with the UNAVCO<br />
community, to constrain long-term deformation and fault-slip models.<br />
1e. Combined modeling/inversion studies to interpret GPS and InSAR geodetic results on postseismic transient<br />
deformation without traditional simplifying assumptions.<br />
2. Stress-mediated fault interactions and earthquake clustering: evaluation of mechanisms<br />
Priorities and Requirements<br />
106 | Southern California Earthquake Center
Draft 2012 Science Plan<br />
2a. Improvement of earthquake catalogs, including non-point-source source descriptions, over a range of scales.<br />
Traditional aftershock catalogs can be improved through better detection of early aftershocks. Long-term (2000-yr)<br />
earthquake chronologies, including slip-per-event data, for the San Andreas Fault system are necessary to constrain<br />
long-term clustering behavior.<br />
2b. Improved descriptions of triggered earthquakes. While temporal earthquake clustering behavior (Omori’s Law) is<br />
well-known, the spatial and coupled temporal-spatial behavior of triggered earth- quakes, potentially key diagnostics,<br />
are not well constrained.<br />
2c. Lowered thresholds for detecting aseismic and infraseismic transients, and improved methods for separating<br />
triggering by aseismic transients from triggering by other earthquakes.<br />
2d. Development of a Community Stress Model (CSM) for Southern California, based on merging information from<br />
borehole measurements, focal mechanisms, paleoslip indicators, observations of damage, topographic loading,<br />
geodynamic and earthquake-cycle modeling, and induced seismicity. We will use seismicity to constrain CSM and<br />
investigate how stress may control earthquake clustering and triggering. We plan to collaborate with other<br />
<strong>org</strong>anizations in fault-drilling projects for in situ hypothesis testing of stress levels.<br />
2e. Development of physics-based earthquake simulators that can unify short-term clustering statistics with longterm<br />
renewal statistics, including the quasi-static simulators that incorporate laboratory- based nucleation models.<br />
2f. Better understanding of induced seismicity, specifically induced by geothermal power production in the Salton<br />
Sea area, which warrant study as potential hazards. Recent research suggests that microseismicity in the geothermal<br />
fields near the Brawley seismic zone may affect and be affected by seismicity on tectonic faults at these distances.<br />
3. Evolution of fault resistance during seismic slip: scale-appropriate laws for rupture modeling<br />
Priorities and Requirements<br />
3a. Laboratory experiments on fault materials under appropriate confining stresses, temperatures, and fluid presence<br />
through targeted experiments in collaboration with rock mechanics laboratories.<br />
3b. Search for geological, geochemical, paleotemperature, and hydrological indicators of specific resis- tance<br />
mechanisms that can be measured in the field. In particular, we will look for evidence of ther- mal decomposition in<br />
exhumed fault zones.<br />
3c. Theoretical and numerical modeling of specific fault resistance mechanisms for seismic radiation and rupture<br />
propagation, including interaction with fault roughness and damage-zone properties. At the scale of meters to<br />
hundreds of meters, the behavior of the near-fault layer with evolving damage may have to be included in the fault<br />
constitutive relations.<br />
3d. Development of parameterized fault rheologies suitable for coarse-grained numerical modeling of rupture<br />
dynamics and for simulations of earthquake cycles on interacting fault systems. Currently, the constitutive laws for<br />
co-seismic slip are often represented as complex coupled systems of partial differential equations, contain slip scales<br />
of the order of microns to millimeters, and hence allow de- tailed simulations of only small fault stretches (Fig. 3.8).<br />
3e. Dynamic rupture modeling to constrain stress levels along major faults, explain the heat-flow para- dox, and<br />
understand extreme slip localization and the dynamics of self-healing ruptures. We will use improved seismic slip<br />
inversions to constrain the local rupture durations and evolution of fault friction. We will collaborate with other<br />
<strong>org</strong>anizations in fault-drilling projects to measure temperature on faults before and after earthquakes and thus<br />
constrain co-seismic resistance.<br />
3f. Development of earthquake simulators that can incorporate realistic models of fault-resistance evolution during<br />
the earthquake cycle.<br />
4. Structure and evolution of fault zones and systems: relation to earthquake physics<br />
Priorities and Requirements<br />
4a. Establishment of special fault study areas for detailed geologic, seismic, geodetic, and hydrologic investigations of<br />
fault complexities<br />
4b. Investigations of along-strike variations in fault roughness and complexity as well as the degree of localization<br />
and damage perpendicular to the fault.<br />
2011 <strong>SCEC</strong> <strong>Annual</strong> <strong>Meeting</strong> | 107
Draft 2012 Science Plan<br />
4c. Improvements to the CFM using better mapping, including lidar, and precise earthquake relocations. We will also<br />
extend the CFM to include spatial uncertainties and stochastic descriptions of fault heterogeneity.<br />
4d. Use of special fault study areas to model stress heterogeneities both deterministically and stochastically. We will<br />
integrate the results of these special studies into the CSM.<br />
4e. Use of earthquake simulators and other modeling tools, together with the CFM and CSM, to quantify how largescale<br />
fault system complexities govern the probabilities of large earthquakes and rupture sequences.<br />
5. Causes and effects of transient deformations: slow slip events and tectonic tremor<br />
Priorities and Requirements<br />
5a. Improvement of detection and mapping of the distribution of tremor across southern California by applying<br />
better instrumentation and signal-processing techniques to data collected in the special study areas, including the<br />
Cholame segment of the San Andreas fault (Area A of Fig. 3.12), where the tectonic tremor was first identified in<br />
California and the southern termination of the San Andreas fault near Bombay Beach, which is the locus of an intense<br />
swarm activity.<br />
5b. Application of geodetic detectors to the search for aseismic transients across southern California. We will use the<br />
CGM as the time-dependent geodetic reference frame for detecting geodetic anomalies.<br />
5c. Collaboration with rock mechanics laboratories on laboratory experiments to understand the mechanisms of slow<br />
slip and tremor.<br />
5d. Development of physics-based models of slow slip and tectonic tremor. We will constrain these models using<br />
features of tremor occurrence and its relationship to seismicity, geodetic deformation, and tectonic environment, as<br />
well as laboratory data.<br />
5e. Use of physics-based models to understand how slow slip events and tremor activity affect earthquake<br />
probabilities in Southern California.<br />
6. Seismic wave generation and scattering: prediction of strong ground motions<br />
Priorities and Requirements<br />
6a. Development of a statewide anelastic Community Velocity Model (CVM) that can be iteratively refined through<br />
3D waveform tomography. We will extend current methods of full-3D tomography to include ambient-noise data<br />
and to estimate seismic attenuation, and we will develop methods for estimating and representing CVM<br />
uncertainties.<br />
6b. Modeling of ruptures that includes realistic dynamic weakening mechanisms, off-fault plastic deformation, and is<br />
constrained by source inversions. The priority is to produce physically consistent source models for broadband<br />
ground motion simulation. An important issue is how to treat multiscale processes; specifically, does off-fault<br />
plasticity regularize the Lorentzian scale collapse associated with strong dynamic weakening? If not, how can<br />
adaptive meshing strategies be most effectively used to make full-physics simulations feasible?<br />
6c. Develop stochastic representations of small-scale velocity and attenuation structure in the CVM for use in<br />
modeling high-frequency (> 1 Hz) ground motions. We will test the stochastic models with seismic and borehole<br />
logging data and evaluate their transportability to regions of comparable geology.<br />
6d. Measure earthquakes with unprecedented station density using emerging sensor technologies (e.g., MEMS). The<br />
<strong>SCEC</strong> Portable Broadband Instrument Center will work with IRIS to make large portable arrays available for<br />
aftershock and flexible array studies.<br />
6e. Collaborate with the engineering community in validation of ground motion simulations. We will establish<br />
confidence in the simulation-based predictions by continuing to work with engineers in validating the simulations<br />
against empirical attenuation models and exploring coherency and other standard engineering measures of ground<br />
motion properties.<br />
VIII. Disciplinary Activities<br />
The Center will sustain disciplinary science through standing committees in seismology, geodesy, and geology. These<br />
committees will be responsible for planning and coordinating disciplinary activities relevant to the <strong>SCEC</strong> science plan, and<br />
they will make recommendations to the <strong>SCEC</strong> Planning Committee regarding the support of disciplinary infrastructure. Highpriority<br />
disciplinary objectives include the following tasks:<br />
108 | Southern California Earthquake Center
A. Seismology<br />
Draft 2012 Science Plan<br />
Objectives. The objectives of the Seismology group are to gather data on the range of seismic phenomena observed in<br />
southern California and to integrate these data into physics-based models of fault slip. Of particular interest are proposals that<br />
foster innovations in network deployments, data collection, real-time research tools, and data processing. Proposals that<br />
provide community products that support one or more of the <strong>SCEC</strong>4 goals or those that include collaboration with network<br />
operators in Southern California are especially encouraged. Proposers should consider the <strong>SCEC</strong> resources available including<br />
the Southern California Earthquake Data Center (SCEDC) that provides extensive data on Southern California earthquakes as<br />
well as crustal and fault structure, the network of <strong>SCEC</strong> funded borehole instruments that record high quality reference<br />
ground motions, and the pool of portable instruments that is operated in support of targeted deployments or aftershock<br />
response.<br />
Research Strategies. Examples of research strategies that support the objectives above include: Enhancement and continued<br />
operation of the SCEDC and other existing <strong>SCEC</strong> facilities particularly the near-real-time availability of earthquake data from<br />
SCEDC and automated access. Real-time processing of network data such as improving the estimation of source parameters in<br />
relation to known and unknown faults, especially evaluation of the short term evolution of earthquake sequences and realtime<br />
stress perturbations on nearby major fault segments. Enhance or add new capabilities to existing earthquake early<br />
warning (EEW) systems or provide new EEW algorithms. Develop real-time finite source models constrained by incoming<br />
seismic and GPS data to estimate evolution of the slip function and potentially damaging ground shaking. Advance<br />
innovative and practical strategies for densification of seismic instrumentation, including borehole instrumentation, in<br />
Southern California and develop innovative algorithms to utilize data from these networks. Develop metadata, archival and<br />
distribution models for these semi-mobile networks. Develop innovative new methods to search for unusual signals using<br />
combined seismic, GPS, and borehole strainmeter data; collaborations with EarthScope or other network operators are<br />
encouraged. Investigate near-fault crustal properties, evaluate fault structural complexity, and develop constraints on crustal<br />
structure and state of stress. Collaborations, for instance with the ANSS and NEES projects, that would augment existing and<br />
planned network stations with downhole and surface instrumentation to assess site response, nonlinear effects, and the<br />
ground coupling of built structures. Preliminary design and data collection to seed future passive and active experiments such<br />
as dense array measurements of basin structure and large earthquake properties, OBS deployments, and deep basement<br />
borehole studies.<br />
Priorities for Seismology in 2012.<br />
1. Tremor. Tremor has been observed on several faults in California, yet tremor does not appear to be ubiquitous. We<br />
seek proposals that explore the distribution and source characteristics of tremor in California and those that explore<br />
the conditions necessary for the generation of seismically observable tremor.<br />
2. Low-cost seismic network data utilization and archiving. Several groups are developing seismic networks that<br />
use low-cost MEMS accelerometers. We seek proposals that would address development of seismological algorithms<br />
to utilize data from these networks in innovative ways. We also seek proposals that would develop metadata and<br />
archiving models for these new semi-mobile networks, as well as archive and serve these data to the <strong>SCEC</strong> user<br />
community.<br />
3. The 2010 M7.2 El Mayor-Cucapah Earthquake Sequence. The El Mayor sequence ruptured for a distance of more<br />
than 120 km, and large data sets were recorded by the SCSN, RESNOM, portable temporary networks, and GPS<br />
networks. Proposals that seek to analyze these data and other relevant data sets in the context of <strong>SCEC</strong> research<br />
priorities are welcome.<br />
B. Tectonic Geodesy<br />
Tectonic Geodesy activities in <strong>SCEC</strong>4 will focus on data collection and analysis that contribute to improved earthquake<br />
response and to a better understanding of fault loading and stress transfer, the causes and effects of transient deformation, and<br />
the structure and evolution of fault zones and systems. The following are research strategies aimed at meeting these broad<br />
objectives:<br />
Contribute to the development of a Community Geodetic Model (CGM).<br />
2011 <strong>SCEC</strong> <strong>Annual</strong> <strong>Meeting</strong> | 109
Draft 2012 Science Plan<br />
The goal of this effort is to develop a time-dependent geodetic data product for southern California that leverages the<br />
complementary nature of GPS and InSAR time series data. The resulting product will consist of well-constrained,<br />
temporally and spatially dense horizontal and vertical displacement time series that can be used in meeting a variety<br />
of <strong>SCEC</strong>4 objectives. This effort will require development of optimal methods for combining GPS and InSAR data,<br />
mitigating hydrologic/anthropogenic signals, incorporating new data, and accounting for earthquake effects as<br />
needed.<br />
Data collection and analysis designed to address specific questions regarding geodetic/geologic slip rate<br />
discrepancies, to assess the role of lower crust/upper mantle processes in driving fault loading, to constrain more<br />
physically-realistic deformation models, and to provide input to the development of Community Stress Models are<br />
also encouraged, as are studies that pursue integrated use of geodetic, geologic, seismic, and other observations<br />
targeting special fault study areas. Proposals for the development of new data products or collection of new data<br />
should explicitly motivate the need for such efforts and state how the resulting data or products will be used.<br />
Resulting data should be provided for inclusion in the CGM. In compliance with <strong>SCEC</strong>'s data policy, data collected<br />
with <strong>SCEC</strong> funding must be made publically-available upon collection by archiving at an appropriate data center<br />
(e.g., UNAVCO).<br />
Improve our understanding of the processes underlying detected transient deformation signals and/or their seismic<br />
hazard implications through data collection and development of new analysis tools.<br />
Work that advances methods for near-real-time transient detection and applies these algorithms within the <strong>SCEC</strong><br />
transient detection testing framework to search for transient deformation in southern California is encouraged.<br />
Approaches that can be automated or semi-automated are the highest priority, as is their inclusion in the testing<br />
framework now in place at <strong>SCEC</strong>. Extension of methods to include InSAR and strainmeter data and, when available,<br />
the CGM is also a priority.<br />
Targeted collection and analysis of all types of geodetic data to constrain physics-based models of slow slip and<br />
tremor are also encouraged.<br />
Develop and apply algorithms that use real-time high-rate GPS data in concert with seismic data for improved<br />
earthquake response.<br />
C. Earthquake Geology<br />
Objectives. The Earthquake Geology Disciplinary Group promotes studies of the geologic record of the Southern California<br />
natural laboratory that advance <strong>SCEC</strong> science. Its primary focus is on the Late Quaternary record of faulting and ground<br />
motion, including data gathering in response to major earthquakes. Geologic observations provide important contributions,<br />
either directly or indirectly, to all six of the fundamental problems in earthquake physics identified in the <strong>SCEC</strong>4 proposal.<br />
Earthquake Geology also fosters research activities motivated by outstanding seismic hazard issues, understanding of the<br />
structural framework and earthquake history of special fault study areas (see fundamental problem 4), or will contribute<br />
significant information to the statewide Unified Structural Representation. Collaborative proposals that cut across disciplinary<br />
boundaries are especially competitive.<br />
Example Research Strategies<br />
• Gathering well-constrained slip-rates on the southern California fault system, with emphasis on major structures<br />
(Problem 1).<br />
• Mapping and analysis of fault-zone properties where the seismogenic zone or brittle-ductile transition has been<br />
exhumed (Problems 1.a; 3.b).<br />
• Paleoseismic documentation of earthquake ages and displacements, with emphasis on long paleoseismic histories,<br />
slip-per-event, and slip-rate histories, including a coordinated effort to develop slip rates and slip-per-event history<br />
of southern San Andreas fault system (Problem 2.a, in collaboration with the SoSAFE focus group).<br />
• Studies to improve understanding of special fault study areas (Problem 4.a) or to improve the statewide community<br />
fault model, especially that take advantage of high-resolution topographic data sets to better define fault traces,<br />
spatial uncertainty, and stochastic heterogeneity of fault geometry (Problem 4.c).<br />
110 | Southern California Earthquake Center
Draft 2012 Science Plan<br />
• Quantifying along-strike variations in fault roughness, complexity, strain localization, and damage in relation to the<br />
rupture propagation processes, including evaluation of the investigating the processes and likelihood of multi-fault<br />
ruptures (Problem 4.b).<br />
• Validation of ground motion prediction through analysis and dating of precariously balanced rocks and other<br />
fragile geomorphic features (Problem 6).<br />
Geochronology Infrastructure. The shared geochronology infrastructure supports C-14, optically stimulated luminescence<br />
(OSL), and cosmogenic dating for <strong>SCEC</strong>-sponsored research. The purpose of shared geochronology infrastructure is to allow<br />
flexibility in the number and type of dates applied to each <strong>SCEC</strong>-funded project as investigations proceed. Investigators<br />
requesting geochronology support should clearly state in their proposal an estimate of the number and type of dates required.<br />
For C-14 specify if sample preparation will take place at a location other than the designated laboratory. For cosmogenic<br />
dating, investigators are required to arrange for sample preparation. Sample preparation costs must be included in the<br />
proposal budget unless preparation has been pre-arranged with one of the laboratories listed. Investigators are strongly<br />
encouraged to contact the investigators at the collaborating laboratories prior to proposal submission. Currently, <strong>SCEC</strong><br />
geochronology has established relationships with the following laboratories:<br />
• C-14: University of California at Irvine (John Southon, jsouthon@uci.edu) and Lawrence Livermore National<br />
Laboratory (Tom Guilderson, tguilderson@llnl.gov).<br />
• OSL: University of Cincinnati (Lewis Owen, lewis.owen@uc.edu) and Utah State University (Tammy Rittenour,<br />
tammy.rittenour@usu.edu)<br />
• Cosmogenic: Lawrence Livermore National Laboratory (Dylan Rood, rood5@llnl.gov).<br />
Investigators may alternatively request support for geochronology outside of the infrastructure proposal for methods not<br />
listed here or if justified on a cost-basis. These outside requests must be included in the individual proposal budget. Please<br />
direct questions regarding geochronology infrastructure to the Earthquake Geology group leader, Mike Oskin<br />
(meoskin@ucdavis.edu).<br />
Data Reporting Requirements. Studies under Earthquake Geology gather diverse data that are at times challenging to<br />
consistently archive per NSF data reporting requirements. Under <strong>SCEC</strong>4, PIs will be required to provide full reporting of their<br />
geochronology samples, including raw data, interpreted age, and geographic/stratigraphic/geomorphic context (what was<br />
dated?). This reporting requirement will be coordinated with the geochronology infrastructure program. A priority at the<br />
outset of <strong>SCEC</strong>4 is to do define additional, achievable goals for geology data reporting to be followed by Earthquake Geology<br />
community.<br />
Priorities for Earthquake Geology in 2012<br />
• Establishment of special fault study areas and formulation of research strategies for these sites<br />
• Prioritization of research objectives, especially with respect to SoSAFE focus group goals, targets for slip-rate studies,<br />
and mechanisms to achieve progress on exhumed fault-zone problems.<br />
• Defining consistent and acheivable data reporting requirements for Earthquake Geology in <strong>SCEC</strong>4<br />
D. Computational Science<br />
Objectives. The Computational Science group promotes the use of advanced numerical modeling techniques and high<br />
performance computing (HPC) to address the emerging needs of <strong>SCEC</strong> users and application community on HPC platforms.<br />
The group works with <strong>SCEC</strong> scientists across a wide range of topics to take advantage of rapidly changing computer<br />
architectures and algorithms. It also engages and coordinates with HPC labs/centers as well as the vendor community in<br />
crosscutting efforts enabling <strong>SCEC</strong> petascale computing milestones. The group encourages research using national<br />
supercomputing resources, and supports students from both geoscience and computer science backgrounds to develop their<br />
skills in the area.<br />
Research Strategies. Examples of research strategies that support the objectives above include:<br />
1. Assist modelers with porting and optimizing codes on new architectures.<br />
2011 <strong>SCEC</strong> <strong>Annual</strong> <strong>Meeting</strong> | 111
Draft 2012 Science Plan<br />
2. Evaluate novel algorithms for earthquake simulation, particularly those that either improve efficiency and accuracy<br />
or expand the class of problems that can be solved (e.g., adaptive mesh refinement).<br />
3. Support optimization of earthquake simulators that can resolve the faulting processes across the range of scales<br />
required to investigate stress-mediated fault interaction, generate synthetic seismicity catalogs, and assess the<br />
viability of earthquake rupture forecasts.<br />
4. Foster and help coordinate a research and development effort utilizing advanced techniques for addressing<br />
accelerating technologies such as hybrid MPI/OpenMP, MPI/CUDA, PGAS, and auto-tuning; and preparing the<br />
community for sea changes in architecture towards exascale computing.<br />
5. Support development of a community model framework for managing I/O, data repositories, workflow and<br />
management, analysis/visualization tools, reliability and resilience capabilities.<br />
6. Identify and develop the necessary tools for data-intensive computing, including but not limited to 3D tomography,<br />
cross-correlation algorithms used in ambient noise seismology, and other signal processing techniques used, for<br />
example, to search for tectonic tremor.<br />
7. Provide coordinated support to the community on large resource allocation proposals.<br />
8. Participate in major CME projects.<br />
Key Problems in Computational Science<br />
1. Seismic wave propagation<br />
• Validate <strong>SCEC</strong> community velocity models.<br />
• Develop high-frequency simulation methods and investigate the upper frequency limit of deterministic ground<br />
motions.<br />
• Extend existing simulation methodologies to a set of stochastic wavefield simulation codes that can extend the<br />
deterministic calculations to frequencies as high as 20 Hz, providing with the capability to synthesize<br />
“broadband” seismograms.<br />
2. Tomography<br />
• Assimilate regional waveform data into the <strong>SCEC</strong> community velocity models.<br />
3. Rupture dynamics<br />
• Evaluate proposed fault weakening mechanisms in large-scale earthquake simulations, determine if small-scale<br />
physics is essential or irrelevant, and determine if friction law parameters can be artificially enhanced without<br />
compromising ground motion predictions.<br />
• Evaluate different representations of source complexity, including stress heterogeneity, variability in frictional<br />
properties, and fault geometrical complexity.<br />
4. Scenario earthquake modeling<br />
• Model a suite of scenario ruptures, incorporating material properties and fault geometries from the unified<br />
structural representation projects.<br />
• Isolate causes of enhanced ground motion using adjoint-based sensitivity methods.<br />
5. Engineering applications<br />
• Facilitate the “rupture-to-rafters” modeling capability to transform earthquake risk management into a CS&E<br />
discipline.<br />
112 | Southern California Earthquake Center
IX. Interdisciplinary Focus Areas<br />
Draft 2012 Science Plan<br />
Interdisciplinary research will be <strong>org</strong>anized into seven science focus areas: 1) Unified Structural Representation (USR), 2) Fault<br />
and Rupture Mechanics (FARM), 3) Stress and Deformation Over Time (SDOT), 4) Earthquake Forecasting and Predictability<br />
(EFP), 5) Ground Motion Prediction (GMP), 6) Southern San Andreas Fault Evaluation and 7) Earthquake Engineering<br />
Interface (EEII).<br />
High-priority objectives are listed below for each of the seven interdisciplinary focus areas. Collaboration within and<br />
across focus areas is strongly encouraged.<br />
A. Unified Structural Representation (USR)<br />
The Unified Structural Representation group develops three-dimensional models of active faults and earth structure (velocity,<br />
density, attenuation, etc.) for use in fault-system analysis, ground-motion prediction, and hazard assessment. This year’s<br />
efforts will focus on (1) making improvements to existing community models (CVM, CFM) that will facilitate their uses in<br />
<strong>SCEC</strong> science, education, and post-earthquake response planning and (2) expanding into a new area of emphasis by<br />
developing methods to represent smaller scale features, such as the detailed representations needed for the special fault study<br />
areas and stochastic variations of seismic velocities and attenuation structure.<br />
• Community Velocity Model (CVM). Improve the current <strong>SCEC</strong> CVMs, with emphasis on more accurate<br />
representations of Vp, Vs, density, attenuation, and basin structure. Generate improved mantle Vp and Vs models, as<br />
well as more accurate descriptions of near-surface properties that can be incorporated into the models' geotechnical<br />
layers. Perform 3D waveform tomographic inversions and ambient noise analysis for evaluating and improving the<br />
CVMs. Develop and apply procedures (i.e., goodness-of-fit measures) for evaluating the existing and future models<br />
with data (e.g., waveforms, gravity) to distinguish alternative representations and quantify model uncertainties;<br />
apply these methods for well-recorded earthquakes in southern California to delineate areas where CVM updates are<br />
needed. Develop databases, models, and model building tools that will help facilitate expansion of the CVMs to<br />
statewide and plate-boundary scale velocity representations. These efforts should be coordinated with the <strong>SCEC</strong><br />
CME special project.<br />
• Community Fault Model (CFM). Improve and evaluate the CFM, placing emphasis on defining the geometry of<br />
major faults that are incompletely, or inaccurately, represented in the current model. Extend the CFM to include<br />
spatial uncertainties and stochastic descriptions of fault heterogeneity. Evaluate the CFM with data (e.g., seismicity,<br />
seismic reflection profiles, geodetic displacement fields) to distinguish alternative fault models. Evaluate the new<br />
statewide fault model (SCFM), and update the CFM-R (rectilinear fault model) to reflect improvements in the CFM.<br />
• Unified Structural Representation (USR). Develop better IT mechanisms for delivering the USR, particularly the<br />
CVM parameters and information about the model's structural components, to the user community for use in<br />
generating and/or parameterizing numerical models. Generate maps of geologic surfaces compatible with the CFM<br />
that may serve as strain markers in crustal deformation modeling and/or property boundaries in future iterations of<br />
the USR.<br />
B. Fault and Rupture Mechanics (FARM)<br />
The primary mission of the Fault and Rupture Mechanics focus group in <strong>SCEC</strong>4 is to develop physics-based models of the<br />
nucleation, propagation, and arrest of dynamic earthquake rupture. We specifically solicit proposals that will contribute to the<br />
six fundamental problems in earthquake physics defined in the <strong>SCEC</strong> 4 proposal and enhance understanding of fault system<br />
behavior through interdisciplinary investigation of special fault study areas. We encourage researchers to address this mission<br />
through field, laboratory, and modeling efforts directed at characterizing and understanding the influence of material<br />
properties, geometric irregularities and heterogeneities in stress and strength over multiple length and time scales, and that<br />
will contribute to our understanding of earthquakes in the Southern California fault system.<br />
Important goals include:<br />
• Investigate the relative importance of different dynamic weakening and fault healing mechanisms, and the slip<br />
and time scales over which these mechanisms operate (3a, 3b, 3c, 3e).<br />
• Determine the properties of fault cores and damage zones (1a, 1b, 3a, 3b, 4a, 4b) and characterize their variability<br />
with depth and along strike (1a, 1b, 4a, 4b) to constrain theoretical and laboratory studies, including width and<br />
2011 <strong>SCEC</strong> <strong>Annual</strong> <strong>Meeting</strong> | 113
Draft 2012 Science Plan<br />
particle composition of actively shearing zones, signatures of temperature variations, extent, origin and<br />
significance of on- and off-fault damage, healing, and poromechanical behavior.<br />
• Determine the relative contribution of on- and off-fault damage to the total earthquake energy budget (3c, 4a, 4b),<br />
and the absolute levels of local and average stress (3e).<br />
• Develop realistic descriptions of heterogeneity in fault geometry, rock properties, stresses and strains, and<br />
tractable ways to incorporate heterogeneity in numerical models of single dynamic rupture events and multiple<br />
earthquake cycles (3e, 4b, 4d, 6b).<br />
• Understand the significance of fault zone characteristics and processes on fault dynamics (3a, 3b, 3c) and<br />
formulate constitutive laws for use in dynamic rupture models (3d).<br />
• Evaluate the relative importance of fault structure, material properties, interseismic healing, and prior seismic<br />
and aseismic slip to earthquake dynamics, in particular, to rupture initiation, propagation, and arrest, and the<br />
resulting ground motions (3c, 3d, 3f).<br />
• Characterize earthquake rupture, fault loading, degree of localization, and constitutive behavior at the base of<br />
and below the seismogenic zone (1a, 1b, 1e, 4a)<br />
• Develop observations of slow slip events and non-volcanic tremors in southern California and understand their<br />
implications for constitutive properties of faults and overall seismic behavior (3a, 5a-5e).<br />
• Assess the predictability of rupture direction and directivity of seismic radiation by collecting and analyzing<br />
field and laboratory data (4a, 4b), and conducting theoretical investigations to understand implications for<br />
strong ground motion.<br />
• Develop physics-based models that can describe spatio-temporal patterns of seismicity (2e, 4e)<br />
C. Stress and Deformation Over Time (SDOT)<br />
The focus of the interdisciplinary working group Stress and Deformation Over Time (SDOT) is to improve our understanding<br />
of how faults are loaded in the context of the wider lithospheric system evolution. SDOT studies these processes on timescales<br />
from 10s of Myr to 10s of yrs, using the structure, geological history, and physical state of the southern California lithosphere<br />
as a natural laboratory. The objective is to tie the present-day state of stress and deformation on crustal-scale faults and the<br />
lithosphere as a whole to the long-term, evolving lithospheric architecture, through 4D geodynamic modeling, constrained by<br />
the widest possible range of observables from disciplines including geodesy, geology, and geophysics.<br />
One long-term goal is to contribute to the development of a physics-based, probabilistic seismic hazard analysis for southern<br />
California by developing and applying system-wide deformation models of lithospheric processes at time-scales down to the<br />
earthquake cycle. These deformation models require a better understanding of a range of fundamental questions such as the<br />
forces loading the lithosphere, the relevant rock rheology, fault constitutive laws, and the spatial distribution of absolute<br />
deviatoric stress. Tied in with this is a quest for better structural constraints, such as on density, Moho depths, thickness of the<br />
seismogenic layer, the geometry of lithosphere-asthenosphere boundary, as well as basin depths, rock type, temperature,<br />
water content, and seismic velocity and anisotropy.<br />
Projects solicited for SDOT include:<br />
A. Contributions to our understanding of geologic inheritance and evolution, and its relation to the three-dimensional<br />
structure and physical properties of present-day crust and lithosphere. Contributions to efforts of building a 4D<br />
model of lithospheric evolution over 10s of Myr for southern California.<br />
B. Seismological imaging of crust, lithosphere and upper mantle using interface and transmission methods with the<br />
goal of characterizing the 3D distribution of isotropic and anisotropic wave speed variations.<br />
C. Contributions to the development of a Community Stress Model (CSM), a set of spatio-temporal (4D) representations<br />
of the stress tensor in the southern California lithosphere.<br />
D. Geodynamic models of southern California dynamics to allow hypothesis testing, including on issues pertaining to<br />
post-seismic deformation, fault friction, rehology of the lithosphere, seismic efficiency, the heat flow paradox, stress<br />
and strain transients (A5), fault system evolution, as tied in with stress and deformation measurements across scales.<br />
114 | Southern California Earthquake Center
Draft 2012 Science Plan<br />
E. Developments of models of interseismic and earthquake cycle deformation, including efforts to estimate slip rates on<br />
southern CA faults, fault geometries at depth, and spatial distribution slip or moment deficits on faults. Assessments<br />
of potential discrepancies of models based on geodetic, geologic, and seismic data (A1, A3).<br />
F. Research into averaging, simplification, and coarse-graining approaches across spatio-temporal scales, addressing<br />
questions such as the appropriate scale for capturing fault interactions, the adequate representation of frictional<br />
behavior and dynamic processes in long-term interaction models, fault roughness, structure, complexity and<br />
uncertainty. Modeling approaches may include analytical or semi-analytical methods, spectral approaches, boundary,<br />
finite, or distinct element methods, and a mix of these (A10, A3), and there are strong links with all other <strong>SCEC</strong><br />
working groups, including FARM, Earthquake Simulators, and USR.<br />
D. Earthquake Forecasting and Predictability (EFP)<br />
We seek proposals that will increase our understanding of how earthquakes might be forecast and whether or not earthquakes<br />
are predictable. Proposals of any type that can assist in this goal will be considered. In particular, proposals are welcome that<br />
will assist in attaining the goals of CSEP (the Collaboratory for the Study of Earthquake Predictability), WGCEP (the Working<br />
Group on California Earthquake Probabilities) and SoSAFE (the Southern San Andreas Evaluation).<br />
For research strategies that plan to utilize CSEP, see the description of CSEP under Special Projects to learn of its capabilities.<br />
In order to increase the number of earthquakes in the data sets, and so decrease the time required to learn about predictability,<br />
proposals are welcome that deal with global data sets and/or include international collaborations. Successful investigators<br />
proposing to utilize CSEP would be funded via core <strong>SCEC</strong> funds to adapt their prediction methodologies to the CSEP<br />
framework, to transfer codes to the externally accessible CSEP computers, and to be sure they function there as intended.<br />
Subsequently, the codes would be moved to the identical externally inaccessible CSEP computers by CSEP staff who will<br />
conduct tests against a variety of data as outlined in the CSEP description. In general, methodologies will be considered<br />
successful only if they do better than null hypotheses that include both time-independent and time-dependent probabilities.<br />
Proposals that can lead to understanding whether or not there exists a physical basis for earthquake predictability are<br />
welcome, even if they are not aimed toward, or are not ready for, tests in CSEP, or are not aimed toward assisting WGCEP or<br />
SoSAFE. We encourage proposals that<br />
• support the development of statistical or physics-based real-time earthquake forecasts,<br />
• utilize and/or evaluate the significance of earthquake simulator results,<br />
• study how to properly characterize various earthquake-related statistical relationships (including the magnitude<br />
distribution, Omori law, aftershock productivity, etc.) for use in testing prediction algorithms,<br />
• focus on understanding patterns of seismicity in time and space, as long as they are aimed toward understanding the<br />
physical basis of some aspect of extended earthquake predictability,<br />
• develop useful measurement/testing methodology that could be incorporated in the CSEP evaluations, including<br />
those that address how to deal with observational errors in data sets.<br />
E. Ground-Motion Prediction (GMP)<br />
The primary goal of the Ground Motion Prediction focus group is to develop and implement physics-based simulation<br />
methodologies that can predict earthquake strong-motion waveforms over the frequency range 0-10 Hz. Source<br />
characterization plays a vital role in ground-motion prediction. At frequencies less than 1 Hz, the methodologies should<br />
deterministically predict the amplitude, phase and waveform of earthquake ground motions using fully three-dimensional<br />
representations of Earth structure, as well as dynamic or dynamically compatible kinematic representations of fault rupture.<br />
At higher frequencies (1-10 Hz), the methodologies should predict the main character of the amplitude, phase and waveform<br />
of the motions using a combination of deterministic and stochastic representations of fault rupture and wave propagation.<br />
Research topics within the Ground-Motion Prediction program include:<br />
2011 <strong>SCEC</strong> <strong>Annual</strong> <strong>Meeting</strong> | 115
Draft 2012 Science Plan<br />
• Developing and/or refining physics-based simulation methodologies, with particular emphasis on high frequency (1-<br />
10 Hz) approaches. This work could include implementation of simulation methodologies onto the Broadband<br />
Simulation Platform (in collaboration with CME).<br />
• Waveform modeling of past earthquakes to validate and/or refine the structure of the Community Velocity Model<br />
(CVM) (in collaboration with USR).<br />
• Incorporation of non-linear models of soil response.<br />
• Development of more realistic implementations of dynamic or kinematic representations of fault rupture. This<br />
research could also include the examination of current source-inversion strategies and development of robust<br />
methods that allow imaging of kinematic and/or dynamic rupture parameters reliably and stably, along with a<br />
rigorous uncertainty assessment.<br />
• Verification (comparison against theoretical predictions) and validation (comparison against observations) of the<br />
simulation methodologies with the objective of being to develop robust and transparent simulation capabilities that<br />
incorporate consistent and accurate representations of the earthquake source and three-dimensional velocity<br />
structure. Close collaboration with the Technical Activity Group (TAG) on Ground Motion Simulation Validation<br />
(GMSV).<br />
It is expected that the products of the Ground-Motion Prediction group will have direct application to seismic hazard analysis,<br />
both in terms of characterizing expected ground-motion levels in future earthquakes, and in terms of directly interfacing with<br />
earthquake engineers in the analysis of built structures. Activities within the Ground Motion Prediction group will be closely<br />
tied to several special projects, including the GMSV TAG, with particular emphasis on addressing ground motion issues<br />
related to seismic hazard and risk (see EEII below).<br />
F. Southern San Andreas Fault Evaluation (SoSAFE)<br />
The <strong>SCEC</strong> Southern San Andreas Fault Evaluation (SoSAFE) Project has become a <strong>SCEC</strong> Interdisciplinary Focus Area in<br />
<strong>SCEC</strong>4 and will continue to increase our knowledge of slip rates, paleo-event chronology, and slip distributions of past<br />
earthquakes, for the past two thousand years on the southern San Andreas fault system. From Parkfield to Bombay Beach, and<br />
including the San Jacinto fault, the objective is to obtain new data to clarify and refine relative hazard assessments for each<br />
potential source of a future 'Big One.'<br />
Past SoSAFE workshops have led to a focused research plan that responds to the needs and opportunities identified across<br />
existing research projects. We strongly welcome proposals that will:<br />
• Help to improve correlation of ruptures over the past 2000 years. This includes short-term (3-5 earthquake) and slipper-event<br />
data from paleoseismic sites, but can include longer-term rates (60,000 years) in some cases.<br />
• Obtain the best possible measurements of geomorphic slip distributions from past earthquakes using field and<br />
LiDAR approaches and to validate the different measures.<br />
• Lengthen existing paleoearthquake chronologies or start new sites in key locations along the fault system.<br />
• Use novel methods for estimating slip rates from geodetic data.<br />
• Investigate methodologies for integrating paleoseismic (including geomorphic measures of slip) and geologic data<br />
into rupture histories. For example, studies may improve or inform interactions between SoSAFE results and scenario<br />
rupture modeling or rupture forecasts.<br />
It is expected that much support will go towards improved dating (e.g., radiocarbon and OSL) of earthquakes so that event<br />
correlations and coefficient of variation in recurrence intervals may be further refined. Requests for geochronology support<br />
(e.g., to date 12 radiocarbon samples) are encouraged and shall be coordinated with Earthquake Geology; a portion of SoSAFE<br />
funds will be contributed towards joint support for dating. We also welcome proposals that seek to add other data (such as<br />
climate variations) to earthquake chronologies, which may be used to improve age control, understanding of the formation of<br />
offset features, or site-to-site correlation of events.<br />
Research will address significant portions of the fault system, and all investigators will agree to collaboratively review one<br />
another’s progress and results. Research by single or multi-investigator teams will be supported to rapidly advance <strong>SCEC</strong><br />
research towards meeting priority scientific objectives related to the mission of the SoSAFE's Interdisciplinary Focus. SoSAFE<br />
116 | Southern California Earthquake Center
Draft 2012 Science Plan<br />
objectives also foster common longer-term research interests and engage in facilitating future collaborations in the broader<br />
context of a decade-long series of interdisciplinary, integrated and complementary studies on the southern San Andreas Fault<br />
system.<br />
The sixth year of SoSAFE will again be funded at $240K by USGS, although sustained support is contingent upon progress<br />
and productivity, effective leveraging of USGS funds with funds from other sources, and the level of available funding and<br />
competing demands within the USGS Multi-Hazards Demonstration Project.<br />
G. Earthquake Engineering Implementation Interface (EEII)<br />
The purpose of the EEII Focus Group is to create and maintain collaborations with research and practicing engineers, much as<br />
the Seismic Hazard and Risk Analysis focus group did in <strong>SCEC</strong>3. These activities may include ground motion simulation<br />
validation, rupture-to-rafters simulations of building response as well as the end-to-end analysis of large-scale, distributed<br />
risk (e.g., ShakeOut-type scenarios). Our goal of impacting engineering practice and large-scale risk assessments require even<br />
broader partnerships with the engineering and risk-modeling communities, which motivates the activities described next.<br />
Technical Activity Group (TAG) on Ground Motion Simulation Validation (GMSV)<br />
A TAG focusing on validation of ground motion simulations has been established to develop and implement testing/rating<br />
methodologies via collaboration between ground motion modelers and engineering users. A 2011 Workshop on this topic<br />
(http://www.scec.<strong>org</strong>/workshops/2011/gmsv/index.html) identified the following initial efforts as potential priority<br />
activities in this area, and proposals on these topics will be reviewed with all other <strong>SCEC</strong> proposals in January of 2012.<br />
• Validation of simulated ground motions for past earthquakes using elastic and inelastic response spectra.<br />
• Automation of the validation tests. In order to facilitate validation of other/future simulations, develop software<br />
modules for the validation of simulated ground motions for past earthquakes in terms of elastic and inelastic<br />
response spectra. Implementation into the <strong>SCEC</strong> Broadband Strong Motion Simulation Platform<br />
(http://scec.usc.edu/research/cme/groups/broadband), and/or use of the OpenSees (Open System for Earthquake<br />
Engineering Simulation) platform (http://peer.berkeley.edu/products/opensees.html) would be viewed positively.<br />
• Validation of simulated ground motions for past earthquakes for multi-degree-of-freedom (MDoF) nonlinear<br />
building systems.<br />
• Compilation of representative structural and geotechnical models and metrics of different types for which the<br />
responses to simulated versus recorded seismograms can be compared.<br />
• Comprehensive analysis and documentation of the sensitivity of simulated ground motions to model input<br />
parameters and their interactions and uncertainties.<br />
• Development of testing and/or rating metrics for simulated ground motions, perhaps considering testing concepts<br />
from the Collaboratory for the Study of Earthquake Predictability (http://www.cseptesting.<strong>org</strong>).<br />
Improved Hazard Representation<br />
• Develop improved hazard models that consider simulation-based earthquake source and wave propagation effects<br />
that are not already well-reflected in observed data. These could include improved methods for incorporating<br />
rupture directivity effects, basin effects, and site effects in the USGS ground motion maps, for example. The<br />
improved models should be incorporated into OpenSHA.<br />
• Use broadband strong motion simulations, possibly in conjunction with recorded ground motions, to develop<br />
ground motion prediction models (or attenuation relations). Broadband simulation methods must be verified (by<br />
comparison with simple test case results) and validated (against recorded strong ground motions) before use in<br />
model development. The verification, validation, and application of simulation methods must be done on the <strong>SCEC</strong><br />
Broadband Simulation Platform. Such developments will contribute to the future NGA-H Project.<br />
• Develop ground motion parameters (or intensity measures), whether scalars or vectors, that enhance the prediction<br />
of structural response and risk.<br />
• Investigate bounds on the median and variability of ground motions for a given earthquake scenario, in coordination<br />
with the Extreme Ground Motion Project.<br />
Ground Motion Time History Simulation<br />
2011 <strong>SCEC</strong> <strong>Annual</strong> <strong>Meeting</strong> | 117
Draft 2012 Science Plan<br />
• Develop acceptance criteria for simulated ground motion time histories to be used in structural response analyses for<br />
building code applications or risk analysis. This relates closely to the GMSV section above.<br />
• Assess the advantages and disadvantages of using simulated time histories in place of recorded time histories as they<br />
relate to the selection, scaling and/or modification of ground motions for building code applications or risk analysis.<br />
• Develop and validate modules for simulation of short period ground motions (< 1 sec) for incorporation in the<br />
Broadband Platform.<br />
• Develop and validate modules for the broadband simulation of ground motion time histories close to large<br />
earthquakes, and for earthquakes in the central and eastern United States, for incorporation in the Broadband<br />
Platform.<br />
Collaboration in Structural Response Analysis<br />
• Tall Buildings and Other Long-Period Structures. Enhance the reliability of simulations of long period ground<br />
motions in the Los Angeles region using refinements in source characterization and seismic velocity models, and<br />
evaluate the impacts of these ground motions on tall buildings and other long-period structures (e.g., bridges,<br />
waterfront structures). Such projects could potentially build on work done in the PEER TBI Project.<br />
• End-to-End Simulation. Interactively identify the sensitivity of structural response to ground motion parameters and<br />
structural parameters through end-to-end simulation. Buildings of particular interest include non-ductile concrete<br />
frame buildings.<br />
• Reference Buildings and Bridges. Participate with PEER investigators in the analysis of reference buildings and<br />
bridges using simulated broadband ground motion time histories. The ground motions of large, rare earthquakes,<br />
which are poorly represented in the NGA strong motion data base, are of special interest. Coordination with PEER<br />
can be done through Yousef Boz<strong>org</strong>nia, yousef@berkeley.edu.<br />
• Earthquake Scenarios. Perform detailed assessments of the results of scenarios such as the ShakeOut exercise, and the<br />
scenarios for which ground motions were generated for the Tall Buildings Initiative (including events on the Puente<br />
Hills, Southern San Andreas, Northern San Andreas and Hayward faults) as they relate to the relationship between<br />
ground motion characteristics and structural response and damage.<br />
Ground Deformation<br />
• Investigate the relationship between input ground motion characteristics and local soil nonlinear response,<br />
liquefaction, lateral spreading, local soil failure, and landslides -- i.e., geotechnical hazards. Investigate hazards due<br />
to surface faulting and to surface deformation caused by subsurface faulting and folding.<br />
Risk Analysis<br />
• Develop improved site/facility-specific and portfolio/regional risk analysis (or loss estimation) techniques and<br />
tools, and incorporate them into the OpenRisk software.<br />
• Use risk analysis software to identify earthquake source and ground motion characteristics that control damage<br />
estimates.<br />
Other Topics<br />
• Proposals for other innovative projects that would further implement <strong>SCEC</strong> information and techniques in seismic<br />
hazard, earthquake engineering, risk analysis, and ultimately loss mitigation, are encouraged.<br />
X. Special Projects and Initiatives<br />
The following are special projects for which <strong>SCEC</strong> has obtained funding beyond the core program. This RFP is not for those<br />
funds, which are committed, rather it is for <strong>SCEC</strong> core funding for research projects that are consonant with these special<br />
projects. This is consistent with <strong>SCEC</strong> policy that requires that special projects be aligned with core <strong>SCEC</strong> goals.<br />
A. Working Group on California Earthquake Probabilities (WGCEP)<br />
Following the 2008 release of the Uniform California Earthquake Rupture Forecast version 2 (UCERF2), the WGCEP is now<br />
working on adding some major enhancements for UCERF3 (due June 2012) and subsequent models. Our primary goals are to<br />
118 | Southern California Earthquake Center
Draft 2012 Science Plan<br />
relax segmentation, add multi-fault ruptures, and include spatial-temporal clustering (earthquake triggering). As the latter<br />
will require robust interoperability with real-time seismicity information, UCERF3 will bring us into the realm of operational<br />
earthquake forecasting (OEF). This model is being developed jointly by <strong>SCEC</strong>, the USGS, and CGS, in close coordination with<br />
the USGS National Seismic Hazard Mapping Program. The following are examples of <strong>SCEC</strong> activities that could make direct<br />
contributions to WGCEP goals:<br />
• Reevaluate fault models in terms of the overall fault inventory, specify more precisely fault endpoints in<br />
relationship to neighboring faults, and examine the likelihood of possible multi-fault ruptures. Help specify the<br />
extent to which faults represent a well-define surface versus a proxy for a braided deformation zone.<br />
• Reevaluate fault slip rates, especially using more sophisticated modeling approaches (e.g., that include GPS data,<br />
generate kinematically consistent results, and perhaps provide off-fault deformation rates as well). This may<br />
include how we map simplified block-model results back onto the more complex fault system.<br />
• Help determine the average along-strike slip distribution of large earthquakes, especially where multiple faults are<br />
involved (e.g., is there reduced slip at fault connections?)<br />
• Help determine the average down-dip slip distribution of large earthquakes (the ultimate source of existing<br />
discrepancies in magnitude-area relationships).<br />
• Contribute to the compilation and interpretation of mean recurrence-interval constraints from paleoseismic data.<br />
• Develop earthquake rate models that relax segmentation and include multi-fault ruptures.<br />
• Develop ways to constrain the spatial distribution of maximum magnitude for background seismicity (for<br />
earthquakes occurring off of the explicitly modeled faults).<br />
• Answer the question of whether every small volume of space exhibits a Gutenberg Richter distribution of<br />
nucleations?<br />
• Develop methods for quantifying elastic-rebound based probabilities in un-segmented fault models.<br />
• Help quantify the amount of slip in the previous event (including variations along strike) on any major faults in<br />
California.<br />
• Develop models for fault-to-fault rupture probabilities, especially given uncertainties in fault endpoints.<br />
• Determine the proper explanation for the apparent post-1906 seismicity-rate reduction (the so-called Empirical<br />
Model of previous WGCEPs). How temporally variable are seismicity rates (e.g., more so than implied by<br />
aftershock statistics)?<br />
• Develop applicable methods for adding spatiotemporal clustering to the model (e.g., based on empirical models<br />
such as ETAS, or derived from physics-based simulators). Are sequence-specific parameters warranted?<br />
• Is there a physical difference between a multi-fault rupture and a separate event that was triggered quickly?<br />
• Develop easily computable hazard or loss metrics that can be used to evaluate and perhaps trim logic-tree branch<br />
weights.<br />
• Develop techniques for down-sampling event sets to enable more efficient hazard and loss calculations.<br />
• Develop novel ways of testing UCERF3, especially ones that can be integrated with CSEP.<br />
Further suggestions and details can be found at http://www.WGCEP.<strong>org</strong>, or by speaking with the project leader (Ned Field:<br />
field@usgs.gov; (626) 644-6435).<br />
B. Collaboratory for the Study of Earthquake Predictability (CSEP)<br />
CSEP is developing a virtual, distributed laboratory—a collaboratory—that supports a wide range of scientific prediction<br />
experiments in multiple regional or global natural laboratories. This earthquake system science approach seeks to provide<br />
answers to the questions: (1) How should scientific prediction experiments be conducted and evaluated? and (2) What is the<br />
intrinsic predictability of the earthquake rupture process? Contributions may include:<br />
2011 <strong>SCEC</strong> <strong>Annual</strong> <strong>Meeting</strong> | 119
Draft 2012 Science Plan<br />
1. Establishing rigorous procedures in controlled environments (testing centers) for registering prediction procedures,<br />
which include the delivery and maintenance of versioned, documented code for making and evaluating predictions<br />
including intercomparisons to evaluate prediction skills;<br />
2. Constructing community-endorsed standards for testing and evaluating probability-based and alarm-based<br />
predictions;<br />
3. Developing hardware facilities and software support to allow individual researchers and groups to participate in<br />
prediction experiments;<br />
4. Providing prediction experiments with access to data sets and monitoring products, authorized by the agencies that<br />
produce them, for use in calibrating and testing algorithms;<br />
5. Intensifying the collaboration between the US and Japan through international projects, and initiating joint efforts<br />
with China;<br />
6. Developing experiments to test basic physical principles of earthquake generation (e.g., models for estimating the<br />
largest possible earthquake on a given fault are important to earthquake scenarios like ShakeOut and to earthquake<br />
hazard models. We seek proposals to develop quantitative tests of such models); and<br />
7. Conducting workshops to facilitate international collaboratories.<br />
A major focus of CSEP is to develop international collaborations between the regional testing centers and to accommodate a<br />
wide-ranging set of prediction experiments involving geographically distributed fault systems in different tectonic<br />
environments.<br />
Special Note. CSEP global travel grants from 2006 to 2010 were funded with a grant from the W. M. Keck Foundation. The<br />
Keck grant ended in early 2011 and future funding for CSEP global travel has not been obtained at the time of the release of<br />
this document.<br />
C. Community Modeling Environment (CME)<br />
The Community Modeling Environment is a <strong>SCEC</strong> special project that develops improved ground motion forecasts by<br />
integrating physics-based earthquake simulation software, observational data, and earth structural models using advanced<br />
computational techniques including high performance computing. CME projects often use results, and integrate work, from<br />
<strong>SCEC</strong> groups including Interdisciplinary Focus Groups Technical Activity Groups.<br />
The <strong>SCEC</strong> research community can contribute research activities to CME by providing scientific or computational capability<br />
that can improve ground motion forecasts. The following paragraphs briefly describe several current CME computational<br />
goals so researchers can propose to develop a needed element that can be integrated into a larger CME calculation.<br />
Examples of CME research requirements include earth structural models, curated data sets to support forecast validation, and<br />
scientific software that simulates physical processes in the earth including dynamic ruptures and wave propagation<br />
simulations.<br />
CME computational-based research projects include three types of forecast evaluation and testing systems; transient detection<br />
and forecast evaluation, earthquake early warning earthquake parameter and ground motion forecast evaluation, and shortterm<br />
earthquake forecast evaluation.<br />
CME is developing ground motion simulations that produce broadband seismograms. These simulation tools include rupture<br />
generators, low frequency wave propagation models, high frequency stochastic models, non-linear site response modules, and<br />
validation capabilities including assembled observational strong motion data sets and waveform-matching goodness of fit<br />
algorithms and information displays.<br />
Ground motion simulation validation computational and <strong>org</strong>anizational tools are needed to establish repeatable validation of<br />
ground motion simulations to engineering standards.<br />
CME is working to improve probabilistic seismic hazard calculations. CME PSHA research requires a high resolution 3D<br />
velocity model for California, a pseudo-dynamic rupture generator capable of generating an extended earthquake rupture<br />
forecast from UCERF3.0, highly-efficient reciprocity-based seismogram calculations, and probabilistic hazard model<br />
information system providing access to calculation results.<br />
120 | Southern California Earthquake Center
D. National Partnerships through EarthScope<br />
Draft 2012 Science Plan<br />
The NSF EarthScope project (http://www.earthscope.<strong>org</strong>) provides unique opportunities to learn about the structure and<br />
dynamics of North America. <strong>SCEC</strong> and the NSF EarthScope program encourage proposals that integrate the goals of the <strong>SCEC</strong><br />
Science Plan with the many overlapping goals of the EarthScope Science Plan. Topics of interest include applying EarthScope<br />
observational resources to <strong>SCEC</strong> science and hazard problems; characterizing the crust and lithosphere of the natural<br />
laboratory of Southern California; exploring stress and deformation over time using EarthScope resources (including high<br />
resolution topography); testing hypothesis and enhancing models of earthquakes, faulting, and the rheology of the<br />
lithosphere; developing innovative contributions to identifying earthquake hazard and community response; and promoting<br />
Earth Science literacy in education and outreach in <strong>SCEC</strong> and EarthScope topic areas. These partnerships should seek to<br />
strengthen the connections across the <strong>org</strong>anizations and leverage <strong>SCEC</strong> and EarthScope resources.<br />
XI. <strong>SCEC</strong> Communication, Education, and Outreach<br />
<strong>SCEC</strong> maintains a Communication, Education, and Outreach (CEO) program with four long-term goals:<br />
• Coordinate productive interactions among a diverse community of <strong>SCEC</strong> scientists and with partners in science,<br />
engineering, risk management, government, business, and education.<br />
• Increase earthquake knowledge and science literacy at all educational levels, including students and the general<br />
public.<br />
• Improve earthquake hazard and risk assessments<br />
• Promote earthquake preparedness, mitigation, and planning for response and recovery.<br />
Short-term objectives are outlined below. These objectives present opportunities for members of the <strong>SCEC</strong> community to<br />
become involved in CEO activities, which are for the most part coordinated by CEO staff. As project support is very limited,<br />
budgets for proposed projects should be on the order of $2,000 to $5,000. Hence proposals that include additional sources of<br />
support (cost-sharing, funding from other <strong>org</strong>anizations, etc.) are highly recommended. Smaller activities can be supported<br />
directly from the CEO budget and do NOT need a full proposal. Those interested in submitting a CEO proposal should first<br />
contact Mark Benthien, associate <strong>SCEC</strong> director for CEO, at 213-740-0323 or benthien@usc.edu. There may be other sources of<br />
funding that can be identified together.<br />
CEO Focus Area Objectives<br />
The theme of the CEO program during <strong>SCEC</strong>4 is Creating an Earthquake and Tsunami Resilient California. CEO will continue<br />
to manage and expand a suite of successful activities along with new initiatives, within four CEO interconnected thrust areas:<br />
1. The Implementation Interface connects <strong>SCEC</strong> scientists with partners in earthquake engineering research, and<br />
communicates with and trains practicing engineers and other professionals.<br />
2. The Public Education and Preparedness thrust area educates people of all ages about earthquakes, and motivates<br />
them to become prepared.<br />
3. The K-14 Earthquake Education Initiative seeks to improve earth science education and school earthquake safety.<br />
4. Finally, the Experiential Learning and Career Advancement program provides research opportunities, networking,<br />
and more to encourage and sustain careers in science and engineering.<br />
These thrust areas present opportunities for members of the <strong>SCEC</strong> community to partner with CEO staff, however project<br />
support is very limited. Limited funding (typically no more than $2000-$5000) may be available as direct payments from <strong>SCEC</strong><br />
(not subcontracts) for materials or activities and typically does not require a formal proposal. For larger activities, joint<br />
proposals with <strong>SCEC</strong> CEO to potential sources are the best approach. Those interested in partnering with <strong>SCEC</strong> CEO on<br />
activities, submitting a joint proposal, or in submitting a CEO proposal to this RFP should first contact Mark Benthien,<br />
associate <strong>SCEC</strong> director for CEO, at 213-740-0323 or benthien@usc.edu.<br />
2011 <strong>SCEC</strong> <strong>Annual</strong> <strong>Meeting</strong> | 121
Posters | GROUP A<br />
Horizon Ballroom & Foyer<br />
Sunday, September 11, 2011<br />
13:00 – 17:00 Poster Set-Up<br />
20:00 – 22:30 Poster Session I<br />
Monday, September 12, 2011<br />
14:30 – 16:00 Poster Session II<br />
16:00 – 21:00 Poster Removal<br />
A-005 TEACHERS USING CONTINUOUS GPS DATA<br />
TO LEARN ABOUT EARTHQUAKES -<br />
SHARING RESEARCH RESULTS IN THE<br />
CLASSROOM THROUGH LESSON STUDY, R.M.<br />
de Groot, S.F. McGill, B. Vargas, R. Ruiz, M. Kline, and<br />
S. Wallace<br />
A-006 CREATIVE WORLD EARTHQUAKE<br />
PREPAREDNESS PROGRAM, M.J. Vanegas, R.M.<br />
de Groot, and M. Barajas<br />
A-007 SHAKEOUT DRILL PLANNING AND<br />
EVALUATION AT CSU FULLERTON: A CASE<br />
STUDY, L.A. Davis, A. Leslie, A. Nguyen, and M.M.<br />
Wood<br />
122 | Southern California Earthquake Center<br />
Poster Presentations: Group A<br />
Communication, Education, Outreach (CEO)<br />
A-008 VISUAL COMMUNICATION DESIGN FOR<br />
SHAKEOUT RESEARCH DISSEMINATION, A.<br />
Nguyen<br />
A-009 QUAKE CATCHER NETWORK (QCN) SEISMIC<br />
SENSOR DEPLOYMENT GAME, D.L. Kilb, A.<br />
Yang, and D. Rohrlick<br />
A-023 CORSSA: COMMUNITY ONLINE RESOURCE<br />
FOR STATISTICAL SEISMICITY ANALYSIS -<br />
STATUS & OUTLOOK, J.D. Zechar, J.L. Hardebeck,<br />
A.J. Michael, M. Naylor, S. Steacy, S. Wiemer, and J.<br />
Zhuang
A-024 VISUALIZING STRUCTURAL RESPONSE AND<br />
SITE AMPLIFICATION USING EARTHQUAKE<br />
DATA RECORDED AT THE NEES@UCSB FIELD<br />
SITES, S.H. Seale, J.H. Steidl, L.B. Seale, and A.<br />
Chourasia<br />
A-025 PRELIMINARY EVALUATION OF THE 2010<br />
SHAKEOUT EARTHQUAKE DRILL, A. Leslie, L.A.<br />
Davis, M.M. Wood, and R. Green<br />
A-026 MAKE YOUR OWN EARTHQUAKE:<br />
CURRICULUM DEVELOPMENT FOR GRADES<br />
6 - 12, J.P. Trudeau, S.E. Allen, and H.E. Pence<br />
A-029 SCIENTIFIC VISUALIZATION IN 4D FOR<br />
EARTHQUAKE RESEARCH, L.H. Kellogg, T.<br />
Bernardin, M.I. Billen, E.S. Cowgill, A.J. Elliott, P.O.<br />
Gold, C.L. Harwood, O. Kreylos, M.E. Oskin, B. Pellett,<br />
D.L. Turcotte, and M.B. Yikilmaz<br />
A-030 PEGASUS WMS: POWERING LARGE SCALE<br />
SCIENCE THROUGH WORKFLOWS, G. Mehta,<br />
K. Vahi, E. Deelman, M. Rynge, S. Callaghan, and P.<br />
Maechling<br />
A-031 AWP-ODC-SGT: WAVE PROPAGATION AND<br />
DYNAMIC RUPTURE SIMULATION<br />
SOFTWARE WITH STRAIN GREEN’S TENSOR<br />
(SGT) CAPABILITIES FOR CYBERSHAKE 2.0, J.<br />
Zhou, S. Callaghan, S. Song, P. Chen, K. Olsen, R.<br />
Graves, P. Small, P. Maechling, Y. Cui, and T. Jordan<br />
A-032 FULL-3D WAVEFORM TOMOGRAPHY FOR<br />
SOUTHERN CALIFORNIA, E. Lee, P. Chen, T.H.<br />
Jordan, P.J. Maechling, M. Denolle, and G.C. Beroza<br />
A-033 THE CLARK CO. PARCEL MAP AND<br />
IMPLICATIONS FOR EARTHQUAKE<br />
HAZARD DEFINITION IN SOUTHERN<br />
NEVADA, J.N. Louie, W. Savran, B. Flinchum, G.<br />
A-035 CISN SHAKEALERT: DEVELOPMENT OF A<br />
PROTOTYPE USER DISPLAY FOR<br />
PROVIDING EARTHQUAKE ALERTS TO END<br />
USERS, M. Boese, K. Solanki, T. Heaton, E. Hauksson,<br />
and the CISN EEW Team<br />
A-036 NEAR REAL-TIME FULL-WAVE CENTROID<br />
MOMENT TENSOR (CMT) INVERSION FOR<br />
GROUND-MOTION FORECAST IN 3D EARTH<br />
STRUCTURE OF SOUTHERN CALIFORNIA, E.<br />
Lee, P. Chen, T.H. Jordan, and P.J. Maechling<br />
Community Modeling Environment (CME)<br />
Earthquake Early Warning (EEW)<br />
GROUP A | Posters<br />
A-027 GPS MONITORING OF THE INLAND EMPIRE<br />
FOR SLIP-RATE MODELING OF SOUTHERN<br />
CALIFORNIA FAULTS: CONTRIBUTIONS<br />
FROM HIGH SCHOOL SCIENCE TEACHERS<br />
AND THEIR STUDENTS, M. Meijer, M. Affadonis,<br />
R. Bennett, W. Butscher, E. Carlson, R. de Groot, S.<br />
Harris, S. McGill, S. Pearson, A. Pennington, T.<br />
Pitruzzello, D. Shafer, J. Spinler, and S. Wallace<br />
A-028 PLATE TECTONICS: A NEWLY COMPLETED<br />
EXHIBIT IN THE SAN BERNARDINO COUNTY<br />
MUSEUM’S HALL OF GEOLOGICAL<br />
WONDERS, K. Springer, E. Scott, and J.C. Sagebiel<br />
Plank, S.K. Pullammanappallil, A. Pancha, and W.K.<br />
Hellmer<br />
A-034 APPLICATION OF ZH RATIO TO THE URBAN<br />
LOS ANGELES REGION FOR SHALLOW S-<br />
WAVE VELOCITY STRUCTURE, T. Hakamata,<br />
T.E. Yano, and T. Tanimoto<br />
A-038 BROADBAND CYBERSHAKE PLATFORM:<br />
SEISMOGRAM SYNTHESIS FOR<br />
BROADBAND PHYSICS-BASED<br />
PROBABILISTIC SEISMIC HAZARD<br />
ANALYSIS, S. Callaghan, P. Maechling, P. Small, K.<br />
Milner, R. Graves, T. H. Jordan, and the CyberShake<br />
Collaboration<br />
A-039 ACCELERATION OF 3D FINITE DIFFERENCE<br />
AWP-ODC FOR SEISMIC SIMULATION ON<br />
GPU FERMI ARCHITECTURE, J. Zhou, Y. Cui,<br />
and D. J. Choi<br />
A-040 A UNIFIED FINITE ELEMENT METHOD FOR<br />
HETEROGENEOUS ELASTIC MEDIA WITH<br />
LOW TO HIGH RATIO OF P- TO S-WAVE<br />
VELOCITIES, H. Karaoglu and J. Bielak<br />
A-037 REAL TIME GEODETIC EARLY WARNING<br />
SYSTEM FOR EARTHQUAKES, H. Tahtinen, Y.<br />
Bock, B.W. Crowell, D. Melgar, and M.B. Squibb<br />
Earthquake Geology / Southern San Andreas Fault Evaluaton (SoSAFE)<br />
A-018 INVESTIGATIONS OF MICROBIAL LIFE IN<br />
THE MUD NEAR THE SALTON SEA,<br />
CALIFORNIA, S.C. Rosove<br />
A-019 HYDROCHEMISTRY OF ACTIVE FAULT<br />
ZONES- SALTON SEA, CA AND NORTHERN<br />
UTAH, K.A. Shervais<br />
2011 <strong>SCEC</strong> <strong>Annual</strong> <strong>Meeting</strong> | 123
Posters | GROUP A<br />
A-020 FRACTURE NETWORK CHARACTERISTICS,<br />
SEALING, AND VELOCITY STRUCTURE OF<br />
AN EXHUMED SEISMIC FAULT ZONE; THE<br />
GOLE LARGHE FAULT ZONE, ITALIAN ALPS,<br />
T.M. Mitchell, S.A. Smith, A. Bistacchi, M. Rempe,<br />
and G. Di Toro<br />
A-021 THE ADVANTAGES OF FIELD WORK, M.M.<br />
Ponce-Zepeda<br />
A-022 SURFACE-EXPOSURE DATING OF SAN<br />
ANDREAS EARTHQUAKES, W.B. Bull<br />
A-117 REMOTE MAPPING OF A LARGE STEPOVER<br />
IN THE 4 APRIL 2010 EL MAYOR CUCAPAH<br />
EQ, A.E. Morelan and M.E. Oskin<br />
A-118 STRUCTURAL CONTROLS ON THE SURFACE<br />
RUPTURE ASSOCIATED WITH THE MW7.2 EL<br />
MAYOR-CUCAPAH EARTHQUAKE OF 4<br />
APRIL 2010: A COMPARATIVE ANALYSIS OF<br />
SCARP ARRAY KINEMATICS, ORIENTATION,<br />
LITHOLOGY AND WIDTH, O.J. Teran, J.M.<br />
Fletcher, T.R. Rockwell, K.W. Hudnut, M.E. Oskin,<br />
S.O. Akciz, A.J. Elliot, P.O. Gold, L. Liu-Zheng, U.R.<br />
Manjarrez, R. Mendoza-Borunda, A.E. Morelan, and<br />
R.M. Spelz<br />
A-119 OPENTOPOGRAPHY: ONLINE ACCESS TO<br />
HIGH-RESOLUTION LIDAR TOPOGRAPHY<br />
DATA AND PROCESSING TOOLS IN<br />
SUPPORT OF NSF EARTH SCIENCE, C.J. Crosby,<br />
V. Nandigam, S. Krishnan, C. Baru, and J.R.<br />
Arrowsmith<br />
A-120 NEAR-FIELD COSEISMIC DEFORMATION<br />
QUANTIFIED FROM DIFFERENTIAL<br />
AIRBORNE LIDAR OF THE EL MAYOR-<br />
CUCAPAH EARTHQUAKE SURFACE<br />
RUPTURE, M.E. Oskin, J.R. Arrowsmith, A.<br />
Hinojosa, A.J. Elliott, O. Teran, J.M. Fletcher, S.<br />
Saripali, and D. Banesh<br />
A-121 METHODS FOR ANALYZING THE EL<br />
MAYOR-CUCAPAH EARTHQUAKE RUPTURE<br />
USING LIDAR DATASETS, D. Banesh, M.E.<br />
Oskin, X. Wang, B. Hamann, and L. Kellogg<br />
A-122 RUPTURE PATTERN OF THE 1892 LAGUNA<br />
SALADA EARTHQUAKE: A PRECURSOR TO<br />
2010 EL MAYOR-CUCAPAH, K. Mueller, T.<br />
Rockwell, O. Teran, J. Fletcher, S. Akciz, and P. Patton<br />
A-123 STRAIN PARTITIONING IN LOS ANGELES,<br />
R.S. Yeats and D. Verdugo<br />
A-124 CHARACTERIZING THE RECENT BEHAVIOR<br />
AND EARTHQUAKE POTENTIAL OF THE<br />
BLIND WESTERN SAN CAYETANO AND<br />
VENTURA FAULT SYSTEMS, L.J. McAuliffe, J.F.<br />
Dolan, J. Hubbard, and J.H. Shaw<br />
A-125 SEISMIC SOURCE CHARACTERIZATION<br />
FOR THE LADWP VAN NORMAN COMPLEX<br />
AND ISSUES TO CONSIDER FOR UCERF3 IN<br />
THE NORTHERN SAN FERNANDO VALLEY,<br />
CA, S. Lindvall, C. Kemp, J. Unruh, and D. O'Connell<br />
124 | Southern California Earthquake Center<br />
A-126 SUB-SURFACE EVIDENCE OF FAULTING<br />
RELATED TO THE COMPTON-LOS<br />
ALAMITOS FAULT AND IMPLICATIONS FOR<br />
STRAIN PARTITIONING IN THE WESTERN<br />
LA BASIN, D.M. Verdugo Madugo and R.S. Yeats<br />
A-127 NEW CHRONOLOGY AND ESTIMATED<br />
RATES OF VERTICAL UPLIFT FOR THE<br />
GAVIOTA COAST RAISES ISSUES RELATED<br />
TO THE EARTHQUAKE HAZARD, E.A. Keller,<br />
D.E. DeVecchio, L.D. Gurrola, and L.A. Owen<br />
A-128 QUATERNARY CONGLOMERATE<br />
DEPOSITION AND IMPLICATIONS ON<br />
FAULT EVOLUTION IN THE OJAI AND<br />
UPPER OJAI VALLEYS, WESTERN<br />
TRANSVERSE RANGES, CA, H.L. McKay and<br />
R.V. Heermance<br />
A-129 COMPILATION OF SLIP IN LAST<br />
EARTHQUAKE DATA FOR HIGH-SLIP RATE<br />
FAULTS IN CALIFORNIA FOR INPUT INTO<br />
SLIP DEPENDENT RUPTURE FORECAST, C.L.<br />
Madden Madugo, J.R. Arrowsmith, D.E. Haddad, J.B.<br />
Salisbury, and R.J. Weldon<br />
A-130 LUMINESCENCE DATING AS A TOOL FOR<br />
ASSESSING THE VARIABILITY OF FAULT<br />
SLIP RATES AND PALEOSEISMIC EVENTS<br />
ON TIMESCALES OF 10 TO 100,000 YEARS, B.J.<br />
Roder, E.J. Rhodes, M.J. Lawson, L. McAuliffe, J.F.<br />
Dolan, and S.F. McGill<br />
A-131 CHARACTERISTICS OF QUARTZ AND<br />
FELDSPAR LUMINESCENCE FROM<br />
SOUTHERN CALIFORNIA, USA:<br />
IMPLICATIONS FOR PALEOSEISMIC AND<br />
FAULT SLIP-RATE STUDIES, M.J. Lawson, B.J.<br />
Roder, D.M. Stang, E.J. Rhodes, L. McAuliffe, J.F.<br />
Dolan, and S.F. McGill<br />
A-132 INVESTIGATION OF THE HECTOR MINE<br />
EARTHQUAKE SURFACE RUPTURE WITH<br />
AIRBORNE LIDAR DATA, T. Chen, D.Z. Zhang,<br />
S. Akciz, and K.W. Hudnut<br />
A-133 PRELIMINARY PALEOSEISMIC RESULTS<br />
FROM THE ECHO PLAYA TRENCH SITE ON<br />
THE CENTRAL GARLOCK FAULT, CHINA<br />
LAKE NAWS, NEAR RIDGECREST, CA, R.D.<br />
Hartleb, C.D. Kemp, A. Lutz, E.K. Frost, and S.C.<br />
Lindvall<br />
A-134 PALEOSEISMIC INVESTIGATION OF THE<br />
SAN GORGONIO PASS FAULT ZONE NEAR<br />
CABEZON, CALIFORNIA, S. Ramzan and J.D.<br />
Yule<br />
A-135 DEPOSITIONAL CONSTRAINTS ON SLIP<br />
ALONG THE SAN ANDREAS FAULT WITHIN<br />
THE EASTERN SAN GORGONIO PASS<br />
REGION, SOUTHERN CALIFORNIA, K.J.<br />
Kendrick, J.C. Matti, S.A. Mahan, G.P. Landis, and<br />
D.P. Miggins<br />
A-136 BUILDING HISTORIES OF FAULT SLIP TO<br />
OBSERVE SECULAR VARIATION IN SLIP, E.<br />
Cowgill, R.D. Gold, P.O. Gold, T. Compton, T.<br />
Bernardin, and R. Westerteiger
A-137 DISCOVERING THE GEOMORPHIC RECORD<br />
OF HOLOCENE SLIP ALONG THE MOJAVE<br />
SECTION OF THE SAN ANDREAS FAULT,<br />
CALIFORNIA, T. Compton, E. Cowgill, R. Gold, K.<br />
Scharer, R. Westerteiger, and T. Bernardin<br />
A-138 OBSERVATIONS OF RECENTLY-EXPOSED<br />
FUMAROLE FIELDS NEAR MULLET ISLAND,<br />
IMPERIAL VALLEY, CALIFORNIA, D.K. Lynch,<br />
K.W. Hudnut, P.M. Adams, and L.S. Bernstein<br />
A-139 EVALUATING THE RELATIONSHIP<br />
BETWEEN LATERAL SLIP AND REPEATED<br />
FOLD DEFORMATION ALONG A<br />
TRANSTENSIVE STEP-OVER ON THE SAN<br />
ANDREAS FAULT AT THE FRAZIER<br />
MOUNTAIN SITE, A.R. Streig and R.J. Weldon<br />
A-140 TRACKING COSMOGENIC 10BE IN<br />
MULTIPLE GRAINSIZES DOWN ALLUVIAL<br />
SYSTEMS IN ACTIVE OROGENS, K.E. McGuire<br />
and R.V. Heermance<br />
A-141 EARTHQUAKE AGES AND DISPLACEMENTS,<br />
FRAZIER MOUNTAIN PALEOSEISMIC SITE,<br />
K.M. Scharer, R.J. Weldon, B.C. Gibson, and A.R.<br />
Streig<br />
A-142 PALEOSEISMOLOGY AND SLIP RATE OF<br />
THE SAN GORGONIO PASS FAULT ZONE AT<br />
MILLARD CANYON: TESTING THE<br />
LIKELIHOOD OF THROUGH-GOING SAN<br />
ANDREAS RUPTURES, J.D. Yule and P.L.<br />
McBurnett<br />
A-143 MOVIES OF SEISMIC WAVE PROPAGATION<br />
THROUGH THE IMPERIAL AND<br />
COACHELLA VALLEYS, SOUTHERN<br />
CALIFORNIA, M. Barba and J.M. Stock<br />
A-144 USE OF INTEGRATED MASTER<br />
MULTISPECTRAL IMAGERY AND LIDAR<br />
DEM FOR ACTIVE FAULT DETECTION AND<br />
EVALUATION, F.G. Perez, W.A. Bryant, J.A.<br />
Treiman, C.R. Real, and S.J. Hook<br />
A-145 REVISITING WALLACE CREEK: NEW<br />
RADIOCARBON RESULTS AND SLIP RATE<br />
ESTIMATES OF THE SAN ANDREAS FAULT<br />
IN THE CARRIZO PLAIN, S.O. Akciz, D.E.<br />
Haddad, W. Bohon, L. Mendes, G. Marliyani, B.<br />
Salisbury, T. Sato, L. Grant Ludwig, and J.R.<br />
Arrowsmith<br />
A-073 WHAT’S COOKING? EVALUATING<br />
FRICTIONAL STRESS USING EXTRACTABLE<br />
ORGANIC MATERIAL IN FAULT ZONES, P.J.<br />
Polissar, H.M. Savage, R.E. Sheppard, E.E. Brodsky,<br />
and C.D. Rowe<br />
A-074 HOW DOES DAMAGE AFFECT RUPTURE<br />
PROPAGATION ACROSS A FAULT<br />
STEPOVER? H.M. Savage and M.L. Cooke<br />
Fault Rupture and Mechanics (FARM)<br />
GROUP A | Posters<br />
A-146 STRESS DROP VARIATIONS OF THE SAN<br />
ANDREAS FAULT, MOJAVE SEGMENT,<br />
OVER THE LAST 2000 YEARS, T. Solis and B.<br />
Smith-Konter<br />
A-147 FAULT ZONE ARCHITECTURE, SAN<br />
JACINTO FAULT ZONE, SOUTHERN<br />
CALIFORNIA: EVIDENCE FOR FOCUSED<br />
FLUID FLOW AND HEAT TRANSFER IN THE<br />
SHALLOW CRUST, N.M. Morton, G.H. Girty, and<br />
T.K. Rockwell<br />
A-148 PRELIMINARY PALEOSEISMIC RESULTS<br />
FROM SOUTHERN CLARK FAULT, SAN<br />
JACINTO FAULT ZONE, SOUTHERN<br />
CALIFORNIA; COMPARISON TO THE HOG<br />
LAKE PALEOSEISMIC RECORD, M.T. Buga, T.K.<br />
Rockwell, and J.B. Salisbury<br />
A-149 INTERACTIONS BETWEEN THE CLARK<br />
STRAND OF THE SAN JACINTO FAULT<br />
ZONE AND THE EXTRA-ELMORE FAULT<br />
ARRAYS, S. Janecke and S. Thornock<br />
A-150 TIMING OF LARGE EARTHQUAKES<br />
BETWEEN 400 AD TO PRESENT ALONG THE<br />
CLAREMONT FAULT, NORTHERN SAN<br />
JACINTO FAULT ZONE, FROM MYSTIC LAKE,<br />
CALIFORNIA, N.W. Onderdonk, T.K. Rockwell, S.F.<br />
McGill, and G. Marliyani<br />
A-151 SLIP RATE OF THE NORTHERN SAN<br />
JACINTO FAULT FROM OFFSET<br />
LANDSLIDES IN THE SAN TIMOTEO<br />
BADLANDS, S.F. McGill, L.A. Owen, E.O. Kent,<br />
T.K. Rockwell, and N.W. Onderdonk<br />
A-152 SLIP RATES ON THE SOUTHERN SAN<br />
JACINTO FAULT AND HOLOCENE-LATE<br />
PLEISTOCENE KINEMATICS OF THE<br />
PACIFIC-NORTH AMERICAN PLATE<br />
BOUNDARY, K. Blisniuk, M. Oskin, W. Sharp, T.<br />
Rockwell, and K. Fletcher<br />
A-153 CRUSTAL THICKENING AND STRIKE-SLIP<br />
CONTROLLED GROWTH OF THE<br />
NORTHERN COLOMBIAN ANDES, M.H.<br />
Taylor, G. Veloza, and A. Mora<br />
A-154 SEARCHING FOR A PALEOTSUNAMI<br />
RECORD IN SOUTHERN CALIFORNIA:<br />
LESSON’S FROM THAILAND’S ANDAMAN<br />
COAST, B.P. Rhodes and M.E. Kirby<br />
A-075 THE EFFECTS OF INTERMEDIATE FAULT<br />
SEGMENTS ON RUPTURE BEHAVIOR AND<br />
GROUND MOTION IN STRIKE-SLIP<br />
STEPOVERS, J.C. Lozos, D.D. Oglesby, J.N. Brune,<br />
and K.B. Olsen<br />
A-076 THE EFFECT OF BARRIERS ON SLIP<br />
PARTITIONING IN AN UPWARD<br />
BRANCHING FAULT SYSTEM, J. Tarnowski, D.<br />
Oglesby, and D. Bowman<br />
2011 <strong>SCEC</strong> <strong>Annual</strong> <strong>Meeting</strong> | 125
Posters | GROUP A<br />
A-077 JUMPING RUPTURE DEPENDENCE ON<br />
FRICTION FORMULATIONS AT STRIKE-SLIP<br />
FAULT STEPOVERS, K.J. Ryan and D.D. Oglesby<br />
A-078 DOES THE TEAR FAULT MATTER? Q. Liu, R.J.<br />
Archuleta, and R.B. Smith<br />
A-079 PROPERTIES OF INELASTIC YIELDING<br />
ZONES GENERATED BY IN-PLANE<br />
DYNAMIC RUPTURES, S. Xu, Y. Ben-Zion, and J.-<br />
P. Ampuero<br />
A-080 TETEMOKO: AN ADAPTIVE MESH<br />
REFINEMENT FRAMEWORK FOR DYNAMIC<br />
RUPTURE SIMULATION, J.E. Kozdon and E.M.<br />
Dunham<br />
A-081 ADDITIONAL SHEAR RESISTANCE FROM<br />
FAULT ROUGHNESS AND ITS ROLE IN<br />
DETERMINING STRESS LEVELS ON<br />
MATURE AND IMMATURE FAULTS, Z. Fang<br />
and E.M. Dunham<br />
A-082 CONDITIONS FOR RUPTURE JUMPING TO<br />
THE ADJACENT SEGMENTS – A CASE<br />
STUDY FOR THE 1992 LANDERS<br />
EARTHQUAKE, A.J. Delauder, Z. Fang, Y. Klinger,<br />
and E.M. Dunham<br />
A-083 RECORDING FAULT-ZONE TRAPPED<br />
WAVES FROM AFTERSHOCKS OF THE M7.2<br />
DARFIELD AND M6.3 CHRISTCHURCH<br />
EARTHQUAKE SEQUENCE FOR DOCUMENT<br />
OF SUBSURFACE DAMAGE ZONES, Y-G. Li, G.<br />
Paucale, D. Gravely, J. Cherrington, and M. Alvarez<br />
A-084 A MICROMECHANICS BASED<br />
CONSTITUTIVE MODEL FOR BRITTLE<br />
FAILURE AT HIGH STRAIN RATES, H.S. Bhat,<br />
A.J. Rosakis, and C.G. Sammis<br />
A-085 VARIABILITY OF SEISMIC SOURCE<br />
SPECTRA DERIVED FROM COHESIVE-ZONE<br />
MODELS OF A CIRCULAR RUPTURE<br />
PROPAGATING AT A CONSTANT SPEED, Y.<br />
Kaneko and P.M. Shearer<br />
A-086 3D SIMULATIONS OF DYNAMIC RUPTURE<br />
ON ROUGH FAULTS, Z. Shi and S.M. Day<br />
A-087 FAULT SLICKENLINES, ROUGHNESS AND<br />
INELASTIC DEFORMATION, J.D. Kirkpatrick<br />
and E.E. Brodsky<br />
A-088 THE PERMEABILITY VARIATIONS ON THE<br />
WENCHUAN FAULT MEASURED ON THE<br />
WATER LEVEL RESPONSE TO SOLID EARTH<br />
TIDES, L. Xue, E.E. Brodsky, H. Li, H. Wang, and J.<br />
Pei<br />
A-089 AUTO-ACOUSTIC COMPACTION IN STEADY<br />
SHEAR FLOWS: EXPERIMENTAL EVIDENCE<br />
FOR SUPPRESSION OF SHEAR DILATANCY<br />
BY INTERNAL ACOUSTIC VIBRATION, N.J.<br />
van der Elst and E.E. Brodsky<br />
126 | Southern California Earthquake Center<br />
A-090 TEMPERATURE DEPENDENCE OF<br />
FRICTIONAL HEALING: EXPERIMENTAL<br />
OBSERVATIONS AND NUMERICAL<br />
SIMULATIONS, E.K. Mitchell, Y. Fialko, and K.M.<br />
Brown<br />
A-091 MECHANICAL AND MICROSTRUCTURAL<br />
OBSERVATIONS OF DYNAMIC WEAKENING<br />
IN SMECTITE-RICH SAFOD GOUGE, M.E.<br />
French, H. Kitajima, J.S. Chester, and F.M. Chester<br />
A-092 STRAIN LOCALIZATION DRIVEN BY<br />
THERMAL DECOMPOSITION DURING<br />
SEISMIC SHEAR, J.D. Platt, N. Brantut, and J.R.<br />
Rice<br />
A-093 CAUGHT IN THE ACT: EVIDENCE FOR<br />
SEISMIC ARREST ON NATURAL FRICTION-<br />
MELT-BEARING FAULTS?, W.M. Behr and J.P.<br />
Platt<br />
A-094 THE INFLUENCE OF AMBIENT FAULT<br />
TEMPERATURE ON FLASH-HEATING<br />
BEHAVIOR, F. Passelegue, D.L. Goldsby, T.E. Tullis,<br />
and O. Fabbri<br />
A-095 RATE/STATE FRICTIONAL NUCLEATION<br />
AND DYNAMIC RUPTURE ON LOW-STRESS<br />
FAULTS WITH THERMAL WEAKENING<br />
EFFECTS, S.V. Schmitt, A.M. Bradley, E.M. Dunham,<br />
and P. Segall<br />
A-096 A PHYSICAL MODEL OF THE MW 6<br />
EARTHQUAKE CYCLE AT PARKFIELD, S.<br />
Barbot, N. Lapusta, and J. P. Avouac<br />
A-097 INTERACTION OF FAULT STRENGTH<br />
HETEROGENEITIES AND STRESS<br />
REDISTRIBUTION IN MULTIPLE<br />
EARTHQUAKE CYCLES ON FAULTS WITH<br />
THERMAL PRESSURIZATION, J. Jiang and N.<br />
Lapusta<br />
A-098 ENERGY PARTITION, STRAIN<br />
LOCALIZATION AND THERMAL<br />
WEAKENING IN A MODEL OF SHEARED<br />
GRANULAR MATERIALS, A.E. Elbanna, C. Lieou,<br />
and J. Carlson<br />
A-099 THERMAL FLUID AND FAULT<br />
INTERACTIONS AT THE INTERSECTION OF<br />
TWO FAULTS, AGUA CALIENTE,<br />
CALIFORNIA, R.E. Wood and J.P. Evans<br />
A-100 NUMERICAL SIMULATION OF SLOW SLIP<br />
TRIGGERED TREMOR MIGRATION AND<br />
RAPID TREMOR REVERSALS, Y. Luo and J.P.<br />
Ampuero<br />
A-101 COMPARISON OF SIMULATED SLOW SLIP<br />
EVENTS WITH OBSERVATIONS, H.V. Colella,<br />
J.H. Dieterich, and K.B. Richards-Dinger<br />
A-102 SLIP DEFICITS, RELEASE AND TRANSIENTS<br />
ALONG THE CENTRAL SAF FROM<br />
REPEATING MICROEARTHQUAKES, R.M.<br />
Nadeau, R.C. Turner, and R. Burgmann
A-103 IMPACTS OF STATIC AND DYNAMIC<br />
STRESS CHANGES ON TREMOR AND CREEP<br />
ALONG THE LOWER-CRUSTAL SAN<br />
ANDREAS FAULT, D.R. Shelly, K.M. Johnson, Z.<br />
Peng, D.P. Hill, and C. Aiken<br />
A-104 TRIGGERED NON-VOLCANIC TREMOR<br />
FOLLOWING THE 2011 TOHOKU-OKI<br />
EARTHQUAKE, K. Chao, Z. Peng, D.P. Hill, D.R.<br />
Shelly, B. Enescu, B. Fry, and C. Aiken<br />
A-105 ASSESSMENT OF COSEISMIC SLIP<br />
VARIATION FROM TERRESTRIAL LIDAR<br />
SCANS OF THE EL MAYOR-CUCAPAH<br />
SURFACE RUPTURE, P.O. Gold, A.J. Elliott, M.E.<br />
Oskin, M.H. Taylor, A. Hinojosa, R. Styron, O.<br />
Kreylos, T. Bernardin, E. Cowgill, and A.J. Herrs<br />
A-106 A SEQUENCE OF DISTINCT DYNAMIC<br />
RUPTURES IN THE EARLY STAGE OF THE<br />
2011 TOHOKU EARTHQUAKE, T. Uchide, H. Yao,<br />
and P.M. Shearer<br />
A-107 DYNAMIC TRIGGERING EVENTS IN HIDA<br />
REGION BY THE P WAVE FROM THE 2011<br />
TOHOKU EARTHQUAKE, T. Uchide<br />
A-108 SHAKING AND FLOODING BY THE<br />
TOHOKU-OKI EARTHQUAKE, D. Helmberger, S.<br />
Wei, J.P. Avouac, H. Kanamori, and J. Jiang<br />
A-109 EXPLORING PHYSICAL CONDITIONS THAT<br />
CONTROL THE 2011 MW 9.0 TOHOKU-OKI<br />
EARTHQUAKE RUPTURE AND SEISMIC<br />
RADIATIONS, B. Duan<br />
A-041 SURFACE DEFORMATION AND SLIP<br />
DISTRIBUTION OF THE 1994 NORTHRIDGE<br />
EARTHQUAKE DETERMINED FROM INSAR,<br />
C.M. Severson, G.J. Funning, and S.T. Marshall<br />
A-042 IMAGING COSEISMIC SURFACE<br />
DEFORMATION AND DAMAGE USING SAR<br />
AND GPS: RESULTS FROM ARIA-EQ FROM<br />
2011 M9.0 TOHOKU-OKI AND M6.3<br />
CHRISTCHURCH EARTHQUAKES, S.E. Owen,<br />
S.H. Yun, A. Moore, E. Fielding, P. Agram, F. Webb,<br />
M. Simons, P. Rosen, J. Cruz, and H. Hua<br />
A-043 SHARPENED VIEWS OF THE 2011 TOHOKU-<br />
OKI EARTHQUAKE FROM SPARSITY<br />
BASED OPTIMIZATION, E.L. Evans and B.J.<br />
Meade<br />
A-044 SURFACE RUPTURE AND SLIP VARIATION<br />
INDUCED BY THE 2010 EL MAYOR –<br />
CUCAPAH EARTHQUAKE, BAJA<br />
CALIFORNIA, QUANTIFIED USING COSI-<br />
CORR ANALYSIS ON PRE- AND POST-<br />
EARTHQUAKE LIDAR ACQUISITIONS, S.<br />
Leprince, K.W. Hudnut, S. Akciz, A. Hinojosa Corona,<br />
and J.M. Fletcher<br />
Tectonic Geodesy<br />
GROUP A | Posters<br />
A-110 THREE DIMENSIONAL ELASTIC RESPONSE<br />
OF COMPLIANT FAULT ZONES TO NEARBY<br />
EARTHQUAKES: A THEORETIC STUDY, J.<br />
Kang and B. Duan<br />
A-111 ELASTOSTATIC SOLUTIONS FOR REALISTIC<br />
SLIP AND STRESS AROUND MODE II AND<br />
III CRACKS, V.R. Lambert, S. Barbot, and J. Avouac<br />
A-112 IBEM3D: A REMOTE STRESS INVERSION<br />
PROGRAM HONORING MECHANICAL<br />
RELATIONSHIPS BETWEEN STRESS AND<br />
FAULT GEOMETRY, E.H. Madden, F. Maerten,<br />
and D.D. Pollard<br />
A-113 PROPERTIES OF RUPTURE PULSES INDUCED<br />
BY DAMAGED FAULT ZONES, Y. Huang and J.P.<br />
Ampuero<br />
A-114 DYNAMIC RUPTURE SIMULATION WITH AN<br />
UNSTRUCTURED 3D SPECTRAL ELEMENT<br />
METHOD, P. Galvez, J.-P. Ampuero, L.A. Dalguer,<br />
and T. Nissen-Meyer<br />
A-115 THE <strong>SCEC</strong>-USGS DYNAMIC EARTHQUAKE<br />
RUPTURE CODE VERIFICATION EXERCISE,<br />
R.A. Harris, M. Barall, R. Archuleta, B. Aagaard, J.P.<br />
Ampuero, D.J. Andrews, V. Cruz-Atienza, L. Dalguer,<br />
S. Day, N. DeDontney, B. Duan, E. Dunham, A.A.<br />
Gabriel, P. Galvez, Y. Kaneko, Y. Kase, J. Kozdon, N.<br />
Lapusta, S. Ma, P.M. Mai, H. Noda, D. Oglesby, K.<br />
Olsen, and S. Somala<br />
A-116 REGIONAL BROADBAND WAVEFORM<br />
MODELING USING UPGOING AND<br />
DOWNGOING WAVE FIELDS, S. Wei and D.<br />
Helmberger<br />
A-045 INTERSEISMIC, COSEISMIC AND POST-<br />
SEISMIC GPS OBSERVATIONS OF THE<br />
2010/04/04 EL MAYOR-CUCAPAH<br />
EARTHQUAKE, M.A. Floyd and G.J. Funning<br />
A-046 EL MAYOR CUCAPAH EARTHQUAKE:<br />
POSTSEISMIC DEFORMATION FROM<br />
INSAR AND GPS OBSERVATIONS, A.<br />
Gonzalez Ortega, D. Sandwell, Y. Fialko, J. Gonzalez<br />
Garcia, J. Fletcher, A. Nava Pichardo, M. Floyd, and<br />
B. Lipovsky<br />
A-047 VERTICAL DEFORMATION IN THE<br />
MEXICALI VALLEY, BEFORE, DURING, AND<br />
AFTER THE M=7.2, EL MAYOR – CUCAPAH<br />
EARTHQUAKE, FROM INSAR, LEVELING<br />
AND GEOTECHNICAL INSTRUMENTS, E.<br />
Glowacka, O. Sarychikhina, B.B. Robles, F. Suarez, J.<br />
Ramírez, F.A. Nava, J. González, A. González, F.<br />
Farfán, and B.G. Díaz de Cossío B<br />
A-048 HIGH RESOLUTION INTERSEISMIC<br />
VELOCITY MODEL OF THE SAN ANDREAS<br />
FAULT FROM GPS AND INSAR, X. Tong, D.T.<br />
Sandwell, and B. Smith-Konter<br />
A-049 SAN BERNARDINO GPS NETWORK: TIME<br />
SERIES THROUGH 2010, E. Upton, S. McGill, R.<br />
Bennett, J. Spinler, and A. Torrens-Bonano<br />
2011 <strong>SCEC</strong> <strong>Annual</strong> <strong>Meeting</strong> | 127
Posters | GROUP A<br />
A-050 DEFORMATION RATES IN THE WESTERN<br />
TRANSVERSE RANGES, CALIFORNIA<br />
FROM THE SAN ANDREAS TO THE SANTA<br />
BARBARA CHANNEL MEASURED WITH<br />
GPS AND PERSISTENT SCATTERER INSAR,<br />
S.T. Marshall, G.J. Funning, and S.E. Owen<br />
A-051 INVESTIGATION OF INTERSEISMIC<br />
DEFORMATION ALONG THE CENTRAL<br />
SECTION OF THE NORTH ANATOLIAN<br />
FAULT (TURKEY) USING INSAR<br />
OBSERVATIONS AND EARTHQUAKE-<br />
CYCLE SIMULATIONS, Y. Kaneko, Y. Fialko, X.<br />
Tong, D.T. Sandwell, and M. Furuya<br />
A-052 GPS CONSTRAINTS ON CRUSTAL<br />
DEFORMATION IN THE CENTRAL WALKER<br />
LANE AND SIERRA NEVADA FRONTAL<br />
FAULT, J.M. Bormann, W.C. Hammond, C.W.<br />
Kreemer, and G. Blewitt<br />
A-053 ASSESSING STRAIN ACCUMULATION<br />
RATES ACROSS THE PACIFIC-NORTH<br />
AMERICAN PLATE BOUNDARY NEAR SAN<br />
BERNARDINO, CALIFORNIA, R.F. Mason, E.P.<br />
Upton, A. Grijalva, K.L. Muhammad, A. Torrens-<br />
Bonano, S.F. McGill, E. Alaniz, J. Spinler, R.A. and<br />
Bennett<br />
A-054 INVESTIGATING ALONG-STRIKE DEPTH<br />
VARIATIONS OF SEISMICITY IN THE SAN<br />
ANDREAS FAULT SYSTEM TO BETTER<br />
RESOLVE GEODETIC LOCKING DEPTHS, C.<br />
Del Pardo, B.R. Smith-Konter, D.T. Sandwell, P.<br />
Shearer, and Y. Zeng<br />
A-055 THREE-DIMENSIONAL MODELING OF<br />
INTERSEISMIC DEFORMATION IN<br />
TAIWAN, B. Rousset, S. Barbot, J.P. Avouac, Y.J.<br />
Hsu, and J.C. Lee<br />
A-056 KINEMATICS OF ROTATING PANELS OF E-<br />
W FAULTS IN THE SAN ANDREAS SYSTEM:<br />
WHAT CAN WE TELL FROM GEODESY?, J.P.<br />
Platt and J.P. Becker<br />
A-057 GEODETIC SLIP RATES IN THE SOUTHERN<br />
SAN ANDREAS FAULT SYSTEM:<br />
INVESTIGATION OF THE EFFECTS OF<br />
HETEROGENEOUS ELASTIC STRUCTURE, E.<br />
Lindsey and Y. Fialko<br />
A-058 ONE-DIMENSIONAL ELASTIC MODELING<br />
OF FAULT SLIP RATES IN THE SALTON<br />
TROUGH, CALIFORNIA, E. Alaniz and S.F.<br />
McGill<br />
A-059 DISCREPANCIES IN OBSERVED VERTICAL<br />
MOTION FROM GEODETIC, GEOLOGIC<br />
AND GROUNDWATER DATA ALONG THE<br />
SOUTHERN SAN ANDREAS FAULT SYSTEM,<br />
G.M. Thornton, B.R. Smith-Konter, and J.G. Konter<br />
128 | Southern California Earthquake Center<br />
A-060 ABSOLUTE STRESS IN SOUTHERN<br />
CALIFORNIA CONSTRAINED BY<br />
EARTHQUAKE FOCAL MECHANISMS AND<br />
MODELS OF STRESS CONTRIBUTIONS<br />
FROM TOPOGRAPHY AND FAULT<br />
LOADING, K.M . Luttrell, D.T. Sandwell, and B.R.<br />
Smith-Konter<br />
A-061 STATIC DISPLACEMENTS COMPUTED<br />
FROM SEISMIC WAVEFIELD<br />
SIMULATIONS: VALIDATION TESTS FOR<br />
HOMOGENEOUS AND 1D STRUCTURE, C.<br />
Tape, J.P. Loveless, and B.J. Meade<br />
A-062 EVALUATION OF TRANSIENT<br />
DEFORMATION FROM TWO DECADES OF<br />
CONTINUOUS GPS TIME SERIES ANALYSIS<br />
IN SOUTHERN CALIFORNIA, Y. Bock, S. Owen,<br />
B. Crowell, D. Dong, P. Fang, S. Kedar, Z. Liu, A.<br />
Moore, L. Prawirodirdjo, M. Squibb, and F. Webb<br />
A-063 DETECTION OF TRANSIENT<br />
DEFORMATION IN SOUTHERN<br />
CALIFORNIA USING CONTINUOUS AND<br />
CAMPAIGN GPS MEASUREMENTS, B.W.<br />
Crowell and Y. Bock<br />
A-064 DETECTION OF ANOMALOUS STRAIN<br />
TRANSIENTS USING PRINCIPAL<br />
COMPONENT ANALYSIS AND<br />
COVARIANCE DESCRIPTOR ANALYSIS<br />
METHODS, R.A. Granat, J.W. Parker, S. Kedar,<br />
and Y. Bock<br />
A-065 AUTOMATIC DETECTION OF SHALLOW<br />
FAULT CREEP IN INSAR DATA, M. Wei, D.<br />
Sandwell, and J. McGuire<br />
A-066 GPS AND UAVSAR, A. Donnellan, J. Parker, S.<br />
Hensley, B. Bills, and T. Herring<br />
A-067 GPS NETWORK OPERATIONS AT USGS<br />
PASADENA, D. Determan, A. Aspiotes, K. Hudnut,<br />
N. King, and K. Stark<br />
A-068 PBO SOUTHWEST REGION: NETWORK<br />
OPERATIONS AND BAJA EARTHQUAKE<br />
RESPONSE, C. Walls, A. Basset, D. Mann, S.<br />
Lawrence, C. Jarvis, J. Sklar, K. Feaux, and M.<br />
Jackson<br />
A-069 IMPROVING GPS STRAIN ESTIMATES ON<br />
SUB-DAILY TIMESCALE, Y. Reuveni, S. Kedar, S.<br />
Owen, and F. Webb<br />
A-070 CO-LOCATED PORE PRESSURE AND<br />
VOLUMETRIC STRAIN AT PLATE<br />
BOUNDARY OBSERVATORY BOREHOLES,<br />
A.J. Barbour and D.C. Agnew<br />
A-071 COMPARISON OF CO-LOCATED PORE<br />
PRESSURE AND STRAIN OBSERVATIONS<br />
FROM EARTHQUAKES RECORDED AT PBO<br />
BOREHOLE STRAINMETER SITES, F. Civilini
A-072 ANALYZING BUILDING RESPONSE<br />
THROUGH THE USE OF GPS & STRONG<br />
MOTION DATA FOR THE MONITORING OF<br />
INFRASTRUCTURE, D. Sanchez, Y. Bock, and D.<br />
Melgar<br />
Undergraduate Studies in Earthquake Information Technology (USEIT)<br />
A-156 IMPLEMENTATION OF A SEISMIC<br />
SEQUENCE VISUALIZATION SYSTEM USING<br />
GEOGRAPHIC INFORMATION SYSTEMS, B.J.<br />
Hellige, M.A. Wagner, and S. Reed<br />
A-157 VISUALIZING COMPARATIVE HAZARD<br />
VULNERABILITY THROUGH<br />
GIS/SHAKEMAP INTEGRATION, S.C. Boss, F.<br />
Gutierrez, K.Y. Lin, T. Papikyan, and C.M. Valen<br />
GROUP A | Posters<br />
A-158 IMPLEMENTATION OF GIS LAYERS WITH A<br />
SPACE-TIME GRAPHICAL DISPLAY IN <strong>SCEC</strong>-<br />
VDO, A. Bernhard, T. Farhat, R. Lacey, A. Lim, S.<br />
Paseda, M. Rogers-Martinez, C. Sawyer, T. Jordan, R.<br />
de Groot, and N. Rousseau<br />
A-159 MEDIA TEAM - ABSTRACT, A. Sampson, H.<br />
Humpleman, and M. Romano<br />
2011 <strong>SCEC</strong> <strong>Annual</strong> <strong>Meeting</strong> | 129
Posters | GROUP A<br />
Horizon Ballroom<br />
Monday, September 12, 2011<br />
16:00 – 21:00 Poster Set-Up<br />
21:00 – 22:30 Poster Session III<br />
Tuesday, September 13, 2011<br />
14:00 – 15:30 Poster Session IV<br />
21:00 – 22:30 Poster Session V<br />
Wednesdy, September 14, 2011<br />
07:00 – 08:30 Poster Removal<br />
B-141 SENSITIVITY OF THE SOUTHERN SAN<br />
ANDREAS FAULT SYSTEM TO TECTONIC<br />
BOUNDARY CONDITIONS, J.W. Herbert and<br />
M.L. Cooke<br />
B-142 STRESS-SLIP BEHAVIOR OF A SHEARED<br />
GRANULAR MATERIAL WITH GRAIN<br />
BREAKAGE USING THE SHEAR-<br />
TRANSFORMATION-ZONE THEORY, C.K.C.<br />
Lieou, A.E. Elbanna, J.S. Langer, and J.M. Carlson<br />
B-143 NEAR REAL-TIME ESTIMATION OF<br />
VELOCITY GRADIENT TENSOR FIELDS FOR<br />
CONTINUOUS MONITORING IN<br />
SOUTHERN CALIFORNIA, W.E. Holt, G.<br />
Shcherbenko, and E. Caruso<br />
130 | Southern California Earthquake Center<br />
Poster Presentations: Group B<br />
Crustal Deformation Modeling (CDM)<br />
B-144 LOW-STRENGTH FRICTIONAL CREEP ON<br />
THE LOWER-CRUSTAL EXTENSION OF THE<br />
SAN ANDREAS FAULT NEAR PARKFIELD,<br />
CA, K.M. Johnson, D. Shelly, and A.M. Bradley<br />
B-145 NUMERICAL MODELING OF<br />
INTERSEISMIC EARTHQUAKE-INDUCED<br />
VERTICAL MOTION ASSOCIATED WITH<br />
THE SAN ANDREAS FAULT SYSTEM, B.P.<br />
Hooks, B.R. Smith-Konter, and G. Thornton<br />
B-146 MECHANICS OF STRESS TRANSFER FROM<br />
PLATE MOTION TO PLATE BOUNDARY<br />
FAULTS: DYNAMIC MODELS OF<br />
EARTHQUAKE CYCLES ON A STRIKE-SLIP<br />
FAULT, C.S. Takeuchi and Y. Fialko
B-147 INCORPORATING GPS VELOCITIES INTO<br />
UCERF3, W. Thatcher, P. Bird, J. Bormann, T.<br />
Dawson, E. Field, W. Hammond, E. Hearn, K.<br />
Johnson, R. McCaffrey, D. Sandwell, and Y. Zeng<br />
B-148 ANALYTIC CALCULATION OF STRESSING<br />
RATES IN SOUTHERN CALIFORNIA, J.P.<br />
Loveless and B.J. Meade<br />
B-149 MINIMAL MODELS OF FAULT SLIP IN<br />
COMPLEX FAULT SYSTEMS, B.J. Meade, E.L.<br />
Evans, and J.P. Loveless<br />
B-150 PYLITH: A FINITE-ELEMENT CODE FOR<br />
MODELING QUASI-STATIC AND DYNAMIC<br />
CRUSTAL DEFORMATION, B. Aagaard, C.<br />
Williams, and M. Knepley<br />
B-101 INJECTING INFORMATION FROM STATIC<br />
COULOMB MODELS INTO STATISTICAL<br />
AFTERSHOCK MODELS FOR THE<br />
CANTERBURY, NEW ZEALAND,<br />
EARTHQUAKE SEQUENCE, C.A. Williams, M.C.<br />
Gerstenberger, and S. Steacy<br />
B-102 CORRELATION OF PEAK DYNAMIC AND<br />
STATIC COULOMB FAILURE STRESS WITH<br />
SEISMICITY RATE CHANGE AFTER THE<br />
M7.2 EL MAYOR-CUCAPAH EARTHQUAKE,<br />
K.B. Withers and K.B. Olsen<br />
B-103 THE EFFECTS OF STATIC COULOMB,<br />
NORMAL AND SHEAR STRESS CHANGES<br />
ON EARTHQUAKE OCCURRENCE IN<br />
SOUTHERN CALIFORNIA, A.E. Strader and<br />
D.D. Jackson<br />
B-104 COULOMB STRESS CHANGES IMPARTED<br />
BY SIMULATED M>7 EARTHQUAKES TO<br />
MAJOR FAULT SURFACES IN SOUTHERN<br />
CALIFORNIA, J.C. Rollins, G.P. Ely, and T.H.<br />
Jordan<br />
B-105 HAS THE RISK OF BIG EARTHQUAKES<br />
RECENTLY INCREASED? P.M. Shearer and P.B.<br />
Stark<br />
B-106 TOHOKU EARTHQUAKE: A SURPRISE?, Y.Y.<br />
Kagan and D.D. Jackson<br />
B-107 AFTERSHOCK STATISTICS OF THE 1999<br />
CHI-CHI, TAIWAN EARTHQUAKE, Y.-T. Lee,<br />
D. L. Turcotte, J. B. Rundle, and C.-C. Chen<br />
B-108 FREQUENCY-MAGNITUDE<br />
DISTRIBUTIONS OF TRIGGERED AND<br />
NON-TRIGGERED POPULATIONS OF<br />
SEISMICITY, S. Hernandez and E.E. Brodsky<br />
B-109 COMPARISONS AMONG EARTHQUAKE<br />
SIMULATOR RESULTS FOR UCERF2 FAULT<br />
MODEL OF CALIFORNIA AND OBSERVED<br />
SEISMICITY, T.E. Tullis, K. Richards-Dinger, M.<br />
Barall, J.H. Dieterich, E.H. Field, E. Heien, L.H.<br />
Kellogg, F. Pollitz, J. Rundle, M. Sachs, D.L. Turcotte,<br />
S.N. Ward, B. Yikilmaz, and O. Zielke<br />
Earthquake Forecasting & Predictability (EFP)<br />
GROUP B | Posters<br />
B-151 HOW DO “GHOST TRANSIENTS” FROM<br />
PAST EARTHQUAKES AFFECT GPS SLIP<br />
RATE ESTIMATES ON SOUTHERN<br />
CALIFORNIA FAULTS?, E.H. Hearn, F.F. Pollitz,<br />
W.R. Thatcher, and T. Onishi<br />
B-152 DO SMALL SURFACE STRAINS IN THE NEW<br />
MADRID SEISMIC ZONE REFLECT A<br />
PHYSICAL PROCESS?, O.S. Boyd, Y. Zeng, L.<br />
Ramirez-Guzman, and R. Smalley<br />
B-153 SPACE GEODETIC INVESTIGATION OF<br />
INTERSEISMIC DEFORMATION DUE TO<br />
THE SAN JACINTO FAULT NEAR ANZA, CA,<br />
V. Sahakian, Y. Fialko, Y. Bock, and T. Rockwell<br />
B-110 THE FUTURE OF VIRTUAL CALIFORNIA<br />
SIMULATIONS, M.B. Yikilmaz, J.B. Rundle, D.L.<br />
Turcotte, E.M. Heien, M.K. Sachs, and L.H. Kellogg<br />
B-111 PARALLEL SIMULATED ANNEALING<br />
APPROACH TO SOLVE FOR UCERF3<br />
RUPTURE RATES, K.R. Milner, M.T. Page, and<br />
E.H. Field<br />
B-112 AN EARTHQUAKE RUPTURE FORECAST<br />
INVERSION APPLIED TO FAULT SYSTEMS<br />
IN CALIFORNIA, M.T. Page, E.H. Field, and K.R.<br />
Milner<br />
B-113 STOCHASTIC SOURCE MODEL FOR<br />
SEISMIC HAZARD ESTIMATION, S. Hiemer,<br />
Q. Wang, D.D. Jackson, Y.Y. Kagan, S. Wiemer, J.D.<br />
Zechar, and J. Woessner<br />
B-114 LIDAR-DERIVED MEASUREMENTS OF SLIP<br />
IN THE MOST RECENT GROUND-<br />
RUPTURING EARTHQUAKES ALONG<br />
ELEMENTS OF THE SOUTHERN SAN<br />
ANDREAS FAULT SYSTEM, D.E. Haddad, C.<br />
Madden, J.R. Arrowsmith, J.B. Salisbury, and R.J.<br />
Weldon<br />
B-115 CONSTANT STRESS DROP FITS<br />
EARTHQUAKE SURFACE SLIP-LENGTH<br />
DATA, B.E. Shaw<br />
B-116 EARTHQUAKE SCALING RELATIONSHIPS<br />
ESTIMATED FROM A 16 YEAR CATALOG OF<br />
PUBLISHED INSAR STUDIES, G.J. Funning, J.<br />
Weston, J.R. Elliott, A.M.G. Ferreira, and K.<br />
Richards-Dinger<br />
B-117 CSEP OVERVIEW, D. Schorlemmer, M.C.<br />
Gerstenberger, N. Hirata, D.D. Jackson, C. Jiang, T.H.<br />
Jordan, W. Marzocchi, K.Z. Nanjo, G. A.<br />
Papadopoulos, D.A. Rhoades, S. Wiemer, Z. Wu, J.D.<br />
Zechar, and CSEP Working Group<br />
2011 <strong>SCEC</strong> <strong>Annual</strong> <strong>Meeting</strong> | 131
Posters | GROUP B<br />
B-118 NEW DEVELOPMENTS AND FUTURE<br />
APPLICATIONS OF THE COLLABORATORY<br />
FOR THE STUDY OF EARTHQUAKE<br />
PREDICTABILITY (CSEP) TESTING<br />
FRAMEWORK, M. Liukis, D. Schorlemmer, J. Yu,<br />
P. Maechling, J. Zechar, T.H. Jordan, and he CSEP<br />
Working Group<br />
B-119 RESULTS FROM THE REGIONAL<br />
EARTHQUAKE LIKELIHOOD MODELS<br />
EXPERIMENT, D. Schorlemmer, J.D. Zechar, M.J.<br />
Werner, M.C. Gerstenberger, and D.A. Rhoades<br />
B-120 AN EVALUATION OF THE RELM TEST<br />
FORECASTS, M.K. Sachs, Y.T. Lee, D.L. Turcotte,<br />
J.R. Holliday, and J.B. Rundle<br />
B-121 A TESTABLE EARTHQUAKE LIKELIHOOD<br />
MODEL BASED ON PROXIMITY TO<br />
KNOWN SOURCES, D.A. Rhoades and M.W.<br />
Stirling<br />
B-001 SEISMICALLY DAMAGED REGOLITH AS<br />
SELF-ORGANIZED FRAGILE GEOLOGICAL<br />
FEATURE, N.H. Sleep<br />
B-002 DEVELOPING A PHYSICS-BASED RUPTURE<br />
MODEL GENERATOR BASED ON 1-POINT<br />
AND 2-POINT STATISTICS OF KINEMATIC<br />
SOURCE PARAMETERS, S. Song<br />
B-003 COMPLEXITY OF THE M6.3 2009 L’AQUILA<br />
(CENTRAL ITALY) EARTHQUAKE: SLIP<br />
INVERSION AND BROAD-BAND<br />
MODELING OF STRONG-GROUND<br />
MOTIONS, F. Gallovic, J. Zahradnik, G. Ameri, and<br />
F. Pacor<br />
B-004 A PROGRESS REPORT ON THE ARRA-<br />
FUNDED GEOTECHNICAL SITE<br />
CHARACTERIZATION PROJECT, A. Martin, A.<br />
Yong, K. Stokoe, A. Di Matteo, S. Jack, and J. Diehl<br />
B-005 DIRECTIVITY-BASIN COUPLING IN THE<br />
LOS ANGELES REGION FROM THE<br />
CYBERSHAKE HAZARD MODEL, F. Wang,<br />
T.H. Jordan, S. Callaghan, K. Milner, P. Maechling,<br />
R. Graves, and CyberShake Collaboration<br />
B-006 3-D FINITE ELEMENT MODELING OF<br />
PRECARIOUSLY BALANCED ROCKS, S.<br />
Veeraraghavan and S. Krishnan<br />
B-007 MODELING GROUND MOTION OF A M7+<br />
EARTHQUAKE ON THE SAN ANDREAS<br />
FAULT USING THE VIRTUAL<br />
EARTHQUAKE APPROACH, M. Denolle, G.C.<br />
Beroza, E.M. Dunham, and G. Prieto<br />
B-008 NEW BE-10 EXPOSURE AGES AND<br />
FRAGILITIES FOR PRECARIOUSLY<br />
132 | Southern California Earthquake Center<br />
Ground Motion Prediction (GMP)<br />
B-122 TESTING SEGMENTATION MODELS, D.D.<br />
Jackson<br />
B-123 ETAS VS. STEP, J.D. Zechar, D. Schorlemmer, M.C.<br />
Gerstenberger, and D.A. Rhoades<br />
B-124 FULL EARTH HIGH-RESOLUTION<br />
EARTHQUAKE FORECASTS, Y.Y. Kagan and<br />
D.D. Jackson<br />
B-125 CREATING PROBABILISTIC SEISMIC<br />
HAZARD MAPS FROM CSEP DATA, J.R.<br />
Holliday<br />
B-126 ADVANCEMENTS IN PROBABILISTIC<br />
SEISMIC NETWORK COMPLETENESS<br />
STUDIES, D. Schorlemmer<br />
BALANCED ROCKS TEST PSHA AND<br />
RUPTURE MODELS IN SOUTHERN<br />
CALIFORNIA, D.H. Rood, R. Anooshehpoor, G.<br />
Balco, J. Brune, R. Brune, L. Grant Ludwig, K.<br />
Kendrick, M. Purvance, and I. Saleeby<br />
B-009 STOCHASTIC SIMULATION OF<br />
EARTHQUAKE GROUND MOTION<br />
COMPONENTS FOR SPECIFIED<br />
EARTHQUAKE AND SITE<br />
CHARACTERISTICS: A TOOL FOR<br />
PERFORMANCE-BASED EARTHQUAKE<br />
ENGINEERING, S. Rezaeian<br />
B-010 USING GROUND-BASED LIDAR AND<br />
MORPHOMETRIC ANALYSIS TO STUDY<br />
THE EVOLUTION OF PRECARIOUSLY<br />
BALANCED ROCKS, J.E. Harvey and D.H. Rood<br />
B-011 BAYESIAN EARTHQUAKE SOURCE<br />
VALIDATION FOR GROUND MOTION<br />
SIMULATION, H.C. Jimenez, P.M. Mai, E.<br />
Prudencio, I. Babuska, M. Motamed, and R. Tempone<br />
B-012 GENERATING BROADBAND<br />
SEISMOGRAMS FOR A SUITE OF SAN<br />
ANDREAS EARTHQUAKES, R. Mourhatch and<br />
S. Krishnan<br />
B-013 OPEN-SOURCE GROUND MOTION<br />
SELECTION USING THE GENERALIZED<br />
CONDITIONAL INTENSITY MEASURE<br />
(GCIM) APPROACH, B.A. Bradley<br />
B-014 STRONG GROUND MOTION IN PORT-AU-<br />
PRINCE, HAITI, DURING THE 12 JANUARY<br />
2010 M7.0 HAITI EARTHQUAKE, S.E. Hough, T.<br />
Taniguchi, J.R. Altidor, D. Angllade, S.L. Mildor, and<br />
D. Given<br />
B-015 PARTIAL TESTS AND ACID TESTS OF<br />
GROUND-MOTION MODELS FOR
INHIBITION OF VERY STRONG SHAKING,<br />
D.A. Rhoades, G.H. McVerry, and J.X. Zhao<br />
B-016 GENERATING STOCHASTIC SOURCE<br />
MODELS USING INSIGHTS FROM<br />
LABORATORY EARTHQUAKES, H. Siriki and<br />
S. Krishnan<br />
B-017 SPATIAL VARIABILITY OF GROUND<br />
MOTION AMPLIFICATION FROM LOW-<br />
VELOCITY SEDIMENTS INCLUDING<br />
FRACTAL INHOMOGENEITIES WITH<br />
SPECIAL REFERENCE TO THE SOUTHERN<br />
CALIFORNIA BASINS, K.B. Olsen and B.H.<br />
Jacobsen<br />
B-018 TESTING <strong>SCEC</strong> 3D SEISMIC VELOCITY<br />
MODELS IN THE SAN BERNARDINO AND<br />
LOS ANGELES BASIN REGIONS, R.W. Graves,<br />
A. Plesch, and J. Shaw<br />
B-019 GROUND MOTION PREDICTION<br />
EQUATIONS FOR DATA RECORDED IN THE<br />
IMMEDIATE VICINITY OF THE SAN<br />
JACINTO FAULT ZONE, I. Kurzon, F.L. Vernon,<br />
and Y. Ben-Zion<br />
B-134 THE SALTON SEISMIC IMAGING PROJECT:<br />
INVESTIGATING EARTHQUAKE HAZARDS<br />
IN THE SALTON TROUGH, SOUTHERN<br />
CALIFORNIA, G.S. Fuis, M.R. Goldman, R.R.<br />
Sickler, R.D. Catchings, M.J. Rymer, E.J. Rose, J.M.<br />
Murphy, L.A. Butcher, J.A. Cotton, C.J. Criley, D.S.<br />
Croker, I. Emmons, A.J. Ferguson, M.A. Gardner,<br />
E.G . Jensen, R. McClearn, C.L. Loughran, C.J.<br />
Slayday-Criley, J.R. Svitek, J.A. Hole, J.M. Stock, S.<br />
Skinner, N.W. Driscoll, A.J. Harding, J. Babcock,<br />
G.M. Kent, A. Kell, and S.H. Harder<br />
B-135 MOHO DISCONTINUITY STUDY ALONG<br />
SAN ANDREAS FAULT WITH RECEIVER<br />
FUNCTIONS, P.A. Cox, P.M. Davis, and R.W.<br />
Clayton<br />
B-136 SEISMIC ANISOTROPY OF THE PELONA<br />
SCHIST FROM ELECTRON BACKSCATTER<br />
DIFFRACTION (EBSD) MEASUREMENTS OF<br />
CRYSTAL PREFERRED ORIENTATIONS<br />
(CPOS), K.C. Wagner, S. Brownlee, and B. Hacker<br />
B-137 CRUSTAL STRUCTURE OF THE SALTON<br />
TROUGH AND SOUTHERN SAN ANDREAS<br />
B-079 COMPARISON OF USGS PAGER EMPIRICAL<br />
FATALITY RATES TO RECONNAISSANCE<br />
OBSERVATIONS AND AN ACCOUNTING<br />
OF UNCERTAINTIES IN THE FATALITY<br />
MODEL, A.H. Olsen, E. So, M. Hearne, K. Jaiswal,<br />
and D.J. Wald<br />
B-080 ACCURACY OF NON-DESTRUCTIVE<br />
TESTING OF PBRS TO ESTIMATE<br />
Lithospheric Architecture & Dynamics (LAD)<br />
Seismic Hazard & Risk Analysis (SHRA)<br />
GROUP B | Posters<br />
B-020 <strong>SCEC</strong> BROADBAND PLATFORM STRONG<br />
GROUND MOTION SIMULATIONS, S. Kumar,<br />
S. Callaghan, P.J. Maechling, K.B. Olsen, R.<br />
Archuleta, P. Somerville, R. Graves, T.H. Jordan, and<br />
the Broadband Platform Working Group<br />
B-021 CHARACTERISTICS OF STRONG GROUND<br />
MOTION ATTENUATION DURING THE 2010<br />
M7.1 DARFIELD AND 2011 M6.3<br />
CHRISTCHURCH, NEW ZEALAND<br />
EARTHQUAKES, M. Segou and E. Kalkan<br />
B-022 A PERMANENTLY DEPLOYED CROSS-HOLE<br />
EXPERIMENT FOR MONITORING<br />
DEGRADATION AND RECOVERY OF<br />
SHEAR MODULUS AT THE NEES@UCSB<br />
GARNER VALLEY FIELD SITE, R. Gee, J. Steidl,<br />
and P. Hegarty<br />
FAULT FROM NEW GRAVITY AND<br />
MAGNETIC DATA, V.E. Langenheim, D.S.<br />
Scheirer, and N.D. Athens<br />
B-138 LOWER CRUSTAL ANISOTROPY IN THE<br />
MOJAVE DESERT REGION FROM<br />
ELECTRON BACKSCATTER DIFFRACTION<br />
(EBSD) MEASUREMENTS OF CRYSTAL<br />
PREFERRED ORIENTATION (CPO), S.J.<br />
Brownlee, K. Wagner, and B.R. Hacker<br />
B-139 PRELIMINARY RESULTS ON THE ANALYSIS<br />
OF THE DEVIATORIC STRESS FIELD FROM<br />
FOCAL MECHANISMS AND SLIP-LINE<br />
FIELD FROM CONJUGATE LINEAR<br />
SEISMICITY CLUSTERS IN SOUTHERN<br />
CALIFORNIA, W. Yang and E. Hauksson<br />
B-140 STRAIN LOCALIZATION AND CRUSTAL<br />
THICKNESS VARIATION ACROSS MAJOR<br />
STRIKE SLIP FAULTS IN SOUTHERN<br />
CALIFORNIA REVEALED BY RECEIVER<br />
FUNCTION STUDIES, P. Zhang, M.S. Miller, J.F.<br />
Dolan, I.W. Bailey, and D.A. Okaya<br />
FRAGILITIES, J.N. Brune, R. Brune, G.P. Biasi, R.<br />
Anooshehpoor, and M.D. Purvance<br />
B-081 VECTOR-VALUED FRAGILITIES AND THE<br />
STATE OF THE ARCHIVE FOR<br />
PRECARIOUSLY BALANCED ROCKS (PBRS)<br />
IN SOUTHERN CALIFORNIA, G.P. Biasi, J.N.<br />
Brune, and A.W. Homan<br />
2011 <strong>SCEC</strong> <strong>Annual</strong> <strong>Meeting</strong> | 133
Posters | GROUP B<br />
B-082 CAN FAULT MAPS CONSTRAIN FUTURE<br />
EARTHQUAKE MAGNITUDES?, D.A. Weiser<br />
B-083 CHANGE IN STATISTICS FROM A<br />
DIMENSIONAL TRANSITION: MEASURING<br />
B = 1.5 FOR LARGE EARTHQUAKES, M.R.<br />
Yoder, J.R. Holliday, D.L. Turcotte, and J.B. Rundle<br />
B-084 ANALYZING AMBIENT NOISE USING USB<br />
MICRO-ELECTRO-MECHANICAL SYSTEMS<br />
(MEMS) ACCELEROMETERS, H.J. Potter, A.<br />
Chung, and J. Lawrence<br />
B-085 NON-LINEAR BUILDING RESPONSE<br />
SIMULATIONS USING <strong>SCEC</strong> SIMULATED<br />
GROUND MOTIONS, C.A. Goulet and C.B.<br />
Haselton<br />
B-086 PROBING CALIFORNIA'S COASTLINE TO<br />
UNEARTH TRACES OF PALEOTSUNAMIS:<br />
IMPLICATIONS FOR THE NEXT USGS<br />
MULTI-HAZARDS SCENARIO, R. Leeper, N.<br />
Graehl, E. Hemphill-Haley, D. Hoirup, B. Jaffe, H.<br />
Kelsey, R. Peters, and R. Wilson<br />
B-087 PARALLELIZATION OF THE VIRTUAL<br />
CALIFORNIA EARTHQUAKE SIMULATOR,<br />
E.M. Heien, M.B. Yikilmaz, M.K. Sachs, J.B. Rundle,<br />
L.H. Kellogg, and D.L. Turcotte<br />
B-088 PROBABILISTIC ASSESSMENT OF<br />
BUILDING RESPONSE TO SIMULATED AND<br />
RECORDED GROUND MOTIONS, K.L. Rowe<br />
and A.B. Liel<br />
B-089 OPENSHA AND THE USGS NATIONAL<br />
SEISMIC HAZARD MAPS, P.M. Powers<br />
B-090 ENGINEERING VALIDATION OF GROUND<br />
MOTION SIMULATION: PART 1. ELASTIC<br />
AND INELASTIC SPECTRA, C. Galasso, F.<br />
Zareian, I. Iervolino, and R.W. Graves<br />
B-091 ENGINEERING VALIDATION OF GROUND<br />
MOTION SIMULATION: PART 2. MAXIMUM<br />
INTERSTORY DRIFT RATIO AND CRITICAL<br />
B-023 SEISMIC VELOCITY STRUCTURES IN THE<br />
SOUTHERN CALIFORNIA PLATE<br />
BOUNDARY ENVIRONMENT FROM<br />
DOUBLE-DIFFERENCE TOMOGRAPHY, A.A.<br />
Allam and Y. Ben-Zion<br />
B-024 DEVELOPING A THREE-DIMENSIONAL<br />
GEOLOGICAL AND GEOPHYSICAL MODEL<br />
OF SIERRA NEGRA VOLCANO OF THE<br />
GALAPAGOS, L.C. Davidge and C. Ebinger<br />
B-025 COMPARISON OF THE LOW-COST MEMS<br />
ACCELEROMETERS USED BY THE QUAKE-<br />
CATCHER NETWORK AND TRADITIONAL<br />
STRONG MOTION SEISMIC SENSORS, E.S.<br />
Cochran, J.F. Lawrence, A. Kaiser, B. Fry, and A.<br />
Chung<br />
B-026 GPS AND ACCELEROMETER<br />
COMBINATION FOR REAL-TIME SOURCE<br />
134 | Southern California Earthquake Center<br />
Seismology<br />
STORY SPECTRA, C. Galasso, F. Zareian, I.<br />
Iervolino, and R.W. Graves<br />
B-092 INVESTIGATING THE IMPACT OF SPACE-<br />
GEODETIC DATA ON EARTHQUAKE RISK<br />
ANALYSES FOR CALIFORNIA, C.M. Mak and<br />
M. Nyst<br />
B-093 UPDATING THE NEW ZEALAND NSHM<br />
FROM THE CANTERBURY EARTHQUAKE<br />
SEQUENCE, M. Gerstenberger, G. McVerry, D.<br />
Rhoades, M. Stirling, K. Berryman, and T. Webb<br />
B-094 INTEGRATING NONLINEAR SITE<br />
RESPONSE MODELS IN BROADBAND<br />
GROUND MOTION PREDICTIONS, D.<br />
Assimaki and W. Li<br />
B-095 GROUND MOTION AMPLIFICATION<br />
DURING THE M7.0 2010 HAITI<br />
EARTHQUAKE: TOPOGRAPHY OR SOIL<br />
EFFECTS?, D. Assimaki and S. Jeong<br />
B-096 FUTURE DIRECTIONS FOR STUDIES OF<br />
PRECARIOUSLY BALANCED ROCKS, J.G.<br />
Anderson, G.P. Biasi, and J.N. Brune<br />
B-097 CONSEQUENCES OF THE ASSUMPTIONS<br />
REGARDING SEGMENTATION VERSUS<br />
NONSEGMENTATION OF THE SHORELINE<br />
FAULT WHEN ESTIMATING EARTHQUAKE<br />
POTENTIAL AND SEISMIC LOAD FOR<br />
DIABLO CANYON NUCLEAR POWER<br />
PLANT (DCNPP), A. Bykovtsev and M. Kasimov<br />
B-098 TSUNAMI HAZARD MAPPING ACTIVITIES<br />
IN SOUTHERN CALIFORNIA, R. Wilson, K.<br />
Miller, C. Real, J. Goltz, and J. Treiman<br />
B-099 A NEW AGE CONSTRAINT FOR A NEAR-<br />
FAULT PRECARIOUS LANDFORM IN<br />
CENTRAL OTAGO, NEW ZEALAND, M.<br />
Stirling, D. Rood, G. Balco, and A. Zondervan<br />
MODELING AND EARTHQUAKE EARLY<br />
WARNING, D. Melgar, B.W. Crowell, and Y. Bock<br />
B-027 SPATIAL DISTRIBUTIONS OF<br />
FORESHOCKS AND AFTERSHOCKS:<br />
STATIC OR DYNAMIC TRIGGERING?, M.J.<br />
Werner and A.M. Rubin<br />
B-028 RELATIONS BETWEEN PROPERTIES OF<br />
SEISMICITY AND REGIONAL HEAT FLOW<br />
IN CALIFORNIA, I. Zaliapin and Y. Ben-Zion<br />
B-029 IDENTIFYING FAULT HETEROGENEITY<br />
THROUGH MAPPING SPATIAL<br />
ANOMALIES IN ACOUSTIC EMISSION<br />
STATISTICS, T.H. Goebel, T. Becker, D.<br />
Schorlemmer, S. Stanchits, C. Sammis, E. Rybacki,<br />
and G. Dresen
B-030 EARTHQUAKE CLUSTERING AND<br />
AFTERSHOCK STATISTICS IN SIMULATED<br />
CATALOGS, J.J. Gilchrist, J.H. Dieterich, and K.B.<br />
Richards-Dinger<br />
B-031 POTENTIAL MAGNITUDE DEPENDENT<br />
QUIESCENCE PRIOR TO THE NORTHRIDGE<br />
EARTHQUAKE, D.E. Smith and S.I. Sacks<br />
B-032 THE MECHANICS OF EARTHQUAKES AND<br />
FAULTING IN THE SOUTHERN GULF OF<br />
CALIFORNIA, D.F. Sumy, J.B. Gaherty, W.-Y. Kim,<br />
and T. Diehl<br />
B-033 ON THE QUANTIFICATION OF<br />
ROBUSTNESS WHEN COMPARING<br />
KINEMATIC INVERSION MODELS: A<br />
WAVELET APPROACH, D. Lavallee, G. Shao, and<br />
C. Ji<br />
B-034 SOURCE PROCESSES OF<br />
MICROEARTHQUAKES AT PARKFIELD, CA,<br />
DETERMINED BY NEAR-SOURCE<br />
OBSERVATION AT SAFOD MAIN HOLE, K.<br />
Imanishi and W.L. Ellsworth<br />
B-035 INTERACTION BETWEEN EARTHQUAKE<br />
GROUND MOTION AND BUILDING<br />
MODELS -- A 3D PARAMETRIC STUDY, Y.D.<br />
Isbiliroglu, R. Taborda, and J. Bielak<br />
B-036 CONNECTING THE SPATIAL<br />
DISTRIBUTION OF ACOUSTIC EMISSIONS<br />
TO FAULT ROUGHNESS DURING STICK-<br />
SLIP EXPERIMENTS, T.H. Goebel, C. Sammis,<br />
and T. Becker<br />
B-037 COMPLEX RUPTURE MODES OF THE 2011<br />
MW 9.0 TOHOKU-OKI EARTHQUAKE<br />
INFERRED FROM TELESEISMIC AND<br />
LOCAL WAVEFORMS, H. Yao<br />
B-038 LOVE WAVE TRIGGERS TREMOR ALONG<br />
SAN JACINTO FAULT IN THE ANZA<br />
REGION, CALIFORNIA, T.-H. Wang, E.S.<br />
Cochran, and D.D. Oglesby<br />
B-039 GLOBAL SEARCH FOR DEEP TRIGGERED<br />
TREMOR, K. Chao, Z. Peng, B. Enescu, C. Wu, and<br />
B. Fry<br />
B-040 COMPOUND EARTHQUAKES ON A<br />
BIMATERIAL INTERFACE AND<br />
IMPLICATIONS FOR RUPTURE<br />
MECHANICS, E. Wang and A.M. Rubin<br />
B-041 EARTHQUAKE NUCLEATION<br />
MECHANISMS AND DAMAGE IN<br />
HETEROGENEOUS FAULT ZONES, PROBED<br />
WITH PERIODIC LOADINGS (IN MODELS<br />
AND EXPERIMENTS), B.W. Brinkman, Y. Ben-<br />
Zion, J.T. Uhl, and K.A. Dahmen<br />
B-042 FULL-3D WAVEFORM TOMOGRAPHY FOR<br />
NORTHERN CALIFORNIA USING<br />
AMBIENT-NOISE CROSS-CORRELATION<br />
GREEN'S-FUNCTIONS, Z. Xu and P. Chen<br />
B-043 STRESS DROP OBSERVATIONS FOR THE<br />
2010 EL MAYOR AFTERSHOCKS WITH<br />
GROUP B | Posters<br />
4.0
Posters | GROUP B<br />
EVOLUTION TO DYNAMIC RUPTURE, B.A.<br />
Erickson and E.M. Dunham<br />
B-057 EFFECTS OF PARAMETERIZATION ON<br />
FINITE SOURCE INVERSIONS WITH DENSE<br />
LOCAL DATA, S. N. Somala, J. -P. Ampuero, and<br />
N. Lapusta<br />
B-058 PREPARING TRIAL MODELS OF SPATIAL<br />
VARIABILITY IN GEOTECHNICAL<br />
VELOCITIES FOR ASSESSING EFFECTS ON<br />
GROUND MOTIONS, W.H. Savran and J.N.<br />
Louie<br />
B-059 TELESEISMIC P WAVE CODA OF<br />
SUBDUCTION EARTHQUAKES FROM<br />
WAVE INTERACTION NEAR TRENCHES, W.<br />
Wu and S. Ni<br />
B-060 AUTO-CORRELATION CLUSTERING EVENT<br />
DETECTION APPLIED TO TECTONIC<br />
TREMOR, A.C. Aguiar and G.C. Beroza<br />
B-061 LOCAL AND REGIONAL SEISMIC<br />
RESPONSE TO INJECTION AND<br />
PRODUCTION AT THE SALTON SEA<br />
GEOTHERMAL FIELD, SOUTHERN<br />
CALIFORNIA, L.J. Lajoie and E.E. Brodsky<br />
B-062 WAVEFORM RELOCATED EARTHQUAKE<br />
CATALOG FOR SOUTHERN CALIFORNIA<br />
(1981 TO 2011), E. Hauksson, W. Yang, and P.<br />
Shearer<br />
B-063 HIGH-FREQUENCY AMBIENT NOISE<br />
TOMOGRAPHY USING INDUSTRIAL<br />
SEISMIC ARRAY IN LONG BEACH,<br />
CALIFORNIA, F. Lin and R.W. Clayton<br />
B-064 GEOMETRY OF FAULT SLIP ZONES AT<br />
DEPTH FROM QUANTITATIVE ANALYSIS<br />
OF SEISMIC CATALOGS: METHOD AND<br />
RESULTS FOR THE SAN JACINTO FAULT<br />
ZONE, Y. Ozakin and Y. Ben-Zion<br />
B-065 SALTON SEISMIC IMAGING PROJECT, E.<br />
Jimenez, J.D. Rodriguez, and J. Stock<br />
B-066 PRODUCTS AND SERVICES AVAILABLE<br />
FROM THE SOUTHERN CALIFORNIA<br />
EARTHQUAKE DATA CENTER (SCEDC)<br />
AND THE SOUTHERN CALIFORNIA<br />
SEISMIC NETWORK (SCSN), E. Yu, A.<br />
Bhaskaran, S. Chen, M.J. Ihrig, F. Chowdhury, S.<br />
Meisenhelter, K. Hutton, D. Given, E. Hauksson, and<br />
R. Clayton<br />
B-067 A GUIDE TO SELECTING EMPIRICAL<br />
GREEN’S FUNCTIONS IN REGIONS OF<br />
FAULT COMPLEXITY: A STUDY OF DATA<br />
136 | Southern California Earthquake Center<br />
FROM THE SAN JACINTO FAULT ZONE,<br />
SOUTHERN CALIFORNIA, D.L. Kane, D.L. Kilb,<br />
and F.L. Vernon<br />
B-068 COMPARATIVE STUDY OF SCATTERING<br />
AND INTRINSIC ATTENUATION IN<br />
CALIFORNIA, MEXICO AND PERU. DOES<br />
THE TECTONIC SETTING AFFECT THE<br />
FREQUENCY DEPENDENCE?, L.A. Dominguez,<br />
P.M. Davis, and M. Madrid<br />
B-069 DETECTING MISSING EARTHQUAKES ON<br />
THE PARKFIELD SECTION OF THE SAN<br />
ANDREAS FAULT FOLLOWING THE 2003<br />
MW6.5 SAN SIMEON EARTHQUAKE, X. Meng,<br />
Z. Peng, and J.L. Hardebeck<br />
B-070 DIFFERENTIATING STATIC AND DYNAMIC<br />
TRIGGERING NEAR SALTON SEA<br />
FOLLOWING THE 2010 MW7.2 EL MAYOR-<br />
CUCAPAH EARTHQUAKE, X. Meng, Z. Peng,<br />
and P. Zhao<br />
B-071 STATISTICAL ANALYSIS OF 71 BURSTS IN<br />
SOUTHERN CALIFORNIA, X. Chen, P.M.<br />
Shearer, and R. Abercrombie<br />
B-072 FOCAL MECHANISM WITH ERROR<br />
ESTIMATION USING REGIONAL<br />
WAVEFORMS: A CASE STUDY WITH THE<br />
2008 CHINO HILLS EARTHQUAKE, Z. Zhan, S.<br />
Wei, and D. Helmberger<br />
B-073 APPROACHES FOR HIGH – PERFORMANCE<br />
WAVEFORM CROSS CORRELATION, R.J.<br />
Chen, G.C. Beroza, and W.L. Ellsworth<br />
B-074 WIDESPREAD TRIGGERING OF<br />
EARTHQUAKES IN THE CENTRAL US BY<br />
THE 2011 M9.0 TOHOKU-OKI EARTHQUAKE,<br />
J.L. Rubinstein and H.M. Savage<br />
B-075 THE 2011 MW 9 TOHOKU-OKI<br />
EARTHQUAKE: COMPLEXITY OF DYNAMIC<br />
RUPTURE AT THE BOTTOM OF A<br />
SEISMOGENIC ZONE, L. Meng, J.P. Ampuero,<br />
and A. Inbal<br />
B-076 2011 LONG BEACH/SIGNAL HILL, CA<br />
SEISMIC STUDY, D.D. Hollis<br />
B-077 COMPUTING A LARGE REFINED CATALOG<br />
OF FOCAL MECHANISMS FOR SOUTHERN<br />
CALIFORNIA (1981 – 2010), W. Yang, E.<br />
Hauksson, and P.M. Shearer<br />
B-078 RESULTS FROM THE QUAKE-CATCHER<br />
NETWORK RAPID AFTERSHOCK<br />
MOBILIZATION PROGRAM (QCN-RAMP)<br />
IN CHRISTCHURCH, NEW ZEALAND, A.I.<br />
Chung, E.S. Cochran, C. Christensen, A.E. Kaiser,<br />
and J.F. Lawrence
B-127 SEISMOGRAM-BASED ASSESSMENT OF<br />
THE SOUTHERN CALIFORNIA SEISMIC<br />
VELOCITY MODEL CVM-H 11.9 WITH 234<br />
REFERENCE EARTHQUAKES, C. Tape, E.<br />
Casarotti, A. Plesch, and J.H. Shaw<br />
B-128 UPDATES FOR THE CVM-H INCLUDING<br />
NEW REPRESENTATIONS OF THE<br />
OFFSHORE SANTA MARIA AND SAN<br />
BERNARDINO BASINS AND A NEW MOHO<br />
SURFACE, A. Plesch, C. Tape, R. Graves, J.H. Shaw,<br />
P. Small, and G. Ely<br />
B-129 <strong>SCEC</strong> UCVM – UNIFIED CALIFORNIA<br />
VELOCITY MODEL, P. Small, P. Maechling, T.<br />
Jordan, G. Ely, and R. Taborda<br />
B-130 USING STRUCTURAL CONSTRAINTS ON<br />
THE LITTLE SAN BERNARDINO<br />
MOUNTAINS TO PETROLOGICALLY AND<br />
Unified Structural Representation (USR)<br />
GROUP B | Posters<br />
GEOCHEMICAL ANALYZE THE CRUSTAL<br />
VELOCITY MODEL OF SOUTHERN<br />
CALIFORNIA, C. Symcox and A. Barth<br />
B-131 CFM V.4.0: CONTINUED UPGRADES AND<br />
IMPROVEMENTS TO THE <strong>SCEC</strong><br />
COMMUNITY FAULT MODEL AND ITS<br />
ASSOCIATED FAULT DATABASE, C.<br />
Nicholson, A. Plesch, and J.H. Shaw<br />
B-132 HIGH-RESOLUTION MAPPING AND<br />
ANALYSIS OF BORDERLAND FAULTS<br />
USING MULTIBEAM BATHYMETRY DATA,<br />
M.R. Legg, M. Kohler, D. Weeraratne, and N.<br />
Shintaku<br />
B-133 FAULT ARCHITECTURE OF THE SALTON<br />
SEA THROUGH MULTI-SCALE SEISMIC<br />
REFLECTION SURVEYS, A.M. Kell, N. Driscoll,<br />
G.M. Kent, A. Harding, and R. Baskin<br />
2011 <strong>SCEC</strong> <strong>Annual</strong> <strong>Meeting</strong> | 137
Poster Abstracts<br />
Poster Abstracts<br />
PYLITH: A FINITE-ELEMENT CODE FOR MODELING QUASI-STATIC AND DYNAMIC CRUSTAL<br />
DEFORMATION (B-150)<br />
B. Aagaard, C. Williams, and M. Knepley<br />
We have developed open-source finite-element software for 2-D and 3-D dynamic and quasi-static modeling of crustal<br />
deformation. This software, PyLith (current release is version 1.6) can be used for quasi-static viscoelastic modeling, dynamic<br />
spontaneous rupture and/or ground-motion modeling. Unstructured and structured finite-element discretizations allow for<br />
spatial scales ranging from tens of meters to hundreds of kilometers with temporal scales in dynamic problems ranging from<br />
milliseconds to minutes and temporal scales in quasi-static problems ranging from minutes to thousands of years. PyLith<br />
development is part of the NSF funded Computational Infrastructure for Geodynamics (CIG) and the software runs on a wide<br />
variety of platforms (laptops, workstations, and Beowulf clusters). Binaries (Linux, Darwin, and Windows systems) and<br />
source code are available from geodynamics.<strong>org</strong>. PyLith uses a suite of general, parallel, graph data structures called Sieve for<br />
storing and manipulating finite-element meshes. This permits use of a variety of 2-D and 3-D cell types including triangles,<br />
quadrilaterals, hexahedra, and tetrahedra.<br />
Current PyLith features include prescribed fault ruptures with multiple earthquakes and aseismic creep, spontaneous fault<br />
ruptures with a variety of fault constitutive models, time-dependent Dirichlet and Neumann boundary conditions, absorbing<br />
boundary conditions, time-dependent point forces, and gravitational body forces. PyLith supports infinitesimal and small<br />
strain formulations for linear elastic rheologies, linear and generalized Maxwell viscoelastic rheologies, power-law viscoelastic<br />
rheologies, and Drucker-Prager elastoplastic rheologies. Current software development focuses on coupling quasi-static and<br />
dynamic simulations to resolve multi-scale deformation across the entire seismic cycle and the coupling of elasticity to heat<br />
and/or fluid flow.<br />
AUTO-CORRELATION CLUSTERING EVENT DETECTION APPLIED TO TECTONIC TREMOR (B-060)<br />
A.C. Aguiar and G.C. Beroza<br />
We exploit the fact that tectonic tremor has been shown to be comprised of frequently occurring and repeating low frequency<br />
earthquakes (LFEs) to identify those events. We refer to this approach as the auto-correlation clustering detection method<br />
because it builds on the auto-correlation approach of Brown et al. (2008) which detects events based on pair-wise matching.<br />
Our method takes advantage of the fact that common signals repeat many times within the tremor signal. This method is<br />
applied to 24 hours of data during the April, 2006 tremor episode in the Nankai Trough in SW Japan. We analyze 1-hour<br />
periods at a time by auto-correlating 8 s windows shifted 2 samples each. We then shift 20 minutes ahead of the previously<br />
analyzed hour and carry detections until the 24 hours of data are completed. We apply a 3-sigma detection threshold to find<br />
individual matches, then tally the number of detections for each window and use this as our test statistic. For band-limited<br />
Gaussian white noise, the number of detections should follow a binomial distribution governed by the assumed detection<br />
threshold. We use this null hypothesis to test the significance of the detection of a candidate LFE family. Our method places<br />
the detection of LFE families on a sound statistical basis. It should improve our ability to detect LFEs within weak tremor<br />
signals and will likely be applicable to other earthquake swarms.<br />
REVISITING WALLACE CREEK: NEW RADIOCARBON RESULTS AND SLIP RATE ESTIMATES OF THE<br />
SAN ANDREAS FAULT IN THE CARRIZO PLAIN (A-145)<br />
S.O. Akciz, D.E. Haddad, W. Bohon, L. Mendes, G. Marliyani, B. Salisbury, T. Sato, L. Grant Ludwig, and J.R. Arrowsmith<br />
Sieh and Jahns (1984) determined the slip rate of the San Andreas fault (SAF) at Wallace Creek in the Carrizo Plain, and<br />
thereby provided an anchor for nearly all data-driven models of the southern San Andreas fault behavior. Their landmark<br />
study has been referenced hundreds of times and is a critical constraint in many related studies and in hazard estimates for the<br />
south-central SAF. Slip rate estimates at Wallace Creek (33.9±2.9 mm/yr) and at Van Matre Ranch site (29.3-35.6 mm/yr;<br />
Noriega et al., 2006) agree well within measurement uncertainty, and with the 30–37 mm/yr velocity gradient across the SAF<br />
from decadal timescale geodetic measurements (Schmalzle, et al., 2006). Surprisingly, only a few detrital charcoal samples (9<br />
samples at VMR, 8 samples at Wallace Creek) have been used to provide the absolute geochronological constraints. At a third<br />
site, Phelan Creeks, located ~ 2.5 km SE of Wallace Creek, 23 trenches were opened and over 400 charcoal samples were<br />
collected (Sims et al., unpublished data) to provide additional slip rate constraints, but the detailed study was never published.<br />
138 | Southern California Earthquake Center
Poster Abstracts<br />
New paleoseismologic investigations at the Bidart Fan site, ~5 km SE of Wallace Creek, indicate that southern SAF in the<br />
Carrizo Plain has apparently ruptured, on average, every 88 years (45-144 yr for individual intervals) between ~A.D. 1350 and<br />
1857 (Akciz et al., 2010). B4 LiDAR (light detection and ranging) data analysis by Zielke et al. (2010) also found that only ~5.5<br />
m of slip occurred along the SAF in the Carrizo Plain in 1857 and at least since ~A.D. 1400, and none of the earthquakes<br />
generated displacements larger than 5 meters (Grant Ludwig et al., 2010).<br />
Slip per event and earthquake timing constraints can be tested against slip rate information to assess the steadiness of slip.<br />
Therefore, these new data and the geochronological limitations of the published slip-rate studies emphasize the need to<br />
improve, if not confirm, the existing slip-rate estimates by providing additional geochronological constraints. In August, 20111,<br />
we re-excavated T7 and T11 from Sieh and Jahns' study, photologged the trench walls (1:10) and collected a total of 30 new<br />
detrital charcoal samples from different stratigraphic layers from both of the trenches. Trench logs and radiocarbon results<br />
will be presented.<br />
ONE-DIMENSIONAL ELASTIC MODELING OF FAULT SLIP RATES IN THE SALTON TROUGH,<br />
CALIFORNIA (A-058)<br />
E. Alaniz and S.F. McGill<br />
We used site velocities from <strong>SCEC</strong>’s Crustal Motion Model 4 (CMM4) to conduct one-dimensional elastic modeling for fault<br />
slip rates along a transect across the Pacific-North America plate boundary through the Coachella Valley, southern California.<br />
Our best-fitting model has slip rates of 18 and 16 mm/yr for the San Andreas and San Jacinto faults, respectively, with a small<br />
amount (2 mm/yr) of right-lateral slip inferred east of the San Andreas fault and 4 mm/yr on the Elsinore fault. Other models<br />
that fit the site velocities reasonably well have slip rates ranging from 16-20 mm/yr for the San Andreas and 14-20 for the San<br />
Jacinto fault. These results are for the Coyote Creek strand of the San Jacinto fault. Future models will also include the Clark<br />
fault.<br />
SEISMIC VELOCITY STRUCTURES IN THE SOUTHERN CALIFORNIA PLATE BOUNDARY<br />
ENVIRONMENT FROM DOUBLE-DIFFERENCE TOMOGRAPHY (B-023)<br />
A.A. Allam and Y. Ben-Zion<br />
We present tomographic images of crustal structures in the southern California plate boundary area, with a focus on the San<br />
Jacinto Fault Zone (SJFZ), based on double-difference inversions of earthquake arrival times. Absolute arrival times of over<br />
359,410 P- and S- wave phase picks for 5493 earthquakes recorded at 139 stations in Southern California are used. In addition<br />
to the absolute event-station traveltimes, the double-difference inversions utilize differential travel times for phases from<br />
nearby event pairs. Starting with a layered 1D model, and continuing in later iterations with various updated initial models,<br />
we invert the data for Vp and Vs in a 270 km long, 180 km wide and 35 km deep volume around the SJFZ using a spacevariable<br />
grid with higher density around the SJFZ. The examined volume stretches from Cajon Pass to the northernmost<br />
Imperial Fault Zone and includes portions of the southern San Andreas Fault (SAF), the Elsinore Fault, and the Brawley<br />
Seismic Zone in the Salton Trough. Because differential traveltimes are most sensitive to near-source structures, we obtain<br />
high resolution around the earthquake sources. After 24 iterations we improve the average travel time misfit by a factor of 20.<br />
Though ray coverage is limited at shallow depths, we obtain high-resolution images of seismic velocities from 3 to 16 km<br />
throughout much of the study area. Our final velocity model shows clear velocity contrasts across the SJFZ and the southern<br />
SAF as well as zones of low-velocity and anomalous Vp/Vs ratios associated with various fault strands and sedimentary<br />
basins. The NE side of the SJFZ has generally higher velocities than the SW block, and the contrasts of Vp are generally higher<br />
(up to 20%) than the contrasts of Vs (up to 15%). Near the San Jacinto valley to the NW, and the SE end of the SJFZ close to the<br />
Salton trough, the polarity of the velocity contrast in the shallow crust is reversed. For the southern SAF the NE side is<br />
generally the block with lower seismic velocities. The velocity reductions in fault zone regions are generally highest in<br />
geometrically complex areas (up to 25% in the top few km), and are higher for Vs than for Vp. The imaged features have<br />
important implications for various aspects of earthquake and crustal dynamics in the region.<br />
2011 <strong>SCEC</strong> <strong>Annual</strong> <strong>Meeting</strong> | 139
Poster Abstracts<br />
FUTURE DIRECTIONS FOR STUDIES OF PRECARIOUSLY BALANCED ROCKS (B-096)<br />
J.G. Anderson, G.P. Biasi, and J.N. Brune<br />
In October, 2010, a workshop sponsored by the US Geological Survey discussed applications of precariously balanced rocks<br />
(PBR) to the National Hazard Maps (Anderson et al., 2011, Seis. Res. Lett.). A rough consensus of participants is that PBRs are<br />
useful to test probabilistic seismic hazard analyses (PSHA). Inconsistencies are a reason to reexamine inputs to the PSHA, but<br />
uncertainties in PBR properties could affect the interpretation. Only a few of the hundreds of known rocks have received<br />
“state of the art” scrutiny that minimizes uncertainties.<br />
To improve usefulness of PBRs, participants identified several areas for future research. The major issues include dating,<br />
fragility, site response, extension to other environments, how to modify input to the PSHA, quantifying the difference between<br />
a site-specific PSHA and the USGS hazard curves, and the future of the PBR database.<br />
We are preparing a database linking photos of known PBRs with locations and available information about fragility and age.<br />
A protocol for dealing with apparent inconsistencies with a PSHA hazard curve will be needed. We tentatively suggest the<br />
following tests:<br />
Review of information about the PBR.<br />
• What are the uncertainties on rocking parameters and fragility?<br />
• What is the toppling direction?<br />
• What are uncertainties on age of the present geometry?<br />
• What are uncertainties in site response?<br />
• Can the inconsistency be resolved within these uncertainties?<br />
• Is the inconsistency supported by nearby PBRs?<br />
• What upper bound on the ground motions vector, and associated rates, would be consistent with the rock?<br />
• Review of input to the PSHA.<br />
• What critical events in the input cause the inconsistency?<br />
• Does data support the existence, magnitude, and rate of the critical events?<br />
• Could the inconsistency be caused by the ergodic assumption? Might single-station or single-station and singlepath<br />
sigma resolve the inconsistency?<br />
• Is the median of the ground motion prediction equation (GMPE) too high?<br />
• Could a consistent dynamic rupture effect (directivity, super-shear rupture, or step-over of rupture to adjacent<br />
faults) in the critical events resolve the inconsistency?<br />
• Could ground motions be consistently polarized, giving smaller amplitudes than the GMPE estimates in the<br />
most sensitive toppling direction of the PBR, while motion in a less sensitive direction is stronger?<br />
We propose this checklist to investigate inconsistencies and guide adjusting the input to the PSHA.<br />
INTEGRATING NONLINEAR SITE RESPONSE MODELS IN BROADBAND GROUND MOTION<br />
PREDICTIONS (B-094)<br />
D. Assimaki and W. Li<br />
We investigate the empirical relationship between site response nonlinearity, soil properties, and ground motion amplitude<br />
and frequency. Our nonlinear site response code developed under the auspices of <strong>SCEC</strong> is currently being integrated in the<br />
Broadband Ground Motion Simulation Platform v11.7, and overarching goal of this work is to quantify when nonlinear<br />
analyses should be employed in lieu of empirical amplification factors, thus enabling efficient integration of site response<br />
analyses in earthquake ground motion simulations. Due to lack of a statistically significant sample of ground motion<br />
recordings, we subject 24 downhole array site profiles with detailed geotechnical information to broadband synthetics that<br />
account for nonlinear site response, and use the surface predictions as our ground motion database. We quantify the extent of<br />
soil nonlinearity in site-specific response analyses by estimating the divergence between linear and nonlinear ground surface<br />
predictions. We show that the parameters controlling the nonlinear response are the weighted averaged shear wave velocity<br />
in the top 30m of the soil profile (Vs30), the site amplication at the fundamental frequency, the peak ground acceleration<br />
(PGA), and the frequency index (FI), a quantitative measure we define to characterize the proportion of incident seismic<br />
energy that is trapped in the near-surface soil layers. Using the synthetic results, we quantitatively describe the error<br />
introduced in ground motion predictions when nonlinear effects are not accounted for, and show that the error is both site and<br />
140 | Southern California Earthquake Center
Poster Abstracts<br />
ground motion dependent. Our study indicates that to characterize the susceptibility of a site to nonlinear effects, Vs30 should<br />
be complemented by measures of the soil-rock impedance contrast, as well as measures of the ground motion intensity and<br />
frequency content.<br />
GROUND MOTION AMPLIFICATION DURING THE M7.0 2010 HAITI EARTHQUAKE: TOPOGRAPHY OR<br />
SOIL EFFECTS? (B-095)<br />
D. Assimaki and S. Jeong<br />
Unusually severe structural damage was reported during the 2010 M7.0 Haiti earthquake in the vicinity of Hotel Montana,<br />
located on top of a ridge in the district of Pétionville. Prompted by the observations, USGS seismic stations were deployed,<br />
and aftershock recordings indicated ground motion amplification on the top of the hill compared to adjacent stations on<br />
reference site conditions. The presence of topographic relief has been shown to significantly aggravate the consequences of<br />
strong ground motion during past events, and topographic amplification was therefore brought forward to justify the<br />
observations. We here investigate the role of ground surface geometry in the recorded ground motions and corresponding<br />
damage concentration atop the foothill ridge of Hotel Montana by first conducting site-specific simulations that integrate<br />
Digital Elevation Maps (DEM) and shear wave velocity profiles collected at the site. Our analyses show that neither<br />
topography nor site amplification predictions alone sufficiently explain the ground motion amplification at the site estimated<br />
via aftershock recordings. Numerical simulations of the feature response on homogeneous halfspace quantitatively disagree<br />
with the field data both in amplitude and in frequency, while one-dimensional ground response analyses predict amplification<br />
in same frequency range as the field data, yet of significantly lower amplitude. We then conduct realistic simulations of the<br />
foothill ridge response with soil layering, and qualitatively demonstrate that the recorded amplification can be attributed to<br />
coupling of site and topography effects. This effect, referred to as topography-modified site amplification, describes seismic<br />
waves trapped in the soft soil layers of the near surface and simultaneously subjected to sediment-induced reverberations as<br />
well as diffraction and scattering. Parametric investigations of the topography-soil amplification coupling effects are then<br />
conducted, and results show that when accounting for a soil-bedrock interface at 100m depth, predictions are in excellent<br />
quantitative agreement with the observed motion.<br />
METHODS FOR ANALYZING THE EL MAYOR-CUCAPAH EARTHQUAKE RUPTURE USING LIDAR<br />
DATASETS (A-121)<br />
D. Banesh, M.E. Oskin, X. Wang, B. Hamann, and L. Kellogg<br />
The high-resolution terrestrial LiDAR scans of northern Mexico obtained after the April 2010, Mw7.2 El Mayor-Cucapah<br />
earthquake (post-earthquake data), along with aerial LiDAR scans of the same area from before the earthquake (preearthquake<br />
data), make possible an accurate examination of the shifts in the region due to the event. We present methods for<br />
analyzing the various shifts throughout the area. We make two assumptions: (1) at a local level, excluding the area around the<br />
fault line, the features have minimal deformation, and (2) any feature was translated no more than five meters, with an<br />
optional change in orientation of no more than 15 degrees. We have developed an effective technique, where we iterate<br />
though all the points of the pre-earthquake data, using for each point a disc with a radius of 10 meters centered around each<br />
sample point, and define a feature based on all the points in this disc. Since the resolution of the pre-earthquake data is less<br />
than that of the post-earthquake data, it makes sense to define the features using pre-earthquake points. In the postearthquake<br />
data set, we attempt to find the same feature by searching a ten-by-ten square meter grid centered at the same<br />
point as the feature from the pre-earthquake data set. Once a match has been determined, we draw a translation vector from<br />
the original position of the feature in the pre-earthquake data to the translated position of the feature in the post-earthquake<br />
data. As we draw one vector for each feature, we create a translation vector field that shows the movement caused by the<br />
earthquake.<br />
MOVIES OF SEISMIC WAVE PROPAGATION THROUGH THE IMPERIAL AND COACHELLA VALLEYS,<br />
SOUTHERN CALIFORNIA (A-143)<br />
M. Barba and J.M. Stock<br />
One of the greatest natural hazards that southern California may face in the future is a 180 km earthquake rupture along the<br />
southern segment of the San Andreas Fault. The Salton Seismic Imaging Project, a large-scale active source seismic study of<br />
southeastern California, was conducted to improve the understanding of the underground geometry of the San Andreas Fault<br />
and surrounding faults and sedimentary basins. In early 2011, temporarily deployed seismometers and permanent seismic<br />
stations located in Southern California recorded waveforms from controlled seismic shots. We used the waveforms to create<br />
2011 <strong>SCEC</strong> <strong>Annual</strong> <strong>Meeting</strong> | 141
Poster Abstracts<br />
movies of the propagation of the seismic waves across the region. Deviation from the concentric propagation pattern expected<br />
in a 1D velocity model highlights abrupt structural transitions, such as known and concealed faults, dipping layers, or lateral<br />
changes in velocity. Also shown are the arrivals and relative amplitudes of various seismic phases as they propagate across<br />
the network of seismometers. The movies will ultimately guide the development of the 3D seismic velocity model by<br />
identifying the locations and possible types of geological structural disturbances.<br />
EARTHQUAKE MOTIONS RECORDED ON A DENSE 5000-STATION NETWORK IN LONG BEACH, CA (B-<br />
048)<br />
M. Barba, R.W. Clayton, and D. Hollis<br />
We present detailed maps and movies of small local earthquakes recorded by a dense seismic network in Long Beach,<br />
California. The network consists of approximately 5,000 short-period, vertical sensors spaced an average 100m apart in a 7 by<br />
10 km area. The autonomous network recorded continuously (24 hours/day) for a period of 6 months. The results show local<br />
basins and faults, such as the Newport-Inglewood Fault (NIF), strongly focusing and diffracting wave fields, suggesting the<br />
existence of fault strands diverging from NIF. The apparent amplification varies significantly over the region. It is also clear<br />
that the coda has waves travelling in a wide variety of directions away from the direct path to the epicenter. By combining the<br />
maps of peak acceleration from a number of earthquakes, a detailed map of ground amplification can be constructed.<br />
A PHYSICAL MODEL OF THE MW 6 EARTHQUAKE CYCLE AT PARKFIELD (A-096)<br />
S. Barbot, N. Lapusta, and J.P. Avouac<br />
Advances in geophysical monitoring now provide an extensive set of observations of all aspects of the earthquake cycle. Yet,<br />
unifying physical models that connect these observations into a coherent picture are lacking. At the same time, laboratory<br />
experiments and theoretical developments provide an increasingly detailed understanding of the fault physics, offering the<br />
basis for an extrapolation to natural conditions.<br />
In this study, we bridge the gap between observations and fault physics by developing the first model of the full earthquake<br />
cycle that explains a number of interesting and robust observations of the crustal dynamics at Parkfield. Despite the<br />
similarities between the repeating Mw 6 earthquakes and their short recurrence times (from 12 to 32 years for 5 events until<br />
1966), the latest rupture of 2004 defied the odds by taking place a decade later than anticipated and initiating at the south end<br />
to propagate northward, contrarily to all previous events.<br />
We build our model of fault friction using the spatial patterns of microseismicity, the time series of GPS displacements in the<br />
1999-2010 period, the InSAR data, and the GPS offsets of the 2004 earthquake. We also consider the slip distribution of the<br />
1966 event and the historical catalog of recurrence times and hypocenter locations. We show the special role of microseismicity,<br />
which marks the transition between stable and unstable friction and circumscribes the seismogenic zone. We use the program<br />
BICYLE (Boundary Integral Cycles of Earthquakes) of Lapusta & Liu (2009) to solve the elasto-dynamic equations that govern<br />
the fault slip evolution. We obtain a sequence of Mw~6 earthquakes that can explain the observed variability of hypocenters<br />
and reproduce the geodetic observations of surface deformation in the co- and postseismic periods associated with the 2004<br />
event. The change of hypocenter between 1966 and 2004 and the delay of the latest event is consistent with the occurrence of a<br />
swarm of smaller-magnitude earthquakes during the 1992-1994 period and these two locations being close to the boundary of<br />
the seismogenic zone. Our study introduces a methodology capable of integrating seismological and geodetic observations<br />
into a coherent physical model of the earthquake cycle. Our approach can serve as an important tool to investigate the effect of<br />
other components of earthquake physics and to help understand and mitigate seismic hazards around active faults.<br />
CO-LOCATED PORE PRESSURE AND VOLUMETRIC STRAIN AT PLATE BOUNDARY OBSERVATORY<br />
BOREHOLES (A-070)<br />
A.J. Barbour and D.C. Agnew<br />
To establish the viability of pore-pressure instrumentation as a measurement of volumetric deformation in the solid rock<br />
matrix, we present initial studies, using Plate Boundary Observatory data, of the relationship between apparent areal strain<br />
and pore pressure in the same borehole. The areal strains are given by Gladwin borehole tensor strainmeters (BSM) (and in<br />
one case by longbase laser strainmeters). The pore-pressure is measured in a partially sealed, sand-packed region in an<br />
uncased section of the borehole containing the BSM. We find parameters relating pore pressure to atmospheric loading and<br />
tidal strains. Although these forces explain much of the pressure signal, residual pressures not associated with earthquakes<br />
have significant other changes (daily rms signal on the order of 1.5 hPa) attributable to a delay between stress and strain. As<br />
142 | Southern California Earthquake Center
Poster Abstracts<br />
this delay becomes large, or even frequency dependent, the degree of coupling between pore-fluid diffusion and elastic<br />
parameters in the rock becomes important. We also find that only very small quantities of non-atmospheric and non-tidal<br />
strain energy may be explained by pore pressure variation (roughly 0.1 nanostrain/kPa).<br />
Passing seismic waves that cause volumetric change also affect the pore pressure. Earthquakes at near and intermediate<br />
distances cause a postseismic response that decays withing a few days; this might manifest rapid, short-term changes in<br />
permeability by pore-sealing/opening, or changes in fracture-conduit flux, but is likely equilibration of pore-fluid diffusion.<br />
Our findings suggest that (1) The pore pressure measurement is stable over hours to weeks. (2) Strainmeters are less sensitive<br />
to typical post-seismic transient pressure changes. (3) There may be some level of frequency dependence between the two<br />
quantities. A major implication thus follows: Because the pore pressure transducers are apparently stable at long periods and<br />
may be more sensitive to fluid-related deformation than strainmeters are, they may be well poised to compliment tectonic<br />
deformation studies, assuming site effects may be understood and corrected for the subject of future work.<br />
CAUGHT IN THE ACT: EVIDENCE FOR SEISMIC ARREST ON NATURAL FRICTION-MELT-BEARING<br />
FAULTS? (A-093)<br />
W.M. Behr and J.P. Platt<br />
During seismic slip in the earth, frictional work is converted primarily into heat, and may cause melting of the material<br />
surrounding the fault plane at depth. The generation of melt will either lubricate the fault by decreasing the dynamic stress<br />
relative to the static stress, or it will act as a viscous brake that may impede or arrest the propagating earthquake rupture.<br />
Footwall rocks beneath the Whipple detachment fault in eastern California provide an opportunity to examine and potentially<br />
quantify this process, as they preserve brittle and ductile features characteristic of both steady-state and transient conditions.<br />
We compare natural measurements of static shear stress (τs), from recrystallized grain size paleopiezometry on quartz-rich,<br />
brittle-to-ductile shear zones, to natural measurements of the strain-integrated dynamic stress (τf) on adjacent<br />
pseudotachylite-bearing faults with measurable displacements. We find that minimum estimates of τf (56 ± 7 MPa) are within<br />
error of estimates of τs (60 ± 8 MPa), suggesting that the formation of melt did not cause lubrication and may have caused<br />
seismic arrest. The dynamic shear stress measurements are significantly higher than other published natural observations of<br />
pseudotachylites, but may be explained by the high clast content present in these fault zones, which would have significantly<br />
increased the melt viscosity.<br />
IMPLEMENTATION OF GIS LAYERS WITH A SPACE-TIME GRAPHICAL DISPLAY IN <strong>SCEC</strong>-VDO (A-158)<br />
A. Bernhard, T. Farhat, R. Lacey, A. Lim, S. Paseda, M. Rogers-Martinez, C. Sawyer, T. Jordan, R. de Groot, and N.<br />
Rousseau<br />
The 2011 Undergraduate Studies in Earthquake Information Technology (UseIT) development team was tasked with<br />
constructing a seismic sequence visualization system based on <strong>SCEC</strong>-Virtual Display of Objects (<strong>SCEC</strong>) and Geographic<br />
Information Systems (GIS). Working with the tools of Java3D,the developers implemented space-time earthquake display<br />
functionality as well as surface layers for major infrastructure and statistical maps. The space-time plot allows users to display<br />
earthquake sequences temporally while still referencing magnitude and geographic location. Other improvements include a<br />
more accurate display of topography and greater compatibility with shapefiles (datafiles containing statistical information that<br />
can be rendered into graphical displays) and other GIS layers. These advancements will create an informative and easily<br />
interpretable display of earthquake sequences, which will improve risk assessment and hazard preparedness.<br />
A MICROMECHANICS BASED CONSTITUTIVE MODEL FOR BRITTLE FAILURE AT HIGH STRAIN RATES<br />
(A-084)<br />
H.S. Bhat, A.J. Rosakis, and C.G. Sammis<br />
The micromechanical damage mechanics formulated by Ashby and Sammis [1] and generalized by Desh- pande and Evans [2]<br />
has been extended to allow for a more generalized stress state and to incorporate an ex- perimentally motivated new crack<br />
growth (damage evo- lution) law that is valid over a wide range of loading rates. This law is sensitive to both the crack tip<br />
stress field and its time derivative. Incorporating this feature produces strain-rate sensitivity in the constitutive re- sponse. The<br />
model is also experimentally verified by predicting the failure strength of Dionysus-Pentelicon marble over strain rates<br />
ranging from ~ $10^{-6}$ to $10^{3} s^{-1}$. Model parameters determined from from quasi-static experiments were used to<br />
predict the failure strength at higher loading rates. Agreement with experimental results was excellent.<br />
2011 <strong>SCEC</strong> <strong>Annual</strong> <strong>Meeting</strong> | 143
Poster Abstracts<br />
VECTOR-VALUED FRAGILITIES AND THE STATE OF THE ARCHIVE FOR PRECARIOUSLY BALANCED<br />
ROCKS (PBRS) IN SOUTHERN CALIFORNIA (B-081)<br />
G.P. Biasi, J.N. Brune, and A.W. Homan<br />
Precariously balanced rocks have been recognized as a valuable resource for constraining ground motion extremes at long<br />
return times in seismic hazard analyses and seismic hazard maps (e.g., Anderson et al., SRL, 2011).<br />
Rock survival is a non-linear function of rock geometry, size, and angles of contact from the rock center of gravity to the<br />
pedestal contact. Relationships of these parameters to rock overturning probabilities were developed through shake-table<br />
testing using ensembles of seismograms of varying amplitudes and shapes, and the results summarized in regressions by<br />
Purvance et al. (Eqk Eng’g and Struct. Dynam., 2008). Relationships can be displayed as a two-dimensional plot, typically with<br />
peak ground acceleration (PGA) on the horizontal axis and an intensity measure such as spectral acceleration (SA: SA1 and<br />
SA2 for 1 and 2 s periods, resp.) on another. These plots graphically illustrate combinations of rock ground accelerations and<br />
SA required for dynamic overturning.<br />
Parameters for vector valued (VV) overturning probabilities have been developed using 2-D photographic assessment of<br />
images in the PBR archive at the University of Nevada Reno. These parameters include rocking angles (alpha 1, 2) and<br />
dimensions (R1, R2). There are over 5800 images in the southern California region. We have completed the survey of this<br />
collection, and have tabulated 2-D static overturning acceleration estimates on over 1850 of them. The balance are primarily<br />
supporting photos of a variety of types. Locations have been tabulated for about 1000 rocks, and a focused effort is underway<br />
to complete this aspect of the archive. Based on the 2-D analyses, 580 have one or more directions in which the rock static<br />
overturning acceleration is ~1/4 g or less. About 550 rocks have parameters for VV assessment in terms of PGA vs. SA1 and<br />
PGA vs. SA2. Some fall outside the range of alphas or rock size in the Purvance et al. regressions. A database has been<br />
developed to manage the many overlapping analysis subsets and to support analysis of the combined data volume. We are<br />
presently evaluating VV analysis results for application to hazard assessment and seismic hazard mapping.<br />
SLIP RATES ON THE SOUTHERN SAN JACINTO FAULT AND HOLOCENE-LATE PLEISTOCENE<br />
KINEMATICS OF THE PACIFIC-NORTH AMERICAN PLATE BOUNDARY (A-152)<br />
K. Blisniuk, M. Oskin, W. Sharp, T. Rockwell, and K. Fletcher<br />
To better understand whether fault strength or loading rate fluctuate over time, we have been testing for slip rate variability<br />
on 6 sites across and along the sub-parallel Clark and Coyote Creek fault strands of the southern San Jacinto fault zone (SJFZ).<br />
To constrain the late Quaternary slip behavior, we measured and dated the displacement of well-preserved landforms offset<br />
on these fault strands at multiple locations and time intervals. Offsets are constrained from field mapping and high-resolution<br />
LiDAR topography data, and displaced alluvial fans were dated with U-series on pedogenic carbonate clast-rinds and/or in<br />
situ cosmogenic 10 Be. Preliminary results presented here in 2010 had suggested an increase in slip rate along the southern SJFZ<br />
from the late Pleistocene to the Holocene. New results, including forward modeling of 10 Be depth profile ages and 10 Be<br />
exposure age results on offset late Pleistocene alluvial fans at Anza (A.-S. Meriaux, pers. comm., 2011), indicate that we cannot<br />
discern whether slip rates have increased over the late Quaternary. Our results do, however, show a pronounced spatial slip<br />
rate variability during the late Quaternary. Over the past 50-30 kyr, slip rates along the Clark fault strand decreased<br />
southward from 13.5 +4.0 / -2.6 mm/yr at Anza, to 8.9 ± 2.0 mm/yr at Rockhouse Canyon, to 1.5 ± 0.4 mm/yr near Santa Rosa<br />
Mountain, as slip is transferred from the Clark fault strand to the Coyote Creek fault strand and to nearby zones of distributed<br />
deformation. Slip rates of up to ~14 to 18 mm/yr summed across southern SJFZ suggest that since the latest Pleistocene, the<br />
SJFZ may rival the southern San Andreas fault zone (12-22 mm/yr) in accommodating deformation across the Pacific-North<br />
America Plate boundary.<br />
EVALUATION OF TRANSIENT DEFORMATION FROM TWO DECADES OF CONTINUOUS GPS TIME<br />
SERIES ANALYSIS IN SOUTHERN CALIFORNIA (A-062)<br />
Y. Bock, S. Owen, B. Crowell, D. Dong, P. Fang, S. Kedar, Z. Liu, A. Moore, L. Prawirodirdjo, M. Squibb, and F. Webb<br />
As part of a NASA MEaSUREs project and its contribution to EarthScope, we are producing a combined 24-hour position time<br />
series for more than 1000 stations in Western North America based on independent analyses of continuous GPS data at JPL<br />
(using GIPSY software) and at SIO (using GAMIT software), using the SOPAC archive as a common source of metadata.<br />
Included are all EarthScope/PBO stations as well as stations from other networks still active (SCIGN, BARD and PANGA),<br />
and pre-PBO era data some already two decades old. The time series are appended weekly and the entire data set is filtered<br />
once a week using a modified principle component analysis (PCA) algorithm. Both the unfiltered and filtered data undergo a<br />
144 | Southern California Earthquake Center
Poster Abstracts<br />
time series analysis with QOCA software. All relevant time series are available through NASA’s GPS Explorer data portal and<br />
its interactive Java-based time series utility.<br />
After a comprehensive process of re-analysis and quality control, we have evaluated the time series for transient deformation,<br />
that is, time series that deviate from linear behavior due to coseismic and postseismic deformation, slow slip events, volcanic<br />
events, and strain anomalies. In addition, we have observed non-tectonic effects from hydrologic, magmatic and<br />
anthropogenic sources which are manifested primarily in the vertical but sometimes bleed over into the horizontal, making<br />
tectonic interpretation and transient detection difficult. We will present an overview of our analysis workflow as well as<br />
examples of transient deformation from Southern California, such as Diamond Valley Lake, an important water reservoir in<br />
Southern California.<br />
CISN SHAKEALERT: DEVELOPMENT OF A PROTOTYPE USER DISPLAY FOR PROVIDING<br />
EARTHQUAKE ALERTS TO END USERS (A-035)<br />
M. Boese, K. Solanki, T. Heaton, E. Hauksson, and the CISN EEW Team<br />
Over the past five years scientists from Caltech, UC Berkeley, ETH Zurich, USC/<strong>SCEC</strong> and USGS have been working on the<br />
development and implementation of a prototype earthquake early warning system for California. CISN ShakeAlert combines<br />
the outputs from three independently running algorithms, Tauc-Pd Onsite, Virtual Seismologist, and ElarmS. CISN<br />
ShakeAlert provides a continuum of earthquake alert information, including rapid estimates of magnitudes, locations, and<br />
expected seismic intensities and their uncertainties. For the rapid visualization of alert information and the notification of<br />
users in an easy understandable way, we have developed a Java applet that runs on a user computer and receives xml<br />
messages from the ShakeAlert system. This UserDisplay (UD) shows the user location, estimated epicenter of the earthquake,<br />
current locations of the P- and S-wave fronts, estimated magnitude, as well as the predicted level of intensity of shaking at the<br />
user site and time until this shaking is expected to occur. The UD pops up automatically once an alert message is received. The<br />
UD is currently being tested by approximately 30 test users.<br />
GPS CONSTRAINTS ON CRUSTAL DEFORMATION IN THE CENTRAL WALKER LANE AND SIERRA<br />
NEVADA FRONTAL FAULT (A-052)<br />
J.M. Bormann, W.C. Hammond, C.W. Kreemer , and G. Blewitt<br />
Between the Walker Lake and Lake Tahoe basins (~38.5-39.5° N latitude), the Walker Lane lacks strike-slip faults optimally<br />
oriented to accommodate the 8-10 mm/yr of geodetically observed northwest-directed dextral shear. In this region, geologic<br />
studies show that Quaternary active faulting is concentrated in a northwest–trending series of north-striking, normal faultbounded<br />
basins. Geomorphic and paleoseismic studies of the major basin-bounding faults result in normal slip rate estimates<br />
between ~0.3-2.5 mm/yr; however, the combined geologically determined slip rates do not sum to fulfill the Walker Lane<br />
shear budget.<br />
We use GPS data from UNR’s semi-continuous network MAGNET and EarthScope’s Plate Boundary Observatory to infer<br />
fault slip rates and vertical axis rotations of fault-bounded blocks in the central Walker Lane through an elastic block modeling<br />
approach. Comparisons between geodetically and geologically estimated normal slip rates on the basin-bounding faults show<br />
that 7 out of 8 geodetic estimates agree with geologic estimates to within uncertainties. However, GPS-based models predict<br />
dextral slip rates on the basin-bounding normal faults that are greater than or equal to the estimated normal slip rates,<br />
between 0.3-2.0 mm/yr. This prediction is not substantiated by paleoseismic and geomorphic fault studies, suggesting a<br />
systemic discrepancy between slip rates estimated from geologic and geodetic datasets.<br />
The sense of deformation across the Sierra Nevada frontal fault system at Mono Basin appears to predict left lateral slip and a<br />
higher rate of extension relative to other locations along the range front. The inferred sinistral shear is opposite to the sense of<br />
slip observed elsewhere in the Walker Lane. This pattern of anomalous deformation is sensitive to the selection of GPS sites<br />
used to define Sierra Nevada/Great Valley (SNGV) microplate, which experiences a low rate of deformation. Postseismic<br />
relaxation from historic earthquakes in California and Nevada contributes to SNGV deformation, making it difficult to define<br />
a rigid Sierra Nevada reference frame. We explore the effect of various definitions of the SNGV frame and the effect of<br />
correcting the GPS velocities for viscoelastic postseismic effects on our results.<br />
2011 <strong>SCEC</strong> <strong>Annual</strong> <strong>Meeting</strong> | 145
Poster Abstracts<br />
VISUALIZING COMPARATIVE HAZARD VULNERABILITY THROUGH GIS/SHAKEMAP INTEGRATION<br />
(A-157)<br />
S.C. Boss, F. Gutierrez, K.Y. Lin, T. Papikyan, and C.M. Valen<br />
The 2011 <strong>SCEC</strong> Undergraduate Studies in Earthquake Information Technology (USEIT) internship program challenged the<br />
Data Team to research information on specific earthquake sequences using global earthquake catalogs and incorporate the<br />
data into Geographic Information Systems (GIS). The internship focused on being able to integrate GIS into <strong>SCEC</strong>-Virtual<br />
Display of Objects (<strong>SCEC</strong>-VDO) software. The Data Team compiled information about six global earthquake sequences: the<br />
2010 Maule sequence in Chile, the 2010 Port-au-Prince sequence in Haiti, the 2011 Tohoku sequence in Japan, the 2010 El<br />
Mayor-Cucapah sequence in Mexico, the 2010 Canterbury sequence in New Zealand, and the 2004 Indonesian trench sequence<br />
in Sumatra. Information on population density, transportation routes, and infrastructure was located for each of the six<br />
countries and California. Data on hospitals, major airports, major roads, railways, and nuclear power plants was displayed<br />
onto maps in GIS. This information can be used to assess the hazards and the impact an earthquake could have on society. In<br />
addition, California data included locations of schools, fire stations, and police stations.<br />
The Data team also incorporated earthquake catalogs that were used to gather information on each sequence as well as focal<br />
mechanisms. Each earthquake sequence included the mainshock, aftershocks, and foreshocks. The global earthquake catalogs<br />
that were used included the National Earthquake Information Center Preliminary Determination of Epicenters (NEIC PDE)<br />
and the Global CMT (Global Centroid Moment Tensor). The Institute of Geologic and Nuclear Science (GNS) catalog was used<br />
to gather earthquake information in New Zealand. Research was also conducted on the ShakeMaps that <strong>SCEC</strong> created. All of<br />
the resulting information was then posted on the data team’s own website, which is <strong>org</strong>anized by corresponding countries.<br />
DO SMALL SURFACE STRAINS IN THE NEW MADRID SEISMIC ZONE REFLECT A PHYSICAL PROCESS?<br />
(B-152)<br />
O.S. Boyd, Y. Zeng, L. Ramirez-Guzman, and R. Smalley<br />
We reevaluate GPS data over the decade from 2000–2010 and model the resulting observations with local deformation<br />
mechanisms: viscoelastic relaxation subsequent to the 1811–1812 New Madrid, MO, earthquakes and slip across deeply buried<br />
finite dislocations to represent interseismic strain accumulation. The reevaluation of the GPS data accounts for outliers, offsets<br />
in the position time-series, and annual and bi-annual seasonal variations. Site velocities are found from the slope of the<br />
position time-series and are relative to a reference, which is the stack of all position time-series for a given component. We find<br />
that relative site velocities have a standard deviation of about 0.2 mm/yr with uncertainties on the order of 0.1 to 0.2 mm/yr<br />
or more. Uncertainty is difficult to estimate directly because the random walk component of noise, which contributes most to<br />
uncertainty in long geodetic time series, cannot be distinguished from the flicker and white noise components.<br />
Multiple models can account for some of the variance in the GPS data. A viscoelastic response of the crust from the 7 February<br />
1812 earthquake on the Reelfoot fault can account for 41% of the variance in the data. We perform an F-test and find that such<br />
a model has a 99% chance of being better able to match the data than does a null hypothesis. In this model, viscosity and slip<br />
are directly correlated such that increasing the viscosity by an order of magnitude requires an increase in slip by an order of<br />
magnitude to generate the same surface deformation. A viscoelastic response due to an earthquake on the Cottonwood Grove<br />
fault does not significantly improve our ability to model the data, but the lack of significance may be partly due to data<br />
limitations. Alternatively, a lower crustal right-lateral dislocation along the Cottonwood Grove fault slipping between 2 and 3<br />
mm/yr from 20 to 40 km depth can account for 25% of the variance and has a 70% chance of being better able to match the<br />
data than does a null hypothesis, while slip on a down-dip extension of the Reelfoot fault cannot significantly reduce the<br />
variance of the GPS data. These results suggest that having a good estimate of the subsurface rheology might allow for<br />
estimation of mean slip and magnitude of the 1811–1812 earthquakes as well as ongoing loading of the seismic zone.<br />
OPEN-SOURCE GROUND MOTION SELECTION USING THE GENERALIZED CONDITIONAL INTENSITY<br />
MEASURE (GCIM) APPROACH (B-013)<br />
B.A. Bradley<br />
The increasing use of time domain analysis is seismic assessment has resulted in a frequent requirement for site-specific<br />
ground motions. Many heuristic ground motion selection approaches have been proposed, and the use of a range of such<br />
methods has been shown to result a in large range of seismic performance statistics. A theoretically-founded ground motion<br />
selection methodology, based on the generalized conditional intensity measure (GCIM) approach, is presented. Both asrecorded<br />
and simulated ground motions can be selected using a semi-automated algorithm that requires only the specification<br />
146 | Southern California Earthquake Center
Poster Abstracts<br />
of a ‘weight vector’ which quantifies the hierarchy of importance of various ground motion intensity measures. A simple<br />
method allows an estimation of bias in seismic response analysis results due to improper ground motion selection. The<br />
methodology has been implemented in the open-source software OpenSHA to improve uptake in practice. The theoretical<br />
foundation of the methodology leads to the consistent computation of the seismic demand hazard, irrespective of the adopted<br />
conditioning intensity measure.<br />
STRONG GROUND MOTIONS OBSERVED IN THE 22 FEBRUARY 2011 CHRISTCHURCH EARTHQUAKE (B-<br />
055)<br />
B.A. Bradley and M. Cubrinovski<br />
On 22 February 2011 at 12:51pm local time, a moment magnitude M_w6.3 earthquake occurred beneath the city of<br />
Christchurch, New Zealand, causing an unparalleled level of damage and human causalities in the country’s history.<br />
Compared to the preceding 4th September 2010 M_w 7.1 Darfield earthquake, which occurred approximately 30km to the<br />
west of Christchurch, the close proximity of the 22 February event lead to ground motions of significantly higher amplitude in<br />
the densely populated regions of Christchurch. As a result of these significantly larger ground motions, structures in general,<br />
and commercial structures in the central business district in particular, were subjected to severe seismic demands and,<br />
combined with the event timing (12:51pm), structural collapses accounted for the majority of the 181 causalities.<br />
A preliminary assessment of the near-source ground motions recorded in the Christchurch region is conducted. Particular<br />
attention is given to the observed spatial distribution of ground motions which is interpreted based on source, path and site<br />
effects. Comparison is also made of the observed ground motion response spectra with those of the 4 September 2010 Darfield<br />
earthquake and those used in seismic design in order to emphasise the amplitude of the ground shaking and also elucidate the<br />
importance of local geotechnical and deep geologic structure on surface ground motions.<br />
EARTHQUAKE NUCLEATION MECHANISMS AND DAMAGE IN HETEROGENEOUS FAULT ZONES,<br />
PROBED WITH PERIODIC LOADINGS (IN MODELS AND EXPERIMENTS). (B-041)<br />
B.W. Brinkman, Y. Ben-Zion, J.T. Uhl, and K.A. Dahmen<br />
We study the response to stress oscillations of different periods and amplitudes in models and experiments, in order to<br />
improve the understanding of nucleation processes and evolving seismicity. The basic question is whether monitoring<br />
changes in observed seismicity can be used to identify the operative nucleation mechanism (or combination of mechanisms).<br />
We use a simple earthquake model (Ben-Zion 2008; Dahmen et al., 2009) to explain the frequency and amplitude dependence<br />
of slip nucleations seen in acoustic emission experiments on sheared rocks (Lockner 1999, Beeler 2003). We show comparisons<br />
of analytical results, numerics, and experiments. The results suggest new ways to estimate the rate at which frictional slips or<br />
earthquakes are nucleated. The application to earthquake faults suggests that seasonal stresses may be more likely to trigger<br />
large earthquakes than tidal stresses.<br />
References:<br />
Beeler, N.M., D.A. Lockner (2003). „Why earthquakes correlate weakly with the solid Earth tides: effects of periodic stress on<br />
the rate and probability of earthquake occurrence.” J. Geophys. Res.-Solid Earth 108.<br />
Ben-Zion, Y. (2008). Collective Behavior of Earthquakes and Faults: Continuum-Discrete Transitions, Evolutionary Changes<br />
and Corresponding Dynamic Regimes, Rev. Geophysics, 46, RG4006, doi:10.1029/2008RG000260.<br />
Dahmen, K.A., Y. Ben-Zion, and J.T. Uhl (2009). A micromechanical model for the deformation in solids with universal<br />
predictions for stress-strain curves and slip avalanches, Phys. Rev. Lett. 102, 175501.<br />
Lockner, David A. and Nick M. Beeler (1999). Premonitory slip and tidal triggering of earthquakes, J. Geophys. Res. 104,<br />
20,133-20,151.<br />
LOWER CRUSTAL ANISOTROPY IN THE MOJAVE DESERT REGION FROM ELECTRON BACKSCATTER<br />
DIFFRACTION (EBSD) MEASUREMENTS OF CRYSTAL PREFERRED ORIENTATION (CPO) (B-138)<br />
S.J. Brownlee, K. Wagner, and B.R. Hacker<br />
Seismic anisotropy is commonly used to infer flow directions in the mantle, but anisotropy in the mid and lower crust can be<br />
much more difficult to measure and to interpret. By measuring the crystal preferred orientations (CPOs) of minerals in lower<br />
crustal rocks we can calculate the anisotropic seismic properties of the aggregate using mineral single-crystal elastic constants<br />
2011 <strong>SCEC</strong> <strong>Annual</strong> <strong>Meeting</strong> | 147
Poster Abstracts<br />
and the Christoffel equation. This allows prediction of the expected lower crustal contribution to seismic anisotropy and<br />
improves our ability to interpret crustal anisotropy in terms of composition as well as deformation mechanisms. In the Mojave<br />
Desert region of southern California the crust is under-plated by the Pelona Schist, which due to its high mica content is<br />
expected to have significant seismic anisotropy. We measured mineral CPOs in 10 samples of the Pelona Schist using electron<br />
backscatter diffraction (EBSD) and then 148c 148 a 148 l 148c 148 u 148l148 a 148 t 148e 148d 148 148t 148h148e 148i 148r 148<br />
148 a 148 n 148 i 148 s 148 o 148 t 148 r 148 o 148 p 148 i 148 c 148 148 s 148 e 148 i 148 s 148 m 148 i 148 c 148<br />
148 p 148 r 148 o 148 p 148 e 148 r 148 t 148 i 148 e 148 s 148 . 148 148 T 148 h 148 e 148 148 P 148 e 148 l 148 o 148 n 148 a 148<br />
148S148c148h148i148s148t148 148d148i148s148p148l148a148y148s148 148a148 148r148a148n148g148e148 148o148f148<br />
148c148a148l148c148u148l148a148t148e148d148 148a148n148i148s148o148t148r148o148p148y148:148 148~1485148 148<br />
14831480148%148 148i148n 148 148V148p148,148 148a148n148d148 148~1487148 148 14841480148%148 148i148n 148<br />
148 V 148 s 148 148 ( 148 s 148 e 148 e 148 148 a 148 l 148 s 148 o 148 148 a 148 b 148 s 148 t 148 r 148 a 148 c 148 t 148 148 b 148 y 148<br />
148W148a148g148n148e148r148,148 148K148)148.148 148T148h148e148 148m148a148g148n148i148t148u148d148e148<br />
148 o 148 f 148 148 a 148 n 148 i 148 s 148 o 148 t 148 r 148 o 148 p 148 y 148 148 i 148 s 148 148 m 148 o 148 s 148 t 148<br />
148 c 148 l 148 o 148 s 148 e 148 l 148 y 148 148 r 148 e 148 l 148 a 148 t 148 e 148 d 148 148 t 148 o 148 148 t 148 h 148 e 148<br />
148 a 148 m 148 o 148 u 148 n 148 t 148 148 o 148 f 148 148 m 148 i 148 c 148 a 148 148 i 148 n 148 148 t 148 h 148 e 148<br />
148s148a148m148p148l148e148.148 148N148e148a148r148l148y148 148a148l148l148 148s148a148m148p148l148e148s148<br />
148h148a148v148e148 148a148p148p148r148o148x148i148m148a148t148e148l148y148 148u148n148i148a148x148i148a148l148<br />
148 s 148 y 148 m 148 m 148 e 148 t 148 r 148 y 148 148 i 148 n 148 148 t 148 h 148 e 148 i 148 r 148<br />
148c148a148l148c148u148l148a148t148e148d148 148v148e148l148o148c148i148t148i148e148s148,148 148w148i148t148h148<br />
148a148 148u148n148i148q148u148e148 148s148l148o148w148 148a148x148i148s148.148 148T148h148i148s148 148i148s148<br />
148a148 148c148o148m148m148o148n148 148a148s148s148u148m148p148t148i148o148n<br />
ACCURACY OF NON-DESTRUCTIVE TESTING OF PBRS TO ESTIMATE FRAGILITIES (B-080)<br />
J.N. Brune, R. Brune, G.P. Biasi, R. Anooshehpoor, and M.D. Purvance<br />
Prior studies of Precariously Balanced Rocks (PBRs) have involved various methods of estimating fragilities. These have<br />
included non-destructive testing (NDT) methods such as photomodeling, and potentially destructive testing (PDT) such as<br />
forced tilt tests. PDT methods have the potential of damaging or disturbing the rock or its pedestal so that the future<br />
usefulness of the PBR is compromised. To date we have force-tilt tested approximately 28 PBRs, and of these we believe 7<br />
have been compromised. We suggest here that NDT methods are now sufficiently advanced as to be adequate for comparison<br />
with Ground Motion Prediction Equations (GMPEs) and seismic hazard maps (SHMs). We compare tilt-test static toppling<br />
estimates to three non-destructive methods: (1) 3-D photographic modeling (2) profile analysis assuming the rock is 2-D, and<br />
(3) expert judgments from photographs.<br />
3-D modeling uses the commercial Photomodeler program and photographs in the field taken from numerous directions<br />
around the rock. The output polyhedral shape is analyzed in Matlab determine the center of mass and in Autocad to estimate<br />
the static overturning angle alpha.<br />
For the 2-D method we chose the photograph in profile looking perpendicular to the estimated direction of toppling. The rock<br />
is outlined as a 2-D object in Matlab. Rock dimensions, rocking points, and a vertical reference are supplied by the photo<br />
analyst to estimate the center of gravity and static force overturning angles. For the expert opinion method we used additional<br />
photographs taken from different directions to improve the estimates of the center of mass and the rocking points.<br />
We used 7 rocks for comparisons. The error in estimating tan alpha from 3-D modeling, 2-D estimates, and expert opinion are<br />
about 0.05, 0.1, and 0.06, respectively. Tilt-testing differs materially in one case from 3-D (*) because an irregular base on the<br />
rock allowed the rock to begin to tilt at a lower angle onto a second rocking point with higher alpha. 2-D methods generally<br />
perform well enough to use as a screening method for the larger archive. The following is a list of the tan alpha data:<br />
Method: Tilt, 3-D, 2-D, Expert<br />
Grass Valley 2: .31*, .50, .50, .47<br />
Lovejoy Buttes 5(NE): .33, .34, .20, .31<br />
Mead Valley West: .53, .53, .55, .53<br />
Pacifico: .22, .18, .29, .27<br />
148 | Southern California Earthquake Center
Perris2: .17, .16, .20, .23<br />
Poster Abstracts<br />
PRELIMINARY PALEOSEISMIC RESULTS FROM SOUTHERN CLARK FAULT, SAN JACINTO FAULT<br />
ZONE, SOUTHERN CALIFORNIA; COMPARISON TO THE HOG LAKE PALEOSEISMIC RECORD (A-148)<br />
M.T. Buga, T.K. Rockwell, and J.B. Salisbury<br />
We present preliminary results from a new paleoseismic site on the Clark strand of the San Jacinto Fault Zone in Clark (Dry)<br />
Lake, western Salton Trough, southern California. Based on morphological evidence, previous workers mapped multiple<br />
strands of the fault through Clark Lake. We excavated trenches across two of the prominent lineaments and found only minor<br />
cracking but no faults. In contrast, a trench across the most prominent lineament with a surface scarp exposed a major fault<br />
with clear evidence of recurrent activity. Based on these observations, it appears that most late Holocene slip along the Clark<br />
fault at Clark Lake is localized within a narrow zone. The main strand of the fault juxtaposes mid-Holocene lake deposits<br />
against late Holocene, inter-bedded lake and alluvial deposits. We identified past surface ruptures by the presence of filled<br />
fissures, upward fault terminations, angular unconformities, presence of growth strata, and abrupt vertical separations, from<br />
which we identify evidence for six surface ruptures that have occurred in the past 1600 years, yielding an average recurrence<br />
interval of 250-300 years. The two most recent events are likely the November 1800 and ca 1550 earthquakes, and correlate to<br />
events 1 and 2 at Hog Lake, ~50 km to the NW, based on mapping of small geomorphic offsets along the Clark fault. The 3<br />
earliest events are constrained to have ruptured between about 400 and 1250 AD and likely correlate to events 6, 7 and 8 at<br />
Hog Lake. Thus, we recognize only 1 event at Clark Lake that corresponds to the cluster of 3 events at Hog Lake, suggesting<br />
that some of the ruptures in the Hog Lake cluster correspond to rupture of the northern part of the zone, similar to the 1918<br />
rupture.<br />
SURFACE-EXPOSURE DATING OF SAN ANDREAS EARTHQUAKES (A-022)<br />
W.B. Bull<br />
Precise, accurate dating of prehistoric earthquakes provides verification of 40 years of stratigraphic dating at trenches<br />
excavated across the southern San Andreas fault. Radiocarbon dating of trench <strong>org</strong>anic material, created before or after times<br />
of surface ruptures, is much improved – thanks to being able to date many small-size samples, and to Bayesian modeling.<br />
Limits to what can be done were noted by Biasi and Weldon (2009, p. 496) who said “Dating precision alone is unlikely to ever<br />
be adequate to demonstrate correlations, especially among events relatively close in time.” But surface-exposure dating gives<br />
us a breakthrough to easily distinguish between two seismic shaking events in a decade, with a dating precision of ± 5 years.<br />
We now can date "seismically induced landslides (that are) induced at extraordinary distances" (Keefer, 1984; Harp, et al, 1993).<br />
Freshly exposed block and outcrop surfaces are colonized by lichens with known growth rates. I measure the largest lichen on<br />
many rockfall blocks at sites susceptible to seismic shaking, but not snow avalanches and rainstorms. Rockfalls 400 km away<br />
in Yosemite date to the times of southern San Andreas earthquakes of 1857 and 1812 AD. Previous Sierra Nevada work<br />
defined growth rates for four lichen genera that were used to date rockfall events in diverse altitudes and climatic settings.<br />
These four genera grow at the same rate in the San Jacinto, San Gabriel, and San Bernardino Mountains.<br />
Icehouse Canyon (San Gabriel Mountains) lichen sizes cluster nicely in separate peaks that date back to ~815 AD. Most of<br />
these seismic shaking events emanated from earthquakes that have been C 14 dated at eight trench sites between Carrizo and<br />
Indio. Closely spaced, distinct lichen-size peaks date as ~1503 and ~1490 AD (Also C 14 dated at Thousand Palms as ~1503 and<br />
at Wrightwood as ~1487 AD).<br />
Future work will collect data from many sites. Seismic shaking, and rockfall abundance, decrease away from an earthquake<br />
epicenter. Regional data modeling will map prehistoric seismic shaking of San Andreas events >Mw 7, and may assess the<br />
relative importance of earthquakes generated by the San Jacinto and Transverse Range fault zones.<br />
CONSEQUENCES OF THE ASSUMPTIONS REGARDING SEGMENTATION VERSUS NONSEGMENTATION<br />
OF THE SHORELINE FAULT WHEN ESTIMATING EARTHQUAKE POTENTIAL AND SEISMIC LOAD FOR<br />
DIABLO CANYON NUCLEAR POWER PLANT (DCNPP) (B-097)<br />
A. Bykovtsev and M. Kasimov<br />
The CALIFORNIA ENERGY COMMISSION held a day-long workshop “California Nuclear Power Plant Issues” in<br />
Sacramento on July 26, 2011. One of the main questions for discussion on Section 1 “Seismic/Tsunami Scenarios and<br />
Uncertainties for Diablo Canyon…” was “A recent USGS study in April 2011 concluded that, “There’s no objective evidence<br />
for any discontinuities or segmentation of the Shoreline Fault,” in contrast to PG&E’s conclusion in January 2011 the Shoreline<br />
2011 <strong>SCEC</strong> <strong>Annual</strong> <strong>Meeting</strong> | 149
Poster Abstracts<br />
Fault is segmented. An important “unanticipated” phenomenon in relation to the Mw 9.0 earthquake in Japan was that five<br />
segments along the subduction zone ruptured together, rather than independently as scientists had earlier predicted. What are<br />
the expected consequences of the assumptions regarding segmentation versus nonsegmentation of the Shoreline Fault when<br />
estimating earthquake potential?” Unfortunately, presenters were unable provide clear answers on situation related to the<br />
assumptions.<br />
The emergency in Japan (March 2011) provides as an important wake-up call for contribution. Tools and knowledge for the<br />
proper Seismic Hazard Analysis(SHA) nuclear plants located in California exist, and we cannot afford to ignore new<br />
information. During the last 6 months have spent our own money, time and effort we achieved preliminary results about<br />
assumptions regarding segmentation versus non-segmentation of the Shoreline Fault zone(SFZ) and San Luis Bay Fault<br />
Zone(SLBFZ) when estimating earthquake potential for DCNPP.<br />
Effect of SFZ and SLBFZ segmentations on simulation of long-period seismic motions (LPSM) and seismic load will be<br />
presented for DCNPP. As a result of the our analysis it is possible to conclude, that for the DCNPP site the segmentations of<br />
SFZ and SLBFZ introduce additional extremes for LPSM and effects of vibratory ground motion should be properly estimated<br />
in SHA and included in design of seismic load for DCPP. LPSM with multiple oscillations can cause severe nonlinear<br />
structural response and have become a crucial consideration in proper SHA of DCNPP due to cyclic load. The nature of such<br />
cyclic loading induces progressive alteration in the bearing capacity and head displacement of the foundation. This may lead<br />
to disastrous consequences (for example Japan- 2011 lessons). These findings should be investigated more accurately for<br />
proper SHA of DCNPP. We have very strong concerns about seismic issues at DCNPP and proper estimate of ground motions<br />
based on existing assumptions and approaches.<br />
BROADBAND CYBERSHAKE PLATFORM: SEISMOGRAM SYNTHESIS FOR BROADBAND PHYSICS-<br />
BASED PROBABILISTIC SEISMIC HAZARD ANALYSIS (A-038)<br />
S. Callaghan, P. Maechling, P. Small, K. Milner, R. Graves, T.H. Jordan, and the CyberShake Collaboration<br />
Researchers at the Southern California Earthquake Center (<strong>SCEC</strong>) have developed the CyberShake computational platform to<br />
perform probabilistic seismic hazard analysis (PSHA) in the Los Angeles region (Graves et al., 2010) using deterministic wave<br />
propagation simulations at frequencies up to 0.5 Hz. CyberShake uses seismic reciprocity to calculate synthetic seismograms<br />
for a suite of more than 600,000 rupture realizations. From this set of seismograms we compute intensity measures, which are<br />
then combined into a PSHA hazard curve for the site of interest.<br />
Here we report on expanded CyberShake capabilities. We have integrated the high-frequency computational capabilities of<br />
the <strong>SCEC</strong> Broadband Platform into CyberShake, producing the Broadband CyberShake Platform. The Broadband CyberShake<br />
Platform extends the frequency range up to 10 Hz by combining low frequency deterministic synthetic seismograms with<br />
higher frequency stochastic seismograms. We can now calculate physics-based seismograms and PSHA hazard curves for<br />
intensity measures such as PGA that are strongly dependent on higher frequency ground motions.<br />
We are applying our new broadband computational capabilities of the Broadband CyberShake Platform at southern California<br />
sites selected to support validation of this newly developed PSHA computational technique. This includes calculation of<br />
Broadband CyberShake seismograms and hazard curves at precariously balanced rock sites to validate our technique and to<br />
investigate the impact of higher frequencies on these fragile geological structures.<br />
We have also added functionality to calculate CyberShake seismograms using CVM-H v11.2 as well as CVM-S4. This enables<br />
us to compare seismograms and hazard curves generated with the two velocity models and determine the impact the choice of<br />
velocity model has on the predicted hazard. We have calculated seismograms and PSHA curves for southern California sites<br />
selected to improve our understanding of the contribution velocity model has on seismic hazard.<br />
TRIGGERED NON-VOLCANIC TREMOR FOLLOWING THE 2011 TOHOKU-OKI EARTHQUAKE (A-104)<br />
K. Chao, Z. Peng, D.P. Hill, D.R. Shelly, B. Enescu, B. Fry, and C. Aiken<br />
Non-volcanic tremor triggered by teleseismic surface waves was recently discovered in many different types of tectonic<br />
boundaries, mainly around major subduction zones around the Pacific Rim and the San Andreas Fault system in California.<br />
Here we present the observations of tremor around the world triggered by the 2011 Mw9.0 Tohoku-Oki, Japan earthquake.<br />
We identified clear tremor signals recorded at many stations at Parkfield of the San Andreas Fault in central California. The<br />
tremor begins around the ~100-sec period S-wave arrival with a minor burst coinciding with the SH-SH arrival as recorded on<br />
the nearby broadband station PKD. A more pronounced burst coincides with the Love arrival followed by a spike in tremor<br />
150 | Southern California Earthquake Center
Poster Abstracts<br />
amplitude with the Rayleigh wave. The triggered tremor was located at depths between 20 and 30 km beneath the surface<br />
trace of the fault with the burst coincident with the S wave centered beneath the fault 25 km NW of Parkfield. Most of the<br />
subsequent activity, including the tremor coincident the SH-SH arrival, was concentrated beneath a stretch of the fault<br />
extending from 10 to 40 km SE of Parkfield. Peak dynamic Coulomb stresses on the fault at tremor depths computed from<br />
peak amplitudes on the PKD station are in the range of 2 to 6 kPa. In comparison, only weak tremor signals were observed<br />
during the large-amplitude surface waves around the San Jacinto Fault (SJF) in southern California. The surface wave<br />
amplitudes and pre-event background noises in these two regions are similar, yet the triggered tremor amplitudes differ by<br />
nearly an order of magnitude. As was found in our previous studies (Chao et al., BSSA, 2011), we suggest that such difference<br />
could be related to different ambient tremor rate or tremor triggering threshold in these regions. In addition, we also<br />
identified clear triggered tremor in southwest Japan and southern Central Range in Taiwan during the Tohoku-Oki mainshock<br />
and some large aftershocks. In comparison, the triggered tremor signals are relatively weak in northern Central Range in<br />
Taiwan, and the North Island in New Zealand. We plan to investigate in details possible controlling factors that affect the<br />
tremor triggerability in these regions.<br />
GLOBAL SEARCH FOR DEEP TRIGGERED TREMOR (B-039)<br />
K. Chao, Z. Peng, B. Enescu, C. Wu, and B. Fry<br />
Deep “non-volcanic” tremor has been observed at many major plate-boundary faults. Recent studies have shown that<br />
triggered tremor occurs on the same fault patches as ambient tremor and can be used as a proxy to estimate background<br />
tremor activity. Following our previous studies, here we conduct a global search for tremor triggered by teleseismic<br />
earthquakes with Mw ≥ 7.5 between 2001 and 2011. We focus on regions in southwest Japan and the North Island of New<br />
Zealand. In southwest Japan, we found a total of 16 teleseismic earthquakes associated with clear triggered tremor during the<br />
passing surface waves. Using standard envelope cross-correlation techniques, we found that the triggered tremor is located<br />
close to the regions where ambient tremor is identified previously. Thus far, in New Zealand, we have only identified 4 events<br />
associated with triggered tremor in the North Island. Next, we calculate the dynamic stress loading and compare the stress<br />
threshold of triggering with the following regions: the Parkfield section of the San Andreas Fault in central California (CC),<br />
the Calaveras Fault in northern California (NC), the San Jacinto Fault in southern California (SC), the southern and northern<br />
Central Range in Taiwan, and the Vancouver Island in Cascadia. The apparent triggering threshold in southwest Japan is<br />
around 3-4 KPa, close to the triggering threshold at Parkfield (2-3 KPa) and southern Central Range in Taiwan (7-8 KPa). Our<br />
systematic survey of triggered tremor around the world not only helps to better clarify the relationship between triggered and<br />
ambient tremor, but also provide a clue to understand the necessary conditions and underlying physics of tremor generation.<br />
INVESTIGATION OF THE HECTOR MINE EARTHQUAKE SURFACE RUPTURE WITH AIRBORNE LIDAR<br />
DATA (A-132)<br />
T. Chen, D.Z. Zhang, S. Akciz, and K.W. Hudnut<br />
The 16 October 1999 Hector Mine earthquake (Mw7.1) generated significant surface rupture along the Lavic Lake Fault<br />
through almost 60 kilometers of sparsely vegetated, relatively barren desert terrain. It was the first large earthquake for which<br />
post-earthquake airborne LiDAR, collected to image the fault surface rupture, exists. Despite the lack of pre-earthquake highresolution<br />
topographic data, we were able to make both horizontal and vertical displacement measurements, which<br />
complement published field investigation results that include ~254 data points (164 of which are within LiDAR coverage area).<br />
We made 255 new horizontal and 83 vertical displacement measurements using a 0.5 m DEM generated from the LiDAR<br />
dataset. The maximum horizontal offset value is 6.6±1.1 m, and is located approximately ~700 m south of the maximum<br />
horizontal offset observed during the field work. The average horizontal offset value from LiDAR measurements is ~2.27 m,<br />
whereas the average calculated from field data is ~2.5 m. The maximum vertical displacement is ~1.2 m, and the average<br />
vertical offset value is less than 1 m. No consistent trends are apparent in the sense of the vertical component, except in the<br />
north of the mountainous section, which is predominated by east-side-down measurements.<br />
Compared to field data, LiDAR-based measurements (a) have larger measurement uncertainties, (b) have slightly higher<br />
values, (c) do not include many measurements of offsets
Poster Abstracts<br />
from different angles to better identify possible offset features. Overall, the LiDAR measurements compare well within a<br />
reasonable level of expectation with the field observations. The objective of attempting to attain a greater number of<br />
observations was achieved, but the measurements had more uncertainty than did the field observations.<br />
STATISTICAL ANALYSIS OF 71 BURSTS IN SOUTHERN CALIFORNIA (B-071)<br />
X. Chen, P.M. Shearer, and R. Abercrombie<br />
We analyze 69 out of the 71 bursts in Southern California from Vidale and Shearer [2006] with LSH catalog locations. We<br />
apply a weighted least- squares method to model the spatial migration behavior, finding the best- fitting migration directions<br />
and velocities. We then compute a statistical migration significance sm with a bootstrap resampling method for each burst. We<br />
define 37 bursts with sm≥ 0.8 as the migration group, and 32 bursts with sm< 0.8 as the non-migration group. To better<br />
distinguish the two groups, we compute a set of parameters including effective stress drop Δσ (ratio between total moment<br />
and radius), skew of moment release time series µ, timing of largest event tmax, and distance separation between the first half<br />
and second half of the sequence (ds). As expected, the migration group features higher ds and lower Δσ, consistent with higher<br />
migration significance. It also features lower µ and higher tmax, similar to swarms in the Salton Trough [Chen and Shearer,<br />
2011], while the non-migration group is more similar to mainshock-aftershock sequences. To explore possible fluid<br />
involvement, we model the migration behavior with the fluid diffusion equation, and identify 18 bursts with diffusion<br />
coefficients ranging from 0.01 to 0.8 m 2 /s, with the majority below 0.16 m 2 /s. The 18 bursts are mostly associated with normal<br />
faulting mechanisms, while the non-migration group has the most reverse faulting mechanisms, indicating a possible link<br />
between sequence type and focal mechanism.<br />
APPROACHES FOR HIGH – PERFORMANCE WAVEFORM CROSS CORRELATION (B-073)<br />
R.J. Chen, G.C. Beroza, and W.L. Ellsworth<br />
Repeating earthquakes and low-frequency earthquakes exhibit very similar seismograms. Comparing waveform similarity is<br />
an essential task for detecting either events, but it is computationally expensive due to enormous amounts of continuous data<br />
needed to be analyzed. In this study, we examine seismograms from earthquakes on the San Andreas Fault near Parkfield and<br />
test the efficiency of several algorithms for measuring waveform similarity. We start with the standard similarity measure,<br />
where we take a window of a sample seismogram as a template and compare it with another seismogram using the<br />
correlation coefficient as our benchmark. To test this, we use several approaches. First, we decrease the computations required<br />
by using only alternate data points in the analysis to see if the results are sufficiently accurate. We then try another approach<br />
in which we parameterize the seismograms using only the peaks and troughs as the basis for a different similarity measure<br />
that might have sufficient accuracy. Our goal in these approaches is to develop algorithms that are sufficiently efficient to<br />
apply to continuous waveform data.<br />
RESULTS FROM THE QUAKE-CATCHER NETWORK RAPID AFTERSHOCK MOBILIZATION PROGRAM<br />
(QCN-RAMP) IN CHRISTCHURCH, NEW ZEALAND (B-078)<br />
A.I. Chung, E.S. Cochran, C. Christensen, A.E. Kaiser, and J.F. Lawrence<br />
Following the 4 September 2010 M7.1 Darfield earthquake in New Zealand, we initiated a QCN Rapid Aftershock<br />
Mobilization Program (RAMP). 180 low-cost 14-bit USB accelerometers were quickly installed to record as many aftershocks<br />
as possible. Earlier in 2010, the QCN team deployed about 100 accelerometers in Chile following the M8.8 earthquake there<br />
and began experimenting with our rapid earthquake detection and characterization program. Following the New Zealand<br />
RAMP deployment, we continued to test this program with the more densely spaced Christchurch QCN array.<br />
When the Christchurch event occurred on 22 February 2011, QCN sensors recorded the M6.3 event and calculated its<br />
magnitude, location and created a map of estimated shaking intensity within 7 seconds of the earthquake. Successive<br />
iterations improved the calculations and within 24 seconds of the earthquake, magnitude and location values comparable to<br />
those provided from GNS were calculated.<br />
Using the wealth of data from this event as well as the following aftershocks, we have been able to improve our detection and<br />
identification algorithms. Whilst still in the development stages, our preliminary results from the data collected from these<br />
and other QCN stations around the world suggest that MEMS sensors installed in homes, schools, and offices provide a way<br />
to dramatically increase the density of strong motion observations for use in seismic hazard analysis and earthquake early<br />
warning. We are continuing to expand our network and have recently started deploying QCN sensors to the San Francisco<br />
Bay Area and Los Angeles areas.<br />
152 | Southern California Earthquake Center
Poster Abstracts<br />
COMPARISON OF CO-LOCATED PORE PRESSURE AND STRAIN OBSERVATIONS FROM EARTHQUAKES<br />
RECORDED AT PBO BOREHOLE STRAINMETER SITES. (A-071)<br />
F. Civilini<br />
Water level fluctuations in response to earthquakes and tidal strains have been observed in wells for many decades. The<br />
relationship between water level and dilatation can be used to characterize the well as a type of strainmeter. The correlation<br />
between the water level of an aquifer and the induced strain due to the earth tidal force is a well documented relationship, and<br />
can be used to calibrate various constitutive equations of a poroelastic medium to obtain Skempton’s coefficient, a variable<br />
describing the effect of induced strain on pore pressure. The pore pressure response of the October 1999 Hector Mine<br />
earthquake (Mw 7.1) at the Garner Valley Downhole Array (GVDA) is compared to pore pressure and strain observations<br />
from two stations of the EarthScope Plate Boundary Observatory (PBO) for three magnitude 4.9 and above earthquakes in<br />
2010: an El Mayor-Cucapah aftershock Mw 5.7 and two events of Mw 4.9 and Mw 5.4. These earthquakes were recorded at<br />
distances of ~97 Km, ~20 Km, and ~14 Km, respectively. Sudden pore pressure steps, both positive and negative, ranging from<br />
500 Pa to 10 KPa are observed in all but one of the records, with the later being a more gradual decrease. The strain records for<br />
the same earthquakes reveal sharp and sustained changes of strain matching the pore pressure behavior. This suggests that in<br />
at least some of the cases, the observed pore pressure responses correspond to tectonic deformation caused by the strain field<br />
associated with the earthquakes. The similarity of the pore pressure step during the 1999 Hector Mine event to those of the<br />
2010 earthquakes suggests that a this response was also related to the co-seismic tectonic strain field.<br />
COMPARISON OF THE LOW-COST MEMS ACCELEROMETERS USED BY THE QUAKE-CATCHER<br />
NETWORK AND TRADITIONAL STRONG MOTION SEISMIC SENSORS (B-025)<br />
E.S. Cochran, J.F. Lawrence, A. Kaiser, B. Fry, and A. Chung<br />
Accelerometers based on low-cost micro-electro-mechanical systems (MEMS) have improved swiftly, making the rapid<br />
deployment of dense seismic arrays possible. For example, the Quake-Catcher Network (QCN) makes use of MEMS-based triaxial<br />
sensors installed in homes and businesses to record earthquakes, with almost 2000 participants worldwide. QCN utilizes<br />
an open-source distributed-computing system, called the Berkeley Open Infrastructure for Network Computing (BOINC), to<br />
retrieve waveforms from continuous or triggered recordings back to the QCN server. Furthermore, the QCN approach can<br />
also be used to augment existing seismic networks for rapid-earthquake detection purposes, as well as studies on seismic<br />
source- and site-related phenomena.<br />
Following the 3 September 2010 Mw7.1 Darfield earthquake, 192 QCN stations were installed in a dense array to record the<br />
on-going aftershock sequence in and around the city of Christchurch. We examine the peak ground motions recorded during a<br />
M5.1 aftershock and find that peak ground acceleration (PGA) is spatially variable, but with a clear decay in amplitude with<br />
distance. In general, closely located GeoNet and QCN stations report similar PGA. Several QCN stations were located within 1<br />
km of existing GeoNet stations, providing an opportunity to compare time series and amplitude spectra. For these closely<br />
spaced pairs of stations, the amplitude spectra observed from the horizontal components are highly correlated with average<br />
cross-correlation coefficients of 0.9 or higher. In addition, we find the correlation coefficient decreases with increasing distance<br />
between station pairs.<br />
COMPARISON OF SIMULATED SLOW SLIP EVENTS WITH OBSERVATIONS (A-101)<br />
H.V. Colella, J.H. Dieterich, and K.B. Richards-Dinger<br />
We model slow slip events (SSEs) after those observed along the Cascadia subduction zone using the 3D simulation code,<br />
RSQSim, which employs rate- and state-dependent constitutive properties appropriate to the mode of fault slip. For<br />
computational efficiency we impose the slip speed for SSEs, otherwise the simulations are fully deterministic in the nucleation,<br />
propagation speed, extent of slip, and final distribution of slip. To develop robust statistical characterizations of slow slip<br />
events, we generate long histories consisting of more than 105 events (spanning ~300-500 yrs). The simulated catalogs of SSEs<br />
span a large range of moments, most of which would be too small to detected geodetically. The largest simulated SSEs<br />
(Mw6.3-7.0) are in broad agreement with SSEs observed in Cascadia with a quasi-periodic recurrence interval ~10 months,<br />
durations of 10-40 days, and a mean slip of ~3 cm. Results also show spontaneous, but transient, segmentation of SSEs. The<br />
simulations also produce slip propagation characteristics similar to complex tremor patterns observed in Cascadia (i.e. rapid<br />
tremor reversals and along-dip streaking). Stressing rates at the base of the seismogenic zone, directly adjacent to the region in<br />
which SSEs occur, may be as much as 100x more than the stressing rate between events. This suggests a potential for<br />
triggering of mega-thrust earthquakes by SSEs.<br />
2011 <strong>SCEC</strong> <strong>Annual</strong> <strong>Meeting</strong> | 153
Poster Abstracts<br />
DISCOVERING THE GEOMORPHIC RECORD OF HOLOCENE SLIP ALONG THE MOJAVE SECTION OF<br />
THE SAN ANDREAS FAULT, CALIFORNIA (A-137)<br />
T. Compton, E. Cowgill, R. Gold, K. Scharer, R. Westerteiger, and T. Bernardin<br />
Constructing long (10-100 kyr) records of fault slip is important for advancing our understanding of fault-system behavior and<br />
temporal variations in strain release. Paleoseismic data along the Mojave section of the San Andreas fault (MSAF) suggest<br />
temporal variations in strain release over the last 2 kyr, but more offsets are needed to extend the slip history back in time. We<br />
use virtual-reality analysis of LiDAR data and field observations to discover a more complete record of potential piercing<br />
points from offset Holocene landforms along the MSAF. Compilation of previously reported landform offsets reveals four<br />
gaps in the Holocene slip record at: 30-40m, 50-90m, 100-120m, and 130-360m of cumulative offset. Using new virtual-reality<br />
visualization software Crusta, we studied a 100km-long section of the B4 airborne LiDAR dataset to identify offset landforms<br />
within these offset intervals. Crusta is a virtual globe application that displays large (>60GB) LiDAR digital elevation models,<br />
merging the mapping functionality of ArcMap with the terrain visualization of GoogleEarth. The slicer tool in Crusta allows<br />
the user to interactively reconstruct fault slip by defining a piecewise linear fault plane and incrementally moving one block<br />
relative to the other in any direction on the plane. This tool has been helpful in identification, evaluation and reconstruction of<br />
landform offsets. Using Crusta, we have remotely identified 80+ landform offsets from 20 to 300m along the MSAF. Assuming<br />
an average Holocene slip rate of ~3cm/yr, these offsets span the Holocene. A majority (54) of the offsets cluster in<br />
displacements of 1 TB), high-resolution topographic data sets such as<br />
from airborne LiDAR. Using this tool, we have identified > 80 potential piercing points along a ~100-km-long reach of the<br />
Mojave section of the San Andreas fault, California. To evaluate such sites, we have expanded the conceptual understanding<br />
of potential sources of epistemic uncertainty in the combined structural and geomorphic reconstruction of faulted landforms.<br />
To reduce such uncertainties, we use ground-based LiDAR to image faulted landforms and determine the 3D slip vector and<br />
its associated uncertainty via Monte Carlo analysis. Such analysis has yielded error envelopes at two sites studied along the<br />
Dixie Valley fault in Nevada that were 16% and 83% of offset uncertainties previously reported. Finally, we have developed a<br />
Monte Carlo approach for determining slip histories from suites of faulted landforms that allows us to determine both precise<br />
average slip rates and evaluate the extent to which such rates varied over time. Application of this method to data we<br />
collected along the central Altyn Tagh fault, China, reveals a pulse of accelerated strain release in the mid Holocene, with ~20<br />
m of slip being released from ~6.7 to ~5.9 ka at a short-term rate (~28 mm/yr) that is 3 times greater than the average rate (~9<br />
mm/yr). We interpret this pulse to represent a cluster of two to six, Mw > 7.2 earthquakes. To our knowledge, this is the first<br />
possible pre-historic earthquake cluster detected using slip-history analysis.<br />
MOHO DISCONTINUITY STUDY ALONG SAN ANDREAS FAULT WITH RECEIVER FUNCTIONS (B-135)<br />
P.A. Cox, P.M. Davis, and R.W. Clayton<br />
We have calculated radial and transverse teleseismic receiver functions at 25 seismic stations along San Andreas Fault (SAF)<br />
between Eastern San Gabriel Mountains and Salton Sea. Near 8 km large offsets on the Moho beneath the SAF in the Eastern<br />
San Gabriel Mountains were observed (Yan & Clayton 2007), but no clear evidence for the offsets beneath the SAF have been<br />
154 | Southern California Earthquake Center
Poster Abstracts<br />
found at other stations. Our objective is to extend the study to Salton Sea rift zone along the SAF using more recent data and<br />
newly installed stations, and to examine topographic structure of the Moho and its variation across the fault. The purpose of<br />
this study is to understand earthquakes by determining seismic properties of the lithosphere. If sharp topography can be<br />
observed on the Moho, that will be evidence of lower crust having enough strength to hold vertical offsets. Our data shows 30<br />
to 37 km depth Moho beneath the Eastern San Gabriel Mountains, and much shallower Moho depth of 14 to 20 km beneath<br />
Salton Sea. Moho depth seems to vary as a function of azimuth, becoming less north to south. We are testing whether the<br />
variation is due to offsets, dip or anisotropy.<br />
References: Yan, Z., Clayton, R.W., 2007, A notch structure on the Moho beneath the Eastern San Gabriel Mountains: Earth and<br />
Planetary Science Letters 260 (2007) 570-581<br />
2011 <strong>SCEC</strong> <strong>Annual</strong> <strong>Meeting</strong> | 155
Poster Abstracts<br />
STRESS DROP OBSERVATIONS FOR THE 2010 EL MAYOR AFTERSHOCKS WITH 4.0
Poster Abstracts<br />
This poster will provide an update on the OpenTopography Facility, including processing capabilities and resources,<br />
examples from scientific use cases, a snapshot of system and data usage thus far, and a discussion of ongoing and planned<br />
work.<br />
DETECTION OF TRANSIENT DEFORMATION IN SOUTHERN CALIFORNIA USING CONTINUOUS AND<br />
CAMPAIGN GPS MEASUREMENTS (A-063)<br />
B.W. Crowell and Y. Bock<br />
Detection of small regional transient deformation remains an elusive problem within GPS geodesy, and automated detection<br />
of such events has proven to be more difficult. Here we report on an analysis of 10 years of continuous and campaign GPS<br />
data throughout southern California from 2000-2010, with the main areas of focus in the Imperial and Coachella Valleys. We<br />
first investigate small changes in yearly interseismic velocities in continuous GPS records compared to their long term<br />
interseismic estimates and compute the resulting change in the strain rate over a given year. Using this methodology, we are<br />
able to identify a number of known events such as the 2005 Obsidian Buttes and 2009 Bombay Beach seismic swarms. We take<br />
this further by utilizing campaign GPS measurements before and after the 2005 Obsidian Buttes seismic swarm to further<br />
constrain the extent of deformation. Our second approach utilizes a spatio-temporal principal component analysis (PCA) on a<br />
100 day moving window of continuous GPS data over a radius of 250 km. Using this approach, we are able to pick out smaller<br />
scale changes on the GPS time series, when compared with basic least-squares time series parameter estimation, by looking at<br />
the ratio of the first two eigenvalues of the PCA. Our spatio-temporal PCA analysis has the added benefit of potentially<br />
contributing to an automated anomaly (e.g., offsets) detection algorithm during modeling and quality control of continuous<br />
GPS time series.<br />
DEVELOPING A THREE-DIMENSIONAL GEOLOGICAL AND GEOPHYSICAL MODEL OF SIERRA NEGRA<br />
VOLCANO OF THE GALAPAGOS (B-024)<br />
L.C. Davidge and C. Ebinger<br />
Basaltic shield volcanoes in the Western Galapagos Island chain are among the most rapidly deforming volcanoes in the world,<br />
but little has been done to visualize the geological deformation of the area and to study the consequent subsurface<br />
microfaulting. By implementing the iterative double-difference earthquake relocation algorithm (Waldhauser & Ellsworth,<br />
2000), high-resolution hypocentral locations of local quakes can be determined. The seismic data that was analyzed was<br />
recorded by seismometers deployed around the caldera of the Sierra Negra volcano between 2009 and 2011. Both catalogue<br />
arrival times and cross-correlated arrival times were used to relocate the hypocenters. Additionally, <strong>SCEC</strong>-VDO was used to<br />
visualize these high-resolution earthquakes and this visualization was supplemented with preexisting bathymetry and INSAR<br />
images of the region. The resulting visualization facilitates a more accessible analysis of the earthquakes occurring along the<br />
southeast flank of the shield complex, and it also allows for better visualization of zones interpreted as hydrofracture along the<br />
margins of magma chamber(s). The subsurface imaging does not resolve the angle of reverse faults, which have near-vertical<br />
and shallow focal planes. The time-dependent visualization of earthquakes in this area produced with <strong>SCEC</strong>-VDO also<br />
enables non-experts to gain an understanding of geohazards in the Galapagos region and relates findings of regional research<br />
in a way that is more visually appealing to the general public.<br />
SHAKEOUT DRILL PLANNING AND EVALUATION AT CSU FULLERTON: A CASE STUDY (A-007)<br />
L.A. Davis, A. Leslie, A. Nguyen, and M.M. Wood<br />
Development of the California ShakeOut earthquake scenario in 2008 by the USGS provided a foundation for conducting<br />
earthquake drills. Since that time, ShakeOut earthquake drills have been conducted annually by an unprecedented number of<br />
individuals and <strong>org</strong>anizations, including colleges and universities. California State University Fullerton (CSUF) is one such<br />
institution attempting to maximize the impact of the ShakeOut drills under the direction of an ad hoc planning group<br />
consisting of CSUF faculty, staff, and administrators. Efforts have been made to improve future campus ShakeOut events<br />
through review and evaluation of previous CSUF ShakeOut activities. Recommendations were developed through review of<br />
prior ShakeOut questionnaires and evaluation reports; review of qualitative evaluation data; and informal interviews<br />
conducted with members of the ShakeOut Evaluation subcommittee, ShakeOut stakeholders, and Southern California<br />
Earthquake Center staff. Recommendations include developing a logic model to guide program design and evaluation,<br />
expanding collaboration and drill-integration with community groups, mapping pre-event and post-event staged messaging,<br />
and conducting a campus-specific survey of administrators, faculty, staff, and students. These efforts may foster the<br />
development of a prototype that can be used by other campuses to facilitate their own ShakeOut planning and evaluation.<br />
2011 <strong>SCEC</strong> <strong>Annual</strong> <strong>Meeting</strong> | 157
Poster Abstracts<br />
TEACHERS USING CONTINUOUS GPS DATA TO LEARN ABOUT EARTHQUAKES - SHARING RESEARCH<br />
RESULTS IN THE CLASSROOM THROUGH LESSON STUDY (A-005)<br />
R.M. de Groot, S.F. McGill, B. Vargas, R. Ruiz, M. Kline, and S. Wallace<br />
This EarthScope-funded project is a collaboration between high school science teachers and their students, undergraduate and<br />
graduate students, and faculty from California State University San Bernardino (CSUSB), University of Arizona, and the<br />
Southern California Earthquake Center (<strong>SCEC</strong>). As high school teachers and their students work alongside one another, they<br />
are exposed to and contribute to an authentic research process that will lead to publishable results. The scientific goal of this<br />
project is to measure plate tectonic movement within the San Bernardino mountain area and the Inland Empire region of<br />
Southern California utilizing the Global Positioning System (GPS). Teachers and high school students collected survey-mode<br />
GPS data from 11 sites (among a total of 25 sampled by the larger group of participants) during a 5-day campaign in July 2011.<br />
The information obtained will be useful for understanding and characterizing seismic hazards in that region of Southern<br />
California. To enhance this experience, all of the teachers and their students have been invited to present their results at the<br />
<strong>SCEC</strong> <strong>Annual</strong> <strong>Meeting</strong> in September 2011. As part of the classroom implementation phase of the program the teachers are<br />
introduced to the Lesson Study approach. Lesson Study is a professional development process where teachers systematically<br />
examine their practice with the goal of becoming more effective. This process centers on teachers working collaboratively on a<br />
small number of Research Lessons. First, they identify the areas where their students are encountering challenges in learning<br />
standards-based content. The challenging areas are identified through results from standardized exams or other assessment<br />
tools. To address areas of difficulty the teachers develop, test, and improve an instructional experience that promotes student<br />
learning of that standards-based material. Lesson Study is different from "lesson planning" because it focuses on what teachers<br />
want students to learn rather than on what teachers plan to teach. The 2011 teachers divided into three groups and each group<br />
is developing a Research Lesson. One of each of the group members teaches the lesson while the others observe the student<br />
learning. After the Research Lesson is taught the entire group comes together to debrief the lesson, make revisions, and<br />
another member of the group re-teaches the lesson (at a later date and at a different school) to incorporate what has been<br />
learned.<br />
INVESTIGATING ALONG-STRIKE DEPTH VARIATIONS OF SEISMICITY IN THE SAN ANDREAS FAULT<br />
SYSTEM TO BETTER RESOLVE GEODETIC LOCKING DEPTHS (A-054)<br />
C. Del Pardo, B.R. Smith-Konter, D.T. Sandwell, P. Shearer, and Y. Zeng<br />
Accurate estimates of maximum fault locking depth along the San Andreas Fault System (SAFS) are fundamental in<br />
estimating the seismic moment accumulation rate of active faults. As geodetic estimates of fault locking depth are dependent<br />
upon model fault geometry and segmentation resolution, proper representation of each active fault segment of the SAFS is<br />
critical. In this study, we re-evaluate the along-strike segmentation of the San Andreas, San Jacinto, Elsinore and Eastern<br />
California Shear Zone faults in Southern California using variations in depths of seismicity from the earthquake hypocenter<br />
catalog of Lin et al. [2007]. We use the UCERF3 fault segmentation as a first-order model of major fault segments and examine<br />
seismicity profiles as a function of depth for each segment. To achieve robust depth estimates that are insensitive to occasional<br />
stray earthquake locations at large depth, we assign a cutoff percentile depth at 99% to define the maximum depth of<br />
seismicity. For segments that have significant along-strike variations in maximum depth of seismicity, or gaps in seismicity,<br />
we refine the fault segmentation to accommodate these observed variations. Previous work suggests that the inclusion of<br />
earthquakes within 5 km of each fault trace provides a reasonable representation of the active fault zone, however we also<br />
investigate the sensitivity of fault depth to the width of the seismicity window. Lastly, we assess the range of appropriate<br />
along-strike segment lengths that are resolvable with the current geodetic array in Southern California. Ultimately, this<br />
analysis will contribute a more refined fault segmentation model to be used for complimentary UCERF3 fault slip rate and<br />
locking depth analyzes.<br />
CONDITIONS FOR RUPTURE JUMPING TO THE ADJACENT SEGMENTS – A CASE STUDY FOR THE 1992<br />
LANDERS EARTHQUAKE (A-082)<br />
A.J. Delauder, Z. Fang, Y. Klinger, and E.M. Dunham<br />
Multifault rupture occurs when the rupture on one fault “jumps” to another fault thus triggering a rupture on the second fault.<br />
This phenomenon has interested seismologists for years and continues to be a growing field of study. The 1992 Landers<br />
earthquake is a classic example of multifault rupture through a geometrically complex fault system.<br />
158 | Southern California Earthquake Center
Poster Abstracts<br />
Previous models of the Landers rupture process have included multiple nonplanar fault segments, but the off-fault response<br />
was assumed to be ideally elastic. Our prior studies of dynamic ruptures on idealized nonplanar faults have highlighted the<br />
importance of accounting for inelastic deformation to bound otherwise unreasonable stress concentrations that develop<br />
around structural complexities. Building on that modeling framework, we present a dynamic rupture model of the Landers<br />
earthquake that incorporates plastic deformation in addition to the realistic nonplanar geometry. Simulations show that a<br />
rupture cannot jump over one kilometer without the presence of a linking fault, at least for the specific geometries and<br />
parameters we studied. Since the main segments of the complex Landers fault system are almost 5 kilometers apart, we<br />
speculate that minor connecting faults must play a key role in rupture propagation spanning multiple segments.<br />
To gain more insight, we have studied three typical but simplified fault geometries: parallel (two faults 5 km apart with no<br />
overlap), overlapping, and linked (two overlapping faults connected by a linking fault). The linked geometry was the only one<br />
of the three tested geometries that allowed the rupture to jump from the first fault to the second. This confirms our speculation,<br />
and brings attention to the often-neglected linking faults in complex fault systems. We expect that our findings will help<br />
seismologists better understand both the physics behind and the probability of multifault rupture on large, complex fault<br />
systems.<br />
MODELING GROUND MOTION OF A M7+ EARTHQUAKE ON THE SAN ANDREAS FAULT USING THE<br />
VIRTUAL EARTHQUAKE APPROACH (B-007)<br />
M. Denolle, G.C. Beroza, E.M. Dunham, and G. Prieto<br />
The utility of empirical ground motion prediction equations is limited by the scarcity of large events. Physics-based<br />
simulations provide an important way to overcome this data scarcity, provided they accurately take into account the<br />
complexity of the source, the crustal elastic and anelastic structure and the local site effects. Our incomplete knowledge on<br />
crustal structure is an important source of uncertainty in ground motion simulations. We use the ambient seismic field to<br />
validate ground motion predictions at long periods. We compute the impulse responses of the Earth in between specific<br />
seismic station pairs with ambient seismic field analysis. Comparison of impulse responses with earthquake records from<br />
moderate earthquakes confirms that this process preserves relative amplitude. The distribution of the noise sources is not<br />
homogeneous, however, and this has the potential to bias amplitude variations.<br />
We can achieve a better control on the source of seismic energy with the coda-wave interferometry. We use the aftershocks of<br />
the April 4th, 2010, M7.2, El Mayor-Cucapah earthquake and southern California earthquakes with magnitudes exceeding 4. If<br />
the direction of the microseism and the earthquakes are complementary in some directions and improve the stability of the<br />
amplitude, they also improve the quality of the asymmetric impulse responses. We then correct the impulse responses with<br />
simple analysis on the dispersion of the surface waves to account for the depth-dependence of excitation as well as radiation<br />
pattern of a double couple point source and directivity effects of an extended finite source. We use a spectral collocation<br />
method using Chebyshev polynomials to evaluate the depth-dependence of the fundamental mode surface-wave excitation<br />
for complex crustal structure. After validating this technique with moderate Californian earthquakes, we apply our approach<br />
to a temporary seismic network that was deployed along the southern segment of the San Andreas Fault (SAVELA<br />
experiment). To simulate an extended finite source and capture directivity effects, we superimpose the impulse responses<br />
from all the station sources that represent parts of the fault. As predicted by large-scale computer simulations strong ground<br />
motion amplification in the Los Angeles sedimentary basin is clearly observed in the scenarios we study for a large M7+<br />
strike-slip earthquake on the reach of the San Andreas Fault near San G<strong>org</strong>onio Pass.<br />
GPS NETWORK OPERATIONS AT USGS PASADENA (A-067)<br />
D. Determan, A. Aspiotes, K. Hudnut, N. King, and K. Stark<br />
The US Geological Survey Pasadena field office operates 104 permanent, continuously-operating Global Positioning System<br />
(GPS) stations in southern California. These stations are primarily located throughout the urban Los Angeles area and along<br />
the southern San Andreas fault. The construction and in159s159t159a159l159l159a159t159i159o159n159 159o159f159<br />
159t159h159e159 159s159t159a159t159i159o159n159s159 159b159e159g159a159n159 159i159n159 1591159915991594159<br />
159a159n 159d159 159c 159o 159n159t159i159n 159u159e 159s159 159t159o159d159a 159y159.159 159 159T 159h159e 159<br />
159m159a159j159o159r159i159t159y159 159o159f159 159t159h159e159 159s159i159t159e159s159 159w159e159r159e159<br />
159c159o159n159s159t159r159u159c159t159e159d159 159a159s159 159p159a159r159t159 159o159f159 159t159h159e159<br />
159 S 159 o 159 u 159 t 159 h 159 e 159 r 159 n 159 159 C 159 a 159 l 159 i 159 f 159 o 159 r 159 n 159 i 159 a 159<br />
159 I 159 n 159 t 159 e 159 g 159 r 159 a 159 t 159 e 159 d 159 159 G 159 P 159 S 159 159 N 159 e 159 t 159 w 159 o 159 r 159 k 159<br />
2011 <strong>SCEC</strong> <strong>Annual</strong> <strong>Meeting</strong> | 159
Poster Abstracts<br />
160(160S160C160I160G160N160)160 160p160r160o160j160e160c160t160 160i160n160 160t160h160e160 160l160a160t160e160<br />
1601160916091600160s160 160t160h160r160o160u160g160h160 1602160016001601160.160 160T160e160n160 160n160e160w160<br />
160 s 160t 160 a 160 t 160 i 160 o 160 n 160 s 160 160 h 160 a 160 v 160 e 160 160 b 160 e 160 e 160n 160 160 a 160 d 160 d 160e 160 d 160<br />
160s160i 160n 160c160e 160 1602 1600 16001609 160. 160 160 160S 160e 160v 160e 160r160a 160l 160 160h160a 160v 160e 160<br />
160 b 160 o 160 t 160 h 160 160 s 160 e 160 i 160 s 160 m 160 i 160 c 160 160 a 160 n 160 d 160 160 G 160 P 160 S 160<br />
160 i 160 n 160 s 160 t 160 r 160 u 160 m 160 e 160 n 160 t 160 a 160 t 160 i 160 o 160 n 160 . 160 160 I 160 n 160<br />
160 c 160 o 160 o 160 p 160 e 160 r 160 a 160 t 160 i 160 o 160 n 160 160 w 160 i 160 t 160 h 160 160 t 160 h 160 e 160 160 L 160 o 160 s 160<br />
160A160n160g160e160l160e160s160 160D160e160p160a160r160t160m160e160n160t160 160o160f160 160W160a160t160e160r160<br />
160 a 160 n 160 d 160 160 P 160 o 160 w 160 e 160 r 160 , 160 160 w 160 e 160 160 r 160 e 160 c 160 e 160 n 160 t 160 l 160 y 160<br />
160i160n160s160t160a160l160l160e160d160 160c160o160-160l160o160c160a160t160e160d160 160s160e160i160s160m160i160c160<br />
160 a 160 n 160 d 160 160 G 160 P 160 S 160 160 e 160 q 160 u 160 i 160 p 160 m 160 e 160 n 160 t 160 160 a 160 t 160<br />
160 E 160 l 160 i 160 z 160 a 160 b 160 e 160 t 160 h 160 160 L 160 a 160 k 160 e 160 160 T 160 u 160 n 160 n 160 e 160 l 160<br />
160 S 160 o 160 u 160 t 160 h 160 , 160 160 a 160 160 c 160 r 160 i 160 t 160 i 160 c 160 a 160 l 160<br />
160 i 160 n 160 f 160 r 160 a 160 s 160 t 160 r 160 u 160 c 160 t 160 u 160 r 160 e 160 160 s 160 i 160 t 160 e 160 160 t 160 h 160 a 160 t 160<br />
160m 160o 160n 160i160t160o 160r 160s 160 160t 160h 160e 160 160i 160n 160t 160e160g 160r160i 160t160y 160 160o 160f 160<br />
160t160h160e160 160f160r160e160s160h160 160w160a160t160e160r160 160t160u160n160n160e160l160 160t160h160a160t160<br />
160 c 160 r 160 o 160 s 160 s 160 e 160 s 160 160 t 160 h 160 e 160 160 S 160 a 160 n 160 160 A 160 n 160 d 160 r 160 e 160 a 160 s 160 . 160<br />
160T160h160e160 160P 160a 160s 160a 160d 160e 160n 160a 160 160f 160i 160e 160l160d160 160o160f160f 160i 160c 160e 160<br />
160 c 160 u 160 r 160 r 160 e 160 n 160 t 160 l 160 y 160 160 o 160 p 160 e 160 r 160 a 160 t 160 e 160 s 160 160 t 160 h 160 r 160 e 160 e 160<br />
160t160y160p160e160s160 160o160f160 160g160e160o160d160e160t160i160c160 160g160r160a160d160e160 160G160P160S160<br />
160e 160 q 160u 160i160 p 160m 160e 160n 160t 160: 160 160 t 160h 160 e 160 160A 160 s 160h 160t 160e 160 c 160 h 160 160Z 160-<br />
160 X 160 I 160 I 160 3 160 , 160 160 t 160 h 160 e 160 160 T 160 r 160 i 160 m 160 b 160 l 160 e 160 160 N 160 e 160 t 160 R 160 S 160 , 160<br />
160a 160n160d 160 160t 160h 160e160 160T160O160P160C160O 160N 160 160N 160e160t 160- 160G 1603 160A 160. 160 160<br />
160 T 160 h 160 e 160 160 T 160 O 160 P 160 C 160 O 160 N 160 160 N 160 e 160 t 160 - 160 G 160 3 160 A 160<br />
160r160e160c160e160i160v160e160r160s160 160w160e160r160e160 160a160c160q160u160i160r160e160d160 160i160n160<br />
1602160016011600160,160 160t160h160r160o160u160g160h160 160f160u160n160d160i160n160g160 160f160r160o160m160<br />
160t160h160e160 160A160m160e160r160i160c160a160n160 160R160e160c160o160v160e160r160y160 160a160n160d160<br />
160R160e160i160n160v160e160s160t160m160e160n160t160 160A160c160t160.160<br />
COMPARATIVE STUDY OF SCATTERING AND INTRINSIC ATTENUATION IN CALIFORNIA, MEXICO<br />
AND PERU. DOES THE TECTONIC SETTING AFFECT THE FREQUENCY DEPENDENCE? (B-068)<br />
L.A. Dominguez, P.M. Davis, and M. Madrid<br />
We compare seismic attenuation results for three broadband seismic networks: the Integrate Seismic Network (CI) in<br />
California, the Middle America Seismic Experiment (MASE) in Mexico, and the Peru Seismic Experiment (PERUSE). We<br />
obtained independent measurements of scattering and intrinsic attenuation using the Multiple Lapse Time Window (MLTW)<br />
by Hoshiba (1991). We chose California as a reference frame due to the availability of similar published studies and the ready<br />
access to the data through the <strong>SCEC</strong> data center. Unlike California, Mexico and Peru networks are located along two<br />
distinctive subduction zones. Peru is characterized by a thick crust ~80km above a dipping subducting slab whereas Mexico<br />
shows a flat subducting slab that extends for about ~250km from the trench and a crust of ~40km. We discuss the implications<br />
that the tectonic setting has on the the measurements of seismic attenuation. Our results from Peru and Mexico show<br />
remarkable differences from published results in California. In particular, measurements of seismic albedo (ratio between<br />
scattering attenuation and total attenuation) show low frequency dependence for the subduction zones in contrast with<br />
California. We suggest that waveguide effects play a significant role in the interpretation of the results. While in California<br />
most of the earthquakes occur at shallow depth and can experience total internal reflection, Mexico and Peru earthquakes<br />
occur at greater depths beneath the crust. This difference can potentially lead to reflection of energy to the mantle when<br />
seismic waves encounter the Moho and transmitted waves into the crust remain at sub-critical angles. Our results provide new<br />
evidence for the interpretation of attenuation studies and origin of coda.<br />
GPS AND UAVSAR (A-066)<br />
A. Donnellan, J. Parker, S. Hensley, B. Bills, and T. Herring<br />
The 4 April 2010, M 7.2 El Mayor-Cucapah earthquake was observed by continuous GPS and with UAVSAR beginning in<br />
October of 2009. Several UAVSAR acquisitions following the earthquake provide detailed co-seismic and postseismic images<br />
160 | Southern California Earthquake Center
Poster Abstracts<br />
of surface deformation. UAVSAR data were first collected for the Salton Trough experiment along the border on October 20,<br />
2009. Repeat data were collected on April 12 and 13, 2010 about one week after the M 7.2 El Mayor-Cucapah earthquake, and<br />
on July 1 of 2010. The coseismic data can be fit fairly well by a single fault along the length of the rupture and much smaller<br />
left-lateral conjugate faults. Disturbance can be seen on the Superstition Hills fault, though there is no observable offset in the<br />
UAVSAR data. The GPS data suggest up to 2 cm of regional uplift in the Imperial Valley. Observed UAVSAR postseismic<br />
motions indicate a left step in the mainshock rupture that continues northward, consistent with the M 5.7 aftershock that<br />
occurred on June 15, 2010.<br />
EXPLORING PHYSICAL CONDITIONS THAT CONTROL THE 2011 MW 9.0 TOHOKU-OKI EARTHQUAKE<br />
RUPTURE AND SEISMIC RADIATIONS (A-109)<br />
B. Duan<br />
Seismic and geodetic recordings are routinely used to invert for kinematic source models of large earthquakes, which provide<br />
us with detailed images of slip distribution and rupture evolution on causative faults. To gain insight into physical conditions<br />
that control earthquake rupture and seismic radiations, we resort to dynamic source models that obey physical laws in<br />
continuum mechanics and rock friction. Published kinematic models of the 2011 Mw 9.0 Tohoku-Oki earthquake reveal<br />
several features of the rupture, including 1) high static stress drop with large amounts of slip in a small area, 2) a weak initial<br />
phase, down-dip rupture for the first 40 seconds, extensive shallow rupture during 60 to 70 seconds, and continuing deeper<br />
rupture lasting more than 100 seconds, and 3) systematically down-dip high-frequency radiation with respect to the<br />
hypocenter. In this study, we use spontaneous rupture models to explore what physical conditions can produce these features,<br />
so that we can gain some physical insights into controls on this megathrust earthquake.<br />
Dynamic rupture simulations of this shallow dipping megathrust faulting at reasonable spatial and temporal resolutions<br />
require parallel computing on supercomputers. Our newly parallelized finite element method algorithm EQdyna allows us to<br />
simulate a large suite of spontaneous rupture models. In model setup, we use depth-dependence principal stresses and take<br />
into account variations in pore fluid pressure and frictional properties associated with subducted seafloor features such as<br />
seamounts. Our preliminary results suggest followings. First, a high strength and high stress drop patch (probably a<br />
subducted seamount or seamout chains) just above the hypocenter on the fault plane can delay up-dip rupture and result in a<br />
concentrated large slip area. Second, significantly negative stress drop on the shallow portion of the subducting fault<br />
associated with the active accretionary prism is needed to reduce the amplitude of shallow slip and to confine shallow slip in a<br />
small area near the trench just up-dip of the region of maximum fault slip. Third, heterogeneities in the seismic strength<br />
parameter S down-dip of the hypocenter, probably due to both heterogeneous stresses from previous earthquakes and<br />
heterogeneous friction properties at the brittle and ductile transition zone, can produce large amounts of high-frequency<br />
radiations.<br />
MARINE AND LAND ACTIVE-SOURCE SEISMIC INVESTIGATION OF GEOTHERMAL POTENTIAL,<br />
TECTONIC STRUCTURE, AND EARTHQUAKE HAZARDS IN PYRAMID LAKE, NEVADA (B-045)<br />
A. Eisses, A. Kell, G. Kent, N. Driscoll, R. Karlin, R. Baskin, J. Louie, K. Smith, and S. Pullammanappallil<br />
Preliminary slip rates measured across the East Pyramid Lake fault, or the Lake Range fault, help provide new estimates of<br />
extension across the Pyramid Lake basin. Multiple stratigraphic horizons spanning 48 ka were tracked throughout the lake,<br />
with layer offsets measured across all significant faults in the basin. A chronstratigraphic framework acquired from four<br />
sediment cores allows slip rates of the Lake Range and other faults to be calculated accurately. This region of the northern<br />
Walker Lake, strategically placed between the right-lateral strike-slip faults of Honey and Eagle Lakes to the north, and the<br />
normal fault bounded basins to the southwest (e.g., Tahoe, Carson), is critical in understanding the underlying structural<br />
complexity that is not only necessary for geothermal exploration, but also earthquake hazard assessment due to the proximity<br />
of the Reno-Sparks metropolitan area. In addition, our seismic CHIRP imaging with submeter resolution allows the<br />
construction of the first fault map of Pyramid Lake. The Lake Range fault can be obviously traced west of Anahoe Island<br />
extending north along the east end of the lake in numerous CHIRP lines. Initial drafts of the fault map reveal active<br />
transtension through a series of numerous, small, northwest striking, oblique-slip faults in the north end of the lake. A<br />
previously field mapped northwest striking fault near Sutcliff can be extended into the west end of Pyramid Lake. This fault<br />
map, along with the calculated slip rate of the Lake Range, and potentially multiple other faults, gives a clearer picture into<br />
understanding the geothermal potential, tectonic regime and earthquake hazards in the Pyramid Lake basin and the northern<br />
Walker Lane. These new results have also been merged with seismicity maps, along with focal mechanisms for the larger<br />
events to begin to extend our fault map in depth.<br />
2011 <strong>SCEC</strong> <strong>Annual</strong> <strong>Meeting</strong> | 161
Poster Abstracts<br />
ENERGY PARTITION, STRAIN LOCALIZATION AND THERMAL WEAKENING IN A MODEL OF SHEARED<br />
GRANULAR MATERIALS (A-098)<br />
A.E. Elbanna, C. Lieou, and J. Carlson<br />
Ample field observations and seismic imaging results show that mature faults fail along very thin primarily slip zones with no<br />
significant evidence of melting. This is usually taken as an indication that the dynamic friction during sliding is much lower<br />
than its static counterpart. Here we explore the problem of dynamic weakening of frictional faults within the framework of the<br />
shear transformation zone (STZ) theory. Manning et al. (2007,2009), using the STZ theory, showed that strain localizes and<br />
long lived shear banding zone forms for a wide range of strain rates and initial conditions relevant to the earthquake problem.<br />
Here we further consider the problem of shear deformation in granular gouge in the presence of temperature-dependent<br />
material properties; both the yield stress and the shear modulus of the gouge material are assumed to decrease with increasing<br />
temperature. As the two surfaces of the fault move relative to each other, part of the change in strain energy is consumed in<br />
raising the temperature of the gouge particles which in turn leads to a reduction in the gouge strength and stiffness. We find<br />
that this feedback between the thermal softening and the irreversible shear rearrangements of the gouge particles lead to i)a<br />
smaller slip-weakening distance; ii) a lower steady state sliding friction; and iii) a smaller fraction of the total energy being<br />
dissipated as frictional heat than in the athermal case. Finally, we briefly discuss some constraints on the width of the shear<br />
banding zone as well as the maximum achievable temperatures predicted by our model.<br />
A METHOD FOR EARTHQUAKE CYCLE SIMULATIONS: QUASI-STATIC EVOLUTION TO DYNAMIC<br />
RUPTURE (B-056)<br />
B.A. Erickson and E.M. Dunham<br />
The goal of our project has been the development of a time-stepping methodology to understand and simulate full earthquake<br />
cycles with multiple events on geometrically complex faults, with rate-and-state friction and off-fault plasticity. This<br />
framework requires numerical methods to advance the model over long interseismic periods using the quasi-static equations,<br />
and through dynamic rupture using the elastodynamic formulation. In order to handle geometric complexities and off-fault<br />
plasticity, a volume discretization is required. During the quasi-static phase, we neglect inertia and the system evolves due to<br />
slow tectonic loading. Once inertial effects become significant we switch to solving the equations of elastodynamics. This<br />
switching method has been implemented in 1D, taking large time steps through the interseismic period and much smaller<br />
time steps in order to fully resolve coseismic rupture. In 2D we have solved the quasi-static equations for the antiplane<br />
problem by imposing constant creep at the downdip extension of the fault, intended to capture the effect of slow loading<br />
during the interseismic period. We have concurrently begun to use 2D plane strain models with off-fault plasticity to<br />
approximate multiple earthquake ruptures on rough faults. The initial conditions prior to the first event are sufficient to<br />
immediately nucleate dynamic rupture. Once the rupture has terminated and slip velocity is sufficiently small, fault strength<br />
evolves according to the aging law and the system is loaded by a constant increment in shear stress in the medium. This<br />
incremental method is an easy implementation that allows us to generate earthquake cycles on rough faults, but it is an<br />
approximation in the sense that it may overlook effects such as creep and afterslip during an interseismic time step. For the<br />
time being it may be a useful tool for incorporating the basic effects of interseismic load accumulation and to study how<br />
heterogenous residual stresses affect subsequent ruptures. However, it will be important to see what additional effects are<br />
captured once we implement the quasi-static evolution on rough faults with off-fault plasticity via our switching method.<br />
SHARPENED VIEWS OF THE 2011 TOHOKU-OKI EARTHQUAKE FROM SPARSITY BASED<br />
OPTIMIZATION (A-043)<br />
E.L. Evans and B.J. Meade<br />
Understanding the relationship between strain accumulation and release in subduction zones is limited by our ability to<br />
resolve and compare spatial patterns of coseismic slip and interseismic slip deficit. In earthquake geodesy, estimates of fault<br />
slip are traditionally determined by regularized least squares minimization. Implicit in this approach is the assumption that<br />
slip distributions vary smoothly. However, if boundaries to fault slip are sharp in nature, smooth solutions given by<br />
traditional least squares estimation may artificially smear fault slip beyond physical boundaries. Resolving sharp variations in<br />
fault slip may be achieved with techniques such as basis pursuit denoising that incorporate L1 minimization of the state vector.<br />
Minimizing the L1 norm reduces the number of nonzero state vector elements resulting in a sparse, and therefore sharp,<br />
solution. We investigate two methods combining least squares minimization of residual velocities with L1 minimization of the<br />
state vector. We apply these techniques to geodetic data in Japan to image interseismic coupling prior to the 2011 Mw=9.0<br />
Tohoku-oki earthquake and coseismic slip during the event and quantitatively assess the extent to which they are co-located.<br />
162 | Southern California Earthquake Center
ADDITIONAL SHEAR RESISTANCE FROM FAULT ROUGHNESS AND ITS ROLE IN DETERMINING<br />
STRESS LEVELS ON MATURE AND IMMATURE FAULTS (A-081)<br />
Z. Fang and E.M. Dunham<br />
Poster Abstracts<br />
The majority of crustal faults host earthquakes at τ/(σ − p) ~ 0.6, while mature plate-boundary faults, like the San Andreas<br />
Fault (SAF), host earthquakes at τ/(σ − p) ~ 0.2. A leading explanation for the weakness of the SAF is the existence of dynamic<br />
weakening, which, on planar faults, allows self-sustaining rupture at a critical background stress level τ pulse /(σ − p) ~ 0.25.<br />
Provided that dynamic weakening also occurs on less mature faults, which seems likely given the ubiquity of dynamic<br />
weakening in high velocity friction experiments, the stress levels on the less mature faults are puzzling. We offer a selfconsistent<br />
explanation for the relatively high stress levels on immature faults that is compatible with dynamic weakening and<br />
low coseismic strength of all faults. Our explanation is that increased geometrical complexity of less mature faults introduces<br />
an additional resistance to slip that must be overcome in order for the fault to host ruptures. Lab and field observations<br />
suggest that faults are self-similar surfaces with amplitude-to wavelength ratio α in the range of 10 -3 (mature faults) to 10 -2<br />
(immature faults). Slip on such faults induces huge stress perturbations near the fault. Projection of these stress perturbations<br />
back onto the rough fault surface results in an additional shear resistance to slip, the 'roughness drag' τ drag , that exists even if<br />
the fault is frictionless. A perturbation analysis, accurate to second order in α, shows that τ drag = 8π 3 α 2 [G/(1−ν)][Δu/ λmin], in<br />
which G is shear modulus, ν is Poisson's ratio, Δu is the amount of slip, and λmin is the minimum wavelength of roughness.<br />
Estimates indicate that τ drag is negligible on mature faults (α ∼ 10 -3 ) but can become substantial on immature faults (α ∼ 10 -2 ). We<br />
expect that the finite strength of the off-fault material ultimately bounds τ drag to a value determined by the internal friction<br />
coefficient of the material. To test our hypothesis, we model dynamic rupture propagation on hundreds of randomly<br />
generated rough faults. The model includes dynamic weakening of fault strength and off-fault plasticity. Simulation results<br />
consistently indicate that rough faults require background stress levels τ b ≈ τ pulse + τ drag to host sizable ruptures. There are thus<br />
two limiting cases of fault behavior: For mature faults, τ drag
Poster Abstracts<br />
164W164e164 164e164x164t164r164a164p164o164l164a164t164e164 164t164h164e164s164e164 164r164e164s164u164l164t164s164<br />
164i164n164 164t164i164m164e164 164t164o164 164t164h164e164 164d164a164t164e164 164o164f164 164t164h164e164<br />
1642164016411640164 164e164a164r164t164h164q164u164a164k164e164 164i164n164 164o164r164d164e164r164 164t164o164<br />
164c164o164n164s164t164r164a164i164n164 164t164w164o164 164q164u164a164n164t164i164t164i164e164s – 164t164h164e164<br />
164 c 164 o 164 s 164 e 164 i 164 s 164 m 164 i 164 c 164 164 d 164 i 164 s 164 p 164 l 164 a 164 c 164 e 164 m 164 e 164 n 164 t 164<br />
164 f 164 i 164 e 164 l 164 d 164 , 164 164 w 164 h 164 i 164 c 164 h 164 164 a 164 c 164 t 164 s 164 164 a 164 s 164 164 t 164 h 164 e 164<br />
164 i 164 n 164 i 164 t 164 i 164 a 164 l 164 164 c 164 o 164 n 164 d 164 i 164 t 164 i 164 o 164 n 164 164 o 164 f 164 164 t 164 h 164 e 164<br />
164p164o164s 164t164-164s164e164i164s164m164i 164c 164 164d164e 164f164o 164r164m 164a164t164i164o164n 164,164<br />
164 a 164 n 164 d 164 164 t 164 h 164 e 164 164 p 164 o 164 s 164 t 164 - 164 s 164 e 164 i 164 s 164 m 164 i 164 c 164<br />
164 d 164 e 164 f 164 o 164 r 164 m 164 a 164 t 164 i 164 o 164 n 164 164 i 164 t 164 s 164 e 164 l 164 f 164 , 164<br />
164 i 164 n 164 c 164 l 164 u 164 d 164 i 164 n 164 g 164 164 d 164 e 164 f 164 i 164 n 164 i 164 n 164 g 164 164 a 164 n 164<br />
164 a 164 p 164 p 164 r 164 o 164 p 164 r 164 i 164 a 164 t 164 e 164 164 i 164 n 164 t 164 e 164 r 164 s 164 e 164 i 164 s 164 m 164 i 164 c 164<br />
164r164e164f164e164r164e164n164c164e164<br />
MECHANICAL AND MICROSTRUCTURAL OBSERVATIONS OF DYNAMIC WEAKENING IN SMECTITE-<br />
RICH SAFOD GOUGE (A-091)<br />
M.E. French, H. Kitajima, J.S. Chester, and F.M. Chester<br />
We present the results of high-speed rotary shear experiments on gouge from the Central Deforming Zone (CDZ) of the San<br />
Andreas Fault (SAF). Core from the CDZ, which currently creeps aseismically, was recovered during Phase 3 drilling of the<br />
San Andreas Fault Observatory at Depth (SAFOD). The sample tested is a well-foliated smectite – rich gouge that contains<br />
clasts of serpentine, quartz, feldspar, and opaques. The sample was flaked to ~600 µm to preserve the clay fabric; a ~1 mm<br />
thick layer was sheared between gabbro blocks 25 mm in diameter and semi-sealed with a press-fit Teflon ring. Experiments<br />
were conducted at a constant normal stress of 0.3 - 1.5 MPa, velocity of 0.1 - 1.3 m/s, and displacement up to 20 m (we refer to<br />
the local condition at 2/3 the sample radius). We tested room-dry and water-saturated gouge at room temperature and<br />
measured the gouge temperature on a representative suite of samples. Microstructural analyses were conducted on radial cut<br />
thin sections which show slip-perpendicular structures formed under spatial gradients in velocity and displacement.<br />
The CDZ gouge weakens with an increase in velocity. The steady-state coefficient of friction of the wet gouge varies from µ=<br />
0.40 at 0.1 m/s to µ= 0.14 at 1.3 m/s. Temperature within the gouge layer exceeds the water-vapor phase transition in the<br />
water-saturated gouge sheared at 0.35-1.3 m/s. In general, the coefficient of friction and temperature of the dry gouge are<br />
greater than that of the wet gouge. Microstructures show a progression in deformation mechanisms with increasing<br />
displacement and velocity. A clay-foliation develops by ~1 m of displacement. Under the highest velocity and/or<br />
displacement conditions poorly-foliated to nonfoliated regions develop parallel and oblique to the foliation. In some cases the<br />
non-foliated, disaggregated gouge cross-cuts and disrupts adjacent foliated zones and contains fragments of foliated material.<br />
The disrupted zones occur in regions of different displacement and velocity conditions where the temperatures may have<br />
risen high enough to promote pore fluid pressurization and vaporization. Because these experiments are essentially vented,<br />
we expect greater weakening in-situ where fluid escape is limited. Thus, although previous studies have shown this material<br />
to be velocity-strengthening at sub-seismic slip rates, the creeping segment of the SAF and similar clay-rich faults may be<br />
capable of propagating seismic rupture.<br />
THE SALTON SEISMIC IMAGING PROJECT: INVESTIGATING EARTHQUAKE HAZARDS IN THE SALTON<br />
TROUGH, SOUTHERN CALIFORNIA (B-134)<br />
G.S. Fuis, M.R. Goldman, R.R. Sickler, R.D. Catchings, M.J. Rymer, E.J. Rose, J.M. Murphy, L.A. Butcher, J.A. Cotton, C.J.<br />
Criley, D.S. Croker, I. Emmons, A.J. Ferguson, M.A. Gardner, E.G . Jensen, R. McClearn, C.L. Loughran, C.J. Slayday-<br />
Criley, J.R. Svitek, J.A. Hole, J.M. Stock, S. Skinner, N.W. Driscoll, A.J. Harding, J. Babcock, G.M. Kent, A. Kell, and S.H.<br />
Harder<br />
The Salton Seismic Imaging Project (SSIP) is a collaborative effort between academia and the U.S. Geological Survey to<br />
provide detailed, subsurface 3-D images of the Salton Trough of southern California and northern Mexico. From both active-<br />
and passive-source seismic data that were acquired both onshore and offshore (Salton Sea), the resulting images will provide<br />
insights into earthquake hazards, rift processes, and rift-transform interaction at the southern end of the San Andreas Fault<br />
system. The southernmost San Andreas Fault (SAF) is considered to be at high-risk of producing a large damaging earthquake,<br />
yet the structure of this and other regional faults and that of adjacent sedimentary basins is not currently well understood.<br />
164 | Southern California Earthquake Center
Poster Abstracts<br />
Seismic data were acquired from 2 to 18 March 2011. One hundred and twenty-six borehole explosions (10-1400 kg yield) were<br />
detonated along seven profiles in the Salton Trough region, extending from area of Palm Springs, California, to the<br />
southwestern tip of Arizona. Airguns (1500 and 3500 cc) were fired along two profiles in the Salton Sea and at points in a 2-D<br />
array in the southern Salton Sea. Approximately 2800 seismometers were deployed at over 4200 locations throughout the<br />
Salton Trough region, and 48 ocean-bottom seismometers were deployed at 78 locations beneath the Salton Sea. Many of the<br />
onshore explosions were energetic enough to be recorded and located by the Southern California Seismograph Network.<br />
The geometry of the SAF has important implications for energy radiation in the next major rupture. Prior potential field,<br />
seismicity, and InSAR data indicate that the SAF may dip moderately to the northeast from the Salton Sea to Cajon Pass in the<br />
Transverse Ranges. Much of SSIP was designed to test models of this geometry.<br />
EARTHQUAKE SCALING RELATIONSHIPS ESTIMATED FROM A 16 YEAR CATALOG OF PUBLISHED<br />
INSAR STUDIES (B-116)<br />
G.J. Funning, J. Weston , J.R. Elliott, A.M.G. Ferreira, and K. Richards-Dinger<br />
The question of how moment release in earthquakes scales to other earthquake source parameters, such as fault length and<br />
average slip, is a long-standing controversy in earthquake science. The question has wide practical implications (e.g. in<br />
estimating seismic hazard due to known unruptured fault segments) and also theoretical implications (e.g. in the debate about<br />
self-similarity of earthquakes across all magnitudes). Here we use a catalog of earthquake source parameters derived from<br />
published InSAR earthquake studies to address this question. InSAR data may be considered preferable for this purpose over<br />
traditional sources such as aftershock data and seismic inversion models, as several key source parameters – in particular, the<br />
fault length – can in many cases be measured directly from the data.<br />
We have compiled fault length, width, average slip and seismic moment estimates from over 70 published studies of 57<br />
individual earthquakes. Using linear regressions, we find the best best-fitting trends and their uncertainties between these<br />
quantities, treating all events together and also separately by mechanism type (strike-slip, thrust and normal). Our<br />
preliminary results suggest: 1) The best-fitting single scaling relationship between moment and length has a slope of 1.76 in<br />
log-log space. This is more consistent with the ‘L model’ scaling which predicts a slope of 2, than ‘W model’ scaling, which<br />
requires linear scaling (Scholz, 1982). This relationship does not vary significantly with earthquake mechanism. 2) The data do<br />
not require a change of scaling regime around M7.2 as suggested previously (e.g. Romanowicz, 1992). 3) Ratios of average slip<br />
to length fall broadly into two fields – high slip-to-length events (1–3 x 10**-4) and low slip-to-length events (0.4–4 x 10**-5).<br />
The low slip-to-length category includes subduction earthquakes and events occurring on strike-slip faults with fast slip rates<br />
(> 2 mm/yr); the high slip-to-length category includes several blind faulting earthquakes, typically occurring on faults with<br />
low slip rates ( 1Hz).<br />
2011 <strong>SCEC</strong> <strong>Annual</strong> <strong>Meeting</strong> | 165
Poster Abstracts<br />
Results of this study show that, for certain structural systems, simulated accelerograms may produce median inelastic demand<br />
(at a collection of stations for each earthquake) different from a similar estimate using corresponding recorded motions. This<br />
difference is especially observed in the case of degrading and evolutionary systems at high non-linearity levels, and if cyclic<br />
response is of concern. Moreover, simulated records tend to produce nonlinear demands that are generally less heterogeneous<br />
compared to those caused by real records. The amount of this variability reduction depends on the structural period, the nonlinearity<br />
level and the hysteretic model used. Further investigation is needed to prove the statistical significance of these<br />
results and identify their source.<br />
ENGINEERING VALIDATION OF GROUND MOTION SIMULATION: PART 2. MAXIMUM INTERSTORY<br />
DRIFT RATIO AND CRITICAL STORY SPECTRA (B-091)<br />
C. Galasso, F. Zareian, I. Iervolino, and R.W. Graves<br />
The study presented in this poster complement the first one addressing the issue of ground motion simulation engineering<br />
validation in terms of elastic seismic response of multiple degrees of freedom (MDOF) systems. MDOF buildings considered<br />
in this study are modeled as equivalent continuum structures consisting of a combination of a flexural cantilever beam<br />
coupled with a shear cantilever beam (both with uniform mass distribution). Such models are useful tools for approximate<br />
analysis of structures, especially those tall, ranging from moment-resisting frames to shear walls systems and for which the<br />
higher-mode contributions may become important.<br />
In order to study dynamic response of a wide range of buildings, a number of simplified continuum systems were selected<br />
considering: (1) twenty oscillation periods between 0.1s and 10s; (2) three shear to flexural deformation ratios to represent<br />
respectively shear walls structures, dual systems, and moment-resisting frames; (3) two stiffness distribution along the height<br />
of the systems; i.e., uniform and linear. Demand spectra in term of maximum interstory drift (IDR) and critical story (i.e., the<br />
height of maximum interstory drift) were derived for the same four historical earthquakes of the first poster; i.e., 1979 M 6.5<br />
Imperial Valley earthquake, 1989 M 6.8 Loma Prieta earthquake, 1992 M 7.2 Landers earthquake and 1994 M 6.7 Northridge<br />
earthquake. In addition, for same selected case study structures, the IDR distribution over the height and the modal<br />
contributions are obtained and compared for both recorded and simulated time histories.<br />
Some differences between median estimate of IDR demand obtained by using real records and that obtained by simulations<br />
were observed, over a certain frequency range throughout the regions surrounding the event epicenter. These differences vary<br />
with the considered event and the structural period while they are fairly independent of the type of structure. Moreover, the<br />
record-to-record variability of seismic demand produced by simulated and recorded motions may be different. Further<br />
analysis is underway to explain the effect of various ground motion simulation parameters on the discrepancy found and to<br />
prove the statistical significance of these results.<br />
COMPLEXITY OF THE M6.3 2009 L’AQUILA (CENTRAL ITALY) EARTHQUAKE: SLIP INVERSION AND<br />
BROAD-BAND MODELING OF STRONG-GROUND MOTIONS (B-003)<br />
F. Gallovic, J. Zahradnik, G. Ameri, and F. Pacor<br />
Strong ground motion recordings of the M6.3 2009 L’Aquila (central Italy) earthquake are analyzed by a newly proposed<br />
inversion technique. The source model consists of Multiple Finite-Extent (MuFEx) subsources. Each subsource is characterized<br />
by an individual set of trial nucleation positions, rupture velocities and nucleation times. In addition to the best-fitting model,<br />
grid-searching all combinations of the subsource parameters allows also the uncertainty analysis. The MuFEx model requires a<br />
preliminary setup based on a technique free of strong constraints (constant rupture velocity over the whole fault, etc.). Here<br />
we used two published approaches of such a type, the truncated singular value decomposition and the iterative multiplepoint<br />
source deconvolution. Final adjustment of the MuFEX model can be performed by repeating the analysis while varying<br />
the dimensions and locations of the subsources. Both the best-fitting model and the uncertainty analysis of the low-frequency<br />
L’Aquila records suggest that the event consisted of two major episodes, one with the rupture propagating immediately after<br />
the nucleation in the up-dip direction, while the other being delayed by 3-4s and characterized by the dominant propagation<br />
towards SE along the deeper part of the fault. We point out that the data cannot distinguish between a temporal rupture arrest<br />
and a partial slow-down of the rupture, the latter suggested in other published ‘smooth’ models. We also present broad-band<br />
(0.1 - 10 Hz) modeling of strong ground motions constraining the source model by MuFEx inversion. The modeling allows<br />
linking distinct features of the observed wavefield to particular source and propagation effects and provides insights on<br />
strong-motion complexity from this moderate magnitude event. We utilize a hybrid integral-composite approach based on a<br />
k-square kinematic rupture model, combining low-frequency coherent and high-frequency incoherent source radiation and<br />
166 | Southern California Earthquake Center
Poster Abstracts<br />
providing omega-squared source spectral decay. Synthetic Green’s functions are calculated in a 1D-layered crustal model<br />
including 1D soil profiles to account for site-specific response (where available). The results show that although the local site<br />
effects improve the modeling results, the observed spatial broad-band ground-motion variability is to large extent controlled<br />
by the rupture kinematics revealed by the low-frequency inversion.<br />
DYNAMIC RUPTURE SIMULATION WITH AN UNSTRUCTURED 3D SPECTRAL ELEMENT METHOD (A-<br />
114)<br />
P. Galvez, J.-P. Ampuero, L.A. Dalguer, and T. Nissen-Meyer<br />
Natural faults are not planar, but can have curvature, roughness, branches, kinks and steps. Fault geometry is one of the<br />
important factors that affect earthquake rupture. To model dynamic rupture in realistic fault geometries, while including<br />
heterogeneous crustal structures and non-linear rheologies, we have implemented the capability of simulating dynamic<br />
earthquake rupture in an unstructured 3D spectral element (SEM) solver. Our implementation follows the principles<br />
introduced by Ampuero (2002) and Kaneko et al. (2008) and involves encapsulated modules plugged on the 3D open source<br />
code SPECFEM3D-SESAME. Our current implementation provides the possibility of modeling dynamic rupture for multiple,<br />
non-planar faults governed by slip-weakening friction. The modularity of the code allows the implementation of different<br />
friction laws and non-linear constitutive laws off the fault (damage or plasticity) or other physical processes related to<br />
dynamic rupture. High flexibility to represent the geometrical complexity of real fault systems with unstructured meshes of<br />
hexahedral elements is provided by CUBIT, a general-purpose state-of-the-art mesh generation software. Meshing with<br />
progressive coarsening away from the fault pushes away the absorbing boundaries to allow an accurate resolution of the static<br />
field. We successfully verified the code in several <strong>SCEC</strong> benchmark problems, including a 3D problem with branched faults.<br />
We also ran simulations of rupture on a subduction megathrust with a splay fault, finding results comparable to published<br />
results. The code also allows the simulation of kinematic finite sources which can be incorporated in source inversion<br />
procedures. We will report on our efforts to model the complex dynamic rupture of the 2001 M9 Tohoku, Japan, earthquake.<br />
A PERMANENTLY DEPLOYED CROSS-HOLE EXPERIMENT FOR MONITORING DEGRADATION AND<br />
RECOVERY OF SHEAR MODULUS AT THE NEES@UCSB GARNER VALLEY FIELD SITE<br />
(B-022)<br />
R. Gee, J. Steidl, and P. Hegarty<br />
Cross-hole tests are often used in site characterization studies to provide in situ estimates of shear-wave velocity at a<br />
particular depth by measuring the travel time from an active source deployed at depth in one well casing, to geophones<br />
located at the same depth in other well casings. Knowing the travel time and the distance between receiver casings, an<br />
estimate of the velocity can be made. The NEES@UCSB Garner Valley facility was recently enhanced to include a permanent<br />
cross-hole array that includes two geophones and a solenoid-activated dual-direction hammer source at 5 meters depth. A<br />
second set of geophones at 2 meters depth is deployed directly above the 5-meter geophones in the same casings. The system<br />
is set to trigger once per day automatically with both upward and downward hammer strikes, thus providing the capability to<br />
measure shear-wave velocity on a daily basis. In addition, the system is set to automatically activate the hammer source at<br />
shorter time intervals immediately following a large earthquake. This cross-hole experiment is unique in that these velocity<br />
measurements will be able to capture the decrease and recovery of shear wave velocity after a large event, and thus the<br />
degradation of shear modulus and its recovery with time at the same level in the soil. In combination with the permanent<br />
vertical array of accelerometers already deployed at Garner Valley, this new cross-hole experiment should provide a level of<br />
detail never before achieved in the observation of dynamic soil behavior during and following large earthquakes. In the mean<br />
time, as we wait for the earth to provide larger motions, the once daily hammer strikes are recorded and analyzed for potential<br />
temporal changes in velocity with seasons. The shear-wave velocity is determined by cross-correlation of the signals between<br />
the geophones of equal depth, separated by 4.82 meters. Initial analysis performing this cross correlation on the 5-meter<br />
sensors yields a shear wave velocity ~220 m/s. We present the results of approximately one year’s worth of daily hammer<br />
strikes to determine if there is seasonal variation of shear-wave velocity at the site related to variations in soil saturation and<br />
water table depth.<br />
UPDATING THE NEW ZEALAND NSHM FROM THE CANTERBURY EARTHQUAKE SEQUENCE (B-093)<br />
M. Gerstenberger, G. McVerry, D. Rhoades, M. Stirling, K. Berryman, and T. Webb<br />
The Canterbury, New Zealand, earthquake sequence began in September 2010 with the Mw 7.1 Darfield earthquake which<br />
caused significant structural damage. It has continued with a damaging sequence of aftershocks including the Mw 6.3<br />
2011 <strong>SCEC</strong> <strong>Annual</strong> <strong>Meeting</strong> | 167
Poster Abstracts<br />
earthquake in February, which caused the loss of more than 180 lives, and the June Mw 6.0 earthquake; both of these major<br />
aftershocks occurred directly under the city of Christchurch. The sequence of events is occurring in what is a moderate hazard<br />
area in the New Zealand National Seismic Hazard Model (NSHM). With significant rebuilding effort required due to the<br />
damage from the sequence, a reinvestigation of the NSHM was requested in terms of the NZ building code, and in terms of<br />
probabilities of future liquefaction. Initially a very tight time frame (on the order of weeks) was given for the update to the<br />
model. On this short schedule, modifications were made to both the ground motion prediction equation and to the source<br />
models.<br />
All larger earthquakes in the sequence to date have had large apparent stresses based on energy magnitudes; we have scaled<br />
the predicted ground-motions to account for this. Additionally we have developed a composite source model of differing<br />
clustering scales that consists of four sub-models: 1) the NSHM fault model including conditional probabilities of rupture on<br />
key faults; 2) a short-term clustering model to account for immediate aftershock clustering; 3) a medium-to-long-term<br />
clustering model to account for more distant and clustering on a longer time scale; and 4) a smoothed seismicity model based<br />
on a non-declustered catalog to allow for the expectation of increased seismicity in the coming decades. This preliminary work<br />
has resulted in an increase in the official building code requirements by about 1/3. The work is currently being re-evaluated<br />
with additional alternatives and uncertainties being considered. Due to the nature of the sequence, and the fact that the hazard<br />
is dominated by events with M
Poster Abstracts<br />
understanding the physics of the subsidence process, the role of faults, the geohydrology of the local aquifers, and the<br />
mechanism of creep on the faults, as well as for decision-making for future investments in the Mexicali Valley.<br />
Before the earthquake, faults were slipping vertically few centimeters per year, a rate of about half the subsidence rate<br />
observed in the nearest subsidence bowl. Coseismic slip observed from the instruments and from manual measurements was<br />
of the order of centimeters, suggesting a strong consolidation effect triggered by seismic waves. One year after the earthquake,<br />
vertical slip observed on the Saltillo fault has been slower, while vertical slip on the Cerro Prieto fault ceased.<br />
A precision leveling survey in the Mexicali Valley had been done 2 months before the earthquake and was repeated two<br />
months after the earthquake. As expected for this earthquake, an uplift of about 30 cm towards the NE was observed along a<br />
38 km line in the SW-NE direction. Three subsidence bowls differ from this general pattern. While two bowls lay within the<br />
limits of subsidence area observed before the earthquake, the deepest one, with 36 cm relative depth, is situated to the<br />
southwest outside of the subsidence zone. All the subsidence bowls are probably associated with liquefaction observed in the<br />
area, with more liquefaction observed close to the epicenter.<br />
We checked the subsidence pattern after the earthquake using InSAR images. The small number of available images does not<br />
allow drawing definite conclusions, but suggests that the subsidence process continues at the previous rate.<br />
IDENTIFYING FAULT HETEROGENEITY THROUGH MAPPING SPATIAL ANOMALIES IN ACOUSTIC<br />
EMISSION STATISTICS (B-029)<br />
T.H. Goebel, T. Becker, D. Schorlemmer, S. Stanchits, C. Sammis, E. Rybacki, G. Dresen<br />
Frictional properties of fault surfaces fundamentally influence the local strength of the seismogenic crust. We investigate the<br />
relationship between fault asperities and the creation of micro-cracks and damage by analyzing acoustic emission (AE) events<br />
emitted during sliding of fractured Westerly granite surfaces in the laboratory. We developed a three stage procedure, for<br />
which rock samples are initially fractured under triaxial loading, followed by fault locking due to pressure increase and a final<br />
stage of fault reactivation. We observed three different types of behavior: (1) frictional sliding with decreasing differential<br />
stress (creeping fault) (2) linear and non linear stress increase, slow as well as abrupt stress drops (3) approximately linear<br />
stress increase followed by abrupt stress drop events between 10 to 300 MPa (stick slips with saw tooth pattern). We<br />
performed a detailed spatial analysis of event clusters before and after stick slips, primarily focusing on their b-values, seismic<br />
moment release and AE event densities. AE hypocenter distributions showed a high degree of spatial clustering close to low<br />
b-value regions. Slip events and the connected acoustic emission “aftershocks” nucleated within or at the periphery of areas of<br />
low b. To identify larger scale geometric asperities we combined fault structural information from post-experimental CT-scans<br />
with AE statistics. Asperities were connected seismically to low b-value regions, high moment release and increased AE event<br />
density and structurally to anomalous thin fault parts and point contacts of the host rock walls.<br />
The rough fracture surfaces during laboratory experiments, strongly favor the creation of spatial and temporal distinct AE<br />
clusters which have similar characteristics to seismicity observed on crustal scales. Specific crustal seismicity anomalies may<br />
be an expression of fault heterogeneity and mark areas of increased seismic hazard.<br />
CONNECTING THE SPATIAL DISTRIBUTION OF ACOUSTIC EMISSIONS TO FAULT ROUGHNESS<br />
DURING STICK-SLIP EXPERIMENTS (B-036)<br />
T.H. Goebel, C. Sammis, and T. Becker<br />
Most continental earthquakes occur on or close to narrow fault zones within the seismogenic crust. Variations in size and<br />
spatial distribution of seismic events are likely influenced by differences in roughness and degree of heterogeneity of faults.<br />
The understanding of controlling factors of seismicity distributions around natural faults is limited due to largely unknown<br />
crustal stress, fault zone structure and roughness. Unlike field studies, high pressure laboratory stick-slip experiments enable<br />
the investigation of earthquake analog systems under controlled conditions. We connected spatial distributions of acoustic<br />
emissions (AEs) to post-experimental fault structure and slip surface roughness of previously faulted and saw-cut Westerly<br />
granite samples.<br />
To create stick-slip events we locked the specimen by increasing the confining pressure and resumed axial loading. Our<br />
experimental set-up enables the creation of a series of stick-slip events on a single fault plane. AEs were recorded and located<br />
with high speed and accuracy using 14 piezo-ceramic sensors attached directly to the rock sample. We analyzed the degree of<br />
localization of AEs with increasing stress level leading up to slip events. AE hypocenter distributions were quantified by<br />
computing the fractal dimension of spatial AE distributions and the activity fall-off with fault normal distance. Fault structure<br />
2011 <strong>SCEC</strong> <strong>Annual</strong> <strong>Meeting</strong> | 169
Poster Abstracts<br />
and slip surface roughness were determined from post-experimental computer tomography scans and sets of roughness<br />
profiles parallel and perpendicular to the direction of slip. We observed a high degree of localization at high differential<br />
stresses before slip events. Increasing power-law exponents of fault normal activity fall-offs indicated fault smoothening with<br />
successive slip events. Naturally faulted and saw-cut surfaces exhibited distinct characteristics of AE distributions. Saw cut<br />
surfaces with higher roughness exhibited slower activity fall-offs with fault normal distance.<br />
Thus both the initial roughness of the fault plane and the changes in roughness during one experiment due to, e.g., new<br />
surface creation seemed to be detectable through variations in spatial AE statistics.<br />
Understanding the connection between micro-seismicity and fault roughness may have important implications on the seismic<br />
hazard connected to specific fault zones or fault segments. The nucleation points of large earthquake ruptures may be<br />
connected to rough fault patches or asperities.<br />
ASSESSMENT OF COSEISMIC SLIP VARIATION FROM TERRESTRIAL LIDAR SCANS OF THE EL<br />
MAYOR-CUCAPAH SURFACE RUPTURE (A-105)<br />
P.O. Gold, A.J. Elliott, M.E. Oskin, M.H. Taylor, A. Hinojosa, R. Styron, O. Kreylos, T. Bernardin, E. Cowgill, and A.J.<br />
Herrs<br />
We assess the slip distribution at four sites along the El Mayor-Cucapah (EMC) earthquake surface rupture with cm-resolution<br />
terrestrial lidar (TLS). Slip distributions based on field measurements typically show abrupt variation (0.5-2 m) over short<br />
along-strike distances (10 to 100 m), implying large along-fault strains (>10-2). While some of this variation may be real, the<br />
degree to which it can be attributed to measurement uncertainty is not well known because accurately assessing uncertainties<br />
in the field is difficult. We quantify this uncertainty by evaluating the repeatability of virtual field measurements using TLS<br />
datasets in an immersive 3D-cave environment. The TLS scans, collected 12 to 18 days following the EMC earthquake, capture<br />
fault displacements in a range of geologic and geomorphic settings. We build slip distributions by measuring individual<br />
displaced landforms and by summing vertical offsets along strike-perpendicular profiles. For comparison, we also measure<br />
orientations of free-face striations where observable in the scans. We construct composite slip distributions using 15 sets of<br />
repeat measurements from each suite of offsets at each site. The variability in individual offset measurements defines<br />
uncertainties of 2% to 25% of the total offset distance. In all cases, net along-strike gradients in the displacement curve cannot<br />
be solely explained by uncertainties in offset measurements. However, these uncertainty measurements are significant enough<br />
to confirm that true fault slip is less abruptly variable than commonly portrayed by slip distribution curves. We also find that<br />
the displacement curve may not be accurately represented by the envelope of displacement maxima, as is the common<br />
practice. In addition, repeat TLS scans collected ~1 year after the EMC earthquake expand on the initial scans and will enable<br />
future expansion of the slip distribution curves, as well as quantification of post-event surface change by comparing datasets.<br />
EL MAYOR CUCAPAH EARTHQUAKE: POSTSEISMIC DEFORMATION FROM INSAR AND GPS<br />
OBSERVATIONS (A-046)<br />
A. Gonzalez Ortega, D. Sandwell, Y. Fialko, J. Gonzalez Garcia, J. Fletcher , A. Nava Pichardo, M. Floyd, and B. Lipovsky<br />
El Mayor Cucapah earthquake ocurred on April 4, 2010, rupturing several previously mapped as well as unidentified faults,<br />
including the Pescadores, Borrego and Paso Superior faults in Cucapah Mountains, and Indiviso fault in the Mexicali valley.<br />
We conducted several campaign GPS surveys of pre-existing and newly established benchmarks within 30 km of the<br />
earthquake rupture. Most of the benchmarks were occupied within days after the earthquake, allowing us to capture the entire<br />
postseismic transient.<br />
GPS timeseries indicate a gradual decay in postseismic velocities having the same sense as the coseismic displacements. We<br />
also analyzed available Synthetic Aperture Radar (SAR) data from ENVISAT and ALOS satellites. The main deformation<br />
features seen in the line of sight displacement maps indicate subsidence in the southern and northern part of the Indiviso and<br />
Paso Superior faults, respectively. We investigate to which extent GPS and InSAR observations can be explained by commonly<br />
assumed mechanisms of postsesimic deformation. In particular, we present a best-fitting afterslip model for the time period of<br />
6 months after the earthquake.<br />
NON-LINEAR BUILDING RESPONSE SIMULATIONS USING <strong>SCEC</strong> SIMULATED GROUND MOTIONS (B-<br />
085)<br />
C.A. Goulet and C.B. Haselton<br />
170 | Southern California Earthquake Center
Poster Abstracts<br />
Although substantial progress has been made in physics-based ground motion simulations in the recent years, the engineering<br />
community is still reluctant to use simulated time series for design. One of the reasons for this is a lack of understanding of<br />
how simulated ground motions compare to recorded ground motions, especially when it comes to their impact on structural<br />
response. There are on-going efforts of validation and verification of simulated ground motions, but these tend to be focused<br />
on record properties or on the response of single-degree-of-freedom systems. We are proposing a different approach: we plan<br />
to compare the nonlinear structural response of buildings subjected to recorded and simulated ground motions, given that<br />
both sets have similar spectral shapes.<br />
The responses of buildings to recorded motions have already been processed in a project recently completed by the PIs. The<br />
recorded set is representative of a magnitude 7 earthquake, rupturing within 20 km from a site with a Vs30 of 400 m/s<br />
(average shear wave velocity of the upper 30 meters of the soil column). We selected <strong>SCEC</strong> simulated records (for the same<br />
type of event and site conditions) with spectral shapes that were consistent with the recorded set previously used by the PIs.<br />
We then performed the structural simulations and compared the response results from both sets of time series (recorded and<br />
simulated). We present the summary of the approach used and the structural response results we have obtained for recorded<br />
and simulated ground motion records.<br />
DETECTION OF ANOMALOUS STRAIN TRANSIENTS USING PRINCIPAL COMPONENT ANALYSIS AND<br />
COVARIANCE DESCRIPTOR ANALYSIS METHODS (A-064)<br />
R.A. Granat, J.W. Parker, S. Kedar, and Y. Bock<br />
We have tested two classes of anomalous transient detectors that are completely independent of each other in origin, logic and<br />
implementation. Principal Component Analysis (PCA) has been successfully implemented in tectonic geodesy for regional<br />
filtering and common mode removal. Covariance Descriptor based detection methods are relatively recent technologies that<br />
have seen considerable success in the field of computer vision, and are predominantly used to detect statistically significant,<br />
spatially correlated anomalies in images. The two techniques examine the data in a fundamentally different and<br />
complementary way. The one (PCA) detecting common fundamental modes of ground motion across the array, and the other<br />
(CDA) detecting statistically significant common anomalies in a space-time “image” composed of deformation time series.<br />
The advantage of the PCA technique lies in its ability to resolve temporal transients that although common to a particular<br />
region, are not necessarily of the same amplitude across it. In addition, examination of higher residual modes highlights<br />
whether or not the transient has propagated across the network in time.<br />
Covariance descriptor methods are typically used in image analysis applications, where a set of filters is applied to an image,<br />
and the outputs of these filters form a feature vector for each pixel. The covariance matrices of the feature vectors for different<br />
image regions are calculated (these are termed the covariance descriptors for the regions), and then compared using a distance<br />
metric. The generalized covariance distance between regions that resemble one another (in the chosen feature space) will be<br />
small, while that between regions that are dissimilar will be relatively large. In this manner anomalies or matches between<br />
regions can be identified. This method can be readily extended to tectonic time series analysis, where the “image” regions are<br />
simply time windows, while the feature vectors are the tectonic displacement time series measurements themselves. The<br />
covariance descriptor of the time series as a whole is calculated and compared with covariance descriptors of localized time<br />
windows. Descriptors for localized windows that are far from the descriptor for the entire time series are likely anomalous.<br />
We present results from synthetic cases, where these methods were tested using an iterative approach, in which the output of<br />
one technique was used to fine-tune the input to the other.<br />
TESTING <strong>SCEC</strong> 3D SEISMIC VELOCITY MODELS IN THE SAN BERNARDINO AND LOS ANGELES BASIN<br />
REGIONS (B-018)<br />
R.W. Graves, A. Plesch, and J. Shaw<br />
The 2001 Mw 4.6 Big Bear Lake earthquake was recorded at over 180 broadband sites of the Southern California Seismic<br />
Network throughout the greater Los Angeles region of southern California. At periods longer than about 1 sec, the ground<br />
motions in the San Bernardino, San Gabriel and Los Angeles basins have significantly larger amplitudes and extended<br />
durations relative to sites outside the basins. To model the longer period (T > 1 sec) near-source motions, Graves (2008)<br />
developed a 3D representation of the basin structure in the San Bernardino region based on the potential field modeling of<br />
Anderson et al. (2000). This study extends the previous analysis by modeling the motions across the San Gabriel, Chino and<br />
Los Angeles basins using two Southern California Earthquake Center three-dimensional seismic velocity models (CVM-S4 and<br />
2011 <strong>SCEC</strong> <strong>Annual</strong> <strong>Meeting</strong> | 171
Poster Abstracts<br />
CVM-H64). CVM-H64 (released as CVM-H 11.9 at the meeting) is a recent revision of the CVM-Harvard model, which<br />
includes a newly developed representation of the San Bernardino basin using the basement surface from Anderson et al.<br />
(2000) adjusted to match interpretations of seismic reflection data (Stephenson et al., 2002) which also constrain the sediment<br />
velocities. The simulations use a minimum shear velocity of 400 m/sec and a grid spacing of 80 m to yield a bandwidth<br />
resolution limit of T > 1 sec. Both models perform reasonably well at reproducing the observed waveforms, amplitudes, and<br />
durations, especially in the San Bernardino and Los Angeles basins at periods of 3 sec and longer. At shorter periods (1–2 sec),<br />
the fit to the recorded motions is less well resolved for both models. This reinforces the conclusions of Graves (2008) that<br />
deterministic modeling at periods approaching 1 sec in regions of complex geology involves more than simply reducing the<br />
minimum velocity threshold, but also requires knowledge of the subsurface structure and distribution of seismic velocities at<br />
relatively short length scales.<br />
LIDAR-DERIVED MEASUREMENTS OF SLIP IN THE MOST RECENT GROUND-RUPTURING<br />
EARTHQUAKES ALONG ELEMENTS OF THE SOUTHERN SAN ANDREAS FAULT SYSTEM (B-114)<br />
D.E. Haddad, C. Madden, J.R. Arrowsmith, J.B. Salisbury, and R.J. Weldon<br />
Tectonically displaced geomorphic markers record the surface manifestation of earthquake-induced ground ruptures. Of<br />
particular interest to earthquake forecast models is the slip produced during the most recent ground-rupturing earthquake.<br />
High-resolution digital topography from light detection and ranging (LiDAR) is a powerful tool for measuring the most recent<br />
meter-scale slip along fault zones. We present surface slip measurements of recent ground-rupturing earthquakes along the<br />
Garlock, Owens Valley, Elsinore, and Blackwater-Calico fault zones. Fault scarp traces were mapped using LiDAR-derived<br />
digital elevation models (DEMs), local topographic gradient and relief maps, and aerial photography. An individual slip<br />
measurement was made for each offset feature (or landform element such as thalweg, channel margin, etc.) by iteratively<br />
reconstructing the topography on either side of the fault and finding the best-matching vertically backslipped offset values. A<br />
goodness-of-fit approach was then used to calculate the best laterally backslipped displacements using a combination of<br />
vertical backslips, horizontal backslips, and topographic scaling. Along-strike, reach-averaged surface displacement<br />
distributions of the most recent earthquakes were then generated from the LiDAR-derived offsets and compared to published<br />
field-derived offset measurements. For the eastern section of the Garlock fault, our LiDAR-derived offsets compared well with<br />
published field measurements and attained an R^2 value of 0.9. Reach-averaged slip in the last event of 4.2 m ±0.7 m for<br />
Searles Valley (2.7 km reach; n = 9), 4.6 m +0.7/-0.9 m for Pilot Knob Valley (24.7 km reach; n = 41), and 3.5 m +0.8/-0.9 m for<br />
Leach Lake and Avawatz Mountains (12.6 km reach; n = 57). LiDAR-derived offset measurements compare well with field<br />
measurements in the comprehensive documentation of along-strike surface slip distributions of the most recent earthquakes.<br />
Furthermore, our results demonstrate the utility of LiDAR-derived offset measurements for fault zones that do not have<br />
sufficient documentation of slip in the last event. These data provide critical input parameters for seismic hazard analyses and<br />
earthquake rupture forecasts that rely on surface slip measurements to physically constrain the occurrences and magnitudes<br />
of ground-rupturing earthquakes (e.g., the Uniform California Earthquake Rupture Forecast).<br />
APPLICATION OF ZH RATIO TO THE URBAN LOS ANGELES REGION FOR SHALLOW S-WAVE<br />
VELOCITY STRUCTURE (A-034)<br />
T. Hakamata, T.E. Yano, and T. Tanimoto<br />
In order to predict seismic ground motion, the model Vs30 serves an important role to provide very shallow structure.<br />
However, in order to predict long-period ground motions (~ 0.1 Hz), the depth range must be extended from 30 m to a much<br />
deeper depth. We developed a method that uses Rayleigh-wave ellipticity data, estimated from seismic noise (the ZH method),<br />
to derive shallow S-wave structure (< 10 km in depth) in the Los Angeles area, using broadband data (about 150 stations)<br />
recorded at local dense SCSN network.<br />
Using two years (2002 and 2003) of continuous data, we tested an approach that analyzes microseisms about 0.1-0.3 Hz which<br />
are dominated by Rayleigh waves. In fact, we observe strong systematic geographic variations in the ZH ratios between the<br />
LA basin and outside of this basin. Depth sensitivity of the ZH ratios of fundamental Rayleigh wave is confined to<br />
approximately 10 km. With the ZH ratios, we thus have a clean data set to derive shallow S-wave structure for the upper 10<br />
km of the Earth.<br />
Application to the urban Los Angeles region indicates that systematic perturbations in S-wave velocity structure are required<br />
up to about 50% of the reference velocity model for the region (the <strong>SCEC</strong> Community Velocity Models). This systematic<br />
perturbation implies that patterns of surface ground motion by large earthquakes in the region may dramatically change.<br />
172 | Southern California Earthquake Center
Poster Abstracts<br />
We will present the systematic difference of ZH ratio measurements depending on the different area and S-wave structure due<br />
to the inversion using ZH ratio measurements.<br />
THE <strong>SCEC</strong>-USGS DYNAMIC EARTHQUAKE RUPTURE CODE VERIFICATION EXERCISE (A-115)<br />
R.A. Harris, M. Barall, R. Archuleta, B. Aagaard, J.P. Ampuero, D.J. Andrews, V. Cruz-Atienza, L. Dalguer, S. Day, N.<br />
DeDontney, B. Duan, E. Dunham, A.A. Gabriel, P. Galvez, Y. Kaneko, Y. Kase, J. Kozdon, N. Lapusta, S. Ma, P.M. Mai, H.<br />
Noda, D. Oglesby, K. Olsen, and S. Somala<br />
We summarize recent progress by the <strong>SCEC</strong>-USGS Dynamic Rupture Code Verification Group. In February 2011 we held our<br />
most recent workshop where we examined how <strong>SCEC</strong> and USGS researchers spontaneous-rupture computer code results<br />
agree (or disagree) when computing benchmark scenarios for dynamic earthquake rupture. Our recent benchmarks were a 2D<br />
case of thermal pressurization and 2D and 3D cases of slip-weakening friction on branched vertical strike-slip faults set in an<br />
elastic medium.<br />
Since our February 2011 workshop, we have officially archived the results of the TPV12 and TPV13 Extreme Ground motion<br />
normal-fault benchmarks that were used in our new paper Harris, R.A., M. Barall, D.J. Andrews, B. Duan, E.M. Dunham, S.<br />
Ma, A.-A. Gabriel, Y. Kaneko, Y. Kase, B. Aagaard, D. Oglesby, J.-P. Ampuero, T.C. Hanks, N. Abrahamson, Verifying a<br />
Computational Method for Predicting Extreme Ground Motion, Seismological Research Letters, Vol. 82, No. 5,<br />
September/October 2011. The online archive allows newcomers (and veterans) to conduct new TPV12 and TPV13 extreme<br />
ground motion simulations while at the same time we are preserving the results that are described in our journal publication,<br />
for scientific repeatability.<br />
In the fall of 2011, our group will embark on our next benchmark exercises, both of which will assume a slip-weakening<br />
framework. One new benchmark will involve heterogeneous initial stresses on a planar vertical strike-slip fault set in an<br />
elastic medium, using a stress-conditions methodology that is updated from the 2010 100-runs exercise. A second new<br />
benchmark will involve more-homogeneous initial stresses on branching faults that are this time set in a medium that allows<br />
for plastic yielding.<br />
For more information please visit our website: scecdata.usc.edu/cvws<br />
PRELIMINARY PALEOSEISMIC RESULTS FROM THE ECHO PLAYA TRENCH SITE ON THE CENTRAL<br />
GARLOCK FAULT, CHINA LAKE NAWS, NEAR RIDGECREST, CA (A-133)<br />
R.D. Hartleb, C.D. Kemp, A. Lutz, E.K. Frost, and S.C. Lindvall<br />
Investigation of a new paleoseismic trench site along the central Garlock fault at Echo Playa on the China Lake Naval Air<br />
Weapons Station exposed evidence for at least four, and as many as six, surface-rupturing earthquakes. The Echo Playa site is<br />
located within a roughly 150-m-wide and 1.5-km-long transtensional step-over that has formed a closed basin fringed by<br />
alluvial fan and colluvial deposits that grade basinward into laterally continuous playa sediments. Numerous subdued northand<br />
south-facing fault scarps are recognized between the playa edge and the ridges of the step-over. These faults generally<br />
deform bedrock or coarse alluvial fans, although two fault strands have formed low scarps along the playa margin. Two<br />
trenches opened at Echo Playa across these playa margin faults exposed roughly 5 m of generally conformable stratigraphy,<br />
recording several episodes of fan progradation and lacustrine/palustrine transgression along the playa margin.<br />
Evidence for four surface-rupturing earthquakes is preserved within a roughly 30-m-wide zone of distributed deformation<br />
where correlative sets of faults and fissure fills terminate upward at the base of laterally continuous stratigraphic horizons.<br />
The distributed nature of deformation here has produced very small individual offsets that indicate different combinations of<br />
lateral and normal slip components. Age estimates for strata that bracket each rupture are pending radiocarbon analyses of<br />
detrital charcoal and optically stimulated luminescence analyses of fine-grained playa deposits. Initial age estimates based on<br />
an assumption of reasonable sedimentation rates and the observed lack of soil development suggest that these four to six<br />
surface-rupturing earthquakes occurred during the Holocene.<br />
Echo Playa is the easternmost paleoseismic trench site along the Garlock fault, and data from this site are expected to provide<br />
a basis for developing an earthquake chronology for the eastern Garlock fault, which is currently not well characterized. These<br />
data also will provide an important opportunity to refine estimates of earthquake chronology, fault rupture length, and<br />
recurrence intervals along the central and western Garlock fault, contributing to an improved understanding of seismic<br />
hazard in southern California.<br />
2011 <strong>SCEC</strong> <strong>Annual</strong> <strong>Meeting</strong> | 173
Poster Abstracts<br />
USING GROUND-BASED LIDAR AND MORPHOMETRIC ANALYSIS TO STUDY THE EVOLUTION OF<br />
PRECARIOUSLY BALANCED ROCKS (B-010)<br />
J.E. Harvey and D.H. Rood<br />
Precariously balanced rocks (PBRs) are fragile geologic features that can be destroyed by ground motion during earthquakes.<br />
Measuring the fragility of PBRs yields an estimate of unexceeded ground motion, which, when combined with an estimate of<br />
the duration of PBR exposure, allows us to test the USGS National Seismic Hazard Maps (NSHM). However, the age of such<br />
fragile features is poorly known because we lack a detailed understanding of the geomorphic processes acting to exhume<br />
corestone PBRs.<br />
Here we use ground-based LiDAR to study the geomorphic evolution of PBRs in the Mojave desert, and use this information<br />
to constrain unexceeded ground motion near the San Andreas Fault. Lovejoy Buttes is an inselberg rising above a broad<br />
pediment east of Palmdale, CA. At this site, PBRs are granitic corestones that form as a result of weathering along joint<br />
surfaces at depth before being subsequently exhumed by fluvial and hillslope processes incision. We use terrestrial laser<br />
scanning to generate a high resolution (~1-2 m) DEM of the studied catchment, allowing us to explore the relation of erosional<br />
processes to the location of studied PBRs. PBRs are sampled for cosmogenic Be-10 along a vertical profile. These exposure ages<br />
are corrected for shielding by the rock itself, and fed into a forward model to yield the most likely exhumation history for each<br />
PBR (Balco et al., 2011, Quaternary Geochronology).<br />
Preliminary results of this ongoing work suggest that PBRs in the studied catchment at Lovejoy Buttes were exhumed after the<br />
last glacial maxmimum (~20 ka). PBR age is likely a combination of proximity to an incising drainage and position relative to<br />
major knickpoints along channels. Future work will include expanding the study to another site in the Mojave characterized<br />
by lower landscape relief and greater distance to major faults. This study is improving our understanding of the geomorphic<br />
evolution of PBRs and helping to place realistic constraints on the numerical models used in the interpretation of PBR ages<br />
from Be-10 data.<br />
WAVEFORM RELOCATED EARTHQUAKE CATALOG FOR SOUTHERN CALIFORNIA (1981 TO 2011) (B-<br />
062)<br />
E. Hauksson, W. Yang, and P. Shearer<br />
The Pacific North-America plate tectonic deformation is the main process that causes small and large earthquakes in southern<br />
California. Secondary processes such as geothermal exploitation, extensional gravitation collapse, or crustal delamination also<br />
cause ongoing seismicity. The overall pattern of waveform relocated seismicity shows the familiar prominent features such as<br />
mainshock-aftershock sequences of the 1992 Landers, 1999 Hector Mine, 1994 Northridge, and 2010 El Mayor-Cucapah<br />
superimposed on a high level of background seismicity near the late Quaternary faults. In particular, the background<br />
seismicity along the San Andreas fault, capable of generating the largest earthquakes, is diffuse and the background rate is<br />
low.<br />
In addition, to the aftershock zones, other regions that are driven by secondary processes such as the southern Sierra, Banning<br />
Pass, Coso regions, and the Salton Trough exhibit high levels of seismicity. As an example, the Banning Pass region is<br />
characterized by numerous west to northwest trending alignments of seismicity, which are both mainshock and swarm like<br />
sequences, suggesting the presence of multiple tectonic processes.<br />
For the first time, we are able to resolve new detailed seismicity patterns at the north end of the 2010 El Mayor-Cucapah<br />
aftershock zone, where the majority of the aftershocks occurred. The occurrence of aftershocks is not simply related to the<br />
principal slip surfaces of faults that accommodate the bulk of the slip. As two other examples also show, the 1992 Landers and<br />
1999 Hector Mine earthquake sequences, aftershock distributions exhibit heterogeneous spatial distribution, which may be<br />
related to heterogeneous stress release in the region. Geometrical complexities such as step-overs or push-ups, as mainshock<br />
slip transfers from one fault segment to the next, also contribute to complexity of aftershock productions.<br />
Adjacent to the US Mexico boarder, the background seismicity patterns exhibit interaction of northeast and northwest<br />
trending fault segments. Particularly in the Salton Trough region, the relocated seismicity exhibits spatial distributions that are<br />
much tighter than what is observed with the routine catalog. These refined distributions often align with late Quaternary<br />
faults or other tectonic features. In some cases they suggest the presence of previously unmapped faults.<br />
HOW DO “GHOST TRANSIENTS” FROM PAST EARTHQUAKES AFFECT GPS SLIP RATE ESTIMATES ON<br />
SOUTHERN CALIFORNIA FAULTS? (B-151)<br />
174 | Southern California Earthquake Center
E.H. Hearn, F.F. Pollitz, W.R. Thatcher, and T. Onishi<br />
Poster Abstracts<br />
Elastic block models are generally used to infer slip rates on fault segments in tectonically complex areas, such as southern<br />
California (e.g. McCaffrey, 2005: Meade et al., 2005). These models implicitly assume steady-state deformation. However,<br />
owing to viscoelastic effects of past large earthquakes, deformation rates and patterns around major faults are expected to<br />
vary with time. Where viscoelasticity has been incorporated into block models, differences in inferred slip rates have resulted<br />
(Johnson et al.,2007). ( (Here, we investigate the extent to which viscoelastic velocity perturbations (or “ghost transients”) from<br />
individual earthquakes affect elastic block model-based inferences of fault slip rates from the southern California GPS velocity<br />
field. First, we calculate average velocities and time-dependent perturbations relative to this average at all GPS sites due to<br />
repeated large earthquakes on a particular fault segment. (We deal with perturbations because to recover the velocities, we<br />
would have to compute and sum cycle-average velocities and perturbations for all fault segments in the region.) Next, we<br />
invert two GPS velocity fields for slip rates using an elastic block modeling approach: one field that has been corrected for the<br />
perturbation, and one which has not, and we compare the resulting slip rates. For now, the viscoelastic models are simple<br />
(layered, with linear rheologies), and locking depth in the block models is fixed. ( (We find that if asthenosphere viscosities are<br />
low enough (3 x 10**18 Pa-s) the current GPS velocity field is significantly perturbed by the 1857 M 7.9 San Andreas Fault<br />
(SAF) earthquake sequence; that is, current strain rates around the SAF are lower than their average values. Correcting the<br />
GPS velocity field for this perturbation adds up to about 5 mm/yr to the SAF slip rate along the Mojave and San Bernardino<br />
segments, consistent with the results of Johnson et al. (2007). The GPS velocity perturbation due to the most recent, large<br />
Garlock Fault earthquake (assumed to be an M 7.5 event in 1640) is smaller. In this case, inversions of the corrected and<br />
uncorrected GPS velocity fields yield near-identical slip rates for all of the faults in our block model. This suggests that the<br />
discrepancy between geodetic and geologic slip rates for the Garlock Fault is not due to a ghost transient.<br />
PARALLELIZATION OF THE VIRTUAL CALIFORNIA EARTHQUAKE SIMULATOR (B-087)<br />
E.M. Heien, M.B. Yikilmaz, M.K. Sachs, J.B. Rundle, L.H. Kellogg, and D.L. Turcotte<br />
Virtual California is an earthquake simulation program designed to help analyze the behavior of fault systems over long time<br />
periods. These simulations can be computationally intensive due to the stress calculations that occur during long term fault<br />
movement and the multiple rupture propagation calculations that occur during each earthquake. In order to handle fault<br />
models with high resolution, we parallelized Virtual California using MPI and OpenMP. Here we demonstrate the<br />
effectiveness of these techniques in providing up to a 15.9x speedup for the core calculation on 16 processors. We also show<br />
where further work can ameliorate the effects of communication which reduces total simulation speedup on 16 processors to a<br />
factor of 5.8x.<br />
IMPLEMENTATION OF A SEISMIC SEQUENCE VISUALIZATION SYSTEM USING GEOGRAPHIC<br />
INFORMATION SYSTEMS (A-156)<br />
B.J. Hellige, M.A. Wagner, and S. Reed<br />
The VDO Production team addressed the Grand Challenge with the goal of producing eight movies using <strong>SCEC</strong> Virtual<br />
Display of Objects (<strong>SCEC</strong>-VDO). A separate final VDO product was generated for each of the following earthquake sequences:<br />
the Tohoku (Japan), Canterbury (New Zealand), El Mayor-Cucapah (Mexico), Maule (Chile), Haiti, and Indonesian trench<br />
sequences. Each movie begins with the relevant earthquake sequence animation (at depth) to give the viewer perspective of<br />
the breadth of the sequence. The sequence animates in two views: 1) an overhead map view on the left, and 2) space-time on<br />
the right. This feature introduces the viewer to earthquake sequences relative to the dimensions of space and time. The movie<br />
then showcases the added Geographic Information Systems (GIS) capabilities by overlaying earthquake sequences and<br />
ShakeMaps with GIS layers that highlight population density, nuclear power plants, and hospitals. A seventh VDO with GIS<br />
information and rupture simulations displays potential risks associated with earthquake hazards in Southern California, along<br />
the San Andreas fault. Additionally, an eighth VDO was created to show seismicity in Southern California and Northern<br />
Mexico over the last 20 years. This video uses a space-time plot to show where and when earthquakes occurred in California<br />
from 1991-2010. Successfully producing these seven VDOs with space-time plots and GIS was the final goal for the 2011 USEIT<br />
Grand Challenge.<br />
SHAKING AND FLOODING BY THE TOHOKU-OKI EARTHQUAKE (A-108)<br />
D. Helmberger, S. Wei, J.P. Avouac, H. Kanamori, and J. Jiang<br />
Large subduction zone earthquakes pose one of the greatest nature hazards to mankind, either by shaking down structures<br />
and/or flooding. Rupture properties of these rare events are poorly understood, especially tsunamigenic earthquakes with<br />
2011 <strong>SCEC</strong> <strong>Annual</strong> <strong>Meeting</strong> | 175
Poster Abstracts<br />
little pre-shaking such as the 1896 Sanriku earthquake. The well recorded Tohoku-Oki earthquake sheds some new light on<br />
these issues. Here we document the history of the rupture from the inversion of accelerometric waveform data and high-rate<br />
GPS data. Our results demonstrate that the flooding was caused by the shallow ruptured (Mw~9) portion close to the trench<br />
while the shaking came from ruptures at depth >30km with a relatively small magnitude (Mw~8.5). Several deep pockets of<br />
high frequency energy release can be resolved, which correspond to locations predicted from back-projection. The Peak<br />
Ground Velocity (PGV) recorded by over 1400 strong motions and ~400 high rate GPS stations is nicely correlated with<br />
geological structure (topography). Separation of the wavefield into upgoing and downgoing energy indicates that the shaking<br />
on the island is mainly controlled by upgoing energy. Forward calculation indicates that the shallow basin structure could<br />
amplify the ground shaking and some of the high frequency arrivals could be explained by using a modified source time<br />
function which suggests a pulse like rupture.<br />
SENSITIVITY OF THE SOUTHERN SAN ANDREAS FAULT SYSTEM TO TECTONIC BOUNDARY<br />
CONDITIONS (B-141)<br />
J.W. Herbert and M.L. Cooke<br />
The southern Big Bend of the San Andreas fault incorporates numerous non-vertical, non-planar, and intersecting active<br />
surfaces. Our three-dimensional Boundary Element Models incorporate complex fault geometries from the Southern<br />
California Earthquake Center’s Community Fault Model and a range of tectonic boundary conditions from Global Positioning<br />
System studies of the region (45-50mm/yr and 320˚-325˚). We also test the sensitivity of fault slip rates to the magnitude and<br />
orientation of plate velocity applied to the model. Consequently our models provide a range of fault slip rates associated with<br />
present-day uncertainties on plate motion rather than a single slip rate. Model slip rates match most of the available geologic<br />
slip rates and discrepancies may owe to inaccurate fault geometries. More northerly plate velocity (325˚) produces greater<br />
transpression along the San Andreas Fault system. This is associated with greater uplift of the San Bernardino Mountains,<br />
greater reverse-slip along range bounding reverse thrust faults, lower strike-slip rates along the San Andreas Fault and greater<br />
strike-slip rates along the Eastern California Shear Zone and Garlock fault. These results suggest that the degree of regional<br />
transpression controls the partitioning of deformation between local uplift, slip along the San Andreas system and slip along<br />
the ECSZ. A northerly shift in plate velocity orientation could account for the abandonment of the Mill Creek strand of the San<br />
Andreas fault ~120 ka.<br />
FREQUENCY-MAGNITUDE DISTRIBUTIONS OF TRIGGERED AND NON-TRIGGERED POPULATIONS OF<br />
SEISMICITY (B-108)<br />
S. Hernandez and E.E. Brodsky<br />
Large dynamic strains carried by seismic waves are known to trigger seismicity far from their source region. This effect has<br />
been attributed to several mechanisms including Coulomb frictional failure and induced changes in fault strength and pore<br />
pressures in the far field. As a harbinger of seismicity rate change however, it is as yet unconfirmed whether the passage of<br />
dynamic surface waves can also induce societally significant earthquake changes. To test for such changes, we utilize the interevent<br />
time ratio R to identify populations of seismicity that contain larger than average proportions of triggered earthquakes.<br />
The inter-event time ratio, or R-ratio, is computed in California for the time period 1 Jan 1984 - 15 Apr 2011 and utilizes the<br />
ANSS catalogue, nominally complete down to M2.1. In particular, R-ratios for spatial grids of 0.1x0.1 degrees are calculated<br />
with respect to each potential far field trigger, defined as any event with imposed strain greater than 1e-8 and epicentral<br />
distance greater than 800 km from source. The bias introduced by finite catalog effects is corrected using 2 techniques: 1)<br />
directly estimating the deviation from homogenous (i.e., Poissonian) behaviour using randomized simulations of local<br />
seismicity catalogs, and 2) restricting local seismicity catalogs to symmetric windows of 1, 2, and 5 years around each potential<br />
far field trigger. We then measure the Gutenberg-Richter (GR) frequency-magnitude distributions for 2 broad classes of<br />
seismicity: those that include many triggered events (R < 0.484, or ~10% rate change or greater) and those that include very<br />
few or possibly negative rate change (R > 0.484). In general, we find that the distribution of b-values for both types of datasets<br />
show significant overlap and persists when both techniques for eliminating our time-dependent finite catalog bias are applied.<br />
For populations with low R, GR b-values are 1.13 +/- 0.15. For high R populations, GR b-values are 1.09 +/- 0.09. Additionally,<br />
neither b-values nor mean maximum magnitude show any correlation with respect to calculated peak dynamic strain. In<br />
terms of hazard estimates, our results indicate an inability to resolve societally significant induced changes in Gutenberg-<br />
Richter frequency-magnitude distributions within California at various temporal scales.<br />
STOCHASTIC SOURCE MODEL FOR SEISMIC HAZARD ESTIMATION (B-113)<br />
176 | Southern California Earthquake Center
S. Hiemer, Q. Wang, D.D. Jackson, Y.Y. Kagan, S. Wiemer, J.D. Zechar, and J. Woessner<br />
Poster Abstracts<br />
We are developing a stochastic earthquake source model appropriate for intermediate to long-term forecasts, expressed in<br />
terms of earthquake rate per unit area-time-magnitude-focal mechanism direction. We start with what is known best: the<br />
frequency-magnitude distribution, slip rates on major faults, long-term strain rate, and instrumentally recorded and historic<br />
earthquake catalogs. We illustrate our approach with an application to California. We use the stochastic earthquake source<br />
model to simulate hazard-relevant earthquakes. The resulting simulated earthquakes are represented by spatially tapered<br />
ruptures on hypothetical rectangular fault planes with specified length, width, strike, dip, and rake. Their locations and<br />
orientations approximate those of mapped faults based on empirical studies as well as historical and instrumental seismicity<br />
records. Many mapped faults are located only after major earthquakes occur on them, and many 20th century earthquakes<br />
occurred on previously unrecognized faults. We identify testable features of the model and devise quantitative prospective<br />
and/or retrospective tests as appropriate for parameter optimization.<br />
STATION-TO-STATION GREEN’S FUNCTIONS EXTRACTED FROM SEISMIC CODA IN SOUTHERN<br />
CALIFORNIA (B-054)<br />
E.T. Hirakawa and S. Ma<br />
It has been demonstrated recently that correlation of seismic diffuse field (ambient noise and coda) recorded at two stations<br />
leads to deterministic station-to-station Green’s functions. The theory requires a homogeneous distribution of uncorrelated<br />
sources or scatters. However, this condition is not satisfied by the ambient noise data, which is dominated by the microseisms.<br />
In this study, we will explore the seismic coda recorded in southern California for over 10 years. In contrary to ambient<br />
seismic noise, coda waves, generated by multiple scattering by small-scale heterogeneities, are independent of the sources that<br />
generate them. The Green’s function extracted from coda waves should approach more closely to the true Green’s functions.<br />
These Green’s functions will provide a way to quantify the bias in these two different data sets. We will also explore the<br />
frequency content and amplitude of coda-wave Green’s functions and compare them with numerical Green’s functions based<br />
on the current Community Velocity Models of southern California.<br />
CREATING PROBABILISTIC SEISMIC HAZARD MAPS FROM CSEP DATA (B-125)<br />
J.R. Holliday<br />
One of the loftier goals in seismic hazard analysis is the creation of an end-to-end earthquake prediction system: a "rupture to<br />
rafters" work flow that takes a prediction of fault rupture, propagates it with a ground shaking model, and outputs a damage<br />
or loss profile at a given location. So far, the initial prediction of an earthquake rupture (either as a point source or a fault<br />
system) has proven to be the most difficult and least solved step in this chain. However, this may soon change.<br />
The Collaboratory for the Study of Earthquake Predictability (CSEP) has amassed a suite of earthquake source models for<br />
assorted testing regions worldwide. These models are capable of providing rate-based forecasts for earthquake (point) sources<br />
over a range of time horizons. Furthermore, these rate forecasts can be easily refined into probabilistic source forecasts. While<br />
it's still difficult to fully assess the "goodness" of each of these models, progress is being made: new evaluation procedures are<br />
being devised and earthquake statistics continue to accumulate. The scientific community appears to be heading towards a<br />
better understanding of rupture predictability. It is perhaps time to start addressing the second step in the earthquake<br />
prediction system.<br />
In this poster, I show how a simple ground shaking model can be constructed and applied directly to CSEP formatted source<br />
output. As a case study, I present probabilistic seismic hazard maps for peak ground acceleration (PGA) in the state of<br />
California using sixteen models supplied to the Regional Earthquake Likelihood Models (RELM) experiment. Furthermore, I<br />
give a full PGA exceedance profile for Palm Springs as calculated by each of the sixteen input models.<br />
2011 <strong>SCEC</strong> <strong>Annual</strong> <strong>Meeting</strong> | 177
Poster Abstracts<br />
2011 LONG BEACH/SIGNAL HILL, CA SEISMIC STUDY (B-076)<br />
D.D. Hollis<br />
Presented is an overview, maps and data of a recent active and passive seismic study recorded by a dense seismic network in<br />
Long Beach, California. The network consists of approximately 5,000 short-period vertical sensors covering a 7 by 10 km area,<br />
with an average station spacing of 100m. The network recorded continuously (24 hours/day) for a period of 6 months. The<br />
primary goal of the survey was to collect 3D reflection seismic data over the Long Beach Oil Field. Another goal of the survey<br />
was to collect passive seismic for basic earthquake and exploration seismology research.<br />
NEAR REAL-TIME ESTIMATION OF VELOCITY GRADIENT TENSOR FIELDS FOR CONTINUOUS<br />
MONITORING IN SOUTHERN CALIFORNIA (B-143)<br />
W.E. Holt, G. Shcherbenko, and E. Caruso<br />
We present test results of a geodetic network processing system designed to detect anomalous strain transients. This work is a<br />
first step in the development of a continuous, near-real-time monitoring system for Southern California. The modeling<br />
procedure consists of interpolating velocities within a region to estimate the velocity gradient tensor field. These velocities are<br />
time-dependent estimates of velocity obtained from CGPS data using a simple moving average filter, while also removing<br />
seasonal signal estimates. Time dependent velocities can be output at any regular time interval (e.g., daily, weekly) and the<br />
associated velocity gradient tensor field for Southern California can then be estimated for each respective epoch.<br />
Regularization of the solution for Southern California consists of obtaining the sharpest estimate of strain rates possible that<br />
can be supported by the CGPS data. The smoothing of the strain rate solution is controlled through optimization of a<br />
functional in a formal least-squares inversion. Both the transient detection exercise results, along with results from real CGPS<br />
data, are presented. Results to date suggest that the method is well-suited for uncovering transients following past real<br />
earthquakes, as well as transients within the blind test exercise that involve extended periods of slow slip over long-time<br />
periods of several years. Presently further testing and refinement of the methodology is necessary to enable detection of<br />
transients that occur over shorter time periods of 2 – 6 months.<br />
NUMERICAL MODELING OF INTERSEISMIC EARTHQUAKE-INDUCED VERTICAL MOTION<br />
ASSOCIATED WITH THE SAN ANDREAS FAULT SYSTEM (B-145)<br />
B.P. Hooks, B.R. Smith-Konter, and G. Thornton<br />
An accurate representation of vertical motion along active plate boundaries is a critical component of earthquake hazard<br />
models, as the accumulation of strain and vertical displacement can greatly affect the strength of the crust, and therefore, the<br />
associated seismic hazard. However, analysis of vertical deformation is rarely done due to the large uncertainty in the<br />
geodetic datasets. Here we present 3D numerical models that reproduce the strain patterns associated with the San Andreas<br />
and subsidiary faults. Our models utilize a commercial finite difference code (FLAC3D) that simulates the deformation of<br />
Earth material using mechanical and thermal constitutive relationships. We use a temperature-dependent viscous model for<br />
the lower crust (> 350 C) and plastic upper crust (Mohr-Coulomb with strain softening criteria). Model temperature controls<br />
the thickness of the upper crust and the viscosity of the lower crust, and therefore the overall strength of the model.<br />
Deformation, including the formation of large-scale fault systems, is driven by a basal shear consistent with the <strong>SCEC</strong> Crustal<br />
Motion Model. The model reproduces first-order characteristic horizontal velocities, strain rates, and stress rates associated<br />
with the San Andreas Fault System that compare favorably to reported measurements and previous modeling results.<br />
Additionally, vertical displacement and velocity results reproduce first-order vertical offset marker and tide gauge datasets<br />
and agree well with interseismic vertical deformation produced by a 3D semi-analytical model that applies geologic strike-slip<br />
rates along active faults. Both models suggest three primary areas of the San Andreas Fault System where vertical motion is<br />
significant: the Salton Trough, Death Valley, and the Big Bend. The Salton Trough and Death Valley are areas of subsidence<br />
controlled by crustal transtension resulting in thinned and weakened crust with in a lower potential to accumulate large<br />
stresses. The Big Bend region has uplifted due to a transpressional restraining bend. The substantial uplift and evolving<br />
crustal stress conditions within this area would have thickened and strengthened the crust resulting in relatively larger stress<br />
accumulation. The long-term effect of the non-linear feedbacks between vertical deformation, thermal advection, and crustal<br />
rheology causes a dynamic link between geomorphic signal, strain accumulation and long-term seismicity.<br />
178 | Southern California Earthquake Center
Poster Abstracts<br />
STRONG GROUND MOTION IN PORT-AU-PRINCE, HAITI, DURING THE 12 JANUARY 2010 M7.0 HAITI<br />
EARTHQUAKE (B-014)<br />
S.E. Hough, T. Taniguchi, J.R. Altidor, D. Angllade, S.L. Mildor, and D. Given<br />
No strong motion records are available for the 12 January 2010 M7.0 Haiti earthquake. We use recordings of M3.5-4.5<br />
aftershocks as well as detailed considerations of damage to estimate the severity and distribution of mainshock shaking in<br />
Port-au-Prince. Relative to ground motions at a hard-rock reference site, peak accelerations are amplified by a factor of<br />
approximately 2 at sites on low-lying deposits in central Port-au-Prince and by a factor of 2.5-3.5 on a steep foothill ridge in the<br />
southern Port-au-Prince metropolitan region. The observed amplification along the ridge cannot be explained by sedimentinduced<br />
amplification, but the observed amplitude, predominant periods, variability, and polarization are consistent with<br />
predicted topographic amplification by a steep, narrow ridge. Although damage was largely a consequence of poor<br />
construction, the damage pattern inferred from analysis of remote sensing imagery provides evidence for a correspondence<br />
between small-scale (0.1-1.0 km) topographic relief and high damage. Mainshock shaking intensity can be estimated crudely<br />
from a consideration of macroseismic effects: in the areas of Port-au-Prince that experienced relatively light damage, we<br />
estimate PGA on the order of 0.10-0.15g (MMI VI). We further present detailed, quantitative analysis of the marks left on a tile<br />
floor by an industrial battery rack displaced during the mainshock, at the location where we observed the highest weak<br />
motion amplifications. Results of this analysis indicate that mainshock shaking was significantly higher at this location (~0.5g,<br />
MMI VIII) relative to the shaking in parts of Port-au-Prince that experienced relatively light damage. This estimate of PGA is<br />
consistent with that estimated independently using the weak-motion amplification factors together with the estimate for<br />
shaking intensity apart from local amplification. Our results illustrate how well-documented observations of rigid body<br />
horizontal displacement during earthquakes can be used to estimate peak ground accelerations in the absence of instrumental<br />
recordings of ground motion.<br />
PROPERTIES OF RUPTURE PULSES INDUCED BY DAMAGED FAULT ZONES (A-113)<br />
Y. Huang and J.P. Ampuero<br />
Low-velocity fault zones (LVFZ) are found in most mature faults. They are usually 100-400 m wide and have ~20%-60% wave<br />
velocity reductions relative to the country rock. To study the effect of LVFZs on earthquake rupture and the radiated<br />
wavefield, we conduct 2D spectral element simulations of dynamic rupture on faults that bisect a LVFZ, considering a range<br />
of velocity reductions and widths. Most earthquakes apparently have slip rise times much shorter than their overall rupture<br />
duration. A number of dynamic mechanisms for such pulse-like ruptures have been proposed, including frictional self-healing,<br />
fault strength heterogeneities and bimaterial effects. We find that ruptures in LVFZs with strong enough wave velocity<br />
contrast behave as pulses. These pulses are generated by fault locking induced by waves reflected from the boundaries of the<br />
LVFZ. Their rise time is proportional to the wave travel time across the LVFZ. Pure pulse-like rupture is favored by high<br />
velocity reduction and narrow width of the LVFZ. This mechanism of pulse generation is robust to variations of initial stress,<br />
smoothness of the LVFZ structure, rupture mode and exclusion of frictional healing.<br />
Moreover, we find that LVFZs can generate complex rupture patterns. LVFZs with low velocity reduction induce multiple<br />
rupture fronts involving co-existing pulses and cracks. LVFZs with certain widths can accelerate the transition to supershear<br />
rupture speed. The LVFZ can also induce repeated nucleation of pulses in front of a crack. These additional effects of LVFZs<br />
on dynamic rupture can have characteristic signatures on the radiated wavefield and contribute especially to high frequency<br />
ground motions. Given the natural existence of LVFZ and the generality of the pulse generation mechanism presented, it<br />
seems unlikely for earthquakes to propagate as pure cracks.<br />
To further analyze the relation between wavefield and rupture healing fronts, we are analyzing the dynamic fault stresses<br />
generated by elementary kinematic sources inside a LVFZ. Our goal is to identify which wave phase (such as S or SS) plays the<br />
dominant role in the process of pulse generation and. By studying the amplitude and timing of this phase as a function of<br />
velocity reduction and width of the LVFZ, we can rationalize the effect of fault zone properties on the induce pulses, including<br />
their conditions of existence, their rise time and their supershear transition.<br />
SOURCE PROCESSES OF MICROEARTHQUAKES AT PARKFIELD, CA, DETERMINED BY NEAR-SOURCE<br />
OBSERVATION AT SAFOD MAIN HOLE (B-034)<br />
K. Imanishi and W.L. Ellsworth<br />
Near-source observation of earthquakes in deep boreholes and mines provides significant opportunities to enhance our<br />
understanding of the source properties of earthquakes. Short hypocentral distances and a high-Q environment make it<br />
2011 <strong>SCEC</strong> <strong>Annual</strong> <strong>Meeting</strong> | 179
Poster Abstracts<br />
possible to observe earthquake processes that cannot be seen in shallow boreholes or at the surface. The SAFOD Main Hole is<br />
a 3.2 km-deep inclined borehole that crosses the active traces of the San Andreas Fault. A 3-component 15 Hz GS-20DM<br />
geophone was deployed within the fault zone at depths between 2350 and 2750 m. Because of the close proximity to<br />
earthquake sources, we routinely observed earthquakes with Mw < 0 with high signal-to-noise ratio. Events were recorded at<br />
three different sampling rates (1000, 2000, and 4000 sps) depending on observation period (2005 - 2011). This study focuses on<br />
earthquakes with S-P time differences shorter than 0.5s, corresponding to hypocentral distance less than 3 km. We determined<br />
source parameters by the Multi-Window Spectral Ratio (MWSR) method (Imanishi and Ellsworth, 2006). The key step in the<br />
method is to stack the ratios calculated from moving windows taken along the record starting with the direct waves. We<br />
confirmed that stacking better suppresses the random noise due to differences in path than single-window methods,<br />
producing a better estimate of the source spectral ratio. For Mw>-1, the calculated stress drops range between 0.1 and 100 MPa.<br />
These observations indicate that there is no breakdown in stress drop scaling for Mw>-1. The stacked spectral ratios show that<br />
corner frequencies of events for Mw
Poster Abstracts<br />
incorporated as additional block elements that are adjusted to emulate the general geometric and dynamic characteristics of<br />
buildings in city-like arrangements. We conduct our study in the greater Los Angeles basin using the main shock of 1994<br />
Northridge earthquake for frequencies up to 2 Hz and a domain size of 85 x 85 x 42.5 km 3 as the first step of the DRM. Then,<br />
we reduce the size of the region to a small subdomain of 2 x 2 x 1 km 3 within the downtown Los Angeles region and introduce<br />
the building structures, for the second step of the DRM, in order to perform the repeated simulations of the parametric study.<br />
TESTING SEGMENTATION MODELS (B-122)<br />
D.D. Jackson<br />
Many hazard models and earthquake forecasts assume that large earthquakes occur on fault segments whose boundaries are<br />
effective in stopping or impeding rupture. A corollary is that the end points of rupture should lie “at” the segment boundaries.<br />
Here I propose a test that segment boundaries do in fact affect earthquake rupture. The test requires that faults and segment<br />
boundaries be defined in advance by map polygons, and that an objective procedure be specified for defining the end points<br />
of a future earthquake rupture. A segmentation model will then be judged successful to the extent that rupture termini fall<br />
into the boundary polygons in greater proportion than their relative area. Polygons are required in order to judge whether<br />
rupture ends “at” a boundary, and the polygons’ sizes should reflect the uncertainties of the estimated boundary locations.<br />
Retrospective testing is useful but will not be definitive because it requires arbitrary a-posteriori data selection. Prospective<br />
testing is a challenge because it requires precise definitions and rules for selecting data for future earthquakes. Some seismic<br />
hazard models, such as those prepared by the Working Group on California Earthquake Probabilities, imply the rate at which<br />
rupture termini should land in prescribed segment boundary zones. A simple null hypothesis is that rupture termini occur<br />
with equal probability anywhere on a fault.<br />
INTERACTIONS BETWEEN THE CLARK STRAND OF THE SAN JACINTO FAULT ZONE AND THE EXTRA-<br />
ELMORE FAULT ARRAYS (A-149)<br />
S. Janecke and S. Thornock<br />
The Clark fault is currently mapped as terminating north of the Extra fault in unfaulted middle Quaternary deposits. We<br />
mapped the San Sebastian Marsh area between the tip of the Clark fault and the Superstition Hills to assess the possible<br />
SEward continuation of the Clark fault that appears in InSAR-based inversions. One field season, extensive mapping on<br />
imagery, landscape analysis, and correlation of mapped fault traces with of published InSAR, gravity and magnetic data<br />
suggest that NE-striking left-lateral faults dominate in the shallow crust whereas the nascent Clark fault persists under or<br />
through the crossing left-lateral network at deeper levels. Mapping produced more evidence for active NE-striking left-lateral<br />
faults than of NW-striking dextral faults. NE-striking faults form a continuous, curving and dense array between the Coyote<br />
Creek fault zone and the Salton Sea and are in line with previously mapped faults beneath the Sea. Most ENE to NNE-striking<br />
faults are steep, preserve more horizontal slickenlines than dip-slip slickenlines due to left- and left-oblique slip. These<br />
numerous fault zones, which include the Extra, Elmore Ranch, and Kane Spring faults, produce uplifts along their traces, and<br />
cut Holocene sediment of Lake Cahuilla. The main strand of the Extra fault zone cuts Holocene lakebeds, generated colluvial<br />
wedges, but is lapped by ~900 yrs BP sand dunes and 1-2 deep lake cycles of Lake Cahuilla.<br />
Only one of the 4 larger strands of the Clark fault in the San Felipe Hills continues SE as small-offset dextral faults. This strand<br />
projects to similar small offset dextral faults in the Superstition Hills, with a possible gap near the marsh. There is also a<br />
suggestion of an en-echelon left-stepping dextral zone that steps to the east side of the Superstition Hills and the NW tip of the<br />
Imperial fault. Despite the limited expression of the Clark fault zone at the surface, we infer that it persists SEward to the<br />
Superstition Hills fault in the subsurface because it is axial to a major hourglass-shaped uplift of basin fill that stretches from<br />
the SE tip of the Santa Rosa Mountains to the New River. Major strands of the San Jacinto fault zone form the “spine” of this<br />
uplift except in its narrow waist around San Sebastian Marsh where a blind fault is likely. The uplift is so large and active that<br />
it traps all the sediment of the San Felipe and Carrizo Wash drainage basins on its upslope side. Further study will test these<br />
working hypotheses.<br />
INTERACTION OF FAULT STRENGTH HETEROGENEITIES AND STRESS REDISTRIBUTION IN<br />
MULTIPLE EARTHQUAKE CYCLES ON FAULTS WITH THERMAL PRESSURIZATION (A-097)<br />
J. Jiang and N. Lapusta<br />
Natural faults are characterized by geometric complexities, variations in hydraulic and frictional properties, and non-uniform<br />
prestress. In simulations of isolated dynamic rupture, these heterogeneities are used to produce complex earthquake scenarios,<br />
and often fault prestress and frictional strength are assigned independently. However, simulations of multiple earthquake<br />
2011 <strong>SCEC</strong> <strong>Annual</strong> <strong>Meeting</strong> | 181
Poster Abstracts<br />
cycles (e.g., Lapusta and Liu, 2009) show that fault prestress and strength are physically related through stress redistribution<br />
due to prior slip. Considering the interplay of stress redistribution and fault strength heterogeneity is important for<br />
understanding earthquake cycle patterns and characteristics of dynamic ruptures.<br />
Here we study long-term slip on faults with large-scale heterogeneous fault strength due to non-uniform normal stress and/or<br />
frictional properties, which could be related to geometric and/or material complexity. Using BICycle algorithm in 2D (Noda<br />
and Lapusta, 2011), we simulate the entire earthquake cycles, including fully dynamic seismic rupture and aseismic tectonic<br />
loading, on faults governed by Dieterich-Ruina rate-and-state friction with thermal pressurization. Initial shear stresses are<br />
pre-assigned and developed into physically-consistent distribution over multiple cycles.<br />
In our simulations, incorporation of thermal pressurization enables the fault to operate at lower average stress level.<br />
Increasing heat production, and hence larger co-seismic weakening at the places of higher normal confinement, tends to<br />
partially compensate for the effect of heterogeneous static strength. The sequences are characterized by occasional large faultspanning<br />
seismic events and many smaller events that rupture across only part of the fault. Shear stresses evolve and get<br />
redistributed on the entire fault during the major events, in accordance with the fault strength, to reduce the effect of the<br />
introduced heterogeneity in dynamic rupture in long-term fault behavior. Intermittent smaller events complexify the stress<br />
level.<br />
Our current work is directed towards quantifying the interaction of the extent of fault strength heterogeneities with<br />
earthquake sequences and dynamic ruptures. It would be used to: (1) draw implications for the state of stress on<br />
heterogeneous faults and how it would affect earthquake nucleation conditions; and (2) understand the effect of stress<br />
redistribution on rupture propagation, with consequences for ground shaking.<br />
BAYESIAN EARTHQUAKE SOURCE VALIDATION FOR GROUND MOTION SIMULATION (B-011)<br />
H.C. Jimenez, P.M. Mai, E. Prudencio, I. Babuska, M. Motamed, and R. Tempone<br />
Design parameters in building codes require reliable ground-motion predictions. They depend on realistic source models<br />
controlled by several parameters, such as fault dimensions, hypocenter location, stress field, rupture speed, rise time, etc. In<br />
this project we initially consider simple kinematic earthquake rupture models to simulate near-field ground-motions that<br />
produce the smallest misfit between Ground Motion Prediction Equations (GMPE) and predicted quantities of interest (QoI,<br />
e.g. peak ground velocity or spectral acceleration at different periods). Based on the experience with simple kinematic rupture<br />
models we will move toward more realistic, pseudo-dynamic rupture models. The key question we would like to address<br />
using a Bayesian approach is: “How much source complexity is needed to adequately reproduce GMPE’s”.<br />
In the first stage, we consider 1D velocity structures and simplistic kinematic models in which we sequentially perturb a single<br />
source parameter (slip heterogeneity, rise time, rupture speed, hypocenter location) in the framework of a “calibration &<br />
validation experiment” using a Bayesian updating approach. Including also data uncertainties of the QoI’s, both in GMPE’s<br />
and in recent observations, we seek to (a) map the sensitivities of the QoI’s to rupture-model parameterization, and (b)<br />
quantify the required rupture-model complexity for kinematic source models that best reproduces the QoI’s given by GMPE’s.<br />
In later stages of this project, we will also include 3D velocity structures and more realistic (pseudo-)dynamic rupture models.<br />
Using a Bayesian modeling approach we aim at being able to rigorously define the level of complexity needed in groundmotion<br />
source modeling for satisfying observational constraints and engineering requirements for seismic safety.<br />
SALTON SEISMIC IMAGING PROJECT (B-065)<br />
E. Jimenez, J.D. Rodriguez, and J. Stock<br />
The Salton Seismic Imaging Project is an active-source seismic study of the southeastern region of the San Andreas Fault<br />
crossing the Salton Trough. The study used explosives to radiate seismic waves, which were detected by portable<br />
seismometers (vertical-component ?Texans? and 3-component RT-130s) near the explosions as well as by permanent seismic<br />
stations in the region of Southern California. The survey was divided into lines, with Line 1 crossing from South to North<br />
along the axis of the Salton Trough, lines 8 and 9 parallel to line 1 on the edges of the Salton Sea and the other lines<br />
perpendicular across much of the first line. Ocean-bottom seismometers also recorded the explosions but those data are not<br />
used in this study because we are concentrating on the structure in the region south of the Salton Sea. We analyzed the first<br />
arrivals on the two sets of seismometers and compared them to identify with more precision the structure of the region. The<br />
network arrivals yielded late origin times for shots within the southern Imperial Valley indicating the need for a more detailed<br />
182 | Southern California Earthquake Center
Poster Abstracts<br />
velocity model in this region. We made detailed picks of first arrivals from the vertical-component portable stations in the<br />
southern Imperial Valley and used these to determine more detailed 2-D velocity models here.<br />
These structure velocity models will help in predicting characteristics of seismic wave transmission based on our new, more<br />
detailed knowledge of the thickness of the layers and the behavior of seismic waves as they pass through them.These studies<br />
may help us understand more clearly the effects expected from small and large earthquakes in the Southern California region.<br />
LOW-STRENGTH FRICTIONAL CREEP ON THE LOWER-CRUSTAL EXTENSION OF THE SAN ANDREAS<br />
FAULT NEAR PARKFIELD, CA (B-144)<br />
K.M. Johnson, D. Shelly, and A.M. Bradley<br />
Understanding how seismogenic faults in the upper brittle layer of the crust are coupled to time-dependent inelastic<br />
deformation in the viscous lower crust and upper mantle is important for achieving a better understanding of earthquake<br />
nucleation processes. Field and laboratory studies indicate that deformation in the lower crust tends to localize into narrow<br />
shear zones. A number of studies of postseismic deformation following large earthquakes infer rapid rate of deformation<br />
across shear zones extending into the lower crust below the earthquake rupture and lasting for years to decades. However,<br />
less is known about how seismogenic faults are loaded from below by deformation in the lower crust during the interseismic<br />
period, after the rapid period of postseismic deformation. Until recently, evidence for interseismic activity on the lower crustal<br />
extension of large active strike slip faults like the San Andreas Fault has remained elusive. Recent observations of tremor in<br />
the lower crust near Parkfield, CA (e.g., Nadeau and Dolenc, 2005; Shelly, 2010) provide the first hint of active faulting in the<br />
lower crust below nominally seismogenic depths. Shelly (2010) cites these observations as evidence that the San Andreas fault<br />
exists as a localized structure extending at least to the bottom of the crust. Shelly and Johnson (2011) suggest that tremor<br />
transients triggered by static stress changes on the fault induced by the nearby 2003 M6.7 San Simeon Earthquake and the 2004<br />
M6.0 Parkfield earthquake indicate transient fault creep. However, these inferences of deep fault creep remain circumstantial<br />
because any slip associated with the tremor activity would be too small to detect with instruments at the ground surface.<br />
Because the deep fault slip cannot be observed directly, umerical modeling is required to link tremor to fault slip. In this study<br />
we show that these transient tremor episodes are indeed consistent with model predictions of triggered fault creep on the<br />
lower crustal extension of the San Andreas fault. We show that the deep SAF is presently sliding at conditions consistent with<br />
model results from tremor and slip studies of subduction zones [Liu and Rice (2009)]: low effective normal stress and frictional<br />
properties consistent with laboratory measurements on Gabbro.<br />
TOHOKU EARTHQUAKE: A SURPRISE? (B-106)<br />
Y.Y. Kagan and D.D. Jackson<br />
We consider three issues related to the 2011 Tohoku earthquake:<br />
(1) Why was the magnitude limit for the Tohoku region so badly underestimated, and how can we estimate realistic limits for<br />
subduction zones in general?<br />
(2) How frequently can such large events occur off Tohoku?<br />
(3) Could short-term forecasts have offered effective guidance for emergency preparation?<br />
Two methods can be applied to estimate the maximum earthquake size in any region: statistical analysis of available<br />
earthquake records, and the moment conservation principle -- how earthquakes release tectonic deformation. We have<br />
developed both methods since 1991. For subduction zones, the seismic record is usually insufficient (in fact it failed badly for<br />
Tohoku), because the largest earthquakes are so rare. However, the moment conservation principle yields consistent estimates<br />
for all subduction zones. Various measurements imply maximum moment magnitudes of the order 9.0--9.7. A comparison of<br />
the inter-earthquake secular strain accumulation and its release by the coseismic slip implies a similar maximum earthquake<br />
size estimate.<br />
Beginning in 1999 we used our statistical short- and long-term earthquake forecasts, based on the GCMT catalog, for the<br />
western Pacific, including Japan. We have posted them on the web and included expected focal mechanisms as well. Longterm<br />
forecasts indicate that the average frequency for magnitude 9 earthquakes in the Tohoku area is about 1/400 years. We<br />
have archived several forecasts made before and after the Tohoku earthquake. As expected, the Tohoku mega-earthquake<br />
changed the forecasted long-term rate by just a few percent. However, the magnitude 7.5 foreshock increased the short term<br />
2011 <strong>SCEC</strong> <strong>Annual</strong> <strong>Meeting</strong> | 183
Poster Abstracts<br />
rate to about 100 times the long-term rate, and the magnitude 9 event increased it briefly to more than 1000 times the longterm<br />
rate. These results could well justify the development of an operational earthquake forecasting plan.<br />
FULL EARTH HIGH-RESOLUTION EARTHQUAKE FORECASTS (B-124)<br />
Y.Y. Kagan and D.D. Jackson<br />
Since 1977 we have developed statistical short- and long-term earthquake forecasts to predict earthquake rate per unit area,<br />
time, and magnitude. The forecasts are based on smoothed maps of past seismicity and assume spatial and temporal<br />
clustering. Our new program forecasts earthquakes on a 0.1 degree grid for a global region 90N--90S latitude. We use the PDE<br />
catalog that reports many smaller quakes (M>=5.0). For the long-term forecast we test two types of smoothing kernels based<br />
on the power-law and on the spherical Fisher distribution. We employ adaptive kernel smoothing which improves our<br />
forecast both in seismically quiet and active areas. Our forecasts can be tested within a relatively short time period since<br />
smaller events occur with greater frequency. The forecast efficiency can be measured by likelihood scores expressed as the<br />
average probability gains per earthquake compared to spatially or temporally uniform Poisson distribution. The other method<br />
uses the error diagram to display the forecasted point density and the point events.<br />
A GUIDE TO SELECTING EMPIRICAL GREEN’S FUNCTIONS IN REGIONS OF FAULT COMPLEXITY: A<br />
STUDY OF DATA FROM THE SAN JACINTO FAULT ZONE, SOUTHERN CALIFORNIA (B-067)<br />
D.L. Kane, D.L. Kilb, and F.L. Vernon<br />
We examine the appropriateness of applying the empirical Green’s function (EGF) method to constrain the source properties<br />
of target M > 3 mainshock events in regions of complex faulting. A key aspect of our analyses is testing a broad range of trial<br />
EGFs to identify the transition separating appropriate EGF events from other local events that do not satisfy the assumptions<br />
of the EGF method. We use data (>183,000 seismograms from ~56,000 earthquakes) recorded by the ANZA seismic network<br />
(12 seismic stations), which spans the San Jacinto Fault Zone (SJFZ) in southern California. The SJFZ provides a good testing<br />
ground because of its heterogeneous fault structure, high seismicity rate, and diverse distribution of earthquake sources and<br />
locations. We define a M > 3 mainshock catalog of 52 events, and for each mainshock we identify a suite of potential EGF<br />
events that locate within 10 km. For all possible mainshock/EGF pairs, we estimate the preferred corner frequency of the<br />
source spectrum signal that results after spectral division of the EGF spectrum from the mainshock spectrum. We assume that<br />
an ideal EGF choice will result in similar corner frequency estimates at all stations in the array. To quantify this similarity, we<br />
measure the standard deviation of the corner frequency estimates across all stations for each mainshock/EGF pair. Our results<br />
show the preferred EGF events are at least one magnitude unit smaller than the mainshock magnitude. Importantly, we find a<br />
limiting maximum hypocentral separation between the mainshock and EGF of ~2 km (based on a relocated catalog), above<br />
which the results are indistinguishable from pairs with greater separation (e.g., 2-10 km). The EGF event selection can also be<br />
significantly improved by testing for matching first motion polarities and high correlation between the mainshock and EGF<br />
waveforms at each station. Waveform correlation degrades considerably at separation distances greater than 1 km. To select<br />
the most appropriate EGF events, we suggest using only EGF events located within 1 km of the mainshock. However, EGF<br />
events at distances up to 2 km can be considered if one verifies that the mainshock/EGF pair have similar waveforms and<br />
polarities. When sufficient data exists, we suggest applying these pairwise constraints to obtain optimal source parameter<br />
estimates using the EGF method.<br />
INVESTIGATION OF INTERSEISMIC DEFORMATION ALONG THE CENTRAL SECTION OF THE NORTH<br />
ANATOLIAN FAULT (TURKEY) USING INSAR OBSERVATIONS AND EARTHQUAKE-CYCLE<br />
SIMULATIONS (A-051)<br />
Y. Kaneko, Y. Fialko, X. Tong, D.T. Sandwell, and M. Furuya<br />
We present high-resolution measurements of interseismic deformation along the central section of the North Anatolian fault<br />
(NAF) in Turkey using L-band Interferometric Synthetic Aperture Radar (InSAR) data collected by the Advanced Land<br />
Observing Satellite (ALOS) of the Japan Aerospace Exploration Agency. We generated satellite line-of-sight (LOS) velocities<br />
for the three ascending ALOS tracks (603-605) covering the NAF between 31.2-33.2 deg. East. LOS velocity maps for each track<br />
were obtained by averaging 15 to 30 radar interferograms spanning a time period of 4 years between 2007 and 2010. The<br />
average LOS velocities reveal discontinuities of up to ~6 mm/year across the geologically mapped fault trace. Assuming that<br />
these discontinuities are due to horizontal surface motion, they imply fault creep at a rate of ~10 mm/year, accounting for<br />
nearly half of the relative plate motion accommodated by this segment of the NAF. The inferred lateral extent of significant<br />
shallow creep is in excess of 60 km. These inferences are broadly consistent with previously reported trilateration surveys and<br />
184 | Southern California Earthquake Center
Poster Abstracts<br />
InSAR results based on C-band ERS data (Cakir et al., 2005) that suggested that the NAF segment near Ismetpasa may be only<br />
partially locked. If so, the deeper locked portion of the fault must be characterized by a higher stressing rate, and presumably<br />
shorter recurrence interval. We are modeling available InSAR and GPS data using numerical simulations of spontaneous<br />
earthquake sequences that incorporate laboratory-derived rate-and-state friction laws. The goal of these simulations is to<br />
constrain key parameters of fault friction such as the depth extent of the velocity-strengthening and velocity-weakening layers,<br />
the long-term fault slip rate, and stress evolution in the seismogenic crust.<br />
VARIABILITY OF SEISMIC SOURCE SPECTRA DERIVED FROM COHESIVE-ZONE MODELS OF A<br />
CIRCULAR RUPTURE PROPAGATING AT A CONSTANT SPEED (A-085)<br />
Y. Kaneko and P.M. Shearer<br />
Static stress drop of earthquakes is often estimated from far-field body-wave spectra using measurements of corner<br />
frequencies, together with seismic moment, which can be computed from the low-frequency part of the spectrum. Corner<br />
frequencies are used to infer the source dimension based on a specific theoretical model. The most widely used model is from<br />
Madariaga (1976), which considered a bilateral rupture expanding at a constant speed on a circular fault. This model assumes<br />
that the rupture front is characterized by an abrupt change of fault strength from a uniform initial prestress to a kinetic<br />
frictional stress, and hence the stress is singular at the rupture front. In this study, we investigate variability of source spectra<br />
derived from dynamic models of expanding bilateral ruptures on a circular fault with a cohesive zone that prevents a stress<br />
singularity at the rupture front. We study the dependence of far-field body-wave spectra on the rate of frictional weakening<br />
(which controls the cohesive zone size), rupture speed, and dynamic stress drop. For each source model, we compute far-field<br />
body-wave displacement synthetics for a homogeneous elastic space using the representation theorem (Aki and Richards,<br />
2002). Our results show that P- and S-wave corner frequencies of displacement spectra are systematically larger than those<br />
predicted by Madariaga (1976) and generally depend on the rate of frictional weakening in the source model, which affects the<br />
fracture-energy-density distribution on the fault. For a given rupture speed, the average of corner frequencies over the focal<br />
sphere is larger for source models with larger fracture energy. For ruptures propagating at 90 percent of the S-wave speed,<br />
the azimuthal average of P-wave corner frequencies in the case with the smallest fracture energy is about 20 percent larger<br />
than that of Madariaga (1976), which corresponds to about a factor of two difference in the inferred stress drop. Thus for these<br />
ruptures, application of the Madariaga model overestimates stress drops by factors of two or more, depending upon the<br />
fracture energy. We also find that the takeoff angle dependence of the corner frequencies for supershear ruptures is<br />
systematically different from that for subshear ruptures due to the difference in radiated wave fields for supershear and<br />
subshear ruptures.<br />
THREE DIMENSIONAL ELASTIC RESPONSE OF COMPLIANT FAULT ZONES TO NEARBY<br />
EARTHQUAKES: A THEORETIC STUDY (A-110)<br />
J. Kang and B. Duan<br />
Compliant fault zones have been detected along active faults by seismic<br />
investigations (trapped waves and travel time analysis) and InSAR observations. However, the width and depth extent of<br />
compliant fault zones are still under debate in the community. Numerical models of dynamic rupture build a bridge between<br />
theories and the geological and geophysical observations. Theoretical 2D plane-strain studies of elastic and inelastic response<br />
of compliant fault zones to nearby earthquake have been conducted by Duan [2010] and Duan et al [2010]. In this study, we<br />
further extend the experiments to 3D with a focus on elastic response. We are specifically interested in how residual<br />
displacements depend on the structure and properties of complaint fault zones, in particular on the width and depth extent.<br />
We conduct numerical experiments on various types of fault-zone models, including fault zones with a constant width along<br />
depth, with decreasing widths along depth, and with Hanning taper profiles of velocity reduction. . Our preliminary results<br />
suggest 1) the width of anomalous horizontal residual displacement is only indicative of the width of a fault zone near the<br />
surface, and 2) the vertical residual displacement contains information of the depth extent of compliant fault zones.<br />
A UNIFIED FINITE ELEMENT METHOD FOR HETEROGENEOUS ELASTIC MEDIA WITH LOW TO HIGH<br />
RATIO OF P- TO S-WAVE VELOCITIES (A-040)<br />
H. Karaoglu and J. Bielak<br />
This study reports on a mixed finite element formulation that overcomes certain limitations faced by low-order primal-based<br />
formulations. A primal-based formulation with displacement as the variable is a widely used method to solve wave-<br />
2011 <strong>SCEC</strong> <strong>Annual</strong> <strong>Meeting</strong> | 185
Poster Abstracts<br />
propagation problems. It has been observed, however, that its accuracy deteriorates badly with increasing contrast between<br />
the P- and S-wave velocities.<br />
By using a dual-based formulation, we develop a method that is robust within the entire range of an elastic solid medium with<br />
moderate to high contrast of the P- and S-wave velocities. By solving a constrained variational problem with the Lagrange-<br />
Multiplier Method, we developed the dual-based (mixed) formulation with pressure and displacement as the variables.This is<br />
similar to earlier mixed displacement-pressure formulations, except that we introduce the methodology as a global one<br />
applicable to different domains rather than being limited to certain extreme cases. The variational problem makes a wider<br />
range of interpolation functions permissible for pressure including discontinuous functions across element boundaries.<br />
We illustrate the validity of the method by solving a range of idealized problems with moderate to high contrast of P- to S-<br />
wave velocity, and compare the performance of different types of elements. We verify the method and illustrate the general<br />
principles with an application in Southern California of the 1994 Northridge earthquake.<br />
FAULT ARCHITECTURE OF THE SALTON SEA THROUGH MULTI-SCALE SEISMIC REFLECTION<br />
SURVEYS (B-133)<br />
A.M. Kell, N. Driscoll, G.M. Kent, A. Harding, and R. Baskin<br />
Two sets of seismic reflection images collected in the Salton Sea, California in May 2010 and April 2011 highlight a<br />
longstanding episode of extension-related deformation within the Salton Sea pull-apart system. These data are part of a<br />
continued multi-scale network of seismic studies of the faults within the Salton Trough. In 2010, we collected ~350 line-km of<br />
data using a 75-m-long, 24-channel streamer and a 1.6kJ “sparker” source fired at 1.2 sec intervals. These images document a<br />
series of south-east dipping normal faults that are related to the current pull-apart geometry; this configuration appears to<br />
persist for only the past 20-40 ka. Newly acquired low fold images (~150 line-km) collected using a 300-m-long, 48-channel<br />
streamer and a Generator Injector (GI) airgun source firing at 1 min intervals show that the same structures seen in the higher<br />
resolution (2010) data as well as high-resolution seismic CHIRP images collected in 2007 (Brothers et al., 2009, 2010) continue<br />
to depths of >2.5 km. From this deeper imagery, we infer that the structures seen in the very shallow CHIRP data are throughgoing<br />
to seismogenic depths and play a dominant role in strain partitioning from the Imperial Fault to the San Andreas Fault<br />
through the Brawley Seismic Zone. The 2011 reflection and refraction data are part of a larger collaborative project involving<br />
Cal Tech, Virginia Tech, the USGS, University of Nevada, Reno and Scripps Institution of Oceanography. Within this study we<br />
seek to understand the mechanisms of how crustal thinning and rifting develops. The fault dip imaged at both scales is ~50-<br />
60° and show vertical offsets (sub-meter to tens of meters) distinguishable to the limits of our imaging resolution. These multiscale<br />
data offer a unique opportunity to calculate the timing and mode of motion in the most actively deforming portion of the<br />
Salton Trough. The insights gained through these data allow a greater understanding of the tectonics and seismic hazards<br />
inherent in Southern California.<br />
NEW CHRONOLOGY AND ESTIMATED RATES OF VERTICAL UPLIFT FOR THE GAVIOTA COAST<br />
RAISES ISSUES RELATED TO THE EARTHQUAKE HAZARD (A-127)<br />
E.A. Keller, D.E. DeVecchio, L.D. Gurrola, and L.A. Owen<br />
Marine terraces are useful for quantifying surface uplift and thus earthquake hazard. Surprisingly, numerical dates are few<br />
along the Gaviota Coast, which extends westward for 50 km from Ellwood (west of Santa Barbara) to Point Conception.<br />
Previously estimated rates of vertical uplift of marine terraces along the Gaviota Coast and elsewhere in Southern California<br />
tend to be relatively low at 0.1 to 0.3 m/ka. An exception is within the Santa Barbara and Ventura fold belts, where uplift rates<br />
are 1 to 2 m/ka and 8 m/ka, respectively. Our research in the Santa Barbara fold belt (SBFB) indicates the rate of uplift<br />
increases toward the west from More Mesa toward Isla Vista and Ellwood, where the first emergent terrace, correlated to<br />
Marine Isotope Stage 3a (MIS3a), is at an elevation of 10 m above mean sea level; for this marine terrace to be present requires<br />
a rate of uplift exceeding 2 m/ka. Existing chronology in southern California consists largely of amino acid racemization<br />
(AAR) ages from 3 decades ago. We have dated and estimated terrace age at More Mesa, Isla Vista, and Ellwood using<br />
multiple techniques (OSL, U-series, 14C, and oxygen isotope ratios on small mollusks). The MIS3a terrace appears continuous<br />
along much of the Gaviota coastline, where the first emergent terrace has been previously interpreted to be MIS5a. If our<br />
chronology is correct, this calls in question the previous chronology and rates of uplift from Ellwood west across the south<br />
branch of the Santa Ynez fault. Low marine terraces at UCSB Point (and other locations) are ~ 2+ m above mean sea level. Two<br />
hypotheses have been presented to explain these low marine terraces. The terraces either represent a mid-Holocene maximum<br />
sea level highstand or in an active tectonic setting like the SBFB the terrace may represent coseismic uplift, which we prefer.<br />
186 | Southern California Earthquake Center
Poster Abstracts<br />
We have observed higher marine terraces at La Mesa and Ellwood that do not correlate to sea level highstands, which we<br />
interpret to be earthquake terraces. In order to have uplift of 2 m, the earthquake would have to have had a magnitude of 7.0+,<br />
which is worrisome because several hundred thousand people live there today and urbanization is increasing. Additional<br />
dating of Holocene and late Pleistocene terraces along the Gaviota Coast will improve assessment of the earthquake hazard of<br />
the region.<br />
SCIENTIFIC VISUALIZATION IN 4D FOR EARTHQUAKE RESEARCH (A-029)<br />
L.H. Kellogg, T. Bernardin, M.I. Billen, E.S. Cowgill, A.J. Elliott, P.O. Gold, C.L. Harwood, O. Kreylos, M.E. Oskin, B.<br />
Pellett, D.L. Turcotte, and M.B. Yikilmaz<br />
Three major earthquakes over the past two years have provided the opportunity to study the rupture process in<br />
unprecedented detail: the 2010 Haiti, 2010 El Mayor-Cucupah, and 2011 Tōhoku earthquake. Here we both demonstrate the<br />
use of virtual-reality based data visualization and analysis in rapid scientific response and investigations of earthquake<br />
processes and illustrate their potential use following future events. After the Haiti and El Mayor-Cucupah earthquakes, rapid<br />
data collection efforts were deployed, and high resolution LIDAR made it possible to map the fault zones and detect changes.<br />
To manage, assess, and interpret the large 3D and 4D datasets collected during and after these earthquakes, we used<br />
interactive scientific visualization tools developed in the W. M. Keck Center for Active Visualization in Earth Sciences<br />
(KeckCAVES). Software based on the Virtual Reality User Interface (VRUI) makes it possible to view, interact with, and select<br />
data, and rapidly carry out geologic mapping tasks in a immersive VR environments ranging from a desktop computer to a<br />
CAVE. The EarthViewer software allowed us to visualize foreshock and aftershock sequences from the Tōhoku earthquake<br />
which reveal the structure of the rupture surface. LIDARViewer made it possible to rapidly process and interpret airborne and<br />
tripod LIDAR data collected after the Haiti and El Mayor-Cucupah, while Crusta permitted virtual geologic mapping on the<br />
resulting high-resolution topographic models.<br />
DEPOSITIONAL CONSTRAINTS ON SLIP ALONG THE SAN ANDREAS FAULT WITHIN THE EASTERN SAN<br />
GORGONIO PASS REGION, SOUTHERN CALIFORNIA (A-135)<br />
K.J. Kendrick, J.C. Matti, S.A. Mahan, G.P. Landis, and D.P. Miggins<br />
A nested alluvial complex within the Mission Creek (MC) drainage records fault-activity histories of the Mission Creek and<br />
Mill Creek strands of the San Andreas Fault (SAF) in the San G<strong>org</strong>onio Pass (SGP) region. We have investigated six surface<br />
remnants using geologic mapping, morphometric and stratigraphic analysis, geochronology of fills (IRSL) and surfaces (CRN),<br />
and pedogenic analysis. The surfaces cap distinct alluvial fills having clasts that we associate with sources in the Mission<br />
Creek drainage in the nearby San Bernardino Mtns. We have distinguished and correlated the disconnected surface remnants,<br />
based on morphometric analysis, including their longitudinal profiles, surface texture and drainage density. The degree of<br />
soil-profile development, when compared to other regional pedons that have been independently dated, constrains the timing<br />
of tectonic evolution. Pedogenic properties useful for age appraisals include tiron-extractable pedogenic silica, soildevelopment<br />
indices, increase in clay volume, and iron-oxide composition and content. Correlation to regional soil<br />
chronosequences indicates that the oldest MC surfaces are significantly older than 500 ka, although this age range (>500 ka) is<br />
particularly difficult to constrain with available geochronologic methods. IRSL dates of 106 and 95 Ka from (respectively) 5<br />
and 4 m beneath the youngest pedon are consistent with age estimates based on soil-profile development. The oldest surfaces<br />
in the alluvial complex occur on deposits formed prior to movement along the Mill Creek strand of the SAF, and have been<br />
displaced approximately 8 km from their source across both the Mill Creek and Mission Creek fault strands in SGP. This is the<br />
same as a total slip estimate for the Mill Creek strand elsewhere in SGP, and indicates that there has been no movement on the<br />
Mission Creek strand since the emplacement of this deposit. The youngest deposits within this complex accumulated<br />
following cessation of movement along both the Mission Creek and Mill Creek strands, and mark the time after which slip had<br />
transferred onto the Banning and Garnet Hill strands. Summing total lateral slip accumulated on the fault strands in the<br />
eastern San G<strong>org</strong>onio Pass region, including the Mission Creek (0 km), Mill Creek (8 km), Banning and Garnet Hill (2-3 km),<br />
during the past approximately 500 ka results in a maximum long-term slip rate of 20 – 22 mm/yr. This agrees well some<br />
models of tectonic evolution, but not others.<br />
QUAKE CATCHER NETWORK (QCN) SEISMIC SENSOR DEPLOYMENT GAME (A-009)<br />
D.L. Kilb, A. Yang, and D. Rohrlick<br />
The Kinect technology allows for hands-free game play, greatly increasing the accessibility of gaming for those uncomfortable<br />
using controllers. How it works is the Kinect camera transmits invisible near-infrared light and measures its “time of flight” to<br />
2011 <strong>SCEC</strong> <strong>Annual</strong> <strong>Meeting</strong> | 187
Poster Abstracts<br />
reflect off an object, allowing it to distinguish objects within 1 centimeter in depth and 3 mm in height and width. The<br />
middleware can also respond to body gestures and voice commands. Here, we use the Kinect Windows SDK software to<br />
create a game that mimics how scientists deploy seismic instruments following a large earthquake. The educational goal of the<br />
game is to allow the players to explore 3D space as they learn about the Quake Catcher Network’s (QCN) Rapid Aftershock<br />
Mobilization Program (RAMP). Many of the scenarios within the game are taken from factual RAMP experiences. To date,<br />
only the PC platform (or a Mac running PC emulator software) is available for use, but we hope to move to other platforms<br />
(e.g., Xbox 360, iPad, iPhone) as they become available. The game is written in programming language C# using Microsoft<br />
XNA and Visual Studio 2010, graphic shading is added using High Level Shader Language (HLSL), and rendering is<br />
produced using XNA's graphics libraries. Key elements of the game include selecting sensor locations, adequately installing<br />
the sensor, and monitoring the incoming data. During game play aftershocks can occur unexpectedly, as can other problems<br />
that require attention (e.g., power outages, equipment failure, and theft). The player accrues points for quickly deploying the<br />
first sensor (recording as many initial aftershocks as possible), correctly installing the sensors (orientation with respect to north,<br />
properly securing, and testing), distributing the sensors adequately in the region, and troubleshooting problems. One can also<br />
net points for efficient use of game play time. Setting up for game play in your local environment requires: (1) the Kinect<br />
hardware (~$145); (2) a computer with a Windows operating system (Mac users can use a Windows emulator); and (3) our<br />
free QCN game software (available from http://quakeinfo.ucsd.edu/~dkilb/WEB/QCN/Downloads.html).<br />
FAULT SLICKENLINES, ROUGHNESS AND INELASTIC DEFORMATION (A-087)<br />
J.D. Kirkpatrick and E.E. Brodsky<br />
Repeated measurements show that fault roughness is self affine with anisotropic scaling exponents within typical exposure<br />
length scales. Displacement across a geometrically matched, bumpy fault requires some deformation of the wall rocks for the<br />
opposing sides of the fault to remain in contact. Strain in the wall rock induces stresses that, when resolved onto the fault<br />
surface, cause the maximum shear stress direction to deflect from the direction imposed by the tectonic load. In the slipparallel<br />
direction, a Hurst exponent of 0.6 predicts that the strains required to flatten small amplitude, short bumps are greater<br />
than those for larger amplitude, long bumps. Short length scales should therefore induce the greatest stresses in the wall rock<br />
and deflect shear stresses the most. We measure the orientation of slickenlines that form parallel to the maximum shear stress<br />
direction on fault surfaces using ground-based LiDAR. Slickenlines defined in the field are compared to the curvature of the<br />
fault surface. Consistent principal curvature directions closely match the field measurements, and provide a basis for<br />
measuring slickenline orientations across large areas of fault surfaces. Deflection of the slickenlines from the mean orientation<br />
is limited to a few degrees in all faults analyzed. In addition, there is no correlation between the amount of deflection and the<br />
local fault topography. We explore the spatial structure of fault surface roughness and show that the strain from flattening<br />
bumps at short length scales exceeds the typical yield strain of rock. This implies that the material fails inelastically in small<br />
bumps. The lack of slickenline deflection suggests short length scales consequently support little stress. Because the roughness<br />
is self-affine there must be a cross-over length scale at which the strain remains below the yield value. Peak strains estimated<br />
from the amplitude (~0.1-0.3m) of the biggest bumps in exposed fault surfaces (lengths ~10-20m in the slip direction) is of the<br />
order of 0.01. Elastic stresses therefore become important at length scales of a few tens of meters and the roughness at shorter<br />
scales is the product of inelastic deformation. Models of earthquake rupture that incorporate laboratory-scale constitutive laws<br />
should also include the inelastic yielding of the wallrock that occurs at length scales up to tens of meters.<br />
TETEMOKO: AN ADAPTIVE MESH REFINEMENT FRAMEWORK FOR DYNAMIC RUPTURE SIMULATION<br />
(A-080)<br />
J.E. Kozdon and E.M. Dunham<br />
Tetemoko is an adaptive mesh refinement (AMR) code in development for dynamic rupture simulations. The main promise of<br />
AMR is that grid resolution is dynamically allocated in response to the local resolution needs of the solution. For dynamic<br />
rupture simulations these resolution needs are largely dictated by the nearly-singular nature of the solution around the<br />
propagating rupture front. When laboratory measured friction parameters are used, sub-meter grid spacing is required to<br />
resolve the solution. This has forced the modelling community to artificially enhance the frictional parameters used in largescale<br />
earthquake simulations. It is largely unknown what is lost by this procedure, and one of the goals of this project is to<br />
address this.<br />
In past meetings we have outlined the AMR framework for dynamic rupture simulations and have validated our code against<br />
the <strong>SCEC</strong> TPV205 problem (slip-weakening friction and a homogeneous half-space). Here we present an extension of the code<br />
to include rate-and-state friction and plasticity. This combination will enable us to determine if the occurrence of plasticity<br />
188 | Southern California Earthquake Center
Poster Abstracts<br />
near the rupture front prevents development of the extreme gradients in stress and velocity, thereby lessening the resolution<br />
needs. The AMR simulation with Tetemoko results are validated by comparison with a high-order finite difference method.<br />
AFTERSHOCK RELOCATION IN THE YUHA DESERT FOLLOWING THE 4 APRIL 2010 M7.2 EL MAYOR-<br />
CUCAPAH EARTHQUAKE (B-046)<br />
K.A. Kroll, E.S. Cochran, and K.B. Richards-Dinger<br />
Following the 4 April 2010 El Mayor-Cucapah earthquake, 8 temporary seismometers were installed in the Yuha Desert region<br />
north of the Mexican border. During the deployment period, between 6 April and 14 June 2010, over 4,000 aftershocks, within<br />
a 20km by 14km study area in the Yuha Desert, are reported in the SCEDC catalog. We relocate the aftershocks and also<br />
determine shallow crustal anisotropy to illuminate the complex fault structure in this region.<br />
We compute the double difference hypocenter relocations using hypoDD with both manually picked P and S phase arrivals<br />
and waveform cross-correlations. We test three velocity models based on the Imperial Valley profile from the <strong>SCEC</strong><br />
Community Velocity Model, Version 4 (CVM-S4), including the original profile and the profile with a 10% and 20% velocity<br />
reduction in Vp/Vs. We use a jackknife test in which the relocations are recomputed with one of the 13 stations removed in<br />
each test to estimate horizontal and vertical relative errors. By comparison with the LSQR errors of hypoDD, we find that<br />
scaling the LSQR errors by the jackknife/ LSQR error ratio provides a better error estimate. We find that the Imperial Valley<br />
profile with a 10% velocity reduction results in the lowest location errors. The absolute and relative relocation errors were<br />
reduced by at least an order of magnitude when compared to the original SCEDC catalog locations. We then use statistical<br />
uncertainties in the data to identify simple structures in the cloud of earthquake relocations. This modified collapsing method<br />
employs principal component analysis to identify three types of structures that a set of closely located events is most likely<br />
associated with: point, line or plane. With this method, collapsed locations provide insight to the poorly understood geologic<br />
structures in the Yuha Desert.<br />
<strong>SCEC</strong> BROADBAND PLATFORM STRONG GROUND MOTION SIMULATIONS (B-020)<br />
S. Kumar, S. Callaghan, P.J. Maechling, K.B. Olsen, R. Archuleta, P. Somerville, R. Graves, T.H. Jordan, and the<br />
Broadband Platform Working Group<br />
The Southern California Earthquake Center (<strong>SCEC</strong>) Broadband Platform is a collaborative software development project<br />
involving <strong>SCEC</strong> researchers, graduate students, and the <strong>SCEC</strong> Community Modeling Environment. The goal of the <strong>SCEC</strong><br />
Broadband Simulation Platform is to generate broadband (0-10 Hz) ground motions for earthquakes using deterministic lowfrequency<br />
and stochastic high-frequency simulations. <strong>SCEC</strong> developers have integrated complex scientific modules for<br />
rupture generation, low-frequency deterministic seismogram synthesis, high-frequency stochastic seismogram synthesis, and<br />
non-linear site effects calculation into a system that supports easy on-demand computation of broadband seismograms. The<br />
<strong>SCEC</strong> Broadband platform has two primary modes of operation, validation mode, and scenario mode. In validation mode, the<br />
earthquake modeling software calculates broadband seismograms for one of three earthquakes, Northridge, Loma Prieta, or<br />
Landers at sites with observed strong motion data. Then, the platform calculates goodness of fit measurements that quantify<br />
how well the model-based broadband seismograms match the observed seismograms for each event. In scenario mode, the<br />
user can specify a scenario earthquake and a list of sites and calculate ground motions at each site for the scenario event. In<br />
February 2011, <strong>SCEC</strong> released Broadband Platform 11.2 as an open-source scientific software distribution. Since that time, we<br />
have continued development of the platform by adding a new site response module and new goodness of fit measures by<br />
Mayhew and Olsen. Along with a source code distribution of the Broadband Platform, we now offer a virtual software image<br />
distribution of the platform to support its use on a variety of computing hardware and operating systems.<br />
GROUND MOTION PREDICTION EQUATIONS FOR DATA RECORDED IN THE IMMEDIATE VICINITY OF<br />
THE SAN JACINTO FAULT ZONE (B-019)<br />
I. Kurzon, F.L. Vernon, and Y. Ben-Zion<br />
We present a new set of empirical Ground Motion results for horizontal Peak Ground Acceleration (PGA) and Peak Ground<br />
Velocity (PGV) that include data from the immediate vicinity of the San Jacinto fault zone. The results to date are based on<br />
earthquakes in the magnitude range of 1 < M < 5.5 recorded by up to 60 stations at distances ranging from the fault zone itself<br />
up to 120km. The data are examined and compared against several models of Ground Motion Prediction Equations (GMPE).<br />
The New Generation Attenuation (NGA) project was focused on a magnitude range of M > 5 (e.g., Campbell & Boz<strong>org</strong>nia 2006,<br />
Boore & Atkinson 2006); therefore, our main comparison is with the ShakeMap system results (Quitoriano 2003 for M < 5.3)<br />
and with Cua & Heaton (2008) GMPE accounting for a magnitude range of 2 < M < 8.<br />
2011 <strong>SCEC</strong> <strong>Annual</strong> <strong>Meeting</strong> | 189
Poster Abstracts<br />
The data employed so far involves several aftershock sequences on small and known fault segments. These constrains allow<br />
for better consideration of the path and site effects, including the path in the near vicinity of the source. Therefore, as opposed<br />
to most models (using either the epicentral distance for low magnitude events or the closest surface projection of the fault for<br />
stronger events) we consider the hypocentral source-receiver distance as controlling both the geometrical spreading and the<br />
inelastic path effects. This approach is not only more physical for M < 5 events, but also reveals the upper crustal<br />
heterogeneity (< 20km) in the San Jacinto Fault Zone area. The continuing work will focus on incorporating more data as it<br />
becomes available, and using the results to develop updated Ground Motion Prediction Equations. The results will be useful<br />
for earthquake engineering and for exploring the crustal heterogeneity around active faults.<br />
LOCAL AND REGIONAL SEISMIC RESPONSE TO INJECTION AND PRODUCTION AT THE SALTON SEA<br />
GEOTHERMAL FIELD, SOUTHERN CALIFORNIA (B-061)<br />
L.J. Lajoie and E.E. Brodsky<br />
California hosts both the largest geothermal resource capacity and highest seismicity rate in the nation. With plans to increase<br />
geothermal output, and proven earthquake triggering in the vicinity of geothermal power plants worldwide, it is important to<br />
determine the local and regional effects of geothermal power production. This study focuses on relating the volume of fluid<br />
extracted from and re-injected into wells at the Salton Sea geothermal field (SSGF) in Southern California to local seismicity<br />
rate and increased probability of larger events on nearby faults such as the San Andreas and Imperial faults. Seismic data is<br />
obtained from the publicly available Advanced National Seismic System (ANSS) catalog and SSGF injection and production<br />
data from the State of California Department of Conservation. We identify triggered earthquakes in the catalog by modeling<br />
seismicity in a 15km radius around the SSGF according to an Epidemic-Type Aftershock Sequence (ETAS) method. The model<br />
seeks to fit the cumulative seismicity curve from our dataset by optimizing five seismic parameters in accordance with<br />
Gutenberg-Richter and Omori's law. The modeled curve is then removed from the dataset to isolate the non-ETAS, or<br />
production-triggered, signal. We then formulate a constitutive law to relate the seismicity rate to the driving stress (i.e.<br />
volumetric strain in the reservoir). Defining the local stressing rate provides a tool for predicting the effects that production<br />
has on regional seismicity rates.<br />
The largest spike in SSGF net production volume over the past 30 years is accompanied by the one of the largest increases in<br />
both seismicity rate and moment release within the geothermal field. This indicates a direct coupling between net fluid<br />
production volume (volume extracted minus volume re-injected) and seismicity rate and cumulative seismic moment in the<br />
field. Three dimensional plots of hypocentral earthquake locations show that seismicity is concentrated on an approximately<br />
NW-SE striking plane that dips shallowly to the west. Numerous inactive low angle normal faults with the same orientation<br />
have been mapped within and bounding the Salton Trough, suggesting the fault underlying the SSGF could be a reactivated<br />
detachment fault. Elevated seismicity rates on the detachment increases the probability of a larger earthquake on the fault that<br />
could directly trigger an event on the San Andreas fault.<br />
ELASTOSTATIC SOLUTIONS FOR REALISTIC SLIP AND STRESS AROUND MODE II AND III CRACKS (A-<br />
111)<br />
V.R. Lambert, S. Barbot, and J. Avouac<br />
A common practice for analyzing the displacement and stress caused by slip on buried faults is to discretize the fault area into<br />
finite size patches of assumed uniform slip and use the corresponding Green’s functions to predict strain at the surface or<br />
within the bulk of the medium. This formalism is commonly used to invert observation of co-seismic deformation for fault slip,<br />
in afterslip analyses, stress transfer studies and in numerical models of the seismic cycle, such as the Uniform California<br />
Earthquake Rupture Forecast (UCERF). The discretization of the fault into areas of uniform slip introduces stress singularities<br />
at the edges of each patch, which might make the results quite sensitive to the choice of the discretization scheme. Yet, little<br />
attention has been paid to this issue so far. Here, we derive analytic expressions of the Green’s functions, for which the<br />
Okada’s solution is a special case. We derive a full-space formulation for linearly interpolated fault slip distributions, which<br />
allows discretization of any fault slip distributions without introducing stress singularities. We investigate the case of a finite<br />
crack with a uniform distribution of stress on the fault. We show that the Okada solution provides an inadequate<br />
representation of the stress distribution for mode II and III cracks, even in the limit of infinitely small discretization. We<br />
introduce a critical size of fault discretization below which stress singularities dominate and bias the distribution. Our<br />
tapered-slip solution does not suffer from these shortcomings, suppresses all singularities and converges to a uniform stress<br />
with smaller discretization. Our results demonstrate the need to resolve the areas of stress concentration in our models of fault<br />
slip evolution.<br />
190 | Southern California Earthquake Center
Poster Abstracts<br />
CRUSTAL STRUCTURE OF THE SALTON TROUGH AND SOUTHERN SAN ANDREAS FAULT FROM NEW<br />
GRAVITY AND MAGNETIC DATA (B-137)<br />
V.E. Langenheim, D.S. Scheirer, and N.D. Athens<br />
Gravity and magnetic data shed light on the subsurface structure of the southern San Andreas fault and Salton Trough.<br />
Regional gravity features include a prominent narrow gravity low in Coachella Valley that decreases in amplitude to the<br />
southeast near the north shore of the Salton Sea. At the south end of the Salton Sea, the gravity low has become a large gravity<br />
high that has been attributed to crustal thinning and mafic lower crust. The northeast margin of the gravity low is linear and<br />
coincides with the San Andreas fault and with a significant magnetic high that is sourced by crystalline basement rocks of the<br />
Little San Bernardino Mountains. The southwest margin is also marked by a gravity gradient, but is not linear in plan view<br />
and the gradient is generally less steep. The gradient mimics the irregular contact of pre-Cenozoic basement rocks and<br />
Cenozoic basin fill.<br />
New gravity data were collected to augment existing data along transects of the Salton Seismic Imaging Project. Measurement<br />
spacing averaged about 800 m, except along the high-resolution seismic line near Salt Creek, where a grid of gravity<br />
measurements spaced about 400 m is supplemented by ground magnetic transects. The detailed geophysical data suggest the<br />
San Andreas fault zone that is about 500-1000 m wide. Between Indio and Salt Creek, the fault is located near the base of the<br />
southwest-facing steep gravity gradient, indicating a steep northeast dip of the basement contact, with higher-density rocks<br />
northeast of the fault. North of Indio, the gradient becomes more diffuse, suggestive of a gentler northeast dip. About 5 km<br />
south of Salt Creek, the fault changes its position relative to the gravity field and is located at the top of a northeast-facing<br />
gravity gradient. This is also suggestive of a northeast dip, but instead places high-density material on the southwest side<br />
against low-density rocks on the northeast side of the fault. A northwest-trending, 20-km-long gravity low northeast of the<br />
San Andreas fault could speculatively reflect a basin formed by a right step between the San Andreas and the Hot Springs<br />
fault. In this region, the active San Andreas fault curves to the south into the Brawley Seismic Zone and large positive gravity<br />
and magnetic anomalies indicate intrusions of mafic material.<br />
ON THE QUANTIFICATION OF ROBUSTNESS WHEN COMPARING KINEMATIC INVERSION MODELS: A<br />
WAVELET APPROACH (B-033)<br />
D. Lavallee, G. Shao, and C. Ji<br />
The Source Inversion Validation (SIV) project (Mai et al. 2011; http://siv.usc.edu/) is an ongoing effort to assess the reliability<br />
and consistency of earthquake source inversion. In this project, multiple inversion codes are used to constrain slip models<br />
from synthetic ground motions generated from a synthetic model. Researchers attempt to understand the resolution of fault<br />
inversions by comparing the inverted models and the synthetic model. Apparently, the algorithms that quantitatively evaluate<br />
the similarity between two 2D models are crucial for such a task. In view of the intrinsic scale and position dependent nature<br />
of the slip distribution, a 2D wavelet based procedure is developed to study the interdependence between the different slip<br />
spatial distributions as a function of the spatial resolution. Quantification of the interdependence can then be used to assess<br />
the quality of the fit between slip models.<br />
Decomposition of a 2D data set with a 2D discrete wavelet transform provides four sets of coefficients. One set of coefficients<br />
essentially consists of a rescaled version of the original data and is used to compute additional wavelet coefficients at lower<br />
resolutions. The three other sets of coefficients are designed to capture the diagonal, horizontal and vertical patterns,<br />
respectively, embedded in the 2D data set. The basic idea of the procedure is to pair the synthetic model with a computed slip<br />
inversion and compare the match of their diagonal, horizontal and vertical patterns. For instance, the quantification of the<br />
matching of the diagonal patterns is achieved by computing the correlation between the wavelet coefficients characterizing the<br />
diagonal patterns. This operation is repeated at different resolutions. The same procedure is applied to the wavelet coefficients<br />
characterizing the horizontal and vertical patterns.<br />
To account for the presence of additional constants in the computed slip inversion, we also compare the square norm of the<br />
wavelet coefficients of both slip distributions as a function of the resolution. This investigation provides the (relative) weight<br />
of the dominant patterns in the data sets. The square norm is computed for the wavelet coefficients characterizing the diagonal,<br />
horizontal and vertical patterns.<br />
The procedure discussed above is applied to different pairs of slip models taken from a bank of slip models computed by Ji<br />
and Shao (2010) ( http://adsabs.harvard.edu/abs/2010AGUFM.S53C1994J).<br />
2011 <strong>SCEC</strong> <strong>Annual</strong> <strong>Meeting</strong> | 191
Poster Abstracts<br />
CHARACTERISTICS OF QUARTZ AND FELDSPAR LUMINESCENCE FROM SOUTHERN CALIFORNIA,<br />
USA: IMPLICATIONS FOR PALEOSEISMIC AND FAULT SLIP-RATE STUDIES (A-131)<br />
M.J. Lawson, B.J. Roder, D.M. Stang, E.J. Rhodes, L. McAuliffe, J.F. Dolan, and S.F. McGill<br />
Southern California comprises a wide range of diverse landscapes and environments, from high mountains with glacial and<br />
periglacial sediments to deserts with large sand dunes, extensive alluvial fans and ephemeral playas. Highly active tectonic<br />
processes have exposed ancient (c. 2 Ga) plutonic and metamorphic basement from deep within the crust, while similar<br />
Paleozoic and Mesozoic rocks are also common. A rich array of volcanic lithologies extending into the late Quaternary<br />
complement many thick sedimentary sequences that formed in equally diverse ancient environments typical of an accreting<br />
active continental margin. In some locations, notably in the Coachella Valley close to Palm Springs and the Salton Sea, low<br />
OSL sensitivity and poor characteristics restrict the application of quartz to date late Pleistocene and Holocene fluvial<br />
sediments, leading to increased age uncertainties in comparison to other places. In other locations such as the Malibu coastline,<br />
high sensitivity of the quartz OSL signal is observed. Problems of poor quartz characteristics, along with uncertainty in<br />
predicting quartz OSL behaviour for future dating campaigns poses a problem for projects, in particular for neotectonic<br />
contexts, including paleoseismic and fault slip-rate studies. While K-feldspar has been used extensively to date eolian and<br />
fluvial sediments in southern California, little information regarding signal stability is available. We explore the characteristics<br />
of both quartz and feldspar subsamples from alluvial fan contexts, in addition to eolian, fluvial, lacustrine environments, in<br />
order to help develop mineral selection criteria for optical dating applications and clarify these issues. Key issues include<br />
signal bleachability (how rapidly the signals are reset by light exposure), signal sensitivity, the presence of fading after<br />
laboratory irradiation and the reproducibility of age estimates. The importance of dose quenching in quartz grains recently<br />
eroded from bedrock, and the role of wildfire in enhancing OSL sensitivity are considered. The relative bleachability of quartz<br />
and feldspar fractions, along with thermal stability considerations are discussed, as part of a process designed to select an<br />
optimal approach for dating sediments typically encountered as part of paleoseismic and fault slip-rate studies. This<br />
presentation represents fundamental research being conducted as part of <strong>SCEC</strong> award #11198.<br />
FULL-3D WAVEFORM TOMOGRAPHY FOR SOUTHERN CALIFORNIA (A-032)<br />
E. Lee, P. Chen, T.H. Jordan, P.J. Maechling, M. Denolle, and G.C. Beroza<br />
Our full-3D tomography (F3DT) uses 3D <strong>SCEC</strong> Community Velocity Model Version 4.0 (CVM4) in Southern California as<br />
initial model, a staggered-grid finite-difference code to simulate seismic wave propagation and the sensitivity (Fréchet)<br />
kernels are calculated based on the scattering integral and adjoint methods to iteratively improve the model. We use both<br />
earthquake recordings and ambient noise Green’s function data, stacking of station-to-station correlations of ambient seismic<br />
noise, in our F3DT inversions. To reduce errors of earthquake sources, the epicenters and source parameters of earthquakes<br />
used in our F3DT are inverted based on full-wave method. In the first two iterations, we used scattering integral to construct<br />
sensitivity (Fréchet) kernels of broadband phase-delay measurements and LSQR algorithm to invert 3D perturbations. In first<br />
iteration, we only used waveforms from regional earthquakes and the waveforms of updated model generally provide better<br />
fit to the observed waveforms. In second iteration, we only used ambient noise Green’s function data in inversion and the<br />
synthetic waveforms generated by updated model not only improved ambient noise Green’s function waveform fittings but<br />
also earthquake waveform similarities. Since the waveform fittings of earthquake waveforms and ambient noise Green’s<br />
function data are improved after first two iterations, we start to combine frequency dependent measurements made on<br />
waveforms of earthquake and ambient noise Green’s function data and to use adjoint method for structure perturbations.<br />
After six iterations, the current model reduced the variance of the waveform misfit more than 55%.<br />
NEAR REAL-TIME FULL-WAVE CENTROID MOMENT TENSOR (CMT) INVERSION FOR GROUND-<br />
MOTION FORECAST IN 3D EARTH STRUCTURE OF SOUTHERN CALIFORNIA (A-036)<br />
E. Lee, P. Chen, T.H. Jordan, and P.J. Maechling<br />
Accurate and rapid CMT inversion is important for seismic hazard analysis. We have developed an algorithm for very rapid<br />
full-wave CMT inversions in a 3D Earth structure model and applied it on earthquakes recorded by the Southern California<br />
Seismic Network (SCSN). The procedure relies on the use of receiver-side Green tensors (RGTs), which comprise the spatialtemporal<br />
displacements produced by the three orthogonal unit impulsive point forces acting at the receiver. We have<br />
constructed a RGT database for 219 broadband stations in Southern California using an updated version of the 3D <strong>SCEC</strong><br />
Community Velocity Model (CVM) version 4.0 and a staggered-grid finite-difference code. Finite-difference synthetic<br />
seismograms for any earthquake in our modeling volume can be simply calculated by extracting a small, source-centered<br />
192 | Southern California Earthquake Center
Poster Abstracts<br />
volume from the RGT database and applying the reciprocity principle. We have developed an automated algorithm that<br />
combines a grid-search for suitable epicenter and focal mechanisms with a gradient-descent method that further refines the<br />
grid-search results. In this algorithm, the CMT solutions are inverted near real-time by using waveform in a 3D Earth structure.<br />
Comparing with the CMT solutions provided by the Southern California Seismic Network (SCSN) shows that our solutions<br />
generally provide better fit to the observed waveforms. Our algorithm may provide more robust CMT solutions for<br />
earthquakes in Southern California. In addition, the rapid and accurate full-wave CMT inversion has potential to extent to<br />
accurate near real-time ground motion prediction based on 3D structure model for earthquake early warning purpose. When<br />
combined with real-time telemetered waveform recordings, our algorithm can provide (near) real-time ground-motion<br />
forecast.<br />
AFTERSHOCK STATISTICS OF THE 1999 CHI-CHI, TAIWAN EARTHQUAKE (B-107)<br />
Y.-T. Lee, D.L. Turcotte, J.B. Rundle, and C.-C. Chen<br />
We analyze the three scaling laws for the aftershock sequences from the Chi-Chi earthquake in Taiwan. The aftershocks are in<br />
good agreement with the Gutenberg-Richter law for frequency-magnitude scaling and the Chi-Chi aftershock decay rates<br />
satisfy the modified Omori’s law. We also consider the statistics of interoccurrence times for Chi-Chi aftershocks. The<br />
observed statistics of interoccurrence times for the Chi-Chi earthquake sequence has a power-law dependence on the times<br />
between successive aftershocks over several orders of magnitude. In this study, we also apply the concept of Omori times to<br />
analyze the interoccurrence times for the Chi-Chi aftershock sequence. We calculate the mean interoccurrence interval over a<br />
fixed number of aftershocks N = 25, 50, 100, 200, and compare the Chi-Chi aftershocks with a combination of Omori decay and<br />
a steady-state background. We consider the Omori times result for the full seismic cycle from 1994 to 2008. Compare<br />
seismicity for the six years period prior to Chi-Chi earthquake with the seismicity for the eight years period following the Chi-<br />
Chi earthquake. Apparently the aftershocks of Chi-Chi earthquake still exist.<br />
PROBING CALIFORNIA'S COASTLINE TO UNEARTH TRACES OF PALEOTSUNAMIS: IMPLICATIONS<br />
FOR THE NEXT USGS MULTI-HAZARDS SCENARIO (B-086)<br />
R. Leeper, N. Graehl, E. Hemphill-Haley, D. Hoirup, B. Jaffe, H. Kelsey, R. Peters, and R. Wilson<br />
Paleotsunami data along the California coast are rare and the data that do exist are limited to northern California. For a better<br />
understanding of the tsunami threat throughout central and southern California, prehistoric data need to be unearthed and<br />
documented in these regions. To accomplish this, the USGS Multi-Hazards Demonstration Project (MHDP) has brought<br />
together scientists from the USGS, California Geological Survey (CGS), and Humboldt State University to identify traces and<br />
develop a prehistoric tsunami inundation chronology. These data will provide geologic evidence to support the next MHDP<br />
scenario, which will consider the effect on California of a tsunami generated by a major earthquake in the eastern Aleutian<br />
Islands.<br />
Research sites were determined by reviewing previous paleotsunami reconnaissance and research, considering coastal<br />
geomorphology and historic site-disturbance, and use of tsunami run-up data from the latest numerical tsunami models.<br />
These models were developed collaboratively by the CGS, California Emergency Management Agency, and the Tsunami<br />
Research Center at the University of Southern California. In response to a major earthquake in the eastern Aleutian Islands,<br />
one scenario results in wave elevations in excess of 9 m at some locations along the central and northern California coast, and<br />
4 m in portions of southern California. In late July 2011, reconnaissance fieldwork commenced in northern California south of<br />
Point Area and will continue southward along California’s coast throughout 2011.<br />
Results of the paleotsunami reconnaissance will set the stage for more in-depth research, which will get underway in early<br />
2012. The final results of the study will be used by the State to better assess its tsunami hazard, especially for probabilistic<br />
tsunami hazard assessment, and incorporated by the MHDP into the next scenario.<br />
HIGH-RESOLUTION MAPPING AND ANALYSIS OF BORDERLAND FAULTS USING MULTIBEAM<br />
BATHYMETRY DATA (B-132)<br />
M.R. Legg, M. Kohler, D. Weeraratne, and N. Shintaku<br />
We have processed new high-resolution swath bathymetry data to map active Borderland fault structures and provide more<br />
accurate estimation of offshore earthquake and tsunami potential. The new data obtained during deployment of a large OBS<br />
array last year are combined with existing data offshore southern California to produce more comprehensive maps of the<br />
seafloor morphology. Four areas of gridded bathymetry maps at 100-m grid spacing were developed. The first area covers<br />
2011 <strong>SCEC</strong> <strong>Annual</strong> <strong>Meeting</strong> | 193
Poster Abstracts<br />
most of the northern Borderland from Point Arguello to the southern San Diego Trough offshore Baja California. The second<br />
area covers the northern part of the Inner Borderland and eastern Outer Borderland from San Nicolas Island to Oceanside<br />
centered around Catalina Basin and Santa Catalina Island. The third area covers the northern Outer Borderland, south of the<br />
Channel Islands and south of the San Nicolas Island escarpment. The fourth area covers the central Outer Borderland from<br />
San Nicolas Island to Velero Basin west of northern Baja California. New multibeam bathymetry tracklines were chosen to<br />
follow major seafloor escarpments where active faulting is expressed by scarps and other lineaments in the seafloor<br />
morphology. Area 2 (Catalina) provides coverage of the major San Clemente fault system including triple junctions (fault<br />
wedge tips of Crowell, 1974) where major active faults intersect at each end of the Catalina Ridge. Area 3 (North Ferrelo)<br />
provides coverage of the major Ferrelo fault zone that extends to the southeast from Santa Rosa Island for more than 300-km<br />
into Mexican waters. The northern section of the East Santa Cruz Basin fault zone (ESCB) lies within the third area. Area 4<br />
(South Ferrelo) provides coverage of the southern two-thirds of the Ferrelo fault zone that lies within U.S. waters–existing data<br />
provide some coverage of this fault zone in Mexican waters to the south. The southern sections of the ESCB fall within the<br />
South Ferrelo map area. The transverse San Nicolas Island escarpment is covered by both Ferrelo map areas, with the southern<br />
map providing coverage of the intersection with the ESCB to the east and the northern map covering the intersection with the<br />
Ferrelo fault zone to the west. In preliminary analysis, we have identified numerous seafloor channels inferred to result from<br />
turbidite flows and deposition that may provide important piercing points where active faults are crossed, such as the San<br />
Diego Trough and San Pedro Basin fault zones.<br />
SURFACE RUPTURE AND SLIP VARIATION INDUCED BY THE 2010 EL MAYOR – CUCAPAH<br />
EARTHQUAKE, BAJA CALIFORNIA, QUANTIFIED USING COSI-CORR ANALYSIS ON PRE- AND POST-<br />
EARTHQUAKE LIDAR ACQUISITIONS. (A-044)<br />
S. Leprince, K.W. Hudnut, S. Akciz, A. Hinojosa Corona, and J.M. Fletcher<br />
One-hundred and three years after the publication of the Lawson report on the Great 1906 earthquake, accurate<br />
documentation of surface deformation along the entire length of an earthquake is still challenging. Analysis of pre- and postearthquake<br />
topographic data provides an opportunity to deliver the full 3D displacement field of the ground’s surface.<br />
However, direct differencing of a pre- and post-earthquake digital topography model (DEM) generally leads to biased<br />
estimation of the vertical component of the deformation. Indeed, if the earthquake also produced significant horizontal motion,<br />
or if the pre- and post-earthquake DEM acquisitions exhibit non-negligible horizontal mis-registration, the vertical offset<br />
measured by direct differencing will be biased by the local topography gradient. To overcome this limitation, we use the<br />
COSI-Corr sub-pixel correlation algorithm to estimate the relative horizontal offset between the pre- and post- 2010 El Mayor –<br />
Cucapah earthquake high resolution LiDAR acquisitions. Compensating for the horizontal offset between the two LiDAR<br />
acquisitions allows us to estimate unbiased measurements of the vertical component of the surface fault rupture induced by<br />
the El Mayor – Cucapah earthquake. We will also show the limitations of the available dataset, such as aircraft jitter artifacts,<br />
which impaired accurate measurements of the horizontal component of the surface deformation. This analysis shows an<br />
unprecedented view of the complete vertical slip component of the rupture induced by the Mw 7.2 2010 El Mayor – Cucapah<br />
earthquake, sampled at every 5 m, over a length of about 100 km, and with a vertical accuracy of a few centimeters. Using<br />
sampling bins as narrow as 150 m and 1.5 km long, variations in the vertical component of an oblique slip earthquake are<br />
presented, with breaks along multiple fault-strands showing opposite dip directions and diffuse boundaries. Vertical<br />
displacement profiles across the entire fault rupture and selective horizontal displacement profiles will be shown. With the<br />
availability of high precision pre- and post-earthquake data, COSI-Corr has the ability to accurately document the variability<br />
of 3D surface slip along strike of an earthquake rupture. Such data can be used to investigate the causes of this variability, and<br />
improve our understanding of its influence on the pattern of ground shaking.<br />
http://www.tectonics.caltech.edu/slip_history/spot_coseis/<br />
PRELIMINARY EVALUATION OF THE 2010 SHAKEOUT EARTHQUAKE DRILL (A-025)<br />
A. Leslie, L.A. Davis, M.M. Wood, and R. Green<br />
An annual ShakeOut earthquake drill has been held in California since 2008. Evaluation of such efforts is essential to<br />
confirming successful implementation, assessing program effectiveness, and determining whether resources have been used<br />
efficiently. Evaluation activities have taken place for each of the ShakeOuts to date. Following the most recent ShakeOut in<br />
October of 2010, an internet survey was conducted with registrants 3 -7 weeks following the drill. A volunteer sample<br />
(N=1,879 of 8,726 registrants with valid email addresses; 22%) of registered ShakeOut participants was recruited to participate<br />
in the survey via email. The survey sample consisted of respondents who were California residents who were registered as<br />
194 | Southern California Earthquake Center
Poster Abstracts<br />
individuals (30%), <strong>org</strong>anizations (46%), K-12 schools (16%), school districts (5%), and colleges/universities (3%). Process and<br />
outcome results will be reported and are being <strong>org</strong>anized into a final report which will be made available to stakeholders and<br />
drill participants. The final report will include information such as respondent demographics, drill implementation, and<br />
preparedness actions taken both before and after conduct of the drill. This information can be utilized by drill participants to<br />
evaluate their own ShakeOut methods and to provide feedback for future drill improvements.<br />
RECORDING FAULT-ZONE TRAPPED WAVES FROM AFTERSHOCKS OF THE M7.2 DARFIELD AND M6.3<br />
CHRISTCHURCH EARTHQUAKE SEQUENCE FOR DOCUMENT OF SUBSURFACE DAMAGE ZONES (A-<br />
083)<br />
Y-G. Li, G. Paucale, D. Gravely, J. Cherrington, and M. Alvarez<br />
The M6.3 Christchurch earthquake struck the Canterbury region in NZ's South Island on 22 February 2011, following ~6<br />
months after the Sept. 4, 2010 M7.1 Darfield earthquake in the same region. It is not know clearly whether the later M6.3 event<br />
is technically an aftershock because of its relationship to the ongoing activity since September last year, or it is a separate event,<br />
given its location on a separate fault system. In order to study the complicated subsurface structure of the damage zones<br />
caused by this sequence of earthquakes in NZ, under the support of NSF-RAPID Program, we deployed 12 PASSCAL<br />
seismographs in two ~300-m long seismic lines across the Greendale fault where the horizontal right-lateral slip of 4.5 m and<br />
vertical slip of 1.6 m were caused by the 2010 M7.2 Darfield earthquake and the aftershock zone of the M6.3 Christchurch<br />
earthquake, respectively, to record fault-zone trapped waves (FZTWs) generated by aftershocks, starting from May 5th, 2011.<br />
Two arrays have recorded the data for more than 300 M>3 aftershocks and more than ~1000 small aftershocks not located yet<br />
but with good signal-to-noise ratio. The data include M5.3, M6, M5.4 and M5.1 aftershocks with clustered events at depths of<br />
10-15 km. Preliminary examination of the waveform data shows FZTWs clearly at stations located within the 50-75-m wide<br />
rupture zone with high density of en-echelon cracks on the ground surface along the Greendale fault. 3-D finite-difference<br />
simulations of these FZTWs show a distinct low-velocity zone (LVZ) at seismogenic depth, indicating that the Greendale fault<br />
has undergone strong dynamic stresses and pervasive cracking during the M7.2 Darfield earthquake. We interpret this LVZ as<br />
being a remnant of damage zone in dynamic ruptures that accumulated damage from historical earthquakes, but mainly from<br />
the most recent M7.2 mainshock. The zone co-seismically weakens in the mainshock subsequently heals (partially) during the<br />
interseismic period. More detailed results coming from a systematical analysis and modeling of the entire waveform data<br />
recorded in our RAMP experiment help us to document (1) the material property (width, velocity reduction, Q value and<br />
depth extension of damage zones of M7.2 Darfield and M6.3 Christchurch earthquakes, (2) the subsurface geometry of their<br />
principal slip planes, segmentation and connection, and (3) the procession of co-seismic damage and post-mainshock healing<br />
of fault zone rocks during this earthquake sequence.<br />
MULTIPLE DOUBLE COUPLE ANALYSIS FOR M6-7 EARTHQUAKES (B-050)<br />
X. Li, G. Shao, and C. Ji<br />
We develop a Multiple Double Couple (MDC) source inverse algorithm to quickly explore the potential complex source with<br />
the same or different focal mechanisms of an earthquake. We have applied this method to study the global large earthquakes<br />
(Mw>8) using long-period records and obtained a couple of dependable results. In this study, low frequency signals recorded<br />
at near field broadband or/and strong motion stations are implemented to probe the source complexity of smaller earthquake<br />
based on our MDC method. Inversion speed is highly accelerated by employing OpenMP technique and we can typically<br />
obtain the results in a few minutes. Uncertainty of inverted parameters is explored by searching the ensemble of models with<br />
acceptable fit to the data. We first test this code using the well-studied 1999 M7.1 Hector Mine, California earthquake and then<br />
apply this method to study the complex 2010 Mw7.2 El Mayor-Cucapah earthquake, which is dominant by strike-slip motion<br />
but has a significant normal component.<br />
STRESS-SLIP BEHAVIOR OF A SHEARED GRANULAR MATERIAL WITH GRAIN BREAKAGE USING THE<br />
SHEAR-TRANSFORMATION-ZONE THEORY (B-142)<br />
C.K.C. Lieou, A.E. Elbanna, J.S. Langer, and J.M. Carlson<br />
With an eye towards geophysical applications, we study the stress-slip behavior and energy dissipation in a sheared granular<br />
material with breakage through a reformulation of the shear-transformation-zone (STZ) theory of plastic deformation Our<br />
new theory accomodates the occurrence of grain breakage by means of a constitutive law, based on dimensional analysis alone,<br />
for the time evolution of the average grain size as a result of grain fragmentation. Our numerical results indicate that grain<br />
2011 <strong>SCEC</strong> <strong>Annual</strong> <strong>Meeting</strong> | 195
Poster Abstracts<br />
breakage weakens the ability of a granular material to support a shear stress, even though grain breakage accounts for only a<br />
small fraction of the total energy dissipation.<br />
HIGH-FREQUENCY AMBIENT NOISE TOMOGRAPHY USING INDUSTRIAL SEISMIC ARRAY IN LONG<br />
BEACH, CALIFORNIA (B-063)<br />
F. Lin and R.W. Clayton<br />
The ambient noise cross-correlation method has now routinely being applied to study shallow earth structure. Here we<br />
present the preliminary result of such application on an industrial array in Long Beach, California. The data was recorded by<br />
NodalSeismic Inc. The pilot study contains about 150 stations with 72 hours of data on each of the four local streets (Cherry<br />
Ave., Redonde Ave., Spring St., and Willow St.). After temporal normalization and spectrum whitening, cross-correlations are<br />
calculated and clear signals, which can be associated with air waves and surface waves, are observed between 1 and 20 Hz<br />
frequency. We perform frequency-time analysis (FTAN) to study the dispersion property of the observed signals. Besides<br />
demonstrating the applicable of the ambient noise method in a suburban area, we also present potential complexities in<br />
observed cross-correlations due to persistent regional noise sources.<br />
GEODETIC SLIP RATES IN THE SOUTHERN SAN ANDREAS FAULT SYSTEM: INVESTIGATION OF THE<br />
EFFECTS OF HETEROGENEOUS ELASTIC STRUCTURE (A-057)<br />
E. Lindsey and Y. Fialko<br />
We investigate the importance of fault geometry and crustal heterogeneity on estimates of slip rates and locking depths of the<br />
Southern San Andreas fault (SAF) and San Jacinto fault (SJF). Previous estimates of geodetic slip rates in the Salton Sea region<br />
based on dislocation models have generally inferred a higher slip rate on the SAF (21-26 mm/yr) compared to the SJF (12-19<br />
mm/yr). The inferred geodetic slip rate on the SAF is higher than recent geologic estimates representing average slip rates on<br />
time scales of 10^4-10^6 years. We investigate to what extent the geodetically inferred slip rate might be biased by incorrect<br />
assumptions about the fault geometry and neglect of spatial variations in crustal rigidity. To address this issue, we use a<br />
forward model that incorporates heterogeneous elastic moduli computed from the <strong>SCEC</strong> CVM-H seismic tomography model<br />
of Southern California. In our inversions we allow for a non-vertical SAF and a "blind" segment of the SJF, the previously<br />
suggested southern continuation of the Clark fault. The models are compared to surface velocities derived from a combination<br />
of all available continuous and campaign GPS sites in the region, processed in a consistent North American fixed frame<br />
(NAFD), and InSAR data spanning 18 years (1992-2010). These data sources are strongly complementary: while InSAR<br />
provides higher spatial resolution in the near-fault region, we find that GPS sites located more than 10 locking depths from the<br />
fault are required to resolve the trade-off between locking depth and fault slip rate. The parameter space is examined using an<br />
efficient Monte Carlo algorithm which approximates the joint probability distribution for the model parameters and allows for<br />
a formal evaluation of uncertainties and trade-offs. We estimate slip rates of 15(+/-2) mm/yr for the Southern San Andreas<br />
fault and a total of 23(+/-3) mm/yr for the two closely spaced branches of the southern San Jacinto fault, in reasonable<br />
agreement with geologic estimates. The locking depths are estimated at 9(+/-3) km and 16(+/-3) km for the SAF and SJF,<br />
respectively. The incorporation of realistic elastic properties serves to increase the estimated locking depths on both faults by<br />
2-3 km, and decreases the estimated slip rate on the San Andreas fault by several mm/yr in comparison to a homogeneous<br />
elastic model.<br />
SEISMIC SOURCE CHARACTERIZATION FOR THE LADWP VAN NORMAN COMPLEX AND ISSUES TO<br />
CONSIDER FOR UCERF3 IN THE NORTHERN SAN FERNANDO VALLEY, CA (A-125)<br />
S. Lindvall, C. Kemp, J. Unruh, and D. O'Connell<br />
A new seismic source model was developed to support the seismic hazard evaluation of the Los Angeles Department of Water<br />
& Power (LADWP) existing and proposed water storage, treatment, and conveyance facilities at the Van Norman Complex<br />
(VNC) located in the northern San Fernando Valley. The LADWP is the largest municipal utility in the USA and nearly 75% of<br />
the city’s annual water supply flows through the VNC, which makes these reservoir, embankment, water treatment, and<br />
pipeline facilities critical to the City of Los Angeles. The VNC site, which lies in one of the most tectonically complex areas of<br />
the Transverse Ranges, has experienced strong near-field ground motions in both the 1971 M6.7 San Fernando and 1994 M6.7<br />
Northridge earthquakes that ruptured faults adjacent to and beneath the VNC. The new seismic source characterization<br />
focused on detailed assessments of these and several other local fault sources that contribute most significantly to the VNC<br />
seismic hazard. The new seismic source characterization included the reprocessing and interpretation of nine oil-industry<br />
seismic reflection profiles in the northeastern San Fernando Valley to map subsurface strands of the Verdugo, Mission Hills,<br />
196 | Southern California Earthquake Center
Poster Abstracts<br />
and Northridge Hills faults. Integration of these subsurface seismic data with an analysis of tectonic geomorphology suggests<br />
that these three faults are continuous and represent a larger fault system. The new source model also added the Mission Hills<br />
and Santa Susana East faults as new sources, both of which define geomorphically expressed range fronts. These relatively<br />
short faults have not been included in recent regional source models (e.g., UCERF2) due to their relatively small dimensions.<br />
However, including these smaller faults is critical to the site hazard as they represent moderate magnitude, single-fault<br />
ruptures, as well as fill in gaps of potentially larger, multi-fault seismic sources. In an effort to capture a greater uncertainty in<br />
segmentation and fault behavior, the model allows for multi-fault ruptures for several sources, including the Santa Susana-<br />
Sierra Madre-Cucamonga fault system.<br />
DOES THE TEAR FAULT MATTER? (A-078)<br />
Q. Liu, R.J. Archuleta, and R.B. Smith<br />
Faults are not planar; the geometry of the fault has introduced extra dimension of complexity into the earthquake physics<br />
problem. (Scholz, 1998; Wesnousky 2006) Dynamic triggering between adjacent faults could lead to cascading earthquakes<br />
thus changing the seismic hazard estimation dramatically. Previous work has address the multi-fault dynamic rupture<br />
problem in terms of piece-wise planar fault system (e.g. Harris and Day, 1993; Magistrale and Day, 1999). We are trying to<br />
study a similar but more realistic case with the Wasatch Fault. The Salt Lake City segment of the Wasatch Fault (SLCWF) is a<br />
curved normal fault, which poses a serious threat to the surrounding communities due to the potential of a Mw 7+ earthquake.<br />
In the middle of the segment there is a potential tear fault that would separate the northern and southern segments. We want<br />
to answer the following question: to what extent does the possible tear fault impact the dynamic rupture process. This<br />
problem needs a careful investigation about not only the rupture dynamic on a non-planar fault, but also several ingredients<br />
in dynamic rupture problems, such as hypocenter location, initial stress distribution, etc. We use a finite element method (Ma<br />
& Liu, 2006) to simulate the dynamics of a propagating rupture on SLCWF both with and without the tear fault.<br />
NEW DEVELOPMENTS AND FUTURE APPLICATIONS OF THE COLLABORATORY FOR THE STUDY OF<br />
EARTHQUAKE PREDICTABILITY (CSEP) TESTING FRAMEWORK (B-118)<br />
M. Liukis, D. Schorlemmer, J. Yu, P. Maechling, J. Zechar, T.H. Jordan, and he CSEP Working Group<br />
Southern California Earthquake Center (<strong>SCEC</strong>) began development of the Collaboratory for the Study of Earthquake<br />
Predictability (CSEP) in January of 2006 with funding provided by the W. M. Keck Foundation. Since that time, scientists and<br />
software engineers have applied the scientific and computational principles of CSEP to develop several operational testing<br />
centers. The W. M. Keck Foundation Testing Center at <strong>SCEC</strong>, designed to conduct computational earthquake forecast<br />
experiments in California, began operations on September 1, 2007 and has been improved, optimized, and extended over the<br />
past four years. The implementation of the <strong>SCEC</strong> Testing Center has been guided by four design goals proposed by the<br />
Regional Earthquake Likelihood Models (RELM) working group: (1) Controlled Environment, (2) Transparency, (3)<br />
Comparability, and (4) Reproducibility. By meeting these goals, the CSEP testing framework can provide clear descriptions of<br />
how all registered earthquake forecasts are produced and evaluated. As of August 2011, there are four testing centers<br />
established around the globe, with 224 models under test. CSEP software is also available for personal use by scientists to<br />
perform independent study and evaluation of their model prior submitting it to the Testing Center<br />
(http://northridge.usc.edu/trac/csep/wiki/MiniCSEP). The <strong>SCEC</strong> Testing Center hosts intermediate-term and short-term alarmbased<br />
and rate-based forecasts for California, the Western Pacific, and a global testing region. We describe how the CSEP<br />
Testing Center at <strong>SCEC</strong> has been constructed to meet the design goals; we also present recent developments of the Testing<br />
Center and share our experiences operating the center since its inception. Additionally, we discuss how the CSEP<br />
infrastructure will be applied to geodetic transient detection, earthquake early warning and ground motion prediction<br />
experiments.<br />
THE CLARK CO. PARCEL MAP AND IMPLICATIONS FOR EARTHQUAKE HAZARD DEFINITION IN<br />
SOUTHERN NEVADA (A-033)<br />
J.N. Louie, W. Savran, B. Flinchum, G. Plank, S.K. Pullammanappallil, A. Pancha, and W.K. Hellmer<br />
Clark County, Nevada has completed the nation's very first effort to map earthquake hazard class systematically through an<br />
entire urban area. The Parcel Map contains measurements of geotechnical shear velocity to 30 m depth obtained using<br />
SeisOpt® ReMi (© Optim, 2011) at over 10,000 separate sites in urban and urbanizing Clark County and the City of<br />
Henderson. These municipalities use the Parcel Map to assure compliance with the NEHRP provisions of the International<br />
Building Code. Leveraging the unprecedented detail of the Parcel Map, our multi-institutional collaboration is developing<br />
2011 <strong>SCEC</strong> <strong>Annual</strong> <strong>Meeting</strong> | 197
Poster Abstracts<br />
“Next-Level ShakeZoning” procedures tailored for defining earthquake hazards in the Intermountain West. Current federally<br />
sponsored tools- the USGS hazard maps and ShakeMap, and FEMA HAZUS- were developed as statistical summaries to<br />
match earthquake data from California, Japan, and Taiwan. The 2008 Wells and Mogul events in Nevada showed in particular<br />
that the generalized statistical approach taken by ShakeMap cannot match actual data on shaking from earthquakes in the<br />
Intermountain West, even to first order. Next-Level ShakeZoning relies on physics and geology to define earthquake shaking<br />
hazards, rather than statistics. It follows theoretical and computational developments made over the past 20 years, to<br />
capitalize on detailed and specific local data sets and more accurately model the propagation and amplification of earthquake<br />
waves through the multiple geologic basins of the Intermountain West. Using the new Parcel Map in computing shaking in<br />
Las Vegas Valley for scenario earthquakes is crucial for obtaining realistic predictions of ground motions. In an educational<br />
element of the project, a dozen undergraduate students are computing 50 separate earthquake scenarios affecting Las Vegas<br />
Valley, using the Next-Level ShakeZoning process. Despite affecting only the upper 30 m, the Vs30 geotechnical shear-velocity<br />
from the Parcel Map shows clear effects on even the longer-wavelength 0.1-Hz to 0.5-Hz shaking predictions. The fully 3-d<br />
Next-Level ShakeZoning scenarios show many areas of shaking amplification and de-amplification that USGS ShakeMap<br />
scenarios cannot predict.<br />
ANALYTIC CALCULATION OF STRESSING RATES IN SOUTHERN CALIFORNIA (B-148)<br />
J.P. Loveless and B.J. Meade<br />
During the interseismic phase of the earthquake cycle stresses on faults evolves in response to elastic strain accumulation<br />
driven by tectonic plate motions. Because earthquake cycle processes induce non-local stress changes, the interseismic stress<br />
accumulation rate on one fault is influenced by the behavior of all nearby faults. Here we calculate stressing rates throughout<br />
the upper crust in southern California using a three-dimensional fault system model constrained by GPS observations.<br />
Stressing rates on all faults are calculated analyticallying used dislocation theory without the need to spatially differentiate<br />
GPS velocity observations. Notably, the total interseismic elastic strain field generated by fault interactions within the<br />
southern California may increase stressing rates on the Mojave and San Bernardino sections of the San Andreas fault within<br />
the Big Bend region by up to 38% relative to estimates from isolated San Andreas models. Assuming steady fault system<br />
behavior since the 1857 Fort Tejon earthquake, stress accumulated on these sections due only to interaction with faults other<br />
than the San Andreas reaches 1 MPa, ~3 times larger than the coseismic and postseismic stress changes induced by recent<br />
southern California earthquakes.<br />
THE EFFECTS OF INTERMEDIATE FAULT SEGMENTS ON RUPTURE BEHAVIOR AND GROUND MOTION<br />
IN STRIKE-SLIP STEPOVERS (A-075)<br />
J.C. Lozos, D.D. Oglesby, J.N. Brune, and K.B. Olsen<br />
Stepovers in natural faults are complex regions of deformation, fracturing, and smaller faulting; they rarely consist of two<br />
planar fault segments, as they are often modeled. While conducting dynamic models of completely realistically complex<br />
stepover systems is still computationally prohibitive, the present study investigates one common complexity: the presence of<br />
smaller intermediate fault segments between the two main faults. We investigate the effects of these segments on rupture<br />
behavior and ground motion in the stepover region using the three-dimensional finite element method. We align the<br />
intermediate segment with the projected point at which rupture jumps from main segment to main segment, so as to<br />
maximize its effect. We test intermediate segments of several different lengths and depths, and we test both extensional and<br />
compressional systems. For each of these geometries, we test two stress states: one in which rupture will jump the stepover in<br />
an analogous system with no intermediate segment, and one in which rupture does not jump in such a system. We find that,<br />
depending on the regional stress field and the size of the intermediate fault segment, the presence of this segment may either<br />
promote or inhibit throughgoing rupture at the stepover, and may either increase or decrease peak ground motion. The<br />
dependence of ground motion on intermediate fault size is not monotonic, and is can be different between extensional and<br />
compressional stepovers. These results may appear somewhat counterintuitive, but they may have important implications for<br />
fault-to-fault rupture probabilities, ground motion prediction, and overall seismic hazard calculation.<br />
NUMERICAL SIMULATION OF SLOW SLIP TRIGGERED TREMOR MIGRATION AND RAPID TREMOR<br />
REVERSALS (A-100)<br />
Y. Luo and J.P. Ampuero<br />
Recently discovered slow-slip events (SSE) and non-volcanic tremors have greatly enriched the spectrum of earthquake<br />
behavior. These phenomena offer a unique window into the mechanics of the bottom of the seismogenic zone of active faults.<br />
198 | Southern California Earthquake Center
Poster Abstracts<br />
In an emergent view, this transition region has heterogeneous frictional properties, and is composed of frictionally unstable,<br />
velocity-weakening patches embedded in a frictionally stable fault region. Tremor swarms are viewed as the collective<br />
response of brittle asperities interacting through transient aseismic slip in their surroundings. A hierarchy of migration<br />
patterns of tremors has now been observed in the Cascadia subduction zone, including large-scale along-strike tremor<br />
propagation at ~10km/day and rare swarms that propagate 10 times faster in the opposite direction ('rapid tremor reversals').<br />
A cascade of brittle asperity failures mediated by transient creep is an appealing model to explain these migration patterns.<br />
We performed a quantitative study of this model through numerical simulations of heterogeneous rate-and-state faults under<br />
the quasi-dynamic approximation, solved by a Boundary Element Method. We conveniently generated SSEs, propagating at<br />
~10 km/day, by adopting an ad hoc rate-and-state friction law with a transition from velocity-weakening to strengthening.<br />
Brittle asperities are defined as small patches of velocity-weakening friction with shorter characteristic slip distance Dc, larger<br />
friction parameters a and b or higher effective normal stress (sigma) than their surroundings. The state variable is governed by<br />
the 'slip law', which allows conditionally stable behavior. A collection of brittle asperities is distributed along the fault. We<br />
studied the effect of their size and spacing and of the contrast of a*sigma and Dc with respect to the background. We<br />
successfully simulated both observed migration patterns. The slow forward migration is obviously due to tremor triggering<br />
near the leading front of the propagating SSE pulse. Less trivially, our model also produces RTRs with similar characteristics<br />
as in Cascadia: spatially scattered swarms back-propagating at fast speed ~100 km/day. These RTRs are rare because they<br />
nucleate at the asperities with largest Dc. While our model reproduces key features of the complex spatio-temporal<br />
<strong>org</strong>anization of tremors as observed in Cascadia and Japan, this comes at the cost of tuning some model parameters. We will<br />
report the results of our parametric study.<br />
ABSOLUTE STRESS IN SOUTHERN CALIFORNIA CONSTRAINED BY EARTHQUAKE FOCAL<br />
MECHANISMS AND MODELS OF STRESS CONTRIBUTIONS FROM TOPOGRAPHY AND FAULT LOADING<br />
(A-060)<br />
K.M. Luttrell, D.T. Sandwell, and B.R. Smith-Konter<br />
Earthquake focal mechanisms in southern California may be used as in situ indicators of the 3-D orientation of the stress field.<br />
This stress field is heterogeneous, as reflected by the presence of strike-slip, reverse, and normal faulting mechanisms in close<br />
proximity to one another. We attempt to reproduce these observations by accounting for the stress fields from three sources: 1)<br />
the 3-D crustal stress associated with the support of local topography (i.e., wavelengths less than ~350 km) at both the surface<br />
and Moho, as constrained by gravity observations; 2) the 3-D earthquake cycle stress accumulated on locked fault segments;<br />
and 3) a 2-D regionally uniform stress field representing plate boundary scale tectonic driving stress. The magnitude and<br />
orientation of the regional stress field are varied to obtain the best possible fit to the stress orientations indicated by<br />
earthquake focal mechanisms. For southern California, we find the non-lithostatic component of regional driving stress must<br />
consist of at least 30 MPa compression oriented at N15E. However the magnitude of the orthogonal component must be varied<br />
along the fault in order to simultaneously reproduce both the strike-slip and thrust mechanisms. This indicates that there is an<br />
additional E15S compressional stress in the big bend region that is not accounted for by the weight of topography and the<br />
earthquake cycle stress.<br />
OBSERVATIONS OF RECENTLY-EXPOSED FUMAROLE FIELDS NEAR MULLET ISLAND, IMPERIAL<br />
VALLEY, CALIFORNIA (A-138)<br />
D.K. Lynch, K.W. Hudnut, P.M. Adams, and L.S. Bernstein<br />
New field observations, lidar measurements, aerial imaging and preliminary laboratory measurements of mud samples are<br />
reported of three formerly submerged fumarole fields in the Salton Trough near Mullet Island in southeastern California, USA.<br />
The fumarole fields have recently been exposed as the Salton Sea level has dropped. The largest of the three fields visited in<br />
January 2011 is irregular in outline with a marked northeast elongation. It is roughly 400 meters long and 120 meters wide.<br />
The field consists of approximately one hundred warm to boiling hot (100° C) mud volcanoes (0.1 – 2 m in height), several<br />
hundred mud pots, and countless CO2 gas vents. Unusual shaped mud volcanoes in the form of vertical tubes with central<br />
vents were observed in many places. Lidar measurements were obtained in the time period Nov 9-13, 2010 using an Optech<br />
Orion 200M lidar from an elevation 800 m AGL. They reveal that the terrain immediately surrounding the two fields that are<br />
above water level reside on a low (~0.5 m high) gently sloping mound about 500 m across that shows no evidence of<br />
lineaments indicative of surface faulting. With other geothermal features, the fumaroles define a well-defined line marking the<br />
probable trace of the Calipatria fault. Although the precise locations is uncertain, it appears to define a straight line 4 km long<br />
between the Davis-Schrimpf mud volcanoes and Mullet Island. Mullet Island is one of five late Quaternary rhyolitic volcanic<br />
2011 <strong>SCEC</strong> <strong>Annual</strong> <strong>Meeting</strong> | 199
Poster Abstracts<br />
necks in the immediate area of the fumaroles. The Calipatria fault is subparallel to the San Andreas and Imperial faults and<br />
only one of many verified or suspected faults (including cross faults) in the complex tectonic setting of the Salton Trough.<br />
Mud from several volcanoes was analyzed using scanning electron microscopy (SEM), and energy dispersive X-ray<br />
spectroscopy (EDS). One sample contained boussingaultite, (NH4)2Mg(SO4)2·6(H2O), a rare mineral that is known to sublime<br />
under fumarolic conditions, possibly by ammoniation of hydrated MgSO4.<br />
As the Salton Sea level continues to drop, the third fumarole field is expected to surface in the next couple of years. It is also<br />
likely that as more land emerges, many of the CO2 gas seeps currently under water will begin to form mud volcanoes and<br />
mud pots, most of them along the same NW trending axis as the others. At about the same time a land bridge will form to<br />
Mullet Island, the first in about 60 years.<br />
IBEM3D: A REMOTE STRESS INVERSION PROGRAM HONORING MECHANICAL RELATIONSHIPS<br />
BETWEEN STRESS AND FAULT GEOMETRY (A-112)<br />
E.H. Madden, F. Maerten, and D.D. Pollard<br />
Aftershocks have been correlated spatially with changes to the Coulomb shear stress on optimally orientated planes (e.g. Stein<br />
and Lisowski, 1983; King et al, 1994) and static stress change on nodal planes inferred from focal mechanisms (e.g. Hardebeck<br />
et al, 1998; Seeber and Armbruster, 2000) due to slip on planar mainshock faults. The orientations of individual aftershocks<br />
have been mechanically related to the perturbed stress field from slip on non-planar faults, with distinct fault geometries<br />
producing the best-fit model Coulomb planes at aftershock hypocenters, as well as honoring the recorded slip distribution at<br />
Earth’s surface (Madden and Pollard, 2011, submitted). However, stress inversions generally overlook these connections<br />
between aftershocks, fault geometry and stress perturbations. New inversion software, iBem3D (Maerten, 2010), uses a<br />
homogeneous remote stress with one principal axis vertical to drive slip on non-planar faults and determines the resulting<br />
stress state at all aftershock locations. The orientation and remote principal stress magnitudes that minimize the ‘cost’ or misfit<br />
between aftershock focal mechanisms and model Coulomb plane orientations or slip vectors are converged upon iteratively,<br />
over multiple model runs. The cost of individual aftershocks may be analyzed for systematic effects on inversion results of<br />
aftershock characteristics such as magnitude, distance in time and space from the mainshock, and focal mechanism<br />
uncertainty, or to determine locations where mainshock fault geometry may be incorrect, producing a cluster of aftershocks<br />
with large misfits. The sum of all individual costs quantitatively assesses the relative performance of inversions executed with<br />
different model geometries or subsets of aftershocks. In addition, relative costs are used to select one nodal plane, from the<br />
two provided by the aftershock focal mechanism, for inclusion in the inversion. Other observed data, such as the orientations<br />
of slickenlines, veins, or secondary faults, may be used to constrain the inversion, either in addition to, or instead of,<br />
aftershock focal mechanisms; the only change to iBem3D procedure is adjustment of the cost function applied.<br />
COMPILATION OF SLIP IN LAST EARTHQUAKE DATA FOR HIGH-SLIP RATE FAULTS IN CALIFORNIA<br />
FOR INPUT INTO SLIP DEPENDENT RUPTURE FORECAST (A-129)<br />
C.L. Madden Madugo, J.R. Arrowsmith, D.E. Haddad, J.B. Salisbury, and R.J. Weldon<br />
Slip in the last earthquake along a fault, in conjunction with the application of appropriate recurrence models, can be used to<br />
estimate the timing and size of future ground-rupturing earthquakes. Surface slip measurements are relatively easy to acquire<br />
along highly active faults because offsets from the last event are often well preserved by geomorphic features in the landscape.<br />
We present a comprehensive database of slip measurements for high slip rate strike-slip and dip-slip faults in California for<br />
input into the slip-dependent 2011 Uniform California Earthquake Rupture Forecast (UCERF 3). Our database includes<br />
historic, paleoseismic, and geomorphic data on slip in the last event and multi-event offsets. Faults were prioritized by highest<br />
slip rates and longest time since the last event relative to average recurrence interval. Slip rate, timing of the last event, and<br />
recurrence interval were obtained from past reports by the Working Group on California Earthquake Probabilities, unless<br />
more recently published data were available. A literature search determined the availability of offset data for the highest<br />
priority faults. We contacted authors of published slip studies to ascertain whether additional data exist in unpublished<br />
archives, gray literature, or publications in preparation. Lack of consistency in existing schemes to rate offset quality led us to<br />
develop a new semi-quantitative method to asses feature and tectonic quality for new and existing data. Recent analyses of<br />
newly available, high-resolution LiDAR topography for micro-geomorphic offsets have substantially increased the number of<br />
slip measurements available for our compilation. For faults with LiDAR coverage, but limited offset data, we identified<br />
reaches with high potential to preserve geomorphic offsets and calculated slip measurements. The methodology for our<br />
geomorphic analyses has been developed and implemented successfully in recent studies along the central San Jacinto Fault<br />
and 1857 earthquake reach of the San Andreas Fault. Last, we compiled data collected from our literature search and LiDAR<br />
200 | Southern California Earthquake Center
Poster Abstracts<br />
analysis into a geodatabase. Our database contains multiple measurements for the same features using different techniques,<br />
making it a powerful tool to test the repeatability of slip measurements. Our compilation reveals that despite local variation,<br />
slip values tend to cluster around a reach averaged-mean, and slip can be similar at a point over multiple events.<br />
INVESTIGATING THE IMPACT OF SPACE-GEODETIC DATA ON EARTHQUAKE RISK ANALYSES FOR<br />
CALIFORNIA (B-092)<br />
C.M. Mak and M. Nyst<br />
California is monitored by a dense network of GPS stations, producing a high resolution velocity field of the Earth’s surface.<br />
One way of translating this velocity field into crustal deformation parameters that can be used in PSHA is the ‘Block Model’.<br />
In the block model the crust is parameterized as a number of elastically deforming blocks, bounded by surfaces that represent<br />
the major active faults. Based on differences in underlying methods and assumptions they produce significant differences in<br />
terms of fault slip rates, geometry of the building blocks and location of the faults.<br />
This study focuses on the impact of the inclusion of block models on earthquake risk in California. Earthquake risk combines<br />
earthquake hazard and building vulnerability to estimate the probable damage and loss of property and/or life. We look at<br />
the impact of space-geodetic data on risk by comparing loss results from traditional risk models, based on earthquake and<br />
geology data, with loss results from block models. More specifically, we will present what the impact of a geodetic<br />
deformation model on residential earthquake risk.<br />
DEFORMATION RATES IN THE WESTERN TRANSVERSE RANGES, CALIFORNIA FROM THE SAN<br />
ANDREAS TO THE SANTA BARBARA CHANNEL MEASURED WITH GPS AND PERSISTENT SCATTERER<br />
INSAR (A-050)<br />
S.T. Marshall, G.J. Funning, and S.E. Owen<br />
We combine data from 52 continuous GPS sites in the Plate Boundary Observatory network with a persistent scatterer InSAR<br />
data set formed from ENVISAT ASAR data to determine the rates of seasonal, anthropogenic, and tectonic deformation in the<br />
western Transverse Ranges of southern California. To characterize seasonal motions, we independently estimate phases and<br />
amplitudes of annual and semiannual motions for each GPS time series. We remove these seasonal terms, and then perform<br />
Principal Component Analysis on the residual time series to remove any common-mode errors. The final time series are<br />
dominantly linear with a significant reduction in root-mean squared error, suggesting that the seasonal motions have been<br />
successfully removed. To determine if any of the remaining motions are non-tectonic in origin, we use a persistent scatterer<br />
InSAR (PSI) data set comprised of 21 ENVISAT scenes. The PSI data show potential anthropogenic deformation in the form of<br />
subsidence in the Oxnard/Ventura area as well as at a location just south of the Oak Ridge. No GPS stations are located near<br />
the areas of suspected anthropogenic motion, and so the GPS velocities are unlikely to be contaminated by non-tectonic<br />
motions. The relative lack of anthropogenic contamination of permanent GPS motion in the western Transverse Ranges is in<br />
stark contrast to the nearby Los Angeles basin where many permanent GPS stations record significant anthropogenic motions.<br />
To determine the local (within-basin) deformation rates, we remove strain associated with the nearby San Andreas fault using<br />
a rectangular dislocation model. The resultant velocity field shows dominantly north-northwest directed contraction. The<br />
central Ventura basin shows the fastest contraction rates with approximately 6 mm/yr of shortening. To the east, approaching<br />
the San Andreas fault, contraction rates slow to about 2 mm/yr Contraction rates across the Santa Barbara Channel appear to<br />
monotonically decrease westward from approximately 6 mm/yr at the longitude of Anacapa Island to 2 mm/yr at the<br />
longitude of San Miguel island. We estimate a regional strain rate tensor of approximately 100 nanostrains/yr oriented<br />
approximately north-south. Mismatches between the estimated regional strain and the strain estimated locally highlight areas<br />
of localized tectonic contraction.<br />
A PROGRESS REPORT ON THE ARRA-FUNDED GEOTECHNICAL SITE CHARACTERIZATION PROJECT<br />
(B-004)<br />
A. Martin, A. Yong, K. Stokoe, A. Di Matteo, S. Jack, and J. Diehl<br />
For the past 18 months, the 2009 American Recovery and Reinvestment Act (ARRA) has funded geotechnical site<br />
characterizations at 189 seismographic station sites in California and the central U.S. This ongoing effort applies methods<br />
involving surface-wave techniques, which include the horizontal-to-vertical spectral ratio (HVSR) technique and one or more<br />
of the following: spectral analysis of surface wave (SASW), active and passive multi-channel analysis of surface wave (MASW)<br />
and passive array microtremor techniques. From this multi-method approach, shear-wave velocity profiles (Vs) and the timeaveraged<br />
shear-wave velocity of the upper 30 meters (Vs30) are estimated for each site. To accommodate the variability in<br />
2011 <strong>SCEC</strong> <strong>Annual</strong> <strong>Meeting</strong> | 201
Poster Abstracts<br />
local conditions (e.g., rural and urban soil locales, as well as weathered and competent rock sites), conventional field<br />
procedures are often modified ad-hoc to fit the unanticipated complexity at each location. For the majority of sites (>80%),<br />
fundamental-mode Rayleigh wave dispersion-based techniques are deployed and where complex geology is encountered,<br />
multiple test locations are made. Due to the presence of high velocity layers, about five percent of the locations require multimode<br />
inversion of Rayleigh wave (MASW-based) data or 3-D array-based inversion of SASW dispersion data, in combination<br />
with shallow P-wave seismic refraction and/or HVSR results. Where a strong impedance contrast (i.e. soil over rock) exists at<br />
shallow depth (about 10% of sites), dominant higher modes limit the use of Rayleigh wave dispersion techniques. Here, use of<br />
the Love wave dispersion technique, along with seismic refraction and/or HVSR data, is required to model the presence of<br />
shallow bedrock. At a small percentage of the sites, surface wave techniques are found not suitable for stand-alone<br />
deployment and site characterization is limited to the use of the seismic refraction technique. A USGS Open File Report-describing<br />
the surface geology, Vs profile and the calculated Vs30 for each site--will be prepared after the completion of the<br />
project in November 2011.<br />
ASSESSING STRAIN ACCUMULATION RATES ACROSS THE PACIFIC-NORTH AMERICAN PLATE<br />
BOUNDARY NEAR SAN BERNARDINO, CALIFORNIA (A-053)<br />
R.F. Mason, E.P. Upton, A. Grijalva, K.L. Muhammad, A. Torrens-Bonano, S.F. McGill, E. Alaniz, J. Spinler, R.A. and<br />
Bennett<br />
The goal of this project was to achieve a more precise understanding of the strain accumulation rates of the various faults that<br />
make up the Pacific and North American plate boundaries in Southern California. We are particularly interested in the San<br />
Andreas Fault (SAF) and the San Jacinto Fault (SJF), which are likely sources of impending large earthquakes in Southern<br />
California. To do this, we used precise Global Positioning System (GPS) surveying equipment to measure site positions at 26<br />
pre-established benchmarks throughout the San Bernardino Mountains and surrounding area. Using a spreadsheet, we then<br />
conducted one-dimensional elastic modeling of our velocity data, along with site velocities from <strong>SCEC</strong>’s Crustal Motion<br />
Model 4 (CMM4), within a transect across the plate boundary passing through the San Bernardino Mountains. We tested<br />
about 3.2 million slip-rate combinations to find which ones produced a good fit to the measured site velocities. From the<br />
combinations that produced the best-fitting curves, we concluded that the SJF accounts for more movement (~12 mm/yr)<br />
along the plate boundary than does the SAF (~10 mm/yr). From combinations producing the reasonably well-fitting curves,<br />
our results show that the faults west of the SJF system could have slip-rates between 6-12 mm/yr, the SAF and SJF combined<br />
could have rates between 18-28 mm/yr (with most reasonable fits between 20-24mm/yr), and the ECSZ could have rates<br />
between 12-16 mm/yr.<br />
CHARACTERIZING THE RECENT BEHAVIOR AND EARTHQUAKE POTENTIAL OF THE BLIND<br />
WESTERN SAN CAYETANO AND VENTURA FAULT SYSTEMS (A-124)<br />
L.J. McAuliffe, J.F. Dolan, J. Hubbard, and J.H. Shaw<br />
We are studying the activity and paleoearthquake history of the blind Ventura and western San Cayetano faults through a<br />
multidisciplinary analysis of strata that have been folded above the fault tiplines. These two thrust faults form the middle<br />
section of a >200-km-long, east-west belt of large, interconnected reverse faults that extends across southern California.<br />
Although each of these faults represents a major seismic source in its own right, we are exploring the possibility of even<br />
larger-magnitude, multi-segment ruptures that may link these faults to other major faults in the Transverse Ranges system.<br />
The proximity of this large reverse-fault system to several major population centers emphasizes the importance of<br />
understanding the behavior of these faults for seismic hazard assessment.<br />
During the summer of 2010 we used a mini-vibrator source to acquire four, one- to three-km-long, high-resolution seismic<br />
reflection profiles. The profiles were collected along the locus of active folding above the blind, western San Cayetano and<br />
Ventura faults - specifically, across prominent fold scarps that have developed in response to recent slip on the underlying<br />
thrust ramps.<br />
Our initial efforts to document the earthquake history and slip-rate of this large, multi-fault reverse fault system focus on a site<br />
above the blind, western San Cayetano thrust ramp. At Briggs Road ~14 km east of Ventura, a high-resolution profile across<br />
the locus of recent folding reveals a well-defined north-dipping active synclinal axial surface in growth strata that extends to<br />
the surface at a prominent south-facing fold scarp lying at the topographic range front. During August 2011, we drilled 11<br />
hollow-stem boreholes and cone-penetrometer tests along the same alignment as the reflection profile, providing overlap<br />
between the data sets. Preliminary analysis of the borehole data reveals a fine-grained section dominated by thinly bedded<br />
202 | Southern California Earthquake Center
Poster Abstracts<br />
silts and sands. The absence of any well-developed soils within the upper 20 m, coupled with at least 15 m of structural<br />
growth within this section, suggests a rapid slip rate that we will quantify with radiocarbon dating of detrital charcoal and<br />
several buried <strong>org</strong>anic-rich A horizons. Collectively, we anticipate that these borehole and high-resolution seismic reflection<br />
data will allow us to reconstruct the paleoseismic history of the underlying blind thrust ramp.<br />
SLIP RATE OF THE NORTHERN SAN JACINTO FAULT FROM OFFSET LANDSLIDES IN THE SAN<br />
TIMOTEO BADLANDS (A-151)<br />
S.F. McGill, L.A. Owen, E.O. Kent, T.K. Rockwell, and N.W. Onderdonk<br />
A small restraining bend in the Claremont fault (northern San Jacinto fault zone) has produced basement uplift in the northern<br />
San Timoteo badlands. Bouldery debris has been shed from this basement uplift northeastward across the fault, through<br />
landslide and/or debris flow processes. These deposits, which we refer to as the Quincy Ridge debris fan, are now offset about<br />
1.0 to 1.6 km across the San Jacinto fault, although further mapping is needed to fully constrain this offset. Be-10 dates from 6<br />
boulders on the Quincy Ridge debris fan range from 16 to 68 ka. We regard the oldest date as closest to the true age of the<br />
landslide because the remaining boulders may have been more recently exhumed by surface deflation. This interpretation is<br />
confirmed by soil pits excavated next to the 68 ka boulder and next to one of the younger (26 ka) boulders. The 68 ka boulder<br />
may itself underestimate the age of the landslide. The soil pit next to this boulder revealed a silica-cemented horizon overprinted<br />
with clay-lined fractures below the main argillic horizon. The silica likely formed during a semi-arid climatic period<br />
(probably the last interglacial), and the translocated clay lining the fractures in the silica horizon likely formed during the last<br />
glacial period. This suggests that the debris fan may be as old as 100-125 ka. For a preliminary slip-rate estimate, we assume<br />
the 68 ka age is a minimum, which yields a maximum slip rate of 15-24 mm/yr. If the true age turns out to be ~ 100 ka, as the<br />
soils suggest, this rate would reduce to 10-16 mm/yr. Dates from three additional boulders, as well as OSL and Be-10 dates<br />
from a depth profile near the 68 ka boulder are pending<br />
A younger landslide, the Ebenezer Canyon slide, is sourced from older landslide or debris-flow deposits and has been offset<br />
270 100 m. Three boulders from the head scarp have Be-10 ages of 9 ka, 10 ka and 21 ka. The headscarp was suddenly exposed<br />
by the landslide event but may have continued unraveling over time. Thus, all three ages are likely to be minima, and we use<br />
21 ka as a minimum age for the Ebenezer Canyon slide. The Be-10 ages of six boulders from the slide deposit itself range from<br />
14 ka to 93 ka, with a cluster of three dates between 30-37 ka. We use the weighted average of these three dates (35.4 ka) as our<br />
preferred age of the Ebenezer Canyon slide. This yields a slip rate of about 10 mm/yr, with a 95% confidence interval of 5-18<br />
mm/yr.<br />
TRACKING COSMOGENIC 10BE IN MULTIPLE GRAINSIZES DOWN ALLUVIAL SYSTEMS IN ACTIVE<br />
OROGENS (A-140)<br />
K.E. McGuire and R.V. Heermance<br />
The concentration of cosmogenic 10Be in alluvial sediments can be used to interpret catchment-scale erosion rates. We have<br />
applied this method in two tectonically active catchments in the Transverse Ranges, Southern California: the upper Ventura<br />
River catchment and Millard Canyon within the Topatopa and San Bernardino Mountains, respectively. We use 10Be<br />
concentrations in multiple grain-sizes to determine the erosion rates, and understand geomorphic process and the<br />
implications of clast size variable 10Be concentrations by sampling spatially separated transects. Within the Ventura River<br />
drainage, spatially separated samples of both sand (0.25-0.50 mm) and pebbles (70-100 mm) were collected from the active<br />
channel and below Late Pleistocene and Holocene terrace surfaces. Results indicate average paleo-erosion rates for the<br />
Holocene to present from the sand size fraction are 180 ± 20 mm/ka, but rates determined from pebbles are 1010 ± 100 mm/ka,<br />
and Late Pleistocene pebble erosion rates are 530 ± 100 mm/ka. Pebbles imply at least a five times greater erosion rate than<br />
sand for the Holocene to present. Millard Canyon was sampled in the active channel in three locations over 4.7km near the<br />
catchment mouth over four grain sizes (0.25-0.500 mm, 1-2 mm, 11-22 mm, 100-250 mm). Clast size variable 10Be<br />
concentrations were not measured at or above the catchment mouth. Thus, the erosion rate using the average 10Be<br />
concentration from all grain sizes at the catchment mouth is 740 mm/ka. The 10Be concentration beyond the catchment mouth<br />
in the midfan 0.250-0.500mm sand fraction is enriched 1.4x the catchment mouth fraction; the midfan sand fraction is enriched<br />
1.4x the midfan pebble concentration. These data show how 10Be concentration varies as a function of grain-size in the midfan<br />
transect. Incorporation of older sediment can alter the measured 10Be inventory; a sediment mixing model was used to<br />
determine the percentage of sediment of a known age that must be present in the active channel to return the observed<br />
concentrations. Results considering adjacent surface sediment suggests between 18-44 ± 9% of sediment in active channel is<br />
sourced from surfaces. The most likely pathway is aeolian saltation of grains. Our data indicate that 10Be concentration, and<br />
2011 <strong>SCEC</strong> <strong>Annual</strong> <strong>Meeting</strong> | 203
Poster Abstracts<br />
thus erosion rates and exposure ages, vary with grain size and suggest sediment transport pathways and sources of sediment<br />
outside the catchment should be considered in any cosmogenic 10Be study.<br />
QUATERNARY CONGLOMERATE DEPOSITION AND IMPLICATIONS ON FAULT EVOLUTION IN THE<br />
OJAI AND UPPER OJAI VALLEYS, WESTERN TRANSVERSE RANGES, CA (A-128)<br />
H.L. McKay and R.V. Heermance<br />
Ojai and Upper Ojai Valleys are intermontane basins in the western Transverse Ranges filled with Quaternary conglomerate<br />
(Ojai Conglomerate) that records a rare record of fault slip, uplift of surrounding ranges, evolution of the drainage system,<br />
and landscape development since mid Quaternary time. Here we combine mapping and stratigraphy of exhumed strata in the<br />
hanging walls of the Arroyo Parida-Santa Ana and La Vista faults and in the footwall of the Devil’s Gulch/Lion fault with<br />
subsurface well data to document late-Quaternary provenance changes, depositional settings, and geometry of the basin fill.<br />
New measured sections, clast counts, paleocurrent measurements, and mapping suggest that an E-W paleodrainage system<br />
was present and sourced from the Topatopa Mountains to the north. Assymetrical depocenters 240 and 550 m deep in Ojai<br />
and Upper Ojai Valleys, respectively, are preserved beneath the valleys implying complex paleotopography was present<br />
during conglomerate deposition. At least 300 and 220 m of displacement must have occurred on the Lion and Santa Ana<br />
Faults, respectively, based on offset of the base of the conglomerate unit. Lion Creek flows through incised meanders in Lion<br />
Canyon that expose the basal contact of the basin fill and provide evidence for a much wider and flatter E-W paleovalley in<br />
the past between the Lion and Santa-Ana Faults. Age constraints on the conglomerate are limited. As evidenced by the cross<br />
cutting relationship between the deformed conglomerate and terrace surfaces, the fill must be older than the oldest terrace<br />
surface (~92,000 y.b.p). Although previously interpreted as correlative with mid-Quaternary Saugus Formation (200,000-<br />
800,000 y.b.p.), the local deposition, E-W directed paleocurrents, and buttress unconformity between the Quaternary<br />
conglomerate and Neogene basement suggests that the basin fill in Ojai and Upper Ojai valleys are a separate entity from the<br />
rest of the Ventura Basin stratigraphy. We therefore consider the onset of deposition of Ojai Conglomerate to be middle-late<br />
Pleistocene, prior to or contemporaneous with uplift of Sulphur Mountain. Further constraining the age of the Ojai<br />
Conglomerate, are overlying lacustrine deposits in Upper Ojai Valley with ages of >46,000 to
Poster Abstracts<br />
Pegasus WMS provides a means for representing the workflow of an application in an abstract form, agnostic of the resources<br />
available to run it and the location of data and executables. It then, compiles these workflows into executable workflows by<br />
querying catalogs and sending the computations to the different resources using the Condor DAGMan as a workflow executor.<br />
Pegasus WMS optimizes the execution as well as data movement by leveraging existing Grid and Cloud technologies via a<br />
flexible pluggable interface. Pegasus also provides advanced features such as reusing existing data, automatic cleanup of<br />
generated data, job clustering.<br />
The latest Pegasus 3.1.0 version has several new features like the recursive hierarchal workflows with deferred planning,<br />
allowing a task in a workflow to be another workflow that is planned right at the point of execution thus allowing Pegasus to<br />
use updated information from resources. Another new feature is the ability to add notifications for an entire workflow or for<br />
each individual task, which can report back on task or workflow, start, end, error success etc. via flexible notification scripts.<br />
Major improvements have also been made in the monitoring capability of Pegasus, helping scientists to accurately monitor,<br />
analyze, debug and measure performance of their workflows.<br />
Pegasus currently supports production workflows in other large-scale experiments from the astrophysics domain like LIGO,<br />
ATLAS of Periodograms as well as the bioinformatics domain like Brain Span and the Cancer Atlas. Pegasus has also enabled<br />
smaller projects from diverse domains like astronomy, chemistry, biology, ocean modeling and others.<br />
GPS MONITORING OF THE INLAND EMPIRE FOR SLIP-RATE MODELING OF SOUTHERN CALIFORNIA<br />
FAULTS: CONTRIBUTIONS FROM HIGH SCHOOL SCIENCE TEACHERS AND THEIR STUDENTS (A-027)<br />
M. Meijer, M. Affadonis, R. Bennett, W. Butscher, E. Carlson, R. de Groot, S. Harris, S. McGill, S. Pearson, A. Pennington, T.<br />
Pitruzzello, D. Shafer, J. Spinler, and S. Wallace<br />
A week-long GPS campaign coordinated by California State University, San Bernardino and funded by NSF’s EarthScope<br />
program, was conducted from July 13-19, 2011. The 44 researchers included 6 <strong>SCEC</strong> interns, 7 other undergraduate students, 9<br />
local high school Earth science and physics teachers and 22 high school students. Campaign GPS data were collected from 26<br />
sites in the San Bernardino Mountains, Inland Empire and high desert. These data will be processed by the University of<br />
Arizona group using GAMIT/GLOBK. Following the GPS data collection campaign, participants analyzed results from the<br />
2010 campaign, constructing time-series plots of the north, east, and vertical position for each site. Each site was determined to<br />
be moving at horizontal rates ranging from 20.0-33.0 mm/year (relative to stable North America) in a horizontal direction<br />
ranging from N21.3W to N46.4W. Velocities consistently increased for sites located farther southwest, consistent with elastic<br />
strain accumulation between the Pacific and North American plates. Slip rates for the San Andreas and 10 surrounding faults<br />
were modeled using a two-dimensional elastic model, with locking depths set to 15 km. In one afternoon of ad-hoc testing, the<br />
best-fitting curves found by the group had a slip-rate range of 6-10 mm/year for the San Andreas Fault and 8-12 mm/year for<br />
the San Jacinto Fault. However, a wide range of possible slip rates for the San Andreas Fault (0-17.5 mm/yr) was found that fit<br />
the GPS velocities relatively well. More systematic testing of slip rates was conducted by the <strong>SCEC</strong> interns over the remainder<br />
of the summer, and their results are shown in a separate poster. The high school teachers will continue their involvement by<br />
collaboratively developing and testing related Earth science or physics lessons during Fall 2011.<br />
GPS AND ACCELEROMETER COMBINATION FOR REAL-TIME SOURCE MODELING AND EARTHQUAKE<br />
EARLY WARNING (B-026)<br />
D. Melgar, B.W. Crowell, and Y. Bock<br />
Real-time GPS networks provide the perfect complement to seismic networks, which operate with lower noise and higher<br />
sampling rates than GPS networks, but only measure accelerations or velocities, putting them at a disadvantage for<br />
ascertaining the full extent of slip during a large earthquake in real-time. Real-time GPS networks also have the advantage of<br />
capturing motions throughout the entire earthquake cycle (interseismic, seismic, coseismic, postseismic). Here we report on<br />
three examples of rapid modeling of recent large earthquakes near large regional real-time GPS networks and combined<br />
GPS/seismic networks. The first utilizes 416 stations in Japan’s GEONET during the 2003 Mw 8.3 Tokachi-Oki earthquake<br />
about 100 km offshore Hokkaido Island, the second investigates the 2010 Mw 7.2 El Mayor-Cucapah earthquake recorded by<br />
95 stations in the California Real Time Network and the final one examines the 2011 Mw 9.0 Tohoku-Oki earthquake recorded<br />
by over 800 stations in GEONET. We first employ a simulated real-time centroid moment tensor (CMT) determination<br />
algorithm showing that a solution can be obtained within 2-3 minutes of origin time. We also present two inverse approaches<br />
and one forward approach to ascertain the extent of fault-slip in a simulated real-time environment. The first inverse approach<br />
uses predefined fault planes from a catalogue of generalized faults while the second one computes fault planes from the CMT<br />
2011 <strong>SCEC</strong> <strong>Annual</strong> <strong>Meeting</strong> | 205
Poster Abstracts<br />
inversion that operates once per second. The forward approach runs a grid search over a suite of possible 2-D Gaussian slip<br />
distributions. In all three approaches we are able to roughly characterize all three earthquakes using about a 2-3 minutes of<br />
data, greatly enhancing the time to obtain fault slip and moment release during medium-to-large earthquakes by almost an<br />
order of magnitude. We investigate gains made through combined analysis of GPS and seismic instruments (accelerometers)<br />
within rapid modeling versus GPS-only modeling with respect to the aforementioned methodologies as well as peak ground<br />
displacement scaling relationships.<br />
DETECTING MISSING EARTHQUAKES ON THE PARKFIELD SECTION OF THE SAN ANDREAS FAULT<br />
FOLLOWING THE 2003 MW6.5 SAN SIMEON EARTHQUAKE (B-069)<br />
X. Meng, Z. Peng, and J.L. Hardebeck<br />
Large shallow earthquakes are typically followed by increased seismic activity, known as “aftershocks”. However, whether<br />
aftershocks are triggered by static or dynamic stress changes is still in debate. Previous studies on aftershock triggering mostly<br />
utilize earthquakes listed in earthquake catalogs, which could be incomplete immediately after moderate to large earthquakes.<br />
In this study, we apply the recently developed matched filter technique to detect missing microearthquakes along the<br />
Parkfield section of the San Andreas Fault (SAF) around the occurrence time of the 2003 Mw6.5 San Simeon earthquake.<br />
Previous studies have found the San Simeon mainshock induced ~10 kPa positive Coulomb stress changes on the SAF, which<br />
is inconsistent with the observation of a decrease in seismicity rate around Parkfield immediately after the mainshock<br />
according to Northern California Seismic Network (NCSN) catalog. Here we use waveforms of ~3000 earthquakes recorded<br />
by 12 High Resolution Seismic Network (NRSN) stations around Parkfield as templates, and scan through the continuous data<br />
48 hours before and 30 hours after the San Simeon mainshock. We band-pass filtered waveforms of 10-25 Hz to depress the<br />
effects of large aftershocks from the San Simeon rupture. A total of 158 events are detected, of which only 8 are listed in the<br />
NCSN catalog. The seismicity rate from the newly detected events shows a clear increase around Parkfield immediately after<br />
the San Simeon mainshock. In comparison, swarm-like activity at south of Gold Hill started about 2 days before and turned off<br />
immediately ~6 hours before the mainshock, which resulted in a decrease of seismicity rate. No detections are found further<br />
north in the creeping section of the SAF either before or after the mainshock, despite the fact that there are many templates in<br />
this region. Our observations suggest that the SAF near Parkfield was positively loaded by the San Simeon mainshock. This is<br />
consistent with the Coulomb stress calculation and triggered right-lateral creep observed by the USGS creepmeters, although<br />
we cannot rule out the possibility of dynamic triggering at this stage.<br />
DIFFERENTIATING STATIC AND DYNAMIC TRIGGERING NEAR SALTON SEA FOLLOWING THE 2010<br />
MW7.2 EL MAYOR-CUCAPAH EARTHQUAKE (B-070)<br />
X. Meng, Z. Peng, and P. Zhao<br />
Whether static or dynamic triggering is the dominant triggering mechanism in near field is currently under heated debate.<br />
Previous studies on earthquake triggering mostly examined seismicity rate changes around the occurrence time of large<br />
earthquakes based on existing earthquake catalogs. However, such catalogs could be incomplete immediately after the<br />
mainshock, which may cause apparent seismicity rate changes that are unrelated to stress changes. In this study, we focus on<br />
Salton Sea geothermal region following the 2010 Mw7.2 El Mayor-Cucapah earthquake, mainly because of its abundant<br />
background seismicity, dense network coverage and being in the stress shadow of the mainshock, which is the key factor to<br />
differentiate static and dynamic triggering. According to the Southern California Seismic Network (SCSN) catalog, the<br />
seismicity rate near Salton Sea increased immediately after the mainshock. It dropped below the pre-mainshock level within a<br />
few days and remained low for another few months. To check whether such patterns are caused by catalog incompleteness,<br />
we are currently applying a waveform-based matched filter technique to detect possible missing events around Salton Sea.<br />
With more completed catalog, we can identify the genuine seismicity rate changes for better comparison with the stress<br />
changes. Static and dynamic stress changes could also affect seismic velocity in the upper crust in the way similar to seismicity<br />
rate. Thus, monitoring seismic velocity can further help differentiate the triggering mechanisms. In our preliminary study, we<br />
apply the ambient noise cross-correlation technique to monitor the seismic velocity near Salton Sea 10 days before and after<br />
the mainshock. We find that immediately after the mainshock, seismic velocity reduced up to 0.4% and followed by a fast<br />
recovery in the next three days. From 5 to 10 days after the mainshock, the velocity changes remained ~0.2% lower than the<br />
pre-shock level. Such co-seismic decrease was most likely caused by the widespread damages induced by strong ground<br />
motion, suggesting that dynamic stress changes were dominant in the short term. We are currently applying the same<br />
technique at later times to check whether the velocity change returns back to the pre-mainshock or not.<br />
206 | Southern California Earthquake Center
Poster Abstracts<br />
THE 2011 MW 9 TOHOKU-OKI EARTHQUAKE: COMPLEXITY OF DYNAMIC RUPTURE AT THE BOTTOM<br />
OF A SEISMOGENIC ZONE (B-075)<br />
L. Meng, J.P. Ampuero, and A. Inbal<br />
The 2011 Mw 9 Tohoku-Oki earthquake, recorded by over 1000 near-field stations and multiple large-aperture arrays, is by far<br />
the best recorded earthquake in the history of seismology and provides unique opportunities to address fundamental issues in<br />
earthquake source dynamics. We achieved high resolution source imaging of the high frequency (1 Hz) aspects of the rupture<br />
process by back-projecting teleseismic P waves recorded by the USarray and the European seismic network. The mutually<br />
consistent results from both arrays reveal rupture complexity with unprecedented resolution, involving phases of diverse<br />
rupture speed and intermittent high frequency bursts within slow speed phases. The high frequency radiation is generated<br />
mainly at the down-dip edge of the principal slip regions constrained by geodesy. Moreover, its location coincides with the<br />
down-dip limit of interplate seismicity and encompasses regions where the background seismicity contains repeating<br />
earthquakes. The high frequency sources initially propagated down-dip, with a slow initiation phase followed by sustained<br />
propagation at speeds of 3 km/s. The rupture then slowed down to less than 1 km/s for 60 seconds. A rich sequence of bursts<br />
was generated along the down-dip rim of this slow rupture front. Before the end of the slow phase an extremely fast rupture<br />
front detached towards the North, with apparent speed of about 5 km/s . Finally a rupture front propagated towards the<br />
South running at about 2.5 km/s for over 100 km. Key features of the rupture process are confirmed by the strong motion data<br />
recorded by K-net and KIK-net. The energetic high frequency radiation episodes within a slow rupture phase suggests a<br />
patchy image of the brittle-ductile transition zone, composed of discrete brittle (velocity-weakening) asperities within a ductile<br />
(velocity-strengthening) fault zone matrix.<br />
PARALLEL SIMULATED ANNEALING APPROACH TO SOLVE FOR UCERF3 RUPTURE RATES (B-111)<br />
K.R. Milner, M.T. Page, and E.H. Field<br />
We present a parallel approach to the classic simulated annealing algorithm (Kirkpatrick 1983) in order to solve for the rates of<br />
earthquake ruptures in California’s complex fault system, being developed for the 3rd Uniform California Earthquake<br />
Rupture Forecast (UCERF3). Through the use of distributed computing, we have achieved substantial speedup when<br />
compared to serial simulated annealing. We will describe the parallel simulated annealing algorithm in detail, as well as the<br />
parallelization parameters used and their effect on speedup (time to convergence, or alternatively a specified energy level) and<br />
communications efficiency. Additionally we will discuss the correlation between performance of the parallel algorithm and<br />
the degree of constraints on the solution. We will present scaling results to hundreds of processors, and experiences with the<br />
MPJ Express Java Message Passing Library (Baker 2006) on the University of Southern California’s High Performance<br />
Computing and Communications cluster.<br />
References:<br />
Mark Baker, Bryan Carpenter, and Aamir Shafi. MPJ Express: Towards Thread Safe Java HPC, Submitted to the IEEE<br />
International Conference on Cluster Computing (Cluster 2006), Barcelona, Spain, 25-28 September, 2006.<br />
S. Kirkpatrick, C. D. Gelatt, Jr., and M. P. Vecchi. Optimization by Simulated Annealing. Science 13 May 1983: 220 (4598), 671-<br />
680. [DOI:10.1126/science.220.4598.671]<br />
FRACTURE NETWORK CHARACTERISTICS, SEALING, AND VELOCITY STRUCTURE OF AN EXHUMED<br />
SEISMIC FAULT ZONE; THE GOLE LARGHE FAULT ZONE, ITALIAN ALPS (A-020)<br />
T.M. Mitchell, S.A. Smith, A. Bistacchi, M. Rempe, and G. Di Toro<br />
The Gole Larghe Fault Zone (GLFZ) in the Italian Southern Alps has been extensively studied as a natural laboratory for<br />
seismic faulting. Cataclasites and pseudotachylytes formed along pre-existing magmatic cooling joints over a fault zone width<br />
of ~500m, at ambient conditions of 9-11km depth and 250-300°C. We synthesize field measurements and laboratory data<br />
collected in the past three years that concern the architecture, sealing history, and seismic velocity and permeability structure<br />
of the GLFZ.<br />
The GLFZ contains three structural zones: 1) a southern damage zone ~250m wide; 2) a central zone ~100m wide bordered by<br />
the two thickest cataclastic faults (~1m) identified to date, and; 3) a northern damage zone >150m thick. In the southern<br />
damage zone, macroscopic fracture density (faults + joints) increases gradually from background wall-rock values towards the<br />
central zone where it remains relatively high throughout. Despite a similar overall fracture density, the boundary between the<br />
wall rocks and the southern damage zone defined by an abrupt transition from joints to cataclasite- and pseudotachylyte-<br />
2011 <strong>SCEC</strong> <strong>Annual</strong> <strong>Meeting</strong> | 207
Poster Abstracts<br />
bearing faults as the dominant fracture type. Fracture density drops off sharply within the northern damage zone, resulting in<br />
a highly asymmetric damage structure on a km-scale. Although fracture density is higher in the central zone, syn-tectonic<br />
sealing of both micro- and macro-fractures by epidote, K-feldspar, and chlorite minerals was pervasive, resulting in low<br />
permeabilities (~10-21m2). Fracture density is lower in the damage zones, and partial healing results in higher sample<br />
permeabilities (~10-18m2). Laboratory P-wave velocities correlate well with both the architecture and sealing characteristics of<br />
the fault zone. P-wave velocities are uniformly high (up to 6km/s) both within and immediately surrounding the central zone,<br />
consistent with pervasive sealing of fractures and low sample permeability. In the damage zones P-wave velocities are much<br />
lower (3-4km/s) due to the presence of open fractures. Such relationships highlight the close interplay between fracturing,<br />
fluid flow, mineralization, and the strength of large fault zones. Importantly, they demonstrate that seismic wave velocities<br />
and permeability depend on both fracture density and the degree of fracture sealing, which has implications for the<br />
interpretation of active fault zone structure based on geophysical data.<br />
TEMPERATURE DEPENDENCE OF FRICTIONAL HEALING: EXPERIMENTAL OBSERVATIONS AND<br />
NUMERICAL SIMULATIONS (A-090)<br />
E.K. Mitchell, Y. Fialko, and K.M. Brown<br />
We performed a series of slide-hold-slide experiments on Westerly granite using a direct shear apparatus at ambient<br />
temperatures between 20-550 ºC. We measured changes in static coefficient of friction after a period of time over which the<br />
sample was held in nominally stationary contact. Friction increases in proportion to the logarithm of hold time at a rate of<br />
about .02 per decade, similar to findings of previous studies conducted at room temperature. Friction also linearly increases<br />
with temperature at about .02 per 140 ºC. We found that temperature has little effect on the rate of change in static friction<br />
with hold time. We interpret these results using a numerical model that incorporates viscoelastoplastic rheology and a fractal<br />
geometry of contact surfaces. We explore to what extent the observed time and temperature dependence of static friction can<br />
be explained in terms of increases in the true contact area due to creep at highly stressed microasperities. We performed finite<br />
element simulations of a contact consisting of a fractional Brownian surface pressed against a rigid flat surface. Changes in<br />
contact area between the surfaces with respect to an initial contact area are compared to changes in static friction coefficient<br />
with respect to its initial (reference) value. We find that the power-law rheology with stress exponent n = 3 (e.g., expected of<br />
dislocation creep) does not fit the experimental data. It fails to generate an increase in the contact area over short (< 1000 s)<br />
timescales; once the highly stressed contacts begin to relax, they do so too quickly. For the power-law rheology to provide a<br />
reasonable fit to the data, the stress exponent needs to be increased to n = 45. In this case, significant (up to 500 degrees)<br />
changes in contact temperature have little effect on the rate of increase in contact area.<br />
REMOTE MAPPING OF A LARGE STEPOVER IN THE 4 APRIL 2010 EL MAYOR CUCAPAH EQ (A-117)<br />
A.E. Morelan and M.E. Oskin<br />
The 4 April 2010 MW 7.2 El Mayor Cucapah earthquake has been valuable to study because of its rich rupture exposure and<br />
preservation. This dextral-oblique normal event ruptured on the NW-striking Pescadores, Borrego, Paso Inferior and Paso<br />
Superior faults in the Sierra El Mayor and Sierra Cucapah mountain ranges, part of the active Pacific-North America plate<br />
boundary between the northern tip of the Gulf of California and US- Mexico border. In total, the rupture consists of six major<br />
faults, ~120 km in total length. Initial field work mapped the rupture across an 11 km left stepover in rugged terrain between<br />
the Pescadores and Borrego faults. If accurate, this rupture would violate many accepted theories concerning the mechanics of<br />
how ruptures terminate through stepovers; 11km is thought too great a distance for rupture to jump in a single event.<br />
Although most models for stepovers use pure strike- slip motion on faults, this fault ruptured in a dextral- oblique normal<br />
fashion with the ratio between normal and dextral motion between ~2- 3:1. This rupture characteristic may explain the<br />
somewhat odd nature of this large stepover. Our remote mapping using high-resolution airborne LiDAR topographic data,<br />
collected soon after the event, has yielded 2010 rupture on previously unidentified faults within the stepover. The distance<br />
between rupture in the stepover, based on this new mapping, is 4km significantly less than the previously mapped 11km.<br />
Abundant bedrock scarps were also remotely mapped in this rugged accommodation zone and are interpreted as rupture on<br />
faults that pre-date the 2010 earthquake. These features turn out to be quite important because they beg the question of<br />
whether or not this event was typical of this fault system. An 1892 event on the Laguna Salada fault ruptured along the<br />
western range front of the Sierra Cucapah in a west- down motion, in an opposite sense of the 2010 event. Observation of and<br />
comparison with such previous ruptures in the same region can increase our knowledge about the evolution of rupture style<br />
along this fault system. Our remote mapping documents patterns of distributed faulting and displacement that allows us to<br />
better understand strain accommodation and fault continuity during large oblique earthquakes. The airborne LiDAR dataset<br />
208 | Southern California Earthquake Center
Poster Abstracts<br />
has proved to be an invaluable tool in this investigation of an unusually large stepover and will continue to yield interesting<br />
scientific results about the event.<br />
FAULT ZONE ARCHITECTURE, SAN JACINTO FAULT ZONE, SOUTHERN CALIFORNIA: EVIDENCE FOR<br />
FOCUSED FLUID FLOW AND HEAT TRANSFER IN THE SHALLOW CRUST (A-147)<br />
N.M. Morton, G.H. Girty, and T.K. Rockwell<br />
We report results of a new study of the San Jacinto fault zone architecture in Horse Canyon, SW of Anza, California, where<br />
stream incision has exposed a near-continuous outcrop of the fault zone at ~0.4 km depth. The fault zone at this location<br />
consists of a fault core, transition zone, damage zone, and lithologically similar wall rocks. We collected and analyzed samples<br />
for their bulk and grain density, geochemical data, clay mineralogy, and textural and modal mineralogy. Progressive<br />
deformation within the fault zone is characterized by mode I cracking, subsequent shearing of already fractured rock, and<br />
cataclastic flow. Grain comminution advances towards the strongly indurated cataclasite fault core. Damage progression<br />
towards the core is accompanied by a decrease in bulk and grain density, and an increase in porosity and dilational volumetric<br />
strain. Palygorskite and mixed-layer illite/smectite clay minerals are present in the damage and transition zones and are the<br />
result of hydrolysis reactions. The estimated percentage of illite in illite/smectite increases towards the fault core where the<br />
illite/smectite to illite conversion is complete, suggesting elevated temperatures that may have reached 150°C. Chemical<br />
alteration and elemental mass changes are observed throughout the fault zone and are most pronounced in the fault core. We<br />
conclude that the observed chemical and mineralogical changes can only be produced by the interaction of fractured wall<br />
rocks and chemically active fluids that are mobilized through the fault zone by thermo-pressurization during and after seismic<br />
events. Based on the high element mobility and absence of illite/smectite in the fault core, we expect that greatest water/rock<br />
ratios occur within the fault core. These results indicate that hot pore fluids circulate upwards through the fractured fault core<br />
and into the surrounding damage zone. Though difficult to constrain, the site studied during this investigation may represent<br />
the top of a narrow, ephemeral hydrothermal circulation cell that dissipates heat generated from rupture events at deeper<br />
levels (> 4 km).<br />
GENERATING BROADBAND SEISMOGRAMS FOR A SUITE OF SAN ANDREAS EARTHQUAKES (B-012)<br />
R. Mourhatch and S. Krishnan<br />
We examine a method for generating broadband ground motions for a suite of San Andreas earthquakes (6.0-8.0 Mw) using a<br />
hybrid of empirical & deterministic methods of ground motion simulations. We use finite source models from past<br />
earthquakes resampled to a 0.5km x 0.5km grid to generate the earthquakes. The low frequency content (
Poster Abstracts<br />
RUPTURE PATTERN OF THE 1892 LAGUNA SALADA EARTHQUAKE: A PRECURSOR TO 2010 EL MAYOR-<br />
CUCAPAH (A-122)<br />
K. Mueller, T. Rockwell, O. Teran, J. Fletcher, S. Akciz, and P. Patton<br />
As part of the <strong>SCEC</strong> response effort and analysis of surface deformation produced by the 2010 El Mayor-Cucapah earthquake,<br />
we measured fault displacement and larger-scale rupture patterns from the 1892 Mw 7.2 Laguna Salada precursor earthquake.<br />
Our goal was to understand the interaction between rupture segmentation in 1892 and 2010 and its implications for<br />
connectivity between the two fault zones. Comparison between the 1892 and 2010 ruptures suggests that both earthquakes<br />
activated distinct fault segments separated by 1-3 km gaps except for the much larger Puerta accommodation zone in 2010.<br />
Interestingly, the 9 km-wide Puerta gap ruptured previously in 1892 as part of a longer segment on the Laguna Salada fault. In<br />
contrast, this pattern is not apparent where another transfer zone further north at Paso Superior behaved similarly in both<br />
1891 and 2010. The greatest difference between the 1892 and 2010 ruptures is the sense of slip at the rupture endpoints. While<br />
both 1892 and 2010 fed oblique slip into pure dextral offset towards their respective northern and southern endpoints, the<br />
Laguna Salada fault terminated abruptly at the rapidly slipping Canon Rojo normal fault. The proportion of dextral to normal<br />
slip, or slip budget along 1892 rupture segments is not necessarily consistent with fault strike except across the right angle<br />
bend at Canon Rojo. We postulate the difference is due to strain release at longer timescales than is apparent from just the 2010<br />
and 1892 events.<br />
SLIP DEFICITS, RELEASE AND TRANSIENTS ALONG THE CENTRAL SAF FROM REPEATING<br />
MICROEARTHQUAKES (A-102)<br />
R.M. Nadeau, R.C. Turner, and R. Burgmann<br />
To better understand interactions between seismic and aseismic deformation at seismogenic depths, deep aseismic fault slip<br />
rates (Vd) from characteristically repeating microearthquake seqeunces (CSs) along the central San Andreas Fault (SAF) are<br />
compiled and analyzed. Using repeating CS data, spatial and temporal variations in Vd can be resolved over large contiguous<br />
regions, in diverse tectonic settings, and back in time to well before the advent of satalite based geodesy (e.g., GPS, InSAR).<br />
Previous studies have also revealed systematics in Vd indicative of slip transients associated with post-seismic deformation,<br />
slow-slip events, quasi-periodic slip pulsing, and regions of slip-deficit accumulation. We present results of Vd from 343 CSs<br />
(~3000 repeated microearthquakes) along a 200 km stretch of the SAF in central California occurring over a 27+ year period<br />
between 1984 and mid-2011. The spatio-temporal mapping of CS inferred Vd covers the section of the SAF between the the<br />
1989 M6.9 Loma Prieta (LP) earthquake and the inferred northern terminus of the 1857 M7.8 Ft. Tejon (FT) earthquake. This<br />
mapping includes pre- and post- seismic periods of the LP and 2004 M6.0 Parkfield earthquakes. In the study zone we find<br />
large (several 100%), broadly distriubted (several 10s of kms), and systematic variations in Vd associated with the occurrence<br />
of moderate to large earthquakes (i.e., low preseismic rates and large postseismic transients) and in the SAF creeping section<br />
(e.g., quasi-periodic slow-slips) where moderate to large events did not occur. We also show that the a slip deficit that had<br />
accumulated in the Parkfield area was fully released northwest of Parkfield in the 2004 M6 mainshock, but was only partially<br />
released to the southeast adjacent to the locked Cholame segment of the SAF.<br />
SITE RESPONSE IN THE BÍOBÍO REGION, CHILE USING THE Κ METHOD (B-052)<br />
C. Neighbors, E.J. Liao, E.S. Cochran, A.I. Chung, J.F. Lawrence, A. Belmonte, M. Miller, H.H. Sepulveda, and C.<br />
Christensen<br />
We assess local site response in the Bíobío region of Chile utilizing seismograms recorded by the Quake-Catcher Network<br />
(QCN) micro-electro-mechanical system (MEMS) accelerometers during the aftershock sequence that followed the February 27,<br />
2010 Mw 8.8 Maule earthquake. The earthquakes were captured by over 70 QCN low-resolution (10, 12, and 14-bit)<br />
seismometers from March 1 to June 1, 2010. Site effects are caused by the local amplification of seismic energy due to<br />
subsurface structures and geologic materials, which often result in spatially variable patterns of surface damage following an<br />
earthquake.<br />
In this study we estimate kappa, κ, which models the decay of the acceleration spectra to characterize strong ground motion at<br />
high frequencies (> 1 Hz). We calculated the Fourier spectra and κ for each station following the method of Douglas et al.<br />
(2010). During the aftershock deployment, the QCN network recorded over 229 earthquakes of magnitude 4.5 and greater. Of<br />
these recordings, we determine that 57 earthquakes (25%) have sufficient signal-to-noise quality for use in site response<br />
analysis, as determined by visual inspection. Preliminary results indicate κ values between 0.03 and 0.06 s. These values<br />
suggest that the Bíobío region of Chile is sharply attenuating and likely consists of less competent rock, as expected.<br />
210 | Southern California Earthquake Center
Poster Abstracts<br />
Preliminary results also suggest that kappa has a positive correlation with source-station distance as high frequency waves<br />
become more attenuated with distance from source.<br />
Further comparison of κ values between stations will highlight the influence of local geology on observed seismic records at<br />
individual sites in the Bíobío region. As a result of the site response analysis, we highlight areas of the Bíobío region that may<br />
be more susceptible to greater ground shaking following future large earthquakes.<br />
VISUAL COMMUNICATION DESIGN FOR SHAKEOUT RESEARCH DISSEMINATION (A-008)<br />
A. Nguyen<br />
Preventing earthquakes from becoming disasters requires behavior change on the part of everyone at risk. This project seeks<br />
to apply professional design to research dissemination and to information, education and communication (IEC) outreach<br />
materials.<br />
Risk RED, in cooperation with Earthquake Country Alliance, Western Washington University, and California State University,<br />
Fullerton has developed a participant survey used in connection with annual community-wide ShakeOut drills worldwide.<br />
This project focuses on communicating the results of these surveys by making the research findings understandable and<br />
interesting, based on enhancing their visual appeal.<br />
Deliverables are:<br />
• Design of a full range of re-usable icons to highlight both research results and risk reduction concepts<br />
• Development of Excel/Microsoft Word templates for a dozen infographics to convey research results in bar and<br />
pie chart formats.<br />
• Design for a re-usable Microsoft Word template for an annual research report.<br />
Icons, infographics, charts, and templates were created with the intent of better visualization, maintaining a balance between<br />
simple details and successful communicative imagery. The effort to support information with clear and appealing graphics is<br />
expected to enhance research utilization as well as reinforcing disaster risk reduction education messages.<br />
CFM V.4.0: CONTINUED UPGRADES AND IMPROVEMENTS TO THE <strong>SCEC</strong> COMMUNITY FAULT MODEL<br />
AND ITS ASSOCIATED FAULT DATABASE (B-131)<br />
C. Nicholson, A. Plesch, and J.H. Shaw<br />
We are completing a major upgrade to the <strong>SCEC</strong> Community Fault Model (CFM v.4.0) which incorporates improvements in<br />
3D fault representations, a detailed fault surface trace layer, and a new naming and numbering scheme for individual 3D fault<br />
models that allows for closer links to the USGS/CGS Quaternary Fault database (Qfaults) and other <strong>SCEC</strong> data sets. Fault<br />
representations in CFM are now referenced to the modern WG84 datum and the new surface layer in CFM allows 3D fault<br />
models to be registered to the more detailed, mapped Qfaults and other digital fault maps. A systematic revision of CFM 3D<br />
fault segments was triggered by unexpected discrepancies between some previous CFM fault representations and the newer<br />
Qfaults surface traces, as well as by the availability of extensive catalogs of relocated earthquake hypocenters to better define<br />
the subsurface geometry of active faults. New 3D fault representations for major fault zones, including the San Andreas from<br />
San G<strong>org</strong>onio Pass to the Salton Sea, the subparallel Mecca Hills, the San Jacinto, the Elsinore-Laguna Salada (including El<br />
Mayor-Cucapah), and the San Fernando/Sierra Madre fault systems are being added that allow for more non-planar, multistranded<br />
3D fault geometry. These new revised 3D fault models and interpretations help characterize a more complex pattern<br />
of fault interactions at depth between various fault sets and linked fault systems. In addition, a new <strong>SCEC</strong> fault database<br />
hierarchical naming and numbering scheme is implemented that provides unique identifiers (number, name, abbreviation) for<br />
each level of the fault hierarchy under which a particular fault segment is classified. Levels of fault hierarchy include Fault<br />
Area, Fault Zone or System, Fault Section, Fault Name, Fault Strand or Model, and Fault Component, which can be easily<br />
shortened to Fault System identifier and Fault Name (e.g., SJFZ-Clark fault). These additional fault hierarchical levels allow<br />
for more flexible database searches and easier identification of fault components, alternative representations, and possible<br />
system-level associations of individual 3D fault elements that comprise CFM. This hierarchical scheme also allows for<br />
grouping related individual faults under a higher level fault system (e.g., Southern Frontal Fault System for the Raymond,<br />
Hollywood, Santa Monica, and Malibu Coast faults) to help facilitate identification of potentially larger earthquake ruptures<br />
between such kinematically linked fault segments.<br />
2011 <strong>SCEC</strong> <strong>Annual</strong> <strong>Meeting</strong> | 211
Poster Abstracts<br />
SPATIAL VARIABILITY OF GROUND MOTION AMPLIFICATION FROM LOW-VELOCITY SEDIMENTS<br />
INCLUDING FRACTAL INHOMOGENEITIES WITH SPECIAL REFERENCE TO THE SOUTHERN<br />
CALIFORNIA BASINS (B-017)<br />
K.B. Olsen and B.H. Jacobsen<br />
Many state-of-the-art area-specific velocity models (e.g., the Southern California Earthquake Center (<strong>SCEC</strong>) Community<br />
Velocity Model (CVM) V.4.0) include a wealth of geophysical data, such as tomographc results, and gravity, reflection and<br />
well-log data. However, these CVMs usually poorly resolve near-surface small-scale amplification effects. Toward<br />
characterizing the variability of shallow sediment amplification, we have investigated the effects of inhomogeneities with<br />
fractal distributions augmented onto the shallow seismic velocity structure derived from the <strong>SCEC</strong> CVM V.4.0. Our analysis<br />
used linear 0-2 Hz 3D visco-elastic finite-difference wave propagation with grid spacings of 25 m or less. We find that even<br />
simple and rather weak fractal stochastic inhomogenities imply significant variations in ground motion amplifications (up to a<br />
factor of four), including bands of strong amplification aligned along the average ray path from a horizontally-propagating<br />
SH-wave source. We show that these patterns depend strongly on the incidence angle of the main wavefront. For verticallyincident<br />
planar SH-wave sources we find that the largest contribution to the site effects from small-scale heterogeneities arise<br />
from those included in the upper ~100 m of the sediment column. Finally, it is important to tune the statistical model<br />
(scattering Q) with anelastic attenuation (intrinsic Q), where a tradeoff appears to persist.<br />
COMPARISON OF USGS PAGER EMPIRICAL FATALITY RATES TO RECONNAISSANCE OBSERVATIONS<br />
AND AN ACCOUNTING OF UNCERTAINTIES IN THE FATALITY MODEL (B-079)<br />
A.H. Olsen, E. So, M. Hearne, K. Jaiswal, and D.J. Wald<br />
The U.S. Geological Survey's Prompt Assessment of Global Earthquakes for Response (PAGER) system estimates fatalities and<br />
economic losses typically within thirty minutes of a significant earthquake. Emergency responders, governmental and aid<br />
agencies, and the media are the primary users of this information. The operational PAGER fatality model combines: estimates<br />
of shaking intensities (in the form of a ShakeMap); estimates of the populations exposed to the shaking (from LandScan); and<br />
fatality rates as a function of intensity, specific to a country or set of countries. The fatality-rate model is empirical, developed<br />
from observations of total fatalities in past events of the last several decades. The first part of this study compares the existing<br />
fatality-rate model to additional data on observed fatalities from municipality- and district-level reconnaissance surveys. This<br />
comparison is not straightforward because the intensity value associated with a fatality is not always known or known with<br />
certainty. The second part of this study identifies the sources of uncertainty in the empirical fatality model, and it proposes a<br />
method to combine the sources of uncertainty for a prediction of fatalities. Since this work is in progress, we present here only<br />
our methodology and some preliminary results.<br />
TIMING OF LARGE EARTHQUAKES BETWEEN 400 AD TO PRESENT ALONG THE CLAREMONT FAULT,<br />
NORTHERN SAN JACINTO FAULT ZONE, FROM MYSTIC LAKE, CALIFORNIA. (A-150)<br />
N.W. Onderdonk, T.K. Rockwell, S.F. McGill, and G. Marliyani<br />
Additional trench exposures and radiocarbon dating over the past year have refined the timing of pre-historic earthquakes<br />
along the northern San Jacinto fault zone at the Mystic Lake paleoseimic site. Seven events are recorded in the upper 1.8<br />
meters of strata, which spans approximately 1600 years. The ages of the events are constrained by 50 radiocarbon dates from<br />
detrital charcoal and are as follows:<br />
Event 1: 1738 to 1853 AD<br />
Event 2: 1670 to 1828 AD<br />
Event 3: 1521 to 1616 AD<br />
Event 4: 1349 to 1445 AD<br />
Event 5: 1076 to 1258 AD<br />
Event 6: 807 to 961 AD<br />
Event 7: 579 to 845 AD<br />
The recurrence interval for the last 7 events ranges from 159 to 210 years and based on historical data it has been at least 200<br />
years since the last ground-rupturing earthquake on the northern San Jacinto fault.<br />
212 | Southern California Earthquake Center
Poster Abstracts<br />
Comparison of this new event history on the Claremont fault with the Hog Lake site along the Clark segment of central San<br />
Jacinto fault shows some overlaps in event ages from 3 events. The strongest correlation is between Event 3 at Mystic Lake and<br />
Event 2 at Hog Lake, both of which are constrained to within 100 years. This may be evidence that some events can jump the<br />
San Jacinto Valley releasing step-over, or that events on one fault can trigger closely timed events on the other fault.<br />
Comparison of the Mystic Lake data with event histories from sites along the San Andreas fault north and south of its juncture<br />
with the northern San Jacinto fault show that some events north of the juncture overlap better with events at Mystic Lake than<br />
with events at sites on the San Andreas fault to the south of the juncture (Events 5 and 6). This leaves open the possibility that<br />
ruptures may have jumped from the San Andreas fault to the San Jacinto fault (or vice versa) in the past.<br />
NEAR-FIELD COSEISMIC DEFORMATION QUANTIFIED FROM DIFFERENTIAL AIRBORNE LIDAR OF<br />
THE EL MAYOR-CUCAPAH EARTHQUAKE SURFACE RUPTURE (A-120)<br />
M.E. Oskin, J.R. Arrowsmith, A. Hinojosa, A.J. Elliott, O. Teran, J.M. Fletcher, S. Saripali, and D. Banesh<br />
We analyze a high-resolution (9 to 18 returns/sq. m) airborne LiDAR topographic survey of the 4 April 2010 M7.2 El Mayor-<br />
Cucapah surface rupture to quantify fault slip and the amount and style of distributed near-field deformation. This is the first<br />
LiDAR survey to capture a fresh rupture in a sparsely vegetated region with pre-earthquake lower-resolution (5m-pixel)<br />
LiDAR data. The amount of distributed deformation we observe suggests the frequency of large earthquakes on secondary<br />
fault arrays may often be underestimated from geologic observations of prehistoric fault slip.The earthquake produced a 120<br />
km-long, complex multi-segment rupture with dextral-normal slip through northernmost Baja California, Mexico. The postevent<br />
survey reveals numerous surface ruptures, including subtle distributed slip above previously undocumented faults<br />
within the Colorado River delta. Differential elevations from comparison of pre- and post-event topography quantify<br />
distributed deformation surrounding fault ruptures in the Sierra Cucapah. Folding strains up to 1000 microstrains occur in the<br />
absence of visible faulting. Shear with opposite sense to adjacent faulting demonstrates that these strains were, at least initially,<br />
elastic. Changes in shallow stress that accompanied this strain may be comparable to the coseismic stress drop at seismogenic<br />
depth. We speculate that distributed mechanisms, such as granular deformation and velocity strengthening creep on small<br />
faults, relaxed these stresses post-seismically and rendered this shallow, distributed deformation into permanent fault-related<br />
folding.<br />
IMAGING COSEISMIC SURFACE DEFORMATION AND DAMAGE USING SAR AND GPS: RESULTS FROM<br />
ARIA-EQ FROM 2011 M9.0 TOHOKU-OKI AND M6.3 CHRISTCHURCH EARTHQUAKES (A-042)<br />
S.E. Owen, S.H. Yun, A. Moore, E. Fielding, P. Agram, F. Webb, M. Simons, P. Rosen, J. Cruz, and H. Hua<br />
The Advanced Rapid Imaging and Analysis for Earthquakes (ARIA-EQ) project is a joint JPL/Caltech effort to automate<br />
geodetic imaging capabilities for hazard response. Geodetic imaging’s unique ability to capture the surface deformation in<br />
high spatial and temporal resolution allow us to resolve the earthquake fault geometry and fault slip in correspondingly high<br />
spatial & temporal detail. In addition, remote sensing with radar provides change detection and damage assessment<br />
capabilities that can image even at night or through clouds. However, since these data sets are still essentially hand-crafted,<br />
they are not generated rapidly and reliably enough to be useful for informing decision-making agencies and the public<br />
following an earthquake. We are building an end-to-end prototype geodetic imaging data system that would integrate InSAR,<br />
GPS, seismology, and modeling to deliver actionable science and situational awareness products.<br />
We will present our recent results generating products for 2011 M9.0 Tohoku-oki and M6.3 Christchurch earthquakes. In<br />
response to the Tohoku-oki event, we have processed GPS data supplied by Japan’s Geospatial Information Authority to<br />
generate measurements of coseismic and postseismic deformation. These coseismic results enabled several research groups to<br />
better constrain models of the earthquake shortly after the event, helping to understand where this unexpectedly large<br />
earthquake had occurred along a well-studied subduction zone fault. We processed radar data from several SAR platforms<br />
and mosaicked interferograms show spectacular coseismic and aftershock deformation.<br />
We have also developed a prototype algorithm to detect surface property change caused by natural or man-made damage<br />
using InSAR coherence change. The algorithm was tested on construction sites in Pasadena, California. The developed<br />
algorithm performed significantly better, producing 150 % higher signal-to-noise ratio, than a standard coherence change<br />
detection method. We applied the algorithm to 2011 M6.3 Christchurch earthquake in New Zealand using ALOS PALSAR<br />
data. In Christchurch area we detected three different types of damage: liquefaction, building collapse, and landslide. These<br />
detected damage sites were confirmed with Google earth images provided by GeoEye. Larger‐scale damage pattern also<br />
2011 <strong>SCEC</strong> <strong>Annual</strong> <strong>Meeting</strong> | 213
Poster Abstracts<br />
agrees well with the ground truth damage assessment map indicated with polygonal zones of 3 different damage levels,<br />
compiled by the government of New Zealand.<br />
GEOMETRY OF FAULT SLIP ZONES AT DEPTH FROM QUANTITATIVE ANALYSIS OF SEISMIC<br />
CATALOGS: METHOD AND RESULTS FOR THE SAN JACINTO FAULT ZONE (B-064)<br />
Y. Ozakin and Y. Ben-Zion<br />
We develop a quantitative method for estimating the geometry of active fault zones at seismogenic depth using typical entries<br />
of earthquake catalogs. In contrast to prior methods that make various assumptions on geometrical properties of the structure<br />
(e.g. sets of planes or fractal network), our method does not presuppose any shape. Each recorded earthquake is assigned a<br />
Gaussian likelihood function with central coordinates and standard deviations in different directions corresponding to the<br />
hypocenter location and errors. The likelihood function is given a weight corresponding to the event size. The sum of the<br />
likelihoods of all earthquakes reported for a given region, with normalization to account for different event numbers in<br />
different locations, provides a likelihood field for the occurrence of slip patches in the examined volume. High contiguous<br />
regions of likelihood values represent large fault zone sections. Synthetic catalogs are used to develop and test normalization<br />
methods that account for typical spatio-temporal variations of seismicity, and to identify characteristic likelihood shapes<br />
corresponding to typical types of structural heterogeneities (e.g. stepovers, parallel faults). In the present application the<br />
method is applied to estimate geometrical properties of the seismicity in the San Jacinto fault zone environment. Preliminary<br />
results show high general complexity and a dipping trend with increasing depth of seismic slip patches along a NW-SE<br />
direction. The continuing work will focus on performing in-depth analysis of segmentation and continuity along different<br />
sections of the fault, and especially the trifurcation area and Hemet stepover region.<br />
AN EARTHQUAKE RUPTURE FORECAST INVERSION APPLIED TO FAULT SYSTEMS IN CALIFORNIA (B-<br />
112)<br />
M.T. Page, E.H. Field, and K.R. Milner<br />
Previous fault-based rupture forecasts for California have been plagued with magnitude “bulges” and fail to simultaneously<br />
fit all available data. We present results from an inversion-based methodology being developed for the 3rd Uniform California<br />
Earthquake Rupture Forecast (UCERF3) that simultaneously satisfies available slip-rate, paleoseismic event-rate, and<br />
magnitude-distribution constraints. Using a parallel simulated-annealing algorithm, we solve for the rates of all ruptures that<br />
extend through the seismogenic thickness on major mapped faults in California. This inverse approach eliminates the need for<br />
expert-opinion voting on rupture rates themselves, allowing for more transparent and reproducible results than previous<br />
earthquake rupture forecasts. The inversion methodology also allows for the incorporation of multi-fault ruptures, which<br />
eliminates the magnitude-distribution misfits that were present in earlier models. Furthermore, we show that the inversion<br />
solutions match slip-rate and paleoseismic event-rate data better than previous models.<br />
THE INFLUENCE OF AMBIENT FAULT TEMPERATURE ON FLASH-HEATING BEHAVIOR (A-094)<br />
F. Passelegue, D.L. Goldsby, T.E. Tullis, and O. Fabbri<br />
Recent friction experiments demonstrate that rocks become dynamically weak due to extreme heating and thermal<br />
degradation of the strength of microscopic asperity contacts on a slip surface – i.e., due to ʽflashʼ heating. Here we test the<br />
effect of an increase of ambient temperature Tf of a slip surface, up to those occurring at the base of the seismogenic zone, on<br />
the flash-heating behavior of quartzite, India gabbro and Westerly granite. Experiments were performed in a 1-atm rotaryshear<br />
apparatus at ambient humidity, wherein a fixed annulus was slid against a rotating plate of the same material at a<br />
normal stress of 5 MPa. Samples were heated by hot plates adjacent to the annulus and plate. Average sliding surface<br />
temperatures were monitored with thermocouples in contact the annulus and plate, and with a handheld IR detector. The<br />
sliding velocity was initially stepped from 10 µm/s to ~0.36 m/s, then subsequently decreased to ~0.25 m/s over ~45 mm of<br />
slip, then to zero within several mm of slip at the end of the test. The friction coefficient below a critical weakening velocity<br />
Vw of 0.10 - 0.15 m/s obtained values of 0.6 - 0.9 depending on the rock type. Above Vw, a dramatic 1/V decrease in friction<br />
with velocity was observed, with values of the friction coefficient as low as 0.4 for quartzite and 0.5 for granite and gabbro at<br />
the highest slip rate. The experiments demonstrate that increasing values of Tf cause 1) an increase in friction coefficient at<br />
quasi-static slip rates, 2) an increase in the value of Vw, and 3) an increase in the value of the weakened friction coefficient<br />
observed for a given velocity V > Vw. The unexpected increase in Vw with increasing values of Tf is consistent with flashheating<br />
theory (Rice, 2006) when appropriate higher-T values of thermal conductivity, heat capacity and contact stress in the<br />
theoretical expression for Vw are adopted.<br />
214 | Southern California Earthquake Center
Poster Abstracts<br />
DYNAMIC RUPTURE SIMULATION WITH A HIGH-ORDER DISCONTINUOUS GALERKIN METHOD ON<br />
UNSTRUCTURED TETRAHEDRAL MESHES (B-053)<br />
C. Pelties, J. de la Puente, J.-P. Ampuero, G. Brietzke, and M. Käser<br />
We will present recent developments concerning the extensions of the arbitrary high-order derivative Discontinuous Galerkin<br />
(ADER-DG) method to solve three dimensional dynamic rupture problems on unstructured tetrahedral meshes. First of all, we<br />
verify our implementation by comparing results of the <strong>SCEC</strong> test case with other numerical methods. An important result of<br />
the benchmark is that the ADER-DG method avoids spurious high-frequency contributions in the slip rate spectra and<br />
therefore does not require artificial Kelvin-Voigt damping or a posteriori filtering of synthetic seismograms.<br />
To demonstrate the capabilities of the high-order accurate ADER-DG scheme on unstructured meshes we use the 1992<br />
Landers earthquake as an example. It represents a complex fault system including branching and six curved fault segments.<br />
Furthermore, topography is respected in the discretized model to capture the surface waves correctly. Strong mesh coarsening<br />
or refinement at areas of interest is applied to keep the computational costs feasible. Finally current problems and further<br />
developments will be discussed.<br />
USE OF INTEGRATED MASTER MULTISPECTRAL IMAGERY AND LIDAR DEM FOR ACTIVE FAULT<br />
DETECTION AND EVALUATION (A-144)<br />
F.G. Perez, W.A. Bryant, J.A. Treiman, C.R. Real, and S.J. Hook<br />
Displacement caused by surface fault rupture associated with large earthquakes not only disrupts infrastructure and damages<br />
natural and built environments, but also constitutes a life safety hazard. The California Geological Survey (CGS) has the<br />
authority and responsibility, under the Alquist-Priolo Earthquake Fault Zoning Act, to identify and map active faults in<br />
California for the purpose of surface rupture hazard identification and mitigation through regulatory zoning.<br />
Mapping and evaluation of active faults is generally accomplished through conventional aerial photo interpretation and field<br />
mapping, which rely on recognizing fault-related geomorphic features and juxtaposition of contrasting rocks, soil, and<br />
geologic structure. Faults covered by vegetation or concealed by young alluvium will most likely not be detected by this<br />
method. Furthermore, spatial accuracy of photo-interpreted fault traces is limited to the accuracy, scale, and method of<br />
transfer to conventional topographic base maps, which generally lack the spatial accuracy of geolocated imagery.<br />
The inherent limitations of conventional active fault mapping are expected to be overcome by using integrated MASTER and<br />
LiDAR data. MASTER is a multispectral imagery with 50 spectral bands ranging from visible to thermal region of the<br />
electromagnetic spectrum. LiDAR on the other hand is a laser-based technology with very high positional accuracy, sub-meter<br />
resolution and capability to filter out vegetation. MASTER and LiDAR are integrated via data transformation/fusion and the<br />
resulting fused imagery are utilized to interpret active faults through recognition of fault features associated with different<br />
distinctive properties related to geology, drainage, vegetation, hydrology, thermal, anthropogenic, and topography. The<br />
completeness and accuracy of the fault interpretation is gauged by overlaying it to a baseline data of previously mapped fault<br />
traces.<br />
The research study, supported by a NASA grant, evaluated a well-mapped, 26-km reach of the southern San Andreas Fault<br />
Zone in the Antelope Valley near Palmdale.<br />
IDENTIFYING AND LOCATING TECTONIC TREMOR BENEATH THE SAN ANDREAS FAULT NEAR<br />
PARKFIELD, CA, WITH THE PASO ARRAY (B-047)<br />
D. Peterson, C. Thurber, E. Montgomery-Brown, J. Brown, and D. Shelly<br />
Tectonic tremor is a weak but persistent shaking of the Earth that was first discovered in subduction zones and later found<br />
beneath the San Andreas Fault (SAF). Tremor events represent spasmodic slip on the deep extension of the SAF, occurring at a<br />
depth of about 20-25 kilometers. Tremor occurs deeper than the nearby regular earthquakes, which can be found at maximum<br />
depths of 12-15 kilometers. Tremor is characterized by bursts of low frequency and/or very low frequency earthquakes<br />
(LFE/VLF) with dominant energy in the 1-10 Hz range. Tremor tells us about fault slip at depth in both space and time by<br />
illuminating the fault down to about the base of the crust.<br />
In the pursuit of deriving information about deep fault behavior and crustal structure, we are analyzing continuous data from<br />
the previously untapped Parkfield Area Seismic Observatory (PASO) temporary array, operated in 2000-2002 and 2004-2006.<br />
We started the identification process by correlating templates of known events from a nearby station array based on an<br />
2011 <strong>SCEC</strong> <strong>Annual</strong> <strong>Meeting</strong> | 215
Poster Abstracts<br />
existing catalog of tremor events. Using the dense PASO array and various correlation methods, including autocorrelation<br />
(Brown et. al. 2008), a scanning algorithm (Rowe, 2005), and cross correlation of template events (Shelly et al., 2007), we will<br />
refine the locations of these known events and seek to identify undiscovered clusters of LFEs and tremor. After generating an<br />
updated catalog initially for the month of September 2002, we will use S-wave arrivals from the 59 stations comprising the<br />
PASO array to provide strong constraints on the locations of identified events.<br />
KINEMATICS OF ROTATING PANELS OF E-W FAULTS IN THE SAN ANDREAS SYSTEM: WHAT CAN WE<br />
TELL FROM GEODESY? (A-056)<br />
J.P. Platt and J.P. Becker<br />
Panels of E-W-trending sinistral and/or reverse faults occur in various locations within the San Andreas system, and are<br />
commonly associated with paleomagnetic evidence for clockwise rotations over geologic time. These panels commonly cut<br />
across the trend of active dextral faults, posing questions as to how displacement is transferred across them. Geodetic data<br />
indicate that they lie within an overall dextral shear field, and the data are commonly interpreted to indicate little or no slip on<br />
the E-W faults.<br />
We model these faults and fault panels as rotating by bookshelf slip in a dextral shear field. This allows prediction of rates of<br />
slip, rotation, fault-parallel extension, and fault-normal shortening. We decompose the geodetically determined velocity field<br />
into these components, and compare them with our predictions,as illustrated by the following two examples. (1) The velocity<br />
field around the central section of the Garlock fault is consistent with a combination of long-term sinistral slip rate of ~7.5<br />
mm/yr on a locked fault, and a counterclockwise rotation rate of 5.2°/m.y. The resultant field comprises a dominant<br />
component of dextral shear at a rate of 90 nanostrain/yr, and a residual component of fault-parallel motion that reflects the<br />
elastic strain around the locked fault. (2) The E-W trending faults of the western Transverse Ranges currently lie at ~50° to the<br />
Pacific – North America plate motion vector, having been rotated clockwise into this orientation during the since early<br />
Miocene time. In this orientation the rate of sinistral slip is small, but they are still rotating at ~2.5°/m.y. Strike-parallel<br />
extension at 4 mm/yr is also clearly detectable in the velocity field, as well as strike-normal shortening at up to 6mm/yr. The<br />
rate of strike-normal shortening decreases westward, reflecting transfer of displacement from Inner Borderland dextral faults<br />
south of the Transverse Ranges onto faults within the Salinia block.<br />
These two examples demonstrate firstly, that significant sinistral slip on rotating E-W trending faults may only be detectable<br />
through second-order elastic effects; and secondly, that previously active sinistral faults may become inactive because of<br />
rotation, but may still define a discrete panel deforming by other mechanisms.<br />
STRAIN LOCALIZATION DRIVEN BY THERMAL DECOMPOSITION DURING SEISMIC SHEAR (A-092)<br />
J.D. Platt, N. Brantut, and J.R. Rice<br />
De Paola et al. [2008] analyzed a series of faults in the Northern Apennines, Italy, hosted in anhydrite and dolomite rocks.<br />
They found a highly localized band of less than 100 microns, contained within a broader damage zone. Recent High-Velocity<br />
Friction (HVF) experiments on kaolinite-bearing gouge samples (Brantut et al. [2008]) have also shown extreme localization in<br />
samples undergoing thermal decomposition. They performed microstructural analysis on HVF samples and found an<br />
“ultralocalized deformation zone”, less than ten microns wide, interpreted to be the main slipping zone in the experiment. By<br />
measuring relative humidity in the sample chamber they were also able to observe the thermal dehydration of kaolinite. These<br />
laboratory and field observations indicate that straining is extremely localized in fault materials where thermal decomposition<br />
reactions may occur.<br />
During thermal decomposition reactions pore fluid is released, leading to increases in pore pressure, and a corresponding<br />
drop in frictional heating. The reactions are endothermic, so heat is also absorbed as the reactions progress. Previous work by<br />
Sulem and Famin [2009] has investigated how these effects influence the evolution of pore pressure and temperature in a<br />
uniformly sheared gouge layer. They found that accounting for thermal decomposition reactions leads to significant pore<br />
pressure increases, and that the endothermic nature of the reaction acts to cap the maximum temperature achieved.<br />
In previous work (Platt, Rudnicki and Rice [2010]) we investigated strain localization using a model for shearing of a fluidsaturated<br />
gouge material, finding a formula for the localized zone width as a function of physical properties of the gouge. We<br />
now extend this model to include thermal decomposition. Using linear stability methods and an idealized reaction kinetic we<br />
infer a new localized zone width when decomposition is accounted for. Numerical simulations then allow us to compare this<br />
prediction to results obtained using a realistic Arrhenius kinetic relation for the reaction. We find qualitative agreement<br />
216 | Southern California Earthquake Center
Poster Abstracts<br />
between our two methods and find that thermal decomposition is important when attempting to predict the severity of strain<br />
localization. The presence of the reaction localizes the deformation to zones as narrow as a few microns. This extreme<br />
localization leads to dramatic dynamic weakening, suggesting thermal decomposition reactions may play an important role in<br />
earthquake mechanics.<br />
UPDATES FOR THE CVM-H INCLUDING NEW REPRESENTATIONS OF THE OFFSHORE SANTA MARIA<br />
AND SAN BERNARDINO BASINS AND A NEW MOHO SURFACE (B-128)<br />
A. Plesch, C. Tape, R. Graves, J.H. Shaw, P. Small, and G. Ely<br />
We deliver an updated version of the Community Velocity Model to the <strong>SCEC</strong> UCVM as version 11.9. Major improvements<br />
include a newly compiled Moho surface, addition of the offshore Santa Maria basin, a new detailed representation of the San<br />
Bernardino basin, and a much smoother transition between the low resolution area and high resolution area at the southern<br />
border of the Los Angeles basin.<br />
The new Moho surface was compiled by Tape et al. from a large number of data sources, including global data sets, receiver<br />
functions and and active-source studies. In replacing this surface care was taken to ensure that the depth intervals around the<br />
revised Moho level both in the crustal and in the mantle data grids of the model were properly assigned to crust or mantle,<br />
and consequently parametrized with velocities extrapolated from the underlying mantle model or from the crustal<br />
background model.<br />
In the offshore Santa Maria basin we extended the definition of the basement surface using reflection seismic data (McIntosh<br />
et al., 1991) to the very western margin of the model, as well as to the north. This offshore basin addition removed an abrupt<br />
transition from the basin to the background model. We smoothly extrapolated sediment velocities from the onshore model<br />
into this new offshore basin area.<br />
We also added a basin representation for the San Bernardino basin to the model. The basement surface is based on gravity<br />
data (Anderson, 2000) and seismic reflection data (Stephenson et al., 2004). To the west the relatively small basin is connected<br />
by a thin veneer of sediments to the Los Angeles basin whereas to the ESE the basin is represented as gradually tapering out<br />
keeping in mind that the data there allow for other interpretations. The velocity structure (Vp) in the basin is defined by<br />
stacking velocities (Stephenson et al., 2004) and a 1D velocity profile (Graves, 2008) combined to a basin thickness-depthvelocity<br />
function. Vs is derived from Vp using Brocher (2004).<br />
Finally, we revised the transition from the high to the low resolution models, removing a discrepancy in the velocity structure<br />
between the southern margin of the high resolution model in the Los Angeles area and the surrounding low resolution model.<br />
We modified the high resolution area by introducing a smooth N-S gradient in the previously existing delta between the low<br />
and high resolution models in a region at its southern margin.<br />
WHAT’S COOKING? EVALUATING FRICTIONAL STRESS USING EXTRACTABLE ORGANIC MATERIAL<br />
IN FAULT ZONES (A-073)<br />
P.J. Polissar, H.M. Savage, R.E. Sheppard, E.E. Brodsky, and C.D. Rowe<br />
Determining the absolute stress on faults during slip is one of the major goals of earthquake physics as this information is<br />
necessary for full mechanical modeling of the rupture process. One indicator of absolute stress is the total energy dissipated as<br />
heat through frictional resistance. The heat results in a temperature rise on the fault that is potentially measurable and<br />
interpretable as an indicator of the absolute stress. We present a new paleothermometer for fault zones that utilizes the<br />
thermal maturity of extractable <strong>org</strong>anic material to determine the maximum frictional heating experienced by the fault. As a<br />
rock is heated, temperature-sensitive molecules degrade, increasing the abundance of refractory <strong>org</strong>anic molecules. On the<br />
short timescales involved in fault heating, these reactions are strongly temperature dependent and therefore track the<br />
maximum temperature achieved during fault slip. Furthermore, because there are no retrograde reactions in these <strong>org</strong>anic<br />
systems, the maximum heating signature is preserved. We investigate four fault zones. According to a variety of <strong>org</strong>anic<br />
thermal maturity indices, the thermal maturity of the wall rocks falls within the range of heating expected from the bounds on<br />
burial depth and time, indicating that the method is robust and in some cases improving our knowledge of burial depth.<br />
Only the Pasagshak Point Megathrust, AK, which is also pseudotachylyte-bearing, shows differential heating between the<br />
fault and off-fault samples. Our finding confirms that this rapid heating is sufficient to measurably alter the thermal maturity<br />
of <strong>org</strong>anic molecules. However, most of the faults did not get hotter than the surrounding rock during slip. Simple<br />
temperature models coupled to the kinetic reactions for <strong>org</strong>anic maturity let us constrain certain aspects of the fault during<br />
2011 <strong>SCEC</strong> <strong>Annual</strong> <strong>Meeting</strong> | 217
Poster Abstracts<br />
slip such as fault friction, maximum slip in a single earthquake, the thickness of the active slipping zone and the effective<br />
normal stress. Because of the significant length of these faults, we find it unlikely that they never sustained large earthquakes.<br />
Therefore we focus on the implications that either 1) some faults undergo dynamic weakening, at least during large<br />
earthquakes, or 2) that slip is not confined to very thin localized zones during earthquakes.<br />
THE ADVANTAGES OF FIELD WORK (A-021)<br />
M.M. Ponce-Zepeda<br />
Peer-driven fieldwork transformed student to investigators by challenging them to be responsible for the success of the entire<br />
group. Fellow investigators were responsible for managing a detailed field notebook, sampling, planning routes, level logger<br />
maintenance, x-ray diffractometer analysis interpretation, and constantly troubleshooting. Mentorship from and challenges<br />
proposed by the USU faculty further built on this scaffolding of field experience.<br />
First hand fieldwork provides a battery of beneficial skills that many undergraduate geology students, at the two-year college<br />
level, rarely participate in. The advantage of including two-year college students allows for dynamic research from an<br />
untapped resource. The East Los Angeles College (ELAC) Geology Club, a student-run club at an inner city community<br />
college, facilitated data collection from gryphons and mudpots in the Salton Trough. Students tested temperature, pH,<br />
electrical conductivity, and total dissolved solids in the field. This collaborative effort is symbiotic as sharing responsibilities<br />
allowed USU to save funds and provided ELAC with the opportunity to participate in research. The collaboration allowed all<br />
students to gain confidence in new sampling skills, and collaborate in an ongoing study. By sharing the opportunity to<br />
conduct fieldwork more students are able to engage in the learning process and contribute to scientific discovery.<br />
ANALYZING AMBIENT NOISE USING USB MICRO-ELECTRO-MECHANICAL SYSTEMS (MEMS)<br />
ACCELEROMETERS (B-084)<br />
H.J. Potter, A. Chung, and J. Lawrence<br />
Collecting data for building stability analysis is typically cost prohibitive using traditional (large and expensive) seismometers.<br />
If inexpensive (
Poster Abstracts<br />
3.0 sec). In the worst cases, the OpenSHA maps agree to within 5% of the values determined using the 2008 Fortran codes;<br />
generally the discrepancy is much lower. There are two primary contributors to the observed discrepancies. The first arises<br />
from how each codebase handles fault geometry: given a fault source and an associated magnitude frequency distribution,<br />
there is no established best practice for representing floating events on a fault surface. The second arises from optimizations in<br />
the Fortran code. Whereas OpenSHA is currently not optimized, the Fortran codes make use of numerous precalculated<br />
lookup arrays for ground motions, distance approximations, hanging-wall effects and the like. While speeding up the code<br />
significantly, the mean hazard at a point can be slightly different than it would be in the absence of such approximations.<br />
Regardless of what platform is used in the future, this exercise provides an opportunity to cross-verify and debug each<br />
codebase, as well as identify key issues related to fault and point source model definition, selection, and implementation.<br />
PALEOSEISMIC INVESTIGATION OF THE SAN GORGONIO PASS FAULT ZONE NEAR CABEZON,<br />
CALIFORNIA (A-134)<br />
S. Ramzan and J.D. Yule<br />
The discontinuous nature of the San Andreas fault at San G<strong>org</strong>onio Pass has led to competing models about whether or not<br />
large earthquakes can rupture through this structurally complex region. To test these models we excavated trenches across the<br />
San G<strong>org</strong>onio Pass fault zone (SGPFZ) near Cabezon as part of a larger effort (also see McBurnett and Yule, this volume). Our<br />
site is located ~100 m to the east of a site excavated in 1997 by Yule where trenches uncovered evidence for at least one<br />
earthquake 500-700 yrs ago. At the 1997 site heavy bioturbation and low sedimentation rates hampered efforts to distinguish<br />
events. The new site, located where two alluvial fans merge, was selected for its higher sedimentation rates and excellent<br />
stratigraphy. Excavations at the new site show weak soil layers that subdivide the stratigraphy into six units (units 100 to 600,<br />
from base to top of the section). The units form tabular to wedge-shaped layers up to ~1 m thick. In general, the base of each<br />
unit consists of yellowish-gray, thin- to medium-bedded sand and pebbly sand, with occasional gravel lenses and mud and<br />
silt interlayers. The tops of each unit are more massive; they locally contain numerous burrows and display a slight orangered<br />
oxidized soil (?) horizon. A distinct angular unconformity lies at the base of unit 400. Units that underlie the unconformity<br />
(100-300) are cut by a fault that strikes N35-50° E and dips 15-30° NW. The fault shows 1.0 to 1.5 m of vertical separation,<br />
equivalent to 2.5 to 6 m of slip resolved parallel to a N45°W slip vector. Unit 400 is up to 1 m thick at the south end of the<br />
trench and pinches out against the fault scarp on the north. A channel fill sequence in unit 500 caps the scarp. The<br />
stratigraphic (onlap) and structural (faulting) relations clearly restrict the most recent event (MRE) to have occurred post- and<br />
pre-deposition of units 300 and 400, respectively. Radiocarbon ages (n=12) from detrital charcoal fragments constrain the<br />
timing of this earthquake to between ~600-800 yrs BP. We suspect that the story here is incomplete because, due to a road that<br />
we could not excavate, we did not extend the trenches across the entire fault zone. However, results from this and the 1997<br />
study (which trenched the complete fault zone) suggest that the MRE occurred 600-700 yrs BP. Evidence from Cabezon<br />
therefore supports a model with infrequent ruptures (by San Andreas fault standards) in San G<strong>org</strong>onio Pass and rare throughgoing<br />
events.<br />
IMPROVING GPS STRAIN ESTIMATES ON SUB-DAILY TIMESCALE (A-069)<br />
Y. Reuveni, S. Kedar, S. Owen, and F. Webb<br />
The study of the strain field resulting from active plate boundary deformations across active plate boundary zones is one of<br />
the primary scientific objectives of global GPS-based geodetic measurements. Furthermore, observations of aseismic strain<br />
accumulation are required for advancing our understanding of the earthquake cycle, which is the main motivation for the<br />
establishment of GPS networks such as SCIGN, PBO and GEONET in Japan. Here, we present an improved GPS analysis<br />
strategy that enables us to reduce the noise level of GPS-based sub-daily strain measurements up to a factor of 10. This will<br />
allow the monitoring of sub-daily deformation, and provide exceptional spatial coverage for monitoring sub-daily strain<br />
deformation improved sub-daily resolution of positions and baseline estimates is maintained through GPS analysis approach,<br />
which reduces the key sources of error such as diurnal path effects, path delays caused by reflections and refractions of the<br />
GPS signal near the receiver (multipath), and the ionosphere and troposphere. We will present analysis of the resolution<br />
power of sub-daily baseline estimates as a function of baseline lengths and frequency.<br />
2011 <strong>SCEC</strong> <strong>Annual</strong> <strong>Meeting</strong> | 219
Poster Abstracts<br />
STOCHASTIC SIMULATION OF EARTHQUAKE GROUND MOTION COMPONENTS FOR SPECIFIED<br />
EARTHQUAKE AND SITE CHARACTERISTICS: A TOOL FOR PERFORMANCE-BASED EARTHQUAKE<br />
ENGINEERING (B-009)<br />
S. Rezaeian<br />
A method for generating an ensemble of orthogonal ground motion components for specified earthquake and site<br />
characteristics is presented (Rezaeian and Der Kiureghian, 2011). The generated synthetic ground motions can be used in<br />
performance-based earthquake engineering when a large number of recordings is required and real recorded motions are<br />
scarce or lacking. The method employs a parameterized stochastic model that is based on a time-modulated filtered whitenoise<br />
process with the filter having time-varying characteristics. Whereas the input white-noise excitation describes the<br />
stochastic nature of the ground motion, the forms of the modulating function and the filter and their parameters characterize<br />
the evolutionary intensity and nonstationary frequency content of the ground motion. The stochastic model is fitted to a<br />
database of recorded horizontal ground motion component pairs that are rotated into their principal axes, a set of orthogonal<br />
axes along which the components are statistically uncorrelated. Model parameters are identified for each ground motion<br />
component in the database. Using these data, predictive equations are developed for the model parameters in terms of<br />
earthquake and site characteristics: faulting mechanism, earthquake magnitude, source-to-site distance, and site conditions.<br />
Furthermore, correlation coefficients between parameters of the two components are estimated. Given a design scenario<br />
specified in terms of earthquake and site characteristics, the results of this study allow one to generate realizations of<br />
correlated model parameters and use them along with simulated white-noise processes to generate synthetic pairs of<br />
horizontal ground motion components along the principal axes. The proposed simulation method can be easily extended to<br />
the vertical component. It does not require any seed recorded ground motion and therefore is ideal for use in performancebased<br />
earthquake engineering. This simulation method has been validated by comparing the resulting synthetic motions with<br />
real recorded motions and by comparing the statistics of their elastic response spectra with the values predicted by the Next<br />
Generation Attenuation ground motion prediction equations.<br />
Rezaeian and Der Kiureghian. Simulation of orthogonal horizontal ground motion components for specified earthquake and<br />
site characteristics. Earthquake Engineering & Structural Dynamics, Published online (Early View): May 17, 2011. DOI:<br />
10.1002/eqe.1132.<br />
PARTIAL TESTS AND ACID TESTS OF GROUND-MOTION MODELS FOR INHIBITION OF VERY STRONG<br />
SHAKING (B-015)<br />
D.A. Rhoades, G.H. McVerry, and J.X. Zhao<br />
Abrahamson and Wooden (2010) (AW) pointed out that the Rhoades et al. (2008) (RZM) test for inhibition of very strong<br />
shaking in ground-motion models assumes independence of total residual; it does not allow for correlation in the total<br />
residuals resulting from the inclusion of both inter-event and intra-event error terms in the models. Therefore, for a highly<br />
unbalanced sample, such as that chosen for fitting the Abahamson and Silva Next Generation Attenuation (AS-NGA) models,<br />
the test does not give a reliable estimate of the statistical significance of deviations of the expected number of exceedances of<br />
very strong ground-motion levels from the actual number in the sample. AW proposed replacing the RZM test by two partial<br />
tests, in which either the random inter-event or intra-event errors are regarded as fixed effects, and found that the AS-NGA<br />
model passed these partial tests. This shows that the model can be confidently applied to future earthquakes where one of<br />
these error terms is known exactly in advance, but does not show how the model can be expected to perform in the realistic<br />
case where both of the error terms are random. Here, using a simulation approach, we adapt the RZM test to take account of<br />
correlation in the total residuals, and apply it to test for inhibition in the Zhao et (2006) and AS-NGA models for peak ground<br />
acceleration.<br />
A TESTABLE EARTHQUAKE LIKELIHOOD MODEL BASED ON PROXIMITY TO KNOWN SOURCES (B-<br />
121)<br />
D.A. Rhoades and M.W. Stirling<br />
Known earthquake sources include mapped faults and past earthquakes. We propose a long-term earthquake likelihood<br />
model which makes use of both types of source, but does not invoke the concepts of fault segments or characteristic<br />
earthquakes. The model has two components, one based on proximity to past earthquakes, taking into account the magnitude<br />
of each, and another based on proximity to mapped faults, taking into account the slip-rate of each. The Gutenberg-Richter<br />
law is invoked for earthquake magnitudes and an inverse power law for the diminution of earthquake rate density with<br />
220 | Southern California Earthquake Center
Poster Abstracts<br />
distance from past earthquakes and mapped faults. The parameters of each component are optimised using a target catalogue,<br />
and the rate density of the combined model is estimated as an optimal linear combination of the two components. The model<br />
has been applied to the New Zealand region using the active fault database and the earthquake catalogue since 1964. In a<br />
retrospective analysis, the combined model has an informative gain (log likelihood increase) per earthquake of about 0.15 over<br />
each of its components. The model is suitable for comparison with other long-term models in the testing centers of the<br />
Collaboratory for the Study of Earthquake Predictability.<br />
SEARCHING FOR A PALEOTSUNAMI RECORD IN SOUTHERN CALIFORNIA: LESSON’S FROM<br />
THAILAND’S ANDAMAN COAST. (A-154)<br />
B.P. Rhodes and M.E. Kirby<br />
In 2004, no paleotsunami deposits were known from the Andaman Coast of Thailand; in 2011, southern California likewise<br />
has no confirmed paleotsunami deposits. In the case of Thailand, a flurry of research followed the 2004 tsunami. After several<br />
months of futile searching in favorable environments by several research teams, candidate deposits were finally located.<br />
Subsequent research confirmed paleotsunami deposits at 2 locations: in a mangrove forest at Klong Thap Lamu (KTL)(Rhodes<br />
et al., 2011); and in swales in a wide beach plain at Koh Prathong (Jankaew et al., 2008). At KTL, cores located a buried layer of<br />
coral and shell rubble within peat with a lateral extent that closely matched the location of the 2004 tsunami rubble layer. We<br />
interpreted this event horizon as a paleotsunami deposit, with an age between 2720 and 4290 cy BP. Shortly after the discovery<br />
at KTL, Jankaew et al. (2008) discovered a sequence of at least 3 sand sheets sandwiched between peaty soil layers within wet<br />
swales at Koh Prathong. In order to expand this discovery, and better date the events, we have spent > 20 days on Koh<br />
Prathong north of the earlier discovery. We have identified at least 7 additional sites with a spatially heterogeneous<br />
distribution of between 1 and 4 sand layers. The dates (in progress) should allow correlation of the sand layers between swales<br />
and will establish a tsunami chronology for this area.<br />
During our search in Thailand, we learned important lessons that should help locate paleotsunami deposits elsewhere. We<br />
propose to search for deposits in the wetlands of southern California. The following lessons will inform our search: 1)<br />
Paleotsunami deposits are heterogeneous in thickness and extent. Cores taken in widely spaced sites could miss a significant<br />
deposit; 2) Quantitative physical sedimentology, including grain size analyses, magnetic susceptibility, <strong>org</strong>anic content, and<br />
microfossils can not only characterize the paleotsunami deposit, but also can identify the environment of deposition of the<br />
encasing sediment; 3) Bioturbation can mix a tsunami sand in with the encasing muddy, <strong>org</strong>anic-rich sediment; the sandy<br />
layer may not be “visible” except via quantitative grain size analysis; and, 4) In the <strong>org</strong>anic rich sediments where<br />
paleotsunami deposits are typically found, 14C dating can be frustrated by sediment reworking by the tsunami, and by<br />
modern roots. Bracketing dates must be obtained from abundant and carefully chosen samples.<br />
LUMINESCENCE DATING AS A TOOL FOR ASSESSING THE VARIABILITY OF FAULT SLIP RATES AND<br />
PALEOSEISMIC EVENTS ON TIMESCALES OF 10 TO 100,000 YEARS (A-130)<br />
B.J. Roder, E.J. Rhodes, M.J. Lawson, L. McAuliffe, J.F. Dolan, and S.F. McGill<br />
The Mojave Desert, California, USA, is crossed by a number of major active fault systems that have played an important role<br />
in landscape development and represent a significant seismic hazard. Critical questions include the degree to which fault slip<br />
is clustered into episodes of more rapid movement, followed by periods of reduced activity, and whether slip is<br />
accommodated by different sub-parallel faults within a single system. These issues are important for understanding fault<br />
dynamics and improving earthquake risk assessment. While radiocarbon dating, terrestrial cosmogenic nuclides and U-series<br />
dating of carbonate overgrowths can help constrain the timing of events, an absence of <strong>org</strong>anic matter, thin or pulsed<br />
deposition along with problems of signal inheritance, and unpromising depositional conditions can render each of these<br />
techniques ineffective.<br />
OSL (optically stimulated luminescence) and IRSL (infrared stimulated luminescence) dating have a key role to play. These<br />
techniques rely on the gradual trapping of electrons in the crystal lattice of quartz and feldspar grains by interaction with<br />
environmental ionizing radiation during burial. This follows zeroing of the signal by daylight exposure as sediment grains are<br />
transported by surface processes. Despite significant advances in OSL dating of quartz over the past decade, in many<br />
tectonically active areas, the luminescence characteristics of quartz grains are not well-suited for the determination of precise<br />
age estimates. Here, we explore the potential for using OSL and IRSL signals to provide age control for the paleoseismic<br />
record and morphological features associated with the Garlock fault, a major left-lateral fault that extends for 250 km in a<br />
broad east-west arc across the northern edge of the Mojave block. Slip rate determinations are based on the direct dating of<br />
2011 <strong>SCEC</strong> <strong>Annual</strong> <strong>Meeting</strong> | 221
Poster Abstracts<br />
offset depositional features on small alluvial fans. Age determination of samples from the El Paso Peaks paleoseismic site<br />
provides the opportunity to compare OSL and IRSL age estimates to an established radiocarbon chronology based on 31 dates.<br />
We present preliminary OSL and IRSL age estimates measured as part of <strong>SCEC</strong> award #11198, clearly demonstrating the great<br />
potential of this dating approach.<br />
COULOMB STRESS CHANGES IMPARTED BY SIMULATED M>7 EARTHQUAKES TO MAJOR FAULT<br />
SURFACES IN SOUTHERN CALIFORNIA (B-104)<br />
J.C. Rollins, G.P. Ely, and T.H. Jordan<br />
To study static stress interactions between faults in southern California and identify cases where one large earthquake could<br />
trigger another, we select fourteen M>7 events simulated by the <strong>SCEC</strong>/CME CyberShake project and calculate the Coulomb<br />
stress changes those events impart to major fault surfaces in the UCERF2 fault model for the region. CyberShake simulates<br />
between 6 and 32 slip distributions for each event at a slip sampling resolution of 1 km, and we calculate stress changes on<br />
fault surfaces at the same resolution, a level of detail which is unprecedented in studies of stress transfer and which allows us<br />
to study the way that variabilities in slip on the source can affect imparted stress changes. We find that earthquakes rupturing<br />
the southern San Andreas fault generally decrease Coulomb stress on right-lateral faults in the Los Angeles basin, while M>7<br />
events on the San Jacinto, Elsinore, Newport-Inglewood and Palos Verdes faults generally decrease stress on parallel rightlateral<br />
faults but increase Coulomb stress on the Mojave or San Bernardino sections of the San Andreas. Stress interactions<br />
between strike-slip and thrust faults and between the San Andreas and Garlock faults depend on the rupture area of the<br />
source. Coulomb stress changes imparted by simulated SAF events to locations on the San Jacinto and Garlock faults within<br />
~8 km of the San Andreas appear to be influenced more by the nearby distribution of high and low slip on the San Andreas<br />
than by the overall slip distribution across the entire rupture. Using a simplified model, we calculate that an area of no slip<br />
surrounded by high slip on a rupture imparts strong Coulomb stress increases ≤7 km to either side of the source fault, possibly<br />
explaining the apparent ~8-km range of influence of local slip on the San Andreas. Additionally, we devise a method for<br />
evaluating uncertainty values in Coulomb stress changes caused by uncertainties in the strike, dip and rake of the receiver<br />
fault. These findings may be useful in understanding stress interactions between faults of different orientations and rakes,<br />
stress transfer and variability at short distances from the source fault, and applications of uncertainty values to Coulomb stress<br />
changes.<br />
NEW BE-10 EXPOSURE AGES AND FRAGILITIES FOR PRECARIOUSLY BALANCED ROCKS TEST PSHA<br />
AND RUPTURE MODELS IN SOUTHERN CALIFORNIA (B-008)<br />
D.H. Rood, R. Anooshehpoor, G. Balco, J. Brune, R. Brune, L. Grant Ludwig, K. Kendrick, M. Purvance, and I. Saleeby<br />
Currently, the only empirical tool available to test maximum earthquake ground motions spanning timescales of 10 ky-1 My is<br />
the use of fragile geologic features, including precariously balanced rocks (PBRs). The ages of PBRs together with their areal<br />
distribution and mechanical stability (“fragility”) constrain probabilistic seismic hazard analysis (PSHA) over long timescales;<br />
pertinent applications include the USGS National Seismic Hazard Maps (NSHM) and tests for ground motion models (e.g.,<br />
Cybershake). Until recently, age constraints for PBRs were limited to varnish microlamination (VML) dating techniques and<br />
sparse cosmogenic nuclide data; however, VML methods yield minimum limiting ages for individual rock surfaces, and the<br />
interpretations of cosmogenic nuclide data were ambiguous because they did not account for the exhumation history of the<br />
PBRs or the complex shielding of cosmic rays. We have recently published a robust method for the exposure dating of PBRs<br />
combining Be-10 profiles, a numerical model, and a three-dimensional model for each PBR constructed using photogrammetry<br />
(Balco et al., 2011, Quaternary Geochronology). Here, we use this method to calculate new exposure ages and fragilities for 4<br />
PBRs near the San Andreas, San Jacinto, and Elsinore faults at the Lovejoy Buttes, Round Top, Pacifico, and Beaumont South<br />
sites (in addition to the recently published age of 18.7 +/- 2.8 ka for a PBR at the Grass Valley site). We combine our ages and<br />
fragilities for each PBR, and use these data to test the USGS 2008 NSHM PGA with 2% in 50 year probability, USGS 2008<br />
PSHA deaggregations, and basic hazard curves from USGS 2002 NSHM data.<br />
INVESTIGATIONS OF MICROBIAL LIFE IN THE MUD NEAR THE SALTON SEA, CALIFORNIA (A-018)<br />
S.C. Rosove<br />
Thermal springs can be an area where micro<strong>org</strong>anisms can thrive, an aspect of studying the gryphons and mud pots we<br />
examined near the Salton Sea was to identify potential microbes. The idea is that since the type of environment is borderline<br />
extremophiles, with high temperatures, the smell of sulfur, salt precipitating in some areas, and black mud. Through collecting<br />
mud samples we would plate them onto potato based agar plates to attempt to grow anything present in the mud. The<br />
222 | Southern California Earthquake Center
Poster Abstracts<br />
colonies would be characterized in terms of how they appeared (colour and texture), and isolated to try to genetically identify<br />
them. We found that micro<strong>org</strong>anisms do live in the mud, but with the agar we used very few culturable <strong>org</strong>anism came to<br />
fruition. We were unable to genetically identify them as their DNA was not amplified. The next steps of the project are to<br />
continue trying to amplify the DNA for genetic analysis, perhaps using different methods. Also, using different types of agar<br />
plates to plate the mud on to see if different types of <strong>org</strong>anisms appear instead of the small set obtained. It would be<br />
interesting to use media with higher sulfur and salt concentrations, as this was prominent in the environment.<br />
THREE-DIMENSIONAL MODELING OF INTERSEISMIC DEFORMATION IN TAIWAN (A-055)<br />
B. Rousset, S. Barbot, J.P. Avouac, Y.J. Hsu, and J.C. Lee<br />
The Taiwan Island, a complex orogenic system at the intersect between an arc-continent collision and a subduction zone, is a<br />
much studied area. The 1999 Chi-Chi earthquake, the latest of a series of Mw 7+ earthquakes, was a reminder of the active<br />
tectonics shaping the island. Yet, the structure of the fault system at crustal depths, responsible for the sequence of devastating<br />
earthquakes, is not fully resolved. In this study, we establish the fault structure of Taiwan in its entirety that reconciles many<br />
geophysicals observations (seismicity, tomography and structural analyses) and explains the pattern of secular deformation.<br />
We optimise and complement the fault geometry at crustal depths using data from several GPS networks, including islandwide<br />
continuous measurements and regional campaigns. The inversion of the entire velocity field in Taiwan can be<br />
challenging because a large portion of the convergence is taking place on deep décollements, far below the surface, for which a<br />
precise geometry is unknown. We develop a new inversion scheme where we use the difference between nearby GPS stations<br />
to constrain slip rate on faults. We show that the method allows for a much finer optimization of fault geometry and is<br />
particularly fitted for a complex faulting environment such as Taiwan. We find that the Chihshang segment of the<br />
Longitudinal Valley Fault is sliping at a rate of ~30 mm.yr-1 whereas the Yumei segment to the north appears locked. The<br />
Chelungpu Fault and the Shuangtung Fault also appear locked, but the décollement subjacent is inferred to move at a rate of<br />
20 to 30 mm.yr-1. The Chuckou system, which originated 10 earthquakes of Mw 6+ in the past 100 years seems locked at the<br />
surface and loaded from below at a rate of ~20 mm.yr-1. The Hsincheng fault, 50 km to the south of Taipei seems loaded from<br />
below at a rate of 12 mm.yr-1. The GPS data alone are not sufficient to determine uniquely the degree and area of locking and,<br />
but if completely locked, such a fault could host an earthquake of Mw 6.2 with a recurrence time of ~40 yr. The integration of<br />
decades of GPS surveys, previous fine-scale structural analyses, seismic and tomography imaging allows for a refined threedimensional<br />
fault structure for Taiwan. Our study reveals areas under active loading, which could represent substantial<br />
seismic hazards around the regions of Hualien, Jhudong, Fongyuan and Chiayi.<br />
PROBABILISTIC ASSESSMENT OF BUILDING RESPONSE TO SIMULATED AND RECORDED GROUND<br />
MOTIONS (B-088)<br />
K.L. Rowe and A.B. Liel<br />
This study examines the seismic response of buildings subjected to both physics-based ground motion simulations and<br />
recorded ground motions time histories. Nonlinear dynamic analysis is used to evaluate the response of six archetypical<br />
reinforced concrete (RC) frame buildings to a set of three simulated and three recorded earthquakes. Using probabilistic<br />
analysis, building response is examined and statistically compared to determine whether the broadband ground motion<br />
simulations and the recorded ground motion time histories yield similar distributions for building response, focusing<br />
especially on the likelihood of earthquake induced collapse. Important aspects of the ground motion time histories that may<br />
cause differences in building response are then examined to attempt and explain the source of these dissimilarities in response.<br />
This study also examines the potential of applying the probabilistic analysis outlined in this study to the broader area of<br />
seismic risk analysis by using response results from recorded or simulated ground motions to predict regional collapse risks.<br />
This offers a new framework with which to evaluate building vulnerability to seismic events. Results indicate that, when<br />
examined based on the elastic spectral response, there are significant differences in building response. These differences are<br />
attributed in part to the long-period energy (T>1sec) content of the ground motions, and can be captured if ground motion<br />
intensity is quantified in terms of inelastic spectral displacement. Higher mode effects, earthquake duration, energy content<br />
and rate of energy accruement were not found to have a significant effect on differences in building response.<br />
2011 <strong>SCEC</strong> <strong>Annual</strong> <strong>Meeting</strong> | 223
Poster Abstracts<br />
WIDESPREAD TRIGGERING OF EARTHQUAKES IN THE CENTRAL US BY THE 2011 M9.0 TOHOKU-OKI<br />
EARTHQUAKE (B-074)<br />
J.L. Rubinstein and H.M. Savage<br />
The strong shaking of the 2011 M9.0 off-Tohoku earthquake triggered tectonic tremor and earthquakes in many locations<br />
around the world. We analyze broadband records from the USARRAY to identify triggered seismicity in more than 10<br />
different locations in the Central United States. We identify triggered events in many states including: Kansas, Nebraska,<br />
Arkansas, Minnesota, and Iowa. The locally triggered earthquakes are obscured in broadband records by the Tohoku-Oki<br />
mainshock but can be revealed with high-pass filtering. With the exception of one location (central Arkansas), the triggered<br />
seismicity occurred in regions that are seismically quiet. The coincidence of this seismicity with the Tohoku-Oki event<br />
suggests that these earthquakes were triggered. The triggered seismicity in Arkansas occurred in a region where there has<br />
been an active swarm of seismicity since August 2010. There are two lines of evidence to indicate that the seismicity in<br />
Arkansas is triggered instead of part of the swarm: (1) we observe two earthquakes that initiate coincident with the arrival of<br />
shear wave and Love wave; (2) the seismicity rate increased dramatically following the Tohoku-Oki mainshock. Our<br />
observations of widespread earthquake triggering in regions thought to be seismically quiet remind us that earthquakes can<br />
occur in most any location. Studying additional teleseismic events has the potential to reveal regions with a propensity for<br />
earthquake triggering.<br />
JUMPING RUPTURE DEPENDENCE ON FRICTION FORMULATIONS AT STRIKE-SLIP FAULT<br />
STEPOVERS (A-077)<br />
K.J. Ryan and D.D. Oglesby<br />
It is well known that fault stepovers can under some circumstances allow through-going rupture, and under other<br />
circumstances cause rupture termination (e.g., Harris and Day, 1993; Kase and Kuge, 1998; Duan and Oglesby, 2006). However,<br />
the effects of different friction law formulations on jumping rupture have not been extensively explored. In this study we<br />
investigate how 4 different frictional parameterizations affect the ability of rupture to jump a stepover. We compare linear slip<br />
weakening friction (Ida, 1972) and 3 forms of rate- and state-dependent friction (Dieterich, 1978, 1979; Ruina, 1983): ageing law,<br />
slip law, and slip law with strong rate-weakening (e.g., Rice, 1999, 2006; Beeler and Tullis, 2003; Rojas et al., 2009). We use the<br />
dynamic finite element method (Barall, 2008) to model earthquake rupture along 2-D strike-slip stepovers, in both extensional<br />
and compressional settings. We consider frictional effects on systems with large and small absolute stress fields, with large<br />
and small stress drops, respectively. We have found that for parameterizations with the same effective slip-weakening<br />
distance, the functional form of the friction law can greatly effect whether or not rupture is likely to jump and continue along<br />
the secondary fault segment. In particular, we find that the slip law, which has lower fracture energy for a given effective slipweakening<br />
distance than the aging law or the linear slip-weakening law, allows rupture to jump larger stepover widths than<br />
the aging or slip-weakening law. We also investigate the effect of the Linker-Dieterich (Linker and Dieterich, 1992)<br />
dependence of state variable on normal stress. We find through preliminary models that adding normal stress dependence to<br />
the state variable delays nucleation on the secondary fault segment when compared to normal-stress independent state<br />
evolution laws. Nucleations along the secondary segments occur in areas of decreased normal stress, in both compressional<br />
and dilational stepovers. However, state-variable dependent normal stress results in an increase in state variable (fault<br />
strength) in those same areas, thereby hindering rupture. Thus, we illustrate that the ability of rupture to jump a stepover can<br />
depend strongly on the formulation of the friction law. In the future we will investigate the effects of friction law formulation<br />
on other fault geometries including dip-slip faults.<br />
AN EVALUATION OF THE RELM TEST FORECASTS (B-120)<br />
M.K. Sachs, Y.T. Lee, D.L. Turcotte, J.R. Holliday, and J.B. Rundle<br />
The RELM test of earthquake forecasts in California was the first competitive evaluation of earthquake forecasts of future<br />
earthquakes. Participants submitted forecast probabilities of occurrence of M ≥ 5 earthquakes in 0.1° × 0.1° cells for the period<br />
1 January 2006 to 31 December 2010. During this period 31 test earthquakes occurred in 22 test cells. This seismic activity was<br />
dominated by earthquakes associated with the M = 7.2 El Mayor-Cucapah earthquake. Forecasts of the number of earthquakes<br />
and their locations are considered separately. The five forecasts for the entire test region are evaluated in several ways. In<br />
addition we evaluated thirteen forecasts for southern California.<br />
224 | Southern California Earthquake Center
Poster Abstracts<br />
SPACE GEODETIC INVESTIGATION OF INTERSEISMIC DEFORMATION DUE TO THE SAN JACINTO<br />
FAULT NEAR ANZA, CA (B-153)<br />
V. Sahakian, Y. Fialko, Y. Bock, and T. Rockwell<br />
We performed campaign GPS measurements of near-field interseismic deformation in the Anza section of the San Jacinto fault<br />
zone. Our survey occupied 27 benchmarks within 4 km of the fault trace, including a 400-m long alignment array established<br />
across the fault in 1990 by SDSU investigators. To constrain the fault slip rate and locking depth, we used <strong>SCEC</strong> CMM4<br />
velocities in addition to our near field campaign GPS measurements. We inverted GPS velocities using a non-linear Monte-<br />
Carlo algorithm. The best-fitting slip rate and fault locking depths are 14 ± 2 mm/yr and 16 ± 3 km, respectively. We also<br />
investigated the occurrence of shallow creep on the fault by comparing GPS positions of the alignment array monuments to<br />
the total station measurements conducted in the early 1990’s. This comparison yields a maximum rate of rotation of .002<br />
degrees per year within the array. We combined these observations with simple models of shallow creep to place an upper<br />
bound on the amount of surface creep. The data appear to rule out shallow creep at a rate greater than 0.5 mm/yr. This upper<br />
bound is well below predictions of models of interseismic deformation on rate-and-state faults assuming a two to three<br />
kilometer deep velocity-strengthening layer.<br />
MEDIA TEAM - ABSTRACT (A-159)<br />
A. Sampson, H. Humpleman, and M. Romano<br />
At the University of Southern California, nineteen students from across the nation are brought together to study earthquake<br />
behavior at the Southern California Earthquake Center (<strong>SCEC</strong>). These students, coming from a wide range of academic<br />
interests, compose the intern class for the Undergraduate Studies in Earthquake Information Technology (UseIT). Each intern<br />
class is presented with a Grand Challenge - a task that can only be completed by combining each interns’ knowledge of<br />
computer science and geology - and it is the Media Team’s responsibility to record this collaboration and development<br />
throughout the entirety of the internship.<br />
In order to accomplish this, the Media Team was in constant dialogue with each of the separate groups working on different<br />
aspects of the Grand Challenge. They collected multiple interviews with interns and supervisors each week and wrote the<br />
voice over narration for the documentary as the interviews were clipped. Shooting footage to be paired with the interviews in<br />
the documentary was a constant process, as was logging and editing the footage filmed. As the Media Team experienced the<br />
internship, they decided UseIT would be best represented by having both a scientific documentary and more light-hearted<br />
intern experience video.<br />
ANALYZING BUILDING RESPONSE THROUGH THE USE OF GPS & STRONG MOTION DATA FOR THE<br />
MONITORING OF INFRASTRUCTURE (A-072)<br />
D. Sanchez, Y. Bock, and D. Melgar<br />
Major earthquakes constantly remind us of the vulnerability of structures to ground vibrations and motion. Accelerometers<br />
are currently being used to collect ground motions in order to estimate displacements of the ground and of structures.<br />
However, this approach has its limitations, providing poor accuracy at low frequencies. With the innovations in GPS sensor<br />
technologies, their contribution in collecting data from earthquakes along with accelerometers has led to obtaining a more<br />
accurate method in estimating ground displacements via a Kalman filter, a signal processing methodology not common in<br />
seismology or earthquake engineering. The advantage of this new methodology is that it takes the strengths of both, seismic<br />
and geodetic networks in order to provide a more precise record of ground motion from an earthquake, resolving the<br />
problems encountered in the low frequencies of the accelerometer data, which are of great interest in tall structures. In this<br />
study, a Kalman filter is being explored using both GPS and accelerometer earthquake engineering data obtained from two<br />
sources: An earthquake simulation testing at UCSD’s Large High-Performance Outdoor Shake Table, which enables us to<br />
compare the results with the true ground-motion that was simulated, ensuring the Kalman filter’s accuracy and data from the<br />
April 2010 Mw 7.2 El Mayor-Cucapah earthquake to test the method in a real world setting. The goal is to investigate these<br />
new displacement records of strong ground motion to determine if a response spectra of higher accuracy can be developed<br />
across a wider range of frequency values and have a better representation of the effects in low frequency building response<br />
due to strong ground motions.<br />
2011 <strong>SCEC</strong> <strong>Annual</strong> <strong>Meeting</strong> | 225
Poster Abstracts<br />
HOW DOES DAMAGE AFFECT RUPTURE PROPAGATION ACROSS A FAULT STEPOVER? (A-074)<br />
H.M. Savage and M.L. Cooke<br />
We investigate the potential for fault damage to influence earthquake rupture at fault step-overs using a mechanical numerical<br />
model that explicitly includes the generation of cracks around faults. We compare the off-fault fracture patterns and slip<br />
profiles generated along faults with a variety of frictional slip-weakening distances and step-over geometry. Models with<br />
greater damage facilitate the transfer of slip to the second fault. Increasing separation and decreasing the overlap distance<br />
reduces the transfer of slip across the step over. This is consistent with observations of rupture stopping at step-over<br />
separation greater than 4 km (Wesnousky, 2006). In cases of slip transfer, rupture is often passed to the second fault before the<br />
damage zone cracks of the first fault reach the second fault. This implies that stresses from the damage fracture tips are<br />
transmitted elastically to the second fault to trigger the onset of slip along the second fault. Consequently, the growth of<br />
damage facilitates transfer of rupture from one fault to another across the step-over. In addition, the rupture propagates along<br />
the damage-producing fault faster than along the rougher fault that does not produce damage. While this result seems counter<br />
to our understanding that damage slows rupture propagation, which is documented in our models with pre-existing damage,<br />
these model results are suggesting an additional process. The slip along the newly created damage may unclamp portions of<br />
the fault ahead of the rupture and promote faster rupture. We simulate the M7.1 Hector Mine Earthquake and compare the<br />
generated fracture patterns to maps of surface damage. Because along with the detailed damage pattern, we also know the<br />
stress drop during the earthquake, we may begin to constrain parameters like the slip-weakening distance along portions of<br />
the faults that ruptured in the Hector Mine earthquake.<br />
PREPARING TRIAL MODELS OF SPATIAL VARIABILITY IN GEOTECHNICAL VELOCITIES FOR<br />
ASSESSING EFFECTS ON GROUND MOTIONS (B-058)<br />
W.H. Savran and J.N. Louie<br />
The Clark County Parcel Map provides us with a data set of geotechnical velocities in Las Vegas Valley, at an unprecedented<br />
level of detail. Las Vegas Valley is a basin with similar geologic properties to some areas of Southern California. We first<br />
analyze elementary spatial statistical properties of the Parcel Map. We then investigate the same spatial statistics from the<br />
peak ground velocity r226e226s226u226l226t226s226 226c226o226m226p226u226t226e226d226 226f226r226o226m226<br />
226 o 226 n 226 e 226 226 m 226 o 226 d 226 e 226 l 226 226 ( 226 B 226 l 226 a 226 c 226 k 226 226 H 226 i 226 l 226 l 226 s 226<br />
226F226a226u226l226t226)226 226t226h226a226t226 226i226n226c226o226r226p226o226r226a226t226e226 226t226h226e226<br />
226P226a226r226c226e226l226 226M 226a 226p226 226a226s226 226p 226a 226r226a226m226e226t226e226r226s226.226<br />
226 W 226 e 226 226 c 226 o 226 n 226 f 226 i 226 g 226 u 226 r 226 e 226 226 f 226 i 226 n 226 i 226 t 226 e 226 -<br />
226 d 226 i 226 f 226 f 226 e 226 r 226 e 226 n 226 c 226 e 226 226 s 226 e 226 i 226 s 226 m 226 i 226 c 226 226 w 226 a 226 v 226 e 226<br />
226p226r226o226p226a 226g226a226t226i226o226n 226 226m226o226d226e226l226s 226 226a226t 226 2260 226. 2265226<br />
226 H 226 z 226 226 w 226 i 226 t 226 h 226 226 L 226 L 226 N 226 L 226 s 226 226 E 226 3 226 D 226 226 c 226 o 226 d 226 e 226 , 226<br />
226u226t226i226l226i226z226i226n226g226 226t226h226e226 226P226a226r226c226e226l226 226M226a226p226 226a226s226<br />
226i226n226p226u226t226 226p226a226r226a226m226e226t226e226r226s226 226t226o226 226c226o226m226p226u226t226e226<br />
226 a 226 226 P 226 G 226 V 226 226 d 226 a 226 t 226 a 226 226 s 226 e 226 t 226 226 f 226 r 226 o 226 m 226 226 t 226 h 226 e 226<br />
226e 226a226r226t226h226q226u 226a226k 226e 226 226s226c 226e 226n226a 226r226i226o226.226 226 226T226h226e 226<br />
226 r 226 e 226 s 226 u 226 l 226 t 226 i 226 n 226 g 226 226 P 226 G 226 V 226 226 i 226 s 226 226 f 226 r 226 a 226 c 226 t 226 a 226 l 226<br />
226 o 226 v 226 e 226 r 226 226 t 226 h 226 e 226 226 s 226 a 226 m 226 e 226 226 s 226 p 226 a 226 t 226 i 226 a 226 l 226<br />
226f226r226e226q226u226e226n226c226i226e226s226 226a226s226 226t226h226e226 226V226s22632260226 226d226a226t226a226<br />
226s226e226t226s226 226a226s226s226o226c226i226a226t226e226d226 226w226i226t226h226 226t226h226e226i226r226<br />
226 r 226 e 226 s 226 p 226 e 226 c 226 t 226 i 226 v 226 e 226 226 m 226 o 226 d 226 e 226 l 226 s 226 . 226 226 226 T 226 h 226 e 226<br />
226 f 226 r 226 a 226 c 226 t 226 a 226 l 226 226 d 226 i 226 m 226 e 226 n 226 s 226 i 226 o 226 n 226 226 i 226 s 226<br />
226s226y226s226t226e226m226a226t226i226c226a226l226l226y226 226l226o226w226e226r226 226i226n226 226a226l226l226<br />
226o226f226 226t226h226e226 226P226G226V226 226m226a226p226s226 226a226s226 226o<br />
EARTHQUAKE AGES AND DISPLACEMENTS, FRAZIER MOUNTAIN PALEOSEISMIC SITE (A-141)<br />
K.M. Scharer, R.J. Weldon, B.C. Gibson, and A.R. Streig<br />
The Frazier Mountain paleoseismic site is located on a poorly understood section of the southern San Andreas fault, mid-way<br />
between the well-known Carrizo Plain and Mojave sites of Bidart Fan and Pallett Creek. Emerging paleoseismic evidence<br />
indicates that earthquakes along this stretch repeat at a similar pace, with an average interval of ~122 years between A.D. 1000<br />
226 | Southern California Earthquake Center
Poster Abstracts<br />
and 1857. Individual intervals vary considerably, including an interval of ~325 years between the sixth and fifth earthquakes<br />
back, followed by two intervals lasting less than 50 years each. We modeled slip required to gently fold the sediments during<br />
three of the earthquakes with a 2D, optimized trishear inverse model that uses a simulated annealing algorithm. Due to the<br />
orientation of the trenches and broad shape of the folds, the slip estimate (3 m total in 3 events) is a minimum yet indicates an<br />
average magnitude of at least M7 using standard regressions. In combination, paleoseismic evidence appears similar to the<br />
historic record: individual events can be separated by less than 50 or greater than 150 years, and slip data suggest that large<br />
≥M7 events often bridge the Carrizo and Mojave sections of the San Andreas fault.<br />
RATE/STATE FRICTIONAL NUCLEATION AND DYNAMIC RUPTURE ON LOW-STRESS FAULTS WITH<br />
THERMAL WEAKENING EFFECTS (A-095)<br />
S.V. Schmitt, A.M. Bradley, E.M. Dunham, and P. Segall<br />
It is believed that faults sustain large shear stresses during the nucleation phase, but slip at much lower stresses during<br />
earthquakes. Nucleation is typically characterized by rate- and state-dependent friction, in which slip accelerates after shear<br />
stress τ grows to about 0.6 to 0.9 times the effective normal stress σ. During earthquakes, dynamic weakening mechanisms<br />
such as shear heating-induced thermal pressurization of pore fluid and flash heating of asperity contacts allow for slip to<br />
occur at much lower values of τ. Since 0.6σ is ~100 MPa at seismogenic depths with hydrostatic pore pressure, earthquakes<br />
likely nucleate in regions of elevated τ/σ and propagate outward into regions of low τ/σ. Noda & others [JGR, 2009]<br />
investigated this issue with numerical simulations in which they included both flash weakening and thermal pressurization.<br />
They initiated ruptures with a sudden perturbation in τ on a weakly stressed fault. Flash heating quickly dominated the fault<br />
strength, with thermal pressurization contributing a modest amount of additional weakening. Recent work has shown that<br />
thermal pressurization may, however, become the dominant weakening mechanism during quasi-static nucleation, well<br />
before the onset of seismic radiation [Schmitt & others, JGR, 2011]. We present more physically-motivated simulations of early<br />
rupture that model fault weakening mechanisms through nucleation and into the dynamic slip phase. The initial τ/σ<br />
heterogeneities remain idealized, but we now consider two types. The first type is a region of elevated τ with uniform σ, while<br />
the other type has uniform τ with a low-strength region of diminished σ. We use a quasi-static code to model fault slip from<br />
well below steady-state to the early stages of nucleation. Late in nucleation, we switch to a fully dynamic code that otherwise<br />
solves the same equations for friction and coupled thermal effects. Our results indicate that there are differences between<br />
ruptures on high-stress and low-strength heterogeneities. In rate/state frictional nucleation, slip zones capable of accelerating<br />
above steady state have a minimum length dimension L. Heterogeneities must be of greater size than a few L in order to host<br />
instability at low background stress, and since L∝1/σ, nucleation under low strength conditions requires a much larger<br />
heterogeneity. Thermal weakening effects are also affected by the heterogeneity; they are subdued in the low-strength case<br />
because of reduced heating with low τ.<br />
CSEP OVERVIEW (B-117)<br />
D. Schorlemmer, M.C. Gerstenberger, N. Hirata, D.D. Jackson, C. Jiang, T.H. Jordan, W. Marzocchi, K.Z. Nanjo, G. A.<br />
Papadopoulos, D.A. Rhoades, S. Wiemer, Z. Wu, J.D. Zechar, and CSEP Working Group<br />
The Collaboratory for the Study of Earthquake Predictability (CSEP) established 4 earthquake forecast testing centers around<br />
the world. These centers are rigorously testing more than 100 earthquake forecast models in a truly prospective manner.<br />
Centers are operating in Los Angeles (US), Wellington (NZ), Tokyo (JP), and Zurich (CH), covering many different regions<br />
and tectonic environments: California, New Zealand, Western Pacific, Japan, and Italy. Besides new upcoming regional<br />
earthquake forecast testing, CSEP has started a global testing program which is targeting the magnitude range of destructive<br />
earthquakes that are relevant for seismic hazard and risk. This program is the first link in the chain of facilities that aim to test<br />
seismic hazard and risk models and their underlying hypotheses. To complement the current activities, CSEP is developing<br />
methods for assessing the reliability of earthquake early warning algorithms, for understanding the uncertainties and limits of<br />
earthquake source inversions, and for the prospective testing of ground motion prediction models. CSEP researchers are also<br />
working on creating testable models for many seismological hypotheses, e.g. characteristic earthquakes, maximum magnitude<br />
to fault length relation. CSEP is collaborating with large modeling efforts like the Uniform California Earthquake Rupture<br />
Forecast (UCERF3) and the Global Earthquake Model (GEM). We present the ongoing activities and give perspectives for the<br />
future development of CSEP and its global collaboration.<br />
RESULTS FROM THE REGIONAL EARTHQUAKE LIKELIHOOD MODELS EXPERIMENT (B-119)<br />
2011 <strong>SCEC</strong> <strong>Annual</strong> <strong>Meeting</strong> | 227
Poster Abstracts<br />
D. Schorlemmer, J.D. Zechar, M.J. Werner, M.C. Gerstenberger, and D.A. Rhoades<br />
One of the primary objectives of the Regional Earthquake Likelihood Models (RELM) working group was to formalize<br />
earthquake occurrence hypotheses in the form of prospective earthquake rate forecasts for California. RELM scientists<br />
developed more than a dozen time-invariant five-year forecasts for the period 1 January 2006-1 January 2011; they also<br />
outlined a performance evaluation method and provided a conceptual description of a Testing Center in which to perform this<br />
forecast experiments. Subsequently, researchers working within the Collaboratory for the Study of Earthquake Predictability<br />
(CSEP) have begun implementing Testing Centers in different locations worldwide, and the RELM forecast experiment-a truly<br />
prospective earthquake prediction effort-was conducted within the U.S. branch of CSEP. The experiment, designed to<br />
compare this set of forecasts is now complete. Here, we present the forecasts under evaluation and the results of this<br />
experiment. We also evaluate the sample of observed target earthquakes in the context of historical seismicity within the<br />
testing region. Finally, we discuss the implications of the results for California hazard assessment and for further experiments.<br />
228 | Southern California Earthquake Center
ADVANCEMENTS IN PROBABILISTIC SEISMIC NETWORK COMPLETENESS STUDIES (B-126)<br />
D. Schorlemmer<br />
Poster Abstracts<br />
An important characteristic of any seismic network is its detection completeness, which should be considered a function of<br />
space and time. Many researchers rely on robust estimates of detection completeness, especially when investigating statistical<br />
parameters of earthquake occurrence.<br />
We present the Probability-based Magnitude of Completeness (PMC) method for computing the spatial variation and<br />
temporal evolution of detection capability of seismic networks based on empirical data only: phase data, station information,<br />
and the network specific attenuation relation. New developments are extending this method to complex 3D structures like<br />
mining environments.<br />
We present studies of regional networks from California, Switzerland, Italy, Japan, New Zealand, and compare the result with<br />
estimated completeness levels of other methods. We report on the time evolution of monitoring completeness in these regions.<br />
Scenario computations show the impact of different possible network failures and offer estimates of possible network<br />
optimization strategies. Optimizations are reducing the necessary processor time for computing. All presented results are<br />
published on the CompletenessWeb (www.completenessweb.<strong>org</strong>) from which the user can download completeness data from all<br />
investigated regions, software codes for reproducing the results, and publication-ready and customizable figures.<br />
VISUALIZING STRUCTURAL RESPONSE AND SITE AMPLIFICATION USING EARTHQUAKE DATA<br />
RECORDED AT THE NEES@UCSB FIELD SITES (A-024)<br />
S.H. Seale, J.H. Steidl, L.B. Seale, and A. Chourasia<br />
We present animation created with data recorded at the Garner Valley Downhole Array field site (GVDA) from two events.<br />
The two events were both located directly below GVDA. The M3.1 event occurred on 3 June 2011 and the M3.6 event occurred<br />
on 14 June 2011. Both of these events were recorded by all channels in the boreholes at GVDA and on the Soil-Foundation-<br />
Structure-Interaction (SFSI) structure. Animation of the SFSI structure was created with Blender (http://www.blender.<strong>org</strong>/), an<br />
open source 3D content creation suite.<br />
The animation shows distinct characteristics of the braced and unbraced SFSI structure. Resonance of the unbraced roof of the<br />
structure after the arrival of the S-wave can clearly be seen.<br />
The greatest displacements occur in the horizontal plane compared to the vertical component. Rocking modes excited by the<br />
earthquake are also clearly visible. Visualization Services group at the San Diego Supercomputer Center created animation of<br />
the ground excitation. Using data recorded in the boreholes at GVDA, the animation clearly shows the amplification of the<br />
signal in the near surface materials. These visualizations created from actual earthquake data provide new insight into ground<br />
and structural response to strong motion. The animations will be used as teaching tools for college-level engineering courses.<br />
CHARACTERISTICS OF STRONG GROUND MOTION ATTENUATION DURING THE 2010 M7.1 DARFIELD<br />
AND 2011 M6.3 CHRISTCHURCH, NEW ZEALAND EARTHQUAKES (B-021)<br />
M. Segou and E. Kalkan<br />
M7.1 Darfield earthquake, occurred 40 km west of Christchurch on September 4th 2010, and it was followed by another M6.3<br />
event on 21st February 2011. These events had disastrous effects in the city’s center and suburbs within the Canterbury region.<br />
Processed data, corresponding to peak ground acceleration (PGA) and 5% damped spectral acceleration (SA) values at 0.3, 1, 3<br />
s, were used for evaluating the performance of global ground motion prediction equations (GMPEs) to estimate peak and<br />
spectral values. The selected GMPEs are: Graizer and Kalkan (2007 and 2009) (GK07), and Next Generation of Attenuation<br />
(NGA) models of Abrahamson and Silva (2008) (AS08), Boore and Atkinson (2008) (BA08), Campbell and Boz<strong>org</strong>nia (2008)<br />
(CB08), and Chiou and Youngs (2008) (CY08). To rank the relative performance of the GMPEs, we followed a traditional<br />
residual analysis and an information theoretic approach, suggested by Scherbaum et al. (2009). For the Darfield earthquake,<br />
we observed an overestimation of predicted ground motion at short periods (PGA and SA at 0.3 s). The overestimation is<br />
evident in the NGA models at 70 km and beyond, and it is very prominent for the case of CB08 model. The GK07 model<br />
performs as well as the NGA models. For the Christchurch earthquake the overestimation begins around 40 km for all GMPEs,<br />
and it is less pronounced for the GK07 and CY08. At longer periods (SA at 1 s and 3 s), the overall trend of the overestimation<br />
is suppressed, possibly due to large amplitudes of ground motions associated with the basin amplification and Moho<br />
reflection. At 1 s, BA08 and CB08 perform better for distances less than 50 km, than for greater distances. The ranking results<br />
2011 <strong>SCEC</strong> <strong>Annual</strong> <strong>Meeting</strong> | 229
Poster Abstracts<br />
for both events show that the performance of the GK07, BA08 and CY08 models are equal, while the CB08 and AS08 models<br />
show relatively poorer performance.<br />
SURFACE DEFORMATION AND SLIP DISTRIBUTION OF THE 1994 NORTHRIDGE EARTHQUAKE<br />
DETERMINED FROM INSAR (A-041)<br />
C.M. Severson, G.J. Funning, and S.T. Marshall<br />
The January 17, 1994 M6.7 Northridge earthquake occurred in the densely populated suburbs northwest of Los Angeles,<br />
California. Occurring on a previously unknown blind thrust fault, it was the most costly earthquake in United States history<br />
causing 60 deaths and ~20 billion dollars in damage. Since the earthquake, several other blind thrusts have been identified in<br />
the area. In order to quantify the influence, in terms of stress changes, of the Northridge event on surrounding faults, detailed<br />
knowledge of the location, orientation and amount of fault slip is important. Existing Interferometric Synthetic Aperture<br />
Radar (InSAR) models of this earthquake were developed by fitting the pattern of displacements by trial and error, and were<br />
therefore somewhat subjective. In the 15 years since the original studies were published a number of new modeling tools and<br />
community data products have been developed that should enable us to produce more detailed, and robust results.<br />
We measure the coseismic deformation of this earthquake using InSAR. A pair of descending images from the European Space<br />
Agency's ERS-1 satellite, containing the earthquake are processed using the ROI_PAC software, and show uplift of up to ~45<br />
cm centered on 118.508°W, 34.321°N. Using this data, we first employ a nonlinear inversion to determine the parameters of the<br />
single rectangular dislocation that best fits the data. The best-fitting fault has strike: 110°, dip: 40.6° to the southwest, length:<br />
14.2 km, width: 8.5 km, top fault depth: 6.7 km, slip: 2m, and moment: 1.1*1019 Nm. These results are relatively consistent<br />
with other published geodetic work, and the global CMT moment estimate.<br />
However, slip on a single rectangular dislocation does not completely model the observed deformation. Residual deformation<br />
to the west of our best-fitting dislocation suggests that additional fault segments may have ruptured. In order to investigate<br />
this, we solve for a detailed slip distribution for the event in a non-negative least squares sense, using a non-planar triangular<br />
element fault mesh modified from the <strong>SCEC</strong> CFM and the Poly3D code to calculate model displacements. This model shows a<br />
main asperity, with peak slip of ~3 m, bounded at its western edge by a geometrical barrier, a down-dip parallel corrugation<br />
in the fault. Secondary slip of about 0.6 m to the west of this feature is also present, and is the likely source of the residual<br />
deformation in our original single dislocation model.<br />
COSEISMIC SLIP DISTRIBUTION AND HIGH FREQUENCY RADIATION OF THE 2010 MW 7.3 EL MAYOR-<br />
CUCAPAH EARTHQUAKE (B-049)<br />
G. Shao, T.E. Yano, X. Zhao, C. Ji, K.M. Larson, K. Hudnut, and T. Herring<br />
We investigated the slip history of the 2010 Mw 7.3 El Mayor-Cucapah earthquake by jointly inverting near-field strong<br />
motion records, teleseismic broadband waves, long-period surface waves, along with GPS static observations and high rate<br />
GPS waveforms. Our inversion results reveal a complex rupture process of the 2010 event. The rupture initiated at a depth of<br />
7.3 km on a so-called El Mayor-Hardy fault dipping 57 degrees to the east. It first propagated upward along the fault with<br />
dominant normal motions in the beginning 12 s, and then triggered the strike slip on the other two high-angle faults with the<br />
Sierra Cucapah fault in northwest and the Indiviso fault in southeast. The rupture propagated on those three faults<br />
simultaneously and released about 90% of the total seismic moment between 12 s and 40 s. The fault rupture had a total<br />
duration of about 60 s and released a total seismic moment of 1.31×10 20 N.m. Our estimation to the average rupture velocity is<br />
relatively low, only 1.2 km/s. This earthquake is dominated by the right-lateral strike-slip motion but with significant normal<br />
motion below the hypocenter region, resulting a large (31%) CLVD component. The slip distribution on the northwest fault<br />
segment is well constrained by extensive high rate GPS waveforms in California. The heterogeneous rupture on the northwest<br />
segment, changing from oblique motion to pure strike-slip and to oblique motion from the epicenter to the northwest, is<br />
consistent with surface observations. However, the slip distribution on the southeast Indiviso fault is poorly constrained<br />
because of lack of near field observations.<br />
In addition to the finite fault slip model constrained by the low-frequency (> 2s) data, we also study the high frequency<br />
radiation of the 2010 El Mayor-Cucapah by using a recently developed back-propagation method. The novel feature of our<br />
approach is to consider the propagation and radiation difference among stations by computing the deconvolution of<br />
theoretical Green’s functions and to use a stacking approach instead of nonlinear inversions to image high frequency<br />
radiations.<br />
230 | Southern California Earthquake Center
CONSTANT STRESS DROP FITS EARTHQUAKE SURFACE SLIP-LENGTH DATA (B-115)<br />
B.E. Shaw<br />
Poster Abstracts<br />
Slip at the surface of the Earth provides a direct window into the earthquake source. A longstanding controversy surrounds<br />
the scaling of average surface slip with rupture length, which shows the puzzling feature of continuing to increase with<br />
rupture length for lengths many times the seismogenic width. Here we show that a more careful treatment of how ruptures<br />
transition from small circular ruptures to large rectangular ruptures combined with an assumption of constant stress drop<br />
provides a new scaling law for slip versus length which<br />
(1) does an excellent job fitting the data,<br />
(2) gives an explanation for the large crossover lengthscale at which slip begins to saturate, and<br />
(3) supports constant stress drop scaling which matches that seen for small earthquakes.<br />
We additionally discuss how the new scaling can be usefully applied to seismic hazard estimates.<br />
HAS THE RISK OF BIG EARTHQUAKES RECENTLY INCREASED? (B-105)<br />
P.M. Shearer and P.B. Stark<br />
The above-average rate of earthquakes of magnitude 8 and larger in recent years has prompted speculation that this reflects a<br />
true change in the underlying rate of earthquake activity rather than simply expected fluctuations in a homogeneous random<br />
process. Temporal clustering, including aftershock sequences, is well known at regional scales. Similar rate changes at global<br />
scales would have important implications for assessments of seismic hazard and our understanding of how faults interact. We<br />
examine large (magnitude M 7.5 to 9.6) earthquakes in the PAGER and PDE catalogs from 1900 to present. Because local<br />
clustering is not at issue, we decluster the catalog by removing events for which larger earthquakes occur within 3 years and<br />
1000 km. The smoothed (5-yr averaged) annual rate of M ≥ 8 earthquakes has been at a record high roughly since 2004, but<br />
rates have been almost as high before, and the rate of 7.5 ≤ M < 8 earthquakes is close to its historical average. Moreover,<br />
computer simulations show that the recent clustering in large earthquakes is not surprising for a homogeneous process<br />
defined by the observed average occurrence rates. The high recent rates of M ≥ 8 and M ≥ 8.5 earthquakes are expected to<br />
occur at least once during the 111-year history of the catalog.<br />
A more general question is whether the earthquake catalog (after removing local clustering) is statistically distinguishable<br />
from a realization of a homogenous Poisson process. We estimate the p-value (the chance of observing such large<br />
inhomogeneity if seismicity arose from a homogeneous Poisson process) to be 57% for the locally declustered events of M ≥ 8<br />
and 96% for 7.5 ≤ M < 8 events. Thus the evidence against the Poisson hypothesis is quite weak. Although the underlying<br />
process might have changed, the observed fluctuations would not be surprising if seismicity followed a Poisson process with<br />
constant expected rate. It is also difficult to explain why a change in physical processes would increase the rate of the largest<br />
earthquakes but not the rate of smaller earthquakes. This suggests that the global risk of large earthquakes is no higher today<br />
than it has been in the past.<br />
IMPACTS OF STATIC AND DYNAMIC STRESS CHANGES ON TREMOR AND CREEP ALONG THE LOWER-<br />
CRUSTAL SAN ANDREAS FAULT (A-103)<br />
D.R. Shelly, K.M. Johnson, Z. Peng, D.P. Hill, and C. Aiken<br />
Tremor activity along the central San Andreas fault near Parkfield is strongly affected by small stress changes induced by<br />
other earthquakes. Tremor responds both to permanent (static) stress changes from nearby earthquakes as well as to<br />
temporary (dynamic) stresses from passing seismic waves. We examine the impacts of the nearby 2003 M 6.5 San Simeon and<br />
2004 M 6.0 Parkfield earthquakes, as well as triggering by numerous regional and teleseismic earthquakes.<br />
We find major changes in tremor activity rates associated with the nearby earthquakes. For the San Simeon event, this includes<br />
a stress shadow north of Parkfield that persists for about 1 month following the earthquake, consistent with the modeled static<br />
shear stress change. On the other hand, tremor activity following the Parkfield earthquake is increased both north and south<br />
of Parkfield, especially at shallow sources close to the rupture. Again, this behavior is consistent with the static shear stress<br />
imparted by the event. These elevated activity rates persist for more than a year in some places. Together with a growing<br />
understanding of tremor as a reflection of fault creep, these observations allow us to track the spatial and temporal evolution<br />
of lower-crustal afterslip (see Shelly and Johnson, 2011).<br />
2011 <strong>SCEC</strong> <strong>Annual</strong> <strong>Meeting</strong> | 231
Poster Abstracts<br />
Dynamic stresses also produce notable effects on tremor activity, and we observe triggering by regional events as small as M<br />
5.4. While observations of triggering and modulation of tremor during passing surface waves are now relatively common, we<br />
also observe accompanying migration of tremor along the fault. Furthermore, we find that some triggered episodes persist for<br />
hours or days after the waves have passed. We interpret this behavior as reflecting small, prolonged fault creep episodes, also<br />
known as slow slip events. Although the prevalence of this phenomenon in other areas is unknown, we note that since creep<br />
events can trigger earthquakes, this mechanism provides a possible explanation for observations of delayed dynamic<br />
earthquake triggering (see Shelly et al., 2011).<br />
References:<br />
Shelly, D. R. and K. M. Johnson (2011), Tremor reveals stress shadowing, deep postseismic creep, and depth-dependent slip<br />
recurrence on the lower-crustal San Andreas fault near Parkfield, Geophys. Res. Lett., L13312.<br />
Shelly, D. R., Z. Peng, D. P. Hill, and C. Aiken (2011), Triggered creep as a possible mechanism for delayed dynamic triggering<br />
of tremor and earthquakes, Nature Geoscience, 4, 384-388.<br />
HYDROCHEMISTRY OF ACTIVE FAULT ZONES- SALTON SEA, CA AND NORTHERN UTAH (A-019)<br />
K.A. Shervais<br />
We examined 12 mud pots and mud volcanoes in the Salton Sea region and 30 + thermal springs (within a half mile of a fault)<br />
in Northern Utah and Southern Idaho. The following analyses were performed on samples from both locations: GIS, water<br />
composition, gas composition, microbiological influence, and on-going temperature and water level statistics. We then used<br />
geothermometers (equations based on Na-K-Ca values) to examine the predicted temperature maximum each sample reached.<br />
This was cross-referenced with geothermal gradient data to hypothesize the depth from which each sample came for both<br />
Utah an California samples. The on-going temperature data as well as the on-going water level statistics were cross-referenced<br />
with earthquake data in the region to mark any correlation. This temperature and water-level data was also examined to note<br />
any time-dependent trends which will be shown in figures. The last major analysis was the examination of pH over time; pH<br />
in the Salton Sea region seems to be decreasing over the past 20 years at least. Gas sample analysis is currently ongoing;<br />
finding a lab that does the analyses we requested has proved difficult. The ultimate goal, which is currently being examined is<br />
finding commonality between the Utah and California field area with the intent of creating a set of characteristics universal to<br />
water near faults.<br />
3D SIMULATIONS OF DYNAMIC RUPTURE ON ROUGH FAULTS (A-086)<br />
Z. Shi and S.M. Day<br />
Natural faults during their evolution stages manifest varying degrees of geometric complexities over a broad range of scales<br />
spanning from larger-scale features such as branching and segmentation to smaller-scale features such as topographic<br />
variations on the slip surface. At a mic 232 r 232 o 232 s 232 c 232 o 232 p 232 i 232 c 232 232 s 232 c 232 a 232 l 232 e 232 , 232<br />
232s232u 232r 232f232a 232c 232e 232 232r232o 232u232g232h232n232e232s232s232 232a 232f232f 232e 232c232t 232s 232<br />
232t 232h232e232 232f232 r 232i232c232t 232i 232o 232n 232a 232l 232 232 p 232r 232o 232p 232e232r232t 232i 232e 232s 232<br />
232 t 232 h 232 r 232 o 232 u 232 g 232 h 232 232 i 232 t 232 s 232 232 r 232 o 232 l 232 e 232 232 i 232 n 232 232 t 232 h 232 e 232<br />
232d232i232s232t232r232i232b232u232t232i232o232n232 232a232n232d232 232e232v232o232l232u232t232i232o232n232<br />
232 o 232 f 232 232 c 232 o 232 n 232 t 232 a 232 c 232 t 232 232 a 232 r 232 e 232 a 232 s 232 232 o 232 f 232 232 t 232 h 232 e 232<br />
232s232l232i232d232i232n232g232 232s232u232r232f232a232c232e232.232 232A232t232 232a232 232l232a232r232g232e232r232<br />
232 s 232 c 232 a 232 l 232 e 232 , 232 232 t 232 h 232 e 232 232 g 232 e 232 o 232 m 232 e 232 t 232 r 232 i 232 c 232<br />
232i232r232r232e232g232u232l232a232r232i232t232i232e232s232 232o232f232 232t232h232e232 232f232a232u232l232t232<br />
232a 232f 232f 232e232 c 232t 232s 232 232 t 232h 232e 232 232i 232n 232t 232e232r232- 232s 232e 232i232 s 232m 232i 232c 232<br />
232 a 232 n 232 d 232 232 p 232 o 232 s 232 t 232 - 232 s 232 e 232 i 232 s 232 m 232 i 232 c 232 232 s 232 t 232 a 232 t 232 i 232 c 232<br />
232s232t232r232e232s232s232 232d232i232s232t232r232i232b232u232t232i232o232n232 232t232h232a232t232 232i232s232<br />
232r232e232s232p232o232n232s232i232b232l232e232 232f232o232r232 232e232a232r232t232h232q232u232a232k232e232<br />
232 n 232 u 232 c 232 l 232 e 232 a 232 t 232 i 232 o 232 n 232 . 232 232 O 232 u 232 r 232 232 s 232 t 232 u 232 d 232 y 232 , 232<br />
232 h 232 o 232 w 232 e 232 v 232 e 232 r 232 , 232 232 f 232 o 232 c 232 u 232 s 232 e 232 s 232 232 o 232 n 232 232 t 232 h 232 e 232<br />
232 f 232 u 232 n 232 d 232 a 232 m 232 e 232 n 232 t 232 a 232 l 232 232 r 232 o 232 l 232 e 232 232 t 232 h 232 a 232 t 232<br />
232s232u232r232f232a232c232e232 232r232o232u232g232h232n232e232s232s232 232p232l232a232y232s232 232i232n232<br />
232 t 232 h 232 e 232 232 d 232 y 232 n 232 a 232 m 232 i 232 c 232 232p 232 r 232o 232 c 232 e 232 s 232 s 232 e 232 s 232 232 o 232 f 232<br />
232 | Southern California Earthquake Center
Poster Abstracts<br />
233 e 233 a 233 r 233 t 233 h 233 q 233 u 233 a 233 k 233 e 233 233 r 233 u 233 p 233 t 233 u 233 r 233 e 233<br />
233p233r233o233p233a233g233a 233t233i 233o233n 233 233a 233n233d233 233r233e233s233u233l233t233a233n233t233<br />
233 g 233 r 233 o 233 u 233 n 233 d 233 233 m 233 o 233 t 233 i 233 o 233 n 233 233 u 233 s 233 i 233 n 233 g 233<br />
233n233u233m233e233r233i233c233a233l233 233s233i233m233u233l233a233t233i233o233n233s233 233o233f233 2333233D233<br />
233 d 233y 233n 233a 233 m 233i 233c 233 233r 233u 233 p 233t 233 u 233r 233e 233. 233 233 A 233s 233 233h 233a 233v 233e 233<br />
233 b 233 e 233 e 233 n 233 233 s 233 h 233 o 233 w 233 n 233 233 i 233 n 233 233 s 233 e 233 v 233 e 233 r 233 a 233 l 233<br />
233 p 233 r 233 e 233 v 233 i 233 o 233 u 233 s 233 233 2 233 D 233 233 n 233 u 233 m 233 e 233 r 233 i 233 c 233 a 233 l 233<br />
233s233t233u233d233i233e 233s233,233 233d 233y233n233a233m233i233c233 233r233u 233p233t233u233r233e 233s233<br />
233 p 233 r 233 o 233 p 233 a 233 g 233 a 233 t 233 i 233 n 233 g 233 233 a 233 l 233 o 233 n 233 g 233 233 r 233 o 233 u 233 g 233 h 233<br />
233 f 233 a 233 u 233 l 233 t 233 233 s 233 u 233 r 233 f 233 a 233 c 233 e 233 233 c 233 a 233 n 233 233 e 233 x 233 c 233 i 233 t 233 e 233<br />
233h233i233g233h233-233f233r233e233q233u233e233n233c233y233 233r233a233d233i233a233t233i233o233n233 233a233s233<br />
233 t 233 h 233 e 233 y 233 233 a 233 c 233 c 233 e 233 l 233 e 233 r 233 a 233 t 233 e 233 233 a 233 n 233 d 233<br />
233d233e233c233e233l233e233r233a233t233e233 233f233r233o233m233 233i233n233t233e233r233a233c233t233i233o233n233<br />
233 w 233 i 233 t 233 h 233 233 g 233 e 233 o 233 m 233 e 233 t 233 r 233 i 233 c 233<br />
233 i 233 r 233 r 233 e 233 g 233 u 233 l 233 a 233 r 233 i 233 t 233 i 233 e 233 s 233 . 233 233 A 233 l 233 s 233 o 233<br />
233 p 233 e 233 r 233 t 233 u 233 r 233 b 233 a 233 t 233 i 233 o 233 n 233 233 o 233 f 233 233 l 233 o 233 c 233 a 233 l 233<br />
233 d 233 y 233 n 233 a 233 m 233 i 233 c 233 233 s 233 t 233 r 233 e 233 s 233 s 233 233 d 233 u 233 e 233 233 t 233 o 233<br />
233 r 233 o 233 u 233 g 233 h 233 n 233 e 233 s 233 s 233 233 c 233 o 233 n 233 t 233 r 233 i 233 b 233 u 233 t 233 e 233 s 233 233 t 233 o 233<br />
233 t 233 h 233 e 233 233 h 233 e 233 t 233 e 233 r 233 o 233 g 233 e 233 n 233 e 233 o 233 u 233 s 233<br />
233d233i233s233t233r233i233b233u233t233i233o233n233s233 233o233f233 233s233l233i233p233 233r233a233t233e233<br />
233a233n233d233 233s233l233i233p233 233o233v233e233r233<br />
GENERATING STOCHASTIC SOURCE MODELS USING INSIGHTS FROM LABORATORY EARTHQUAKES<br />
(B-016)<br />
H. Siriki and S. Krishnan<br />
We present a method for generating a suite of stochastic source models for high magnitude (Mw 6.0 - 8.0) strike-slip<br />
earthquakes. Slip, rupture-velocity & rise-times across the 2-D fault area are parameters that define these models. Laboratory<br />
earthquakes by Mello et al. & Lu 2008 point to two preferred rupture velocities, one in the sub-Rayleigh regime (~ 0.87* Vs) &<br />
the other in the super-shear regime (~ 1.414* Vs), depending upon the initial level of pre-stress on the fault. To determine the<br />
rupture velocity in our model, we calculate pre-stress across the fault using the orientation between fault plane & maximum<br />
principal stress. The orientation is calculated as average of stochastic realizations of a distribution fit to data from the World<br />
Stress Map project. We generate slip distributions based on a hierarchy model in which the rupture area is divided into two<br />
sub-segments (here on referred to as sub-seg) recursively until a dimensional aspect-ratio close to 1.0 is reached for each subseg.<br />
Each sub-seg is discretized into a number of smaller sub-faults. Slip values are assigned randomly to sub-faults using a<br />
Gaussian distribution with a mean equal to the average-slip of its sub-seg. The standard deviation (s.d.) for the distribution is<br />
calculated from seismic-moment (mo) of its corresponding sub-seg using a relation between s.d & mo. We developed this<br />
relation with data from finite-source models (inversions) of historic earthquakes. A filter is applied to smooth the distribution<br />
of slip across the fault thus preventing any drastic variations in the values of slip between intermittent points. We calculate<br />
rise-time for each sub-fault using slip to rise-time ratios that are generated as linearly independent realizations of a probability<br />
model for these ratios. This model is inferred from the aforementioned laboratory earthquake measurements. We select only<br />
those stochastic source models such that the 1-D power spectral density along strike & dip decays as a power (2.0-4.0, Lavallee<br />
et al. 2006) of wave number. We discard the source model if this condition is not satisfied. We have written a program that<br />
unifies all the aforementioned process & generates stochastic source models that could be used to address uncertainties about<br />
future earthquakes. We will use the ground motions generated from these source-models to quantify the risk to tall buildings<br />
(sensitive to long-period ground motions) from San Andreas earthquakes over the next 30 years<br />
SEISMICALLY DAMAGED REGOLITH AS SELF-ORGANIZED FRAGILE GEOLOGICAL FEATURE (B-001)<br />
N.H. Sleep<br />
Repeated strong earthquakes damage shallow brittle regolith reducing its shear modulus to a value where little Coulomb<br />
failure occurs at the peak ground velocity (PGV) in later strong earthquakes. The shear modulus (and S-wave velocity) as a<br />
function of depth thus evolve to the value where the rock just exceeds its Coulomb elastic limit in typical strong strain events.<br />
Near-field dynamic motion of strike-slip faults is amenable to scaling relationships. Type A velocity pulses of Makris and<br />
2011 <strong>SCEC</strong> <strong>Annual</strong> <strong>Meeting</strong> | 233
Poster Abstracts<br />
Black (2004) last over a second. Motion is mostly horizontal and fault parallel as with a Love wave. Deep stiff rocks determine<br />
the dynamic strain in the shallow regolith; the deep dynamic strain is the measured particle velocity (PGV) divided by the<br />
deep S-wave velocity. The shallow dynamic stress is the shallow shear modulus times the dynamic strain. Dynamic shear<br />
traction exists on vertical planes all the way to the surface. Coulomb failure thus occurs at shallow depths where the rock is<br />
sufficiently stiff with the imposed strain. S-wave velocities in sandstone near Cajon Pass (Anderson et al.) increase with depth<br />
as expected for dynamic strain of 1.e-3 and 2 m/s dynamic velocity (PGV). Such damage may trigger observed downslope<br />
sackung movement near Wrightwood on modest 19° slopes. Conversely, shallow stiff intact rocks indicate that strong shaking<br />
(high PGV) did not occur.<br />
<strong>SCEC</strong> UCVM – UNIFIED CALIFORNIA VELOCITY MODEL (B-129)<br />
P. Small, P. Maechling, T. Jordan, G. Ely, and R. Taborda<br />
The <strong>SCEC</strong> Unified California Velocity Model (UCVM) is a software framework for a state-wide California velocity model.<br />
UCVM provides researchers with two new capabilities: (1) the ability to query Vp, Vs, and density from any standard regional<br />
California velocity model through a uniform interface, and (2) the ability to combine multiple velocity models into a single<br />
state-wide model. These features are crucial in order to support large-scale ground motion simulations and to facilitate<br />
improvements in the underlying velocity models.<br />
UCVM provides integrated support for the following standard velocity models: <strong>SCEC</strong> CVM-H, <strong>SCEC</strong> CVM-S and the CVM-SI<br />
variant, USGS Bay Area (cencalvm), Lin-Thurber Statewide, and other smaller regional models. New models may be easily<br />
incorporated as they become available. Two query interfaces are provided: a Linux command line program, and a C<br />
application programming interface (API). The C API query interface is simple, fully independent of any specific model, and<br />
MPI-friendly. Input coordinates are geographic longitude/latitude and the vertical coordinate may be either depth or<br />
elevation. Output parameters include Vp, Vs, and density along with the identity of the model from which these material<br />
properties were obtained.<br />
In addition to access to the standard models, UCVM also includes a high resolution statewide digital elevation model, Vs30<br />
map, and an optional near-surface geo-technical layer (GTL) based on Ely’s Vs30-derived GTL. The elevation and Vs30<br />
information is bundled along with the returned Vp,Vs velocities and density, so that all relevant information is retrieved with<br />
a single query. When the GTL is enabled, it is blended with the underlying crustal velocity models along a configurable<br />
transition depth range with an interpolation function.<br />
Multiple, possibly overlapping, regional velocity models may be combined together into a single state-wide model. This is<br />
accomplished by tiling the regional models on top of one another in three dimensions in a researcher-specified order. No<br />
reconciliation is performed within overlapping model regions, although a post-processing tool is provided to perform a<br />
simple numerical smoothing. Lastly, a 3D region from a combined model may be extracted and exported into a CVM-Etree.<br />
This etree may then be queried by UCVM much like a standard velocity model but with less overhead and generally better<br />
performance due to the efficiency of the etree data structure.<br />
POTENTIAL MAGNITUDE DEPENDENT QUIESCENCE PRIOR TO THE NORTHRIDGE EARTHQUAKE (B-<br />
031)<br />
D.E. Smith and S.I. Sacks<br />
Seismic quiescence 1-3 years prior to the mainshock is observed for several major Japanese earthquakes including the 1982<br />
Urakawa-Oki quake [Taylor et al., 1992] and the 1994 Hokkaido-Toho-Oki quake [Takanami et al., 1996]. Quiescence is<br />
magnitude and location dependent, where the region surrounding the future rupture becomes significantly depleted in Mw<br />
>3.0 earthquakes a few years prior to the event. Within the future mainshock region, smaller magnitude quakes become more<br />
abundant at a slightly later time.<br />
In this study, we observe a magnitude dependent quiescence signal with the relatively high stress drop 1994 Northridge<br />
earthquake. However, when we apply the same quiescence detection procedure to the lower stress drop 2010 Laguna Salada<br />
earthquake, we find a null result.<br />
We compare these two recent CA earthquakes to the 1982 Urakawa-Oki earthquake. For Urakawa-Oki, Mw >3.0 earthquakes<br />
in the surrounding region start to vanish approximately 2 years before the mainshock, and small magnitude events in the fault<br />
core increase about 1 year prior to the mainshock. For Northridge, a quiescence signal begins approximately 7 years prior to<br />
the mainshock for Mw >3.0 events. Small magnitude events near the future fault rupture increase about 3-4 years prior to the<br />
234 | Southern California Earthquake Center
Poster Abstracts<br />
mainshock, but the signal is less well resolved than Urakawa-Oki. For Laguna Salada, no magnitude dependent seismic<br />
quiescence is observed; however, approximately 3-4 years before the earthquake, seismicity increases in the fault core region<br />
across many magnitudes.<br />
The physics of dilatancy theory [Nur, 1972; Whitcomb et al., 1973; Scholz et al., 1973] is proposed as an explanation for seismic<br />
quiescence [Takanami et al., 1996; Scholz, 2000]. As the fault is loaded toward failure and stress increases, if stress is<br />
sufficiently high, the rock can begin to dilate. As dilation causes an increase in the rock volume, pore pressure decreases,<br />
effective normal stress increases, and the fault core strengthens [Rice, 1975]. Because the fault core supports more of the stress,<br />
seismicity of the surrounding region will decrease, which is consistent with seismic quiescent observations for Urakawa-Oki<br />
or Northridge. Over time (~2-20 years) the water will percolate back into the fault core from the surrounding region. Pore<br />
pressure in the fault core increases again, normal stress decreases, and failure is encouraged.<br />
STRESS DROP VARIATIONS OF THE SAN ANDREAS FAULT, MOJAVE SEGMENT, OVER THE LAST 2000<br />
YEARS (A-146)<br />
T. Solis and B. Smith-Konter<br />
There is significant evidence suggesting that repeating earthquakes on a single fault segment are not periodic in time nor do<br />
they generate equivalent amounts of coseismic slip or stress drop. Earthquake cycle models also show that stress accumulation<br />
and stress drop are a complex function of space and time. In this study we investigate earthquake cycle stress variations from<br />
(1) a 3-D viscoelastic crustal deformation model and (2) paleoseismic slip measurements, where stress drop is traditionally<br />
estimated using the ratio of the coseismic fault slip to an appropriate scale length (fault length, fault depth, or a combination of<br />
these). Here we focus on the Wrightwood paleoseismic site, located along the Mojave segment of the San Andreas fault and<br />
use published slip estimates from 15 paleo-events to calculate a sequence of stress drops over the last 2000 years. Resulting<br />
paleoseismic slip-derived stress drops range from ~0.2-1.7 MPa (std 0.49 MPa) assuming a scale length representing the alongstrike<br />
fault length. Using the 3-D model, we simulate 14 earthquake cycles of interseismic stress accumulation, coseismic stress<br />
drop, and postseismic stress relaxation from the same paleoseismic dataset, assuming a constant slip rate of 33 mm/yr and a<br />
stress drop to zero for each event. Model-derived stress drops range from 0.2-2.5 MPa (std 0.7 MPa). In the model, the stress<br />
field is distributed along the fault depth and is influenced by postseismic relaxation and neighboring fault interactions, which<br />
may contribute to the stress drop differences. To better approximate the pattern of paleoseismic stress drops and further<br />
investigate the implications of such variations at Wrightwood, we develop a model with slip rates that are adjusted over each<br />
earthquake cycle to match the recorded paleoseismic offsets. This model yields a stress drop pattern coincident with the<br />
paleoseismic data, but with larger magnitudes, ranging from 0.1-3.2 MPa (std 0.94 MPa). A better match to this model is<br />
provided by paleoseismic stress drops calculated using a characteristic scale length that reflects both the fault depth and<br />
length. While there is no obvious stress threshold for which Mojave segment earthquakes rupture, it does seem that all stress<br />
drops have been relatively small and large variations in slip rate are required to reproduce the paleoseismic data. Current<br />
work is aimed at applying this method to several other fault segments of the SAF with a rich paleoseismic history.<br />
EFFECTS OF PARAMETERIZATION ON FINITE SOURCE INVERSIONS WITH DENSE LOCAL DATA (B-<br />
057)<br />
S. N. Somala, J. -P. Ampuero, and N. Lapusta<br />
The recent 2011 M9 Tohoku, Japan, earthquake was recorded by thousands of sensors at near-fault distance, orders of<br />
magnitude more than previous earthquakes. This event provides a unique opportunity to obtain high resolution images of<br />
earthquake rupture processes. Current projects of network densification, based on low-cost sensors or on remote sensing, aim<br />
at obtaining even denser coverage of future earthquakes. In order to enable the exploitation of such immense amounts of data<br />
we are developing a scalable source inversion procedure based on time-reversal adjoint inversion. We study in great detail a<br />
synthetic earthquake scenario of a vertical strike-slip fault embedded in an elastic, isotropic, homogenous half-space, with<br />
very dense data sampled every 100 m on the free surface, at near source distances, but limited to frequencies lower than 1 Hz.<br />
We adopt the linear formulation of the source inversion problem, in terms of slip rate. An iterative finite source inversion<br />
procedure is performed, involving one time-reversal (adjoint) and one forward simulation in each iteration. The finite<br />
frequency band of the data imposes a resolution limit on the source inversion. We explore the question of the optimal<br />
resolution length scale of the source parameterization. Upon inverting for localized (Gaussian) sources at several depths, we<br />
determine that a length scale of the order a few kms represents the data (f
Poster Abstracts<br />
resolutions. Overall, coarsely parameterized source reduces storage drastically, though a gain in computational time requires<br />
an equivalent coarsening of the data, and the mean slip during the adjoint iterations converges towards the mean slip of the<br />
true source (projected in the coarser mesh) in about 9 iterations.<br />
DEVELOPING A PHYSICS-BASED RUPTURE MODEL GENERATOR BASED ON 1-POINT AND 2-POINT<br />
STATISTICS OF KINEMATIC SOURCE PARAMETERS (B-002)<br />
S. Song<br />
A finite-fault earthquake rupture model generator (SongRMG, Ver 1.0) has been developed, based on 1-point and 2-point<br />
statistics of key kinematic source parameters such as slip, rupture velocity, slip velocity and duration. 1-point statistics define<br />
a marginal probability density function for a certain source parameter at a given point on a fault. 2-point statistics, i.e. autoand<br />
cross-coherence between source parameters, control the heterogeneity of each source parameter and their coupling,<br />
respectively. Sequential Gaussian simulation with simple kriging (SK) was initially adopted to perform stochastic modeling<br />
(Song and Somerville, 2010), but it was replaced with a new algorithm based on the Cholesky factorization because it is<br />
conceptually simpler to implement and also more closely linked to earthquake source inversion in the Bayesian framework,<br />
which is an important tool in constraining the 1-point and 2-point statistics of source parameters from data. Currently the 1point<br />
variability of source parameters follows the Gaussian distribution, but it is straightforward to transform it to any other<br />
non-Gaussian distributions if desired. This transform will break the multi-Gaussian distribution assumed in the stochastic<br />
modeling, but the target covariance matrix (or correlation structure) will be preserved as long as the transformed distribution<br />
has a monotonically and smoothly increasing cumulative density function (CDF). The non-stationarity of the 1-point statistics<br />
can also be easily implemented if necessary, such as depth dependency of the 1-point variability. Following studies will focus<br />
on constraining input parameters in the stochastic model by dynamic rupture modeling, kinematic source inversion, and<br />
laboratory experiments, etc., and understanding their effects on near-fault ground motion characteristics. Additionally since<br />
the rupture model generator constrains a possible range of rupture scenarios for future events and quantify their variability<br />
within the range, it can be used as a basis to develop an extended earthquake rupture forecast model (eERF) for fullwaveform-simulation-based<br />
hazard analysis.<br />
236 | Southern California Earthquake Center
Poster Abstracts<br />
PLATE TECTONICS: A NEWLY COMPLETED EXHIBIT IN THE SAN BERNARDINO COUNTY MUSEUM’S<br />
HALL OF GEOLOGICAL WONDERS (A-028)<br />
K. Springer, E. Scott, and J.C. Sagebiel<br />
The San Bernardino County Museum (SBCM) in Redlands, California is completing a suite of exhibits in our new Hall of<br />
Geological Wonders. One of the first to be realized is “Plate Tectonics”. Throughout the Hall, the theme imbued in every<br />
exhibit is the process of science, inviting visitors to ask us “How do we know?” In that vein, we have positioned the theory of<br />
Plate Tectonics as the bedrock for all modern geologic studies and its development of the theory as one of the best examples of<br />
the scientific method. We initially introduce plate tectonics to the public in a series of quotations, ideas and observations of the<br />
earth from the likes of Aristotle, Native Americans, Darwin and Ben Franklin. The scientific method is introduced, explaining<br />
that scientific inquiry strives to understand how things work, objectively and without bias. The exhibit then seques to quotes<br />
from Wegener, Longwell, and Hess, finally culminating in “The Lines of Evidence”, displayed as a touchable scaled giant<br />
bronze globe of the Earth’s topography along with mini globes that discuss continental drift (its rock and fossil evidence), seafloor<br />
spreading and paleomagnetism, culminating in the unified theory of plate tectonics.<br />
“Plate Tectonics” is the scaffolding for a suite of future exhibits on earthquake science that reveal the origin of southern<br />
California’s striking topography and our most notorious geologic feature, the San Andreas fault system, as the culprit. Visitors<br />
will observe the San Andreas Fault zone from our “Earth's Cylinder” – below ground in a re-created paleoseismic trench<br />
across the fault, exhibited next to a Pallet Creek and a Wrightwood fault peel, and above ground from a viewing tower.<br />
Visitors will experience a simulated earthquake in our immersive “ShakeOut Cabin”, while receiving earthquake<br />
preparedness information. These exhibits explore the importance of science in everyday life, emphasizing science as a process<br />
and encouraging visitors to become a part of this process. “Did You Feel It?” and the “Quake Catcher Network” are<br />
interactives that simulate a real-time earthquake experience in a museum exhibit setting, and the “Active Earth” touch-screen<br />
kiosk provides nested online information on earthquake science. Additionally, a video of <strong>SCEC</strong> researchers will inspire<br />
visitors to explore science. This collection of exhibits will provide a unique introduction to scientific inquiry, earthquake<br />
science and earthquake preparedness for our visitors.<br />
A NEW AGE CONSTRAINT FOR A NEAR-FAULT PRECARIOUS LANDFORM IN CENTRAL OTAGO, NEW<br />
ZEALAND (B-099)<br />
M. Stirling, D. Rood, G. Balco, and A. Zondervan<br />
In recent years, studies of precariously balanced rocks (PBRs) in New Zealand were focused on age determinations of features<br />
at near-fault sites. Until recently, efforts to interpret exposure ages from Be-10 data on PBRs in central Otago, an area with an<br />
equivalent climate to that of coastal central-to-northern California, were unable to resolve whether the rocks are of the order<br />
10 3 -10 4 or 10 4 -10 5 years of age. Resolution of these age differences is critical to determining the utility of PBRs for constraining<br />
seismic hazard models at long return periods. Reinterpretation of cosmogenic Be-10 data for “Clyde 6”, a near-fault PBR that<br />
has had eight Be-10 analyses undertaken in recent years (and three additional analyses on nearby outcrops), is possible using<br />
the methodology of Balco et al (2011). Samples collected from a vertical profile are used to interpret the rate of exhumation<br />
and thus an age for the PBR. The dating method combines measured Be-10 concentrations with a numerical model that<br />
accounts for nuclide production before, during, and after exhumation of the PBR from the subsurface. A three-dimensional<br />
model constructed from photogrammetry is used to correct for the shielding of cosmic rays due to the shape of the feature.<br />
Using all 8 Be-10 samples from Clyde 6 (and assuming zero rock erosion since exhumation), the results suggest that the<br />
“tipping age” (time at which the rock was exhumed and free to topple) is ~40 ka. The best fit model is fairly well fit to<br />
observed Be-10 concentrations, except for one sample; however, the misfit for this sample can be reduced if modest postexhumation<br />
rock erosion (e.g. spalling) occurred at this sample location. The results also suggest that the feature sat in the<br />
subsurface for a long time period, consistent with the site being part of an exhumed Tertiary peneplain (i.e., a landform<br />
characterised by low rates of erosion). The interpreted age of Clyde 6 allows 4-6 Dunstan Fault earthquakes to have occurred<br />
since the rock was exhumed. Combined with the fragility of the feature (alpha=6 degrees), these data suggest that ground<br />
motions in these earthquakes did not exceed 0.11-0.14g (Stirling and Anooshehpoor, 2006) at this site.<br />
2011 <strong>SCEC</strong> <strong>Annual</strong> <strong>Meeting</strong> | 237
Poster Abstracts<br />
THE EFFECTS OF STATIC COULOMB, NORMAL AND SHEAR STRESS CHANGES ON EARTHQUAKE<br />
OCCURRENCE IN SOUTHERN CALIFORNIA (B-103)<br />
A.E. Strader and D.D. Jackson<br />
Deng & Sykes (1997) found a strong correlation between receiver earthquake location and positive increase in Coulomb stress<br />
(ΔCFF). Assuming a coefficient of friction of 0.6, and resolving stresses onto assumed fault planes with uniform orientation<br />
parallel to average Pacific-North American plate motion, they found that only 15% of receiver earthquakes occur in “stress<br />
shadows” where the Coulomb stress change should impede faulting. We extended their study by adding two source<br />
earthquakes (Hector Mine, 1999 and El Mayor-Cucupah, 2010), and calculating the stress changes at the locations of 134<br />
receiver earthquakes with magnitude 4.4 and greater after 1999. We examined shear stress, normal stress, and Coulomb stress,<br />
resolving stresses onto four different hypothetical fault planes: optimally oriented planes, a weighted average of nearby faultplane<br />
orientations, and the two nodal planes of weighed average moment tensors of nearby earthquakes. We also computed<br />
shear, normal, and Coulomb stress histories oriented according to the four choices of fault orientation., and we tested the<br />
effect of total stress change on receiver earthquake magnitude.<br />
Our chi square test results indicate that, with 95% confidence, receiver earthquakes do not tend to avoid stress shadows, and<br />
that the choice of plane onto which stress is resolved does not affect the result. On average, 39% of earthquakes occur at the<br />
time of maximum stress at the event location, with no significant variation depending on the choice of rupture plane or type of<br />
stress change. We found no correlation between earthquake magnitude and total stress change at the events’ locations. These<br />
results suggest that instantaneous cumulative Coulomb stress, as we and Deng & Sykes modeled it, does not strongly control<br />
the locations of future earthquakes. The lack of correlation between Coulomb stress change and magnitude suggests that<br />
modeled Coulomb stress change does not control the size of earthquakes once they nucleate.<br />
EVALUATING THE RELATIONSHIP BETWEEN LATERAL SLIP AND REPEATED FOLD DEFORMATION<br />
ALONG A TRANSTENSIVE STEP-OVER ON THE SAN ANDREAS FAULT AT THE FRAZIER MOUNTAIN<br />
SITE (A-139)<br />
A.R. Streig and R.J. Weldon<br />
Transtensive step-overs known as sags are among the most ubiquitous features of strike slip faults. These structures create<br />
closed depressions that collect sediment, are often wet and thus preserve <strong>org</strong>anic material that can be used to date the section.<br />
It is clear from historical ruptures that these depressions grow incrementally with each earthquake. We are developing<br />
methods to carefully document and separate individual folding events, and to relate the amount of folding to the amount of<br />
horizontal slip creating the sag, with the goal of generating slip per event chronologies. This will be useful as sags are often the<br />
best sites for preserving evidence of earthquake timing, and determining slip at these sites will eliminate ambiguity inherent<br />
in tying earthquake age data from micro-stratigraphic sites to nearby undated sites with good micro-geomorphic slip evidence.<br />
We apply this approach to the Frazier Mountain site on the Southern San Andreas fault.<br />
Approximately 20 trenches show the main active trace of the San Andreas fault right stepping ~30 m over ~100 m along strike<br />
producing two small synclinal sags that dramatically thicken the stratigraphic section. The northwest sag is about 50 m long,<br />
15 m wide, and the southwest sag measures 20 m long and 8 m wide. Frazier has yielded good earthquake chronologies, and<br />
relationships between fold deformation and surface fault rupture for the last 6 earthquakes. We observe that the degree of<br />
sagging in the synclines varies along strike for each feature, but that the ratio of fold deformation between earthquake<br />
horizons remains constant in both sags. The penultimate earthquake, E2, produced a depression that was infilled by gravel<br />
which was subsequently folded in the most recent earthquake in 1857. Fine-grained alluvial units overlie the gravel and fill the<br />
1857 depression such that the current surface is relatively horizontal. E2 has double the observed folding associated with the<br />
1857 event in the core of the NW syncline. Ratios of fold deformation between events are E2 = 2*E1, E6 = 3*E2, and E6 = 2*E3.<br />
We plan to model the folding to quantitatively assess the lateral offset, but to date we have only been able to establish<br />
minimum offset values (Scharer, Gibson, Weldon, Streig, this meeting). Qualitatively, the relative amounts of folding suggest<br />
all slip events are similar to 1857, which had ~5 meters slip at this site.<br />
238 | Southern California Earthquake Center
Poster Abstracts<br />
THE MECHANICS OF EARTHQUAKES AND FAULTING IN THE SOUTHERN GULF OF CALIFORNIA (B-<br />
032)<br />
D.F. Sumy, J.B. Gaherty, W.-Y. Kim, and T. Diehl<br />
Accurate earthquake locations and their focal mechanisms can illuminate the distribution and mode of deformation at rifted<br />
continental margins. The Pacific-North America plate boundary within the Gulf of California (GoC) provides an excellent<br />
opportunity to explore such rifting, as continental extension in the north transitions to seafloor spreading in the south. From<br />
October 2005 to October 2006, an array of fourteen four-component ocean-bottom seismographs were deployed in the GoC to<br />
record earthquakes and other natural seismic signals as part of the Sea of Cortez Ocean-Bottom Array (SCOOBA) experiment.<br />
By combining the data from this deployment with that from the on-shore NARS-Baja array, we detect and locate ~700<br />
earthquakes (Mw 2.5-6.6) mainly located on the NW-SE striking transform faults that delineate the plate boundary. The<br />
earthquakes occur mainly during short-term swarm events that cluster predominantly around the inside corner of ridgetransform<br />
intersections, with events occurring on both the strike-slip and normal faults within the system. We use the<br />
waveforms of 31 events with high signal-to-noise long-period Rayleigh waves (Mw 3.45-4.92) to calculate regional deviatoric<br />
moment tensors and determine the focal mechanisms of these earthquakes. Most of these events exhibit right-lateral strike-slip<br />
focal mechanisms along the transform faults; however, several oblique and rotated mechanisms reveal a more complex<br />
structure within the gulf. In addition, we capture a swarm of events on Baja California along an apparent right-lateral NW-SE<br />
striking fault, which may be evidence of an extension of the Carmen fracture zone across the Baja California peninsula. A<br />
calculation of seismic coupling using data from global earthquake catalogs combined with our dataset illuminates regions of<br />
active deformation along broad regions of the gulf and individual transform segments, respectively. The combination of highresolution<br />
earthquake locations, with the broad distribution of event focal mechanisms and an estimate of seismic coupling<br />
improves our understanding of the distribution of seismic deformation within the greater extensional zone in the southern<br />
GoC.<br />
USING STRUCTURAL CONSTRAINTS ON THE LITTLE SAN BERNARDINO MOUNTAINS TO<br />
PETROLOGICALLY AND GEOCHEMICAL ANALYZE THE CRUSTAL VELOCITY MODEL OF SOUTHERN<br />
CALIFORNIA. (B-130)<br />
C. Symcox and A. Barth<br />
Recent years have seen great advances in subsurface velocity model data stemming from an increased density and<br />
sophistication of global seismic networks, resulting in improved models of crustal structure. Crustal velocity models are<br />
critical for accurately calculating earthquake hypocenters and understanding how crustal architecture influences the<br />
development of faults. Using a tilted crustal cross section in the Little San Bernardino Mountains, we aim to compare what we<br />
see petrologically and geochemically in the region to the CVMH, a crustal velocity model created by the Southern California<br />
Earthquake Center (<strong>SCEC</strong>) and Harvard. Our focus is predominantly two-fold: to finding the “average” rock that best<br />
describes the crust in the region by comparing the data provided in the CVMH to what we see on the ground knowing the<br />
convenient structural architecture of the region, and to search out inconsistencies between what is seen in the velocity model<br />
and what geologists see in outcrop. Other focuses in the coming weeks may include analyses of crystal structure and<br />
composition, anisotropy, and radiogenic heat production to compare what we see geologically in the rock to what the CVMH<br />
tells us what we should see.<br />
REAL TIME GEODETIC EARLY WARNING SYSTEM FOR EARTHQUAKES (A-037)<br />
H. Tahtinen, Y. Bock, B.W. Crowell, D. Melgar, and M.B. Squibb<br />
Every second, new positions are calculated for all GPS stations within the California Real Time Geodetic Network<br />
(http://sopac.ucsd.edu/projects/realtime/). When a medium or large earthquake does occur in the region, the displacements will be<br />
quite visible in the recorded data in all three directions (north, east, up or x, y, z). We report on a redesign of our processing<br />
methodology by using Delaunay Triangulation to break up the large network of GPS sites (~100) can be broken into subnetworks<br />
each of which contain one reference station and two moving stations; in conjunction with the network redesign. The<br />
principal components of 2-D strain rate are computed for each triangle. If strain exceeds a pre-set threshold, a network<br />
adjustment is performed to reconstitute the entire network; this process detects and extracts outliers and references the<br />
positions of all sites with respect to the coordinates of a single CRTN site. The study area contains two networks, one in<br />
northern California including BARD (http://seismo.berkeley.edu/bard/) and PBO (http://pboweb.unavco.<strong>org</strong>/?pageid=107) sites, while<br />
the other is in southern California. The reason to have a network that covers such a large spatial extent is because when an<br />
earthquake initiates, the rupture will be able to be observed from its start to end along many possible faults, in particular the<br />
2011 <strong>SCEC</strong> <strong>Annual</strong> <strong>Meeting</strong> | 239
Poster Abstracts<br />
San Andreas fault system, and an earthquake early warning can be issued. We show results from the southern Californian<br />
CRTN sites during the 2010 Mw 7.2 El Mayor-Cucapah earthquake. The data collected showed significant ground motions in<br />
the Imperial Valley a few seconds after the initial earthquake and for a few minutes, the movement reverberated across all of<br />
southern California (Bock et al., 2011). The SOPAC group is working on rapid determination of earthquake location,<br />
magnitude and fault plane using the site displacements computed by the network adjustment (Crowell et al., 2009; Melgar et<br />
al., 2011).<br />
MECHANICS OF STRESS TRANSFER FROM PLATE MOTION TO PLATE BOUNDARY FAULTS: DYNAMIC<br />
MODELS OF EARTHQUAKE CYCLES ON A STRIKE-SLIP FAULT (B-146)<br />
C.S. Takeuchi and Y. Fialko<br />
Existing models of interseismic deformation are predominantly kinematic: loading is applied by prescribing slip on<br />
dislocations, either at a constant rate below the seismogenic layer (the Savage-Burford model) or quasi-periodically in the<br />
seismogenic layer on top of a viscoelastic substrate (the Elsasser model). These loading mechanisms are not physically<br />
consistent. In particular, kinematic viscoelastic cycle models produce absolute stresses on the seismogenic fault that are<br />
opposite to the sense of tectonic loading. We consider dynamic (stress-controlled) models of strike-slip faults that are driven<br />
by far-field tractions due to relative plate motion. We use antiplane strain finite element models to simulate quasi-periodic<br />
earthquakes on a fault in a brittle crust underlain by a viscoelastic medium. Each model is driven by far-field plate motion at a<br />
rate of 4 cm/yr, similar to the San Andreas Fault (SAF) in California. Slip occurs when the shear stress on the fault exceeds a<br />
prescribed threshold. We analyze stresses, strain rates, and surface deformation for models assuming various rheologies of a<br />
ductile substrate, including a) linear Maxwell rheology, b) power law temperature dependent rheology assuming a given<br />
linear geotherm, and c) power law temperature dependent rheology with thermo-mechanical coupling. The latter class of<br />
models gives rise to a permanent localized shear zone due to the interaction of viscous dissipation and heat conduction. An<br />
initial temperature perturbation is generated via a kinematically-driven thermal “maturation” of the fault at a constant slip<br />
rate over “geological” (millions of years) time scales. Strain localization in the power law viscoelastic medium due to thermomechanical<br />
coupling is used as a proxy for all strain-weakening mechanisms (including e.g. grain-size reduction). Simulations<br />
are performed for “dry” and “wet” rheological endmembers for the viscoelastic substrate. We compare the predicted surface<br />
velocities and strain rates to available observations from the SAF. We find that a dry temperature-dependent power law<br />
rheology best reproduces time-dependent surface deformation and generates reasonable deviatoric stresses in the crust and<br />
upper mantle.<br />
STATIC DISPLACEMENTS COMPUTED FROM SEISMIC WAVEFIELD SIMULATIONS: VALIDATION<br />
TESTS FOR HOMOGENEOUS AND 1D STRUCTURE (A-061)<br />
C. Tape, J.P. Loveless, and B.J. Meade<br />
Earthquake 240 240 c 240 y 240 c 240 l 240 e 240 240 p 240 r 240 o 240 c 240 e 240 s 240 s 240 240 i 240 n 240<br />
240 s 240 o 240 u 240 t 240 h 240 e 240 r 240 n 240 240 C 240 a 240 l 240 i 240 f 240 o 240 r 240 n 240 i 240 a 240 240 a 240 r 240 e 240<br />
240 c 240 o 240 m 240 m 240 o 240 n 240 l 240 y 240 240 i 240 n 240 f 240 e 240 r 240 r 240 e 240 d 240 240 f 240 r 240 o 240 m 240<br />
240 m 240 o 240 d 240 e 240 l 240 s 240 240 o 240 f 240 240 g 240 e 240 o 240 d 240 e 240 t 240 i 240 c 240 240 d 240 a 240 t 240 a 240<br />
240 a 240 s 240 s 240 u 240 m 240 i 240 n 240 g 240 240 t 240 h 240 a 240 t 240 240 t 240 h 240 e 240 240 u 240 p 240 p 240 e 240 r 240<br />
240c 240r 240u 240s 240t 240 240c 240a 240n240 240b 240e 240 240t 240r 240e240a 240t 240e 240d 240 240a 240s 240 240a 240<br />
240s240i240m240p240l240e240 240h240o240m240o240g240e240n240e240o240u240s240 240e240l240a240s240t240i240c240<br />
240h240a240l 240f 240s 240p 240a240c240e 240. 240 240H 240o 240w 240e 240v 240e240r 240,240 240i 240t240 240i240s 240<br />
240 w 240 e 240 l 240 l 240 240 k 240 n 240 o 240w 240n 240 240 t 240 h 240 a 240 t 240 240 m 240 a 240 t 240 e 240 r 240 i 240a 240 l 240<br />
240p240r240o240p240e240r240t240i240e240s240 240(240f240o240r240 240e240x240a240m240p240l240e240,240 240V240s240<br />
240o240r240 240V240p240)240 240v240a240r240y240 240b240y240 240m240o240r240e240 240t240h240a240n240 240a240n240<br />
240 o 240 r 240 d 240e 240 r 240 240 o 240 f 240 240 m 240 a 240 g 240n 240 i 240 t 240 u 240 d 240e 240 , 240 240 f 240 r 240 o 240 m 240<br />
240 l 240 o 240 w 240 240 w 240 a 240 v 240 e 240 240 s 240 p 240 e 240 e 240 d 240 s 240 240 i 240 n 240<br />
240u240n240c240o240n240s240o240l240i240d240a240t240e240d240 240s240e240d240i240m240e240n240t240s240 240t240o240<br />
240 h 240 i 240 g 240 h 240 240 w 240 a 240 v 240 e 240 240 s 240 p 240 e 240 e 240 d 240 s 240 240 i 240 n 240 240 t 240 h 240 e 240<br />
240u240p240p240e240r240m240o240s240t240 240m240a240n240t240l240e240 240b240e240l240o240w240 240t240h240e240<br />
240 M 240o 240 h 240 o 240. 240 240T 240h 240i 240s 240 240 r 240 a 240 n 240g 240e 240 240 o 240 f 240 240 w 240a 240 v 240e 240<br />
240 s 240 p 240 e 240 e 240 d 240 s 240 240 i 240 s 240 240 p 240 r 240 e 240 s 240 e 240 n 240 t 240 240 w 240 i 240 t 240 h 240 i 240 n 240<br />
240c240r240u240s240t240a240l240 240m240o240d240e240l240s240 240i240n240 240s240o240u240t240h240e240r240n240<br />
240 | Southern California Earthquake Center
Poster Abstracts<br />
241 C 241 a 241 l 241 i 241 f 241 o 241 r 241 n 241 i 241 a 241 , 241 241 a 241 n 241 d 241 241 t 241 h 241 e 241 s 241 e 241<br />
241m241o241d241e241l241s241 241h241a241v241e241 241b241e241e241n241 241v241a241l241i241d241a241t241e241d241<br />
241 w 241 i 241 t 241 h 241 241 s 241 e 241 i 241 s 241 m 241 i 241 c 241 241 w 241 a 241 v 241 e 241 f 241 i 241 e 241 l 241 d 241<br />
241s241i241m241u241l241a241t241i241o241n241s241 241o241f241 241h241u241n241d241r241e241d241s241 241o241f241<br />
241 l 241 o 241 c 241 a 241 l 241 241 e 241 a 241 r 241 t 241 h 241 q 241 u 241 a 241 k 241 e 241 s 241 . 241 241 T 241 h 241 e 241<br />
241s241t241r241u241c241t241u241r241a241l241 241c241o241m241p241l241e241x241i241t241i241e241s241 241a241r241e241<br />
241 m 241 a 241 n 241 i 241 f 241 e 241 s 241 t 241 e 241 d 241 241 i 241 n 241 241 s 241 t 241 r 241 i 241 k 241 i 241 n 241 g 241<br />
241m241a241n241n241e241r241 241w241i241t241h241i241n241 241s241e241i241s241m241o241g241r241a241m241s241<br />
241 i 241 n 241 241 t 241 h 241 e 241 241 f 241 o 241 r 241 m 241 241 o 241 f 241 241 b 241 a 241 s 241 i 241 n 241<br />
241r241e241s241o241n241a241n241c241e241 241a241n241d241 241m241u241l241t241i241p241a241t241h241i241n241g241<br />
241e241f241f241e241c241t241s241.241 241H241o241w241e241v241e241r241,241 241t241h241e241 241e241f241f241e241c241t241<br />
241 o 241 f 241 241 t 241 h 241 e 241 241 s 241 t 241 r 241 u 241 c 241 t 241 u 241 r 241 a 241 l 241<br />
241 c 241 o 241 m 241 p 241 l 241 e 241 x 241 i 241 t 241 i 241 e 241 s 241 241 o 241 n 241 241 s 241 t 241 a 241 t 241 i 241 c 241<br />
241o241f241f241s241e241t241s241 241i241s241<br />
SEISMOGRAM-BASED ASSESSMENT OF THE SOUTHERN CALIFORNIA SEISMIC VELOCITY MODEL<br />
CVM-H 11.9 WITH 234 REFERENCE EARTHQUAKES (B-127)<br />
C. Tape, E. Casarotti, A. Plesch, and J.H. Shaw<br />
Pervasive moderate earthquakes (M > 3) in southern California provide an excellent means for independently testing seismic<br />
velocity models of the crust and uppermost mantle. It is possible to obtain a seismic data set that is potentially sensitive to all<br />
details in a complex structural setting by using a large number of earthquakes, considering the full length of three-component<br />
seismograms, and examining different period ranges. We quantitatively assess the crustal and upper mantle model CVM-H<br />
11.9 by performing seismic wavefield simulations based on unstructured hexahedral meshing (GEOCUBIT) and the spectralelement<br />
method (SPECFEM3D). We generate a database of synthetic seismograms for 234 reference earthquakes in southern<br />
California. These synthetic seismograms are filtered over different period ranges and then compared with observed<br />
seismograms using a variety of misfit functions. The misfit analysis provides an earthquake-based perspective of the quality of<br />
CVM-H 11.9, and it can be used to improve future model versions.<br />
THE EFFECT OF BARRIERS ON SLIP PARTITIONING IN AN UPWARD BRANCHING FAULT SYSTEM (A-<br />
076)<br />
J. Tarnowski, D. Oglesby, and D. Bowman<br />
The finite element method and slip-weakening friction are employed to investigate dynamic rupture propagation on a<br />
branched fault system. The system consists of an oblique-normal fault at depth connected to vertical and dipping fault<br />
branches 5km from the surface. The branches accommodate predominately strike-slip and dip-slip motion, respectively. When<br />
rupture is nucleated on the oblique fault at depth, dynamic unclamping favors rupture propagation to the vertical fault, with<br />
no rupture on the dipping fault. However, when a zone of doubled normal stress, referred to as a barrier, is located on the<br />
vertical fault, rupture is delayed on the vertical fault, causing shear stress to increase and normal stress to decrease along the<br />
corresponding area of the dipping fault. Consequently, the dynamic nature of the stresses facilitates slip on both segments.<br />
There is a correlation between barrier area and the ease with which an earthquake at depth propagates to both upper branches,<br />
suggesting a critical patch size for nucleation on the dipping fault. Increasing the slip-weakening distance by a factor of √2<br />
necessitates the use of a critical barrier area that is increased by a factor of ~2, which is consistent with the critical patch size<br />
relationship suggested by Day (1982). Further numerical models show that the behavior above is relatively general, and does<br />
not require finely-tuned stress and frictional parameters.<br />
CRUSTAL THICKENING AND STRIKE-SLIP CONTROLLED GROWTH OF THE NORTHERN COLOMBIAN<br />
ANDES (A-153)<br />
M.H. Taylor, G. Veloza, and A. Mora<br />
Neotectonic field mapping, seismic reflection profiles, and cosmogenic nuclide surface exposure dating aid in estimating the<br />
style and rate of recent shortening across the eastern foothills of the Colombian Andes. Active structures include the eastdirected<br />
Guicarimo thrust fault that folds Cretaceous, Paleogene, Neogene and Quaternary sediments, and the east-directed<br />
Cusiana thrust fault – both structures are seismically active and are considered to sole at depth into a common decollement.<br />
Uplifted, folded and entrenched Quaternary alluvium are cut by active thrust faults with resulting entrenchment mainly<br />
2011 <strong>SCEC</strong> <strong>Annual</strong> <strong>Meeting</strong> | 241
Poster Abstracts<br />
occurring across folds and faults suggesting abandonment of the terrace surfaces are likely tectonically controlled. Seismic<br />
reflection data reveals the along-strike subsurface geometry and shortening magnitude of the active thrust faults. Our<br />
preliminary analysis suggests shortening magnitude increases northward from Yopal in the south to the actively growing<br />
Tame anticline in the north. We use cosmogenic 10Be depth profiles in quartz-rich fluvial sand in weakly eroded sites with<br />
well-developed soils on uplifted terrace surfaces to estimate shortening rates at several locations along the active thrust system.<br />
The active northwest-striking left-slip Bucaramanga fault system kinematically links the subduction zone megathrust in the<br />
northwest with the active thrust belt of the eastern Cordillera to the southeast. The regional geometry and kinematics of the<br />
active fault systems suggests crustal thickening must have been coupled with strike-slip controlled growth of the Northern<br />
Colombian Andes.<br />
STRUCTURAL CONTROLS ON THE SURFACE RUPTURE ASSOCIATED WITH THE MW7.2 EL MAYOR-<br />
CUCAPAH EARTHQUAKE OF 4 APRIL 2010: A COMPARATIVE ANALYSIS OF SCARP ARRAY<br />
KINEMATICS, ORIENTATION, LITHOLOGY AND WIDTH. (A-118)<br />
O.J. Teran, J.M. Fletcher, T.K. Rockwell, K.W. Hudnut, M.E. Oskin, S.O. Akciz, A.J. Elliot, P.O. Gold, L. Liu-Zheng, U.R.<br />
Manjarrez, R. Mendoza-Borunda, A.E. Morelan, and R.M. Spelz<br />
The Mw 7.2 El Mayor-Cucapah earthquake revealed the existence of a previously unidentified plate-margin fault system that<br />
extends 120 km from the northern tip of the Gulf of California to the international border. The system is composed of at least 6<br />
major faults linked by numerous smaller faults. Kinematics on individual faults vary systematically with fault orientation.<br />
Faults with strikes ranging from N72W-N68W, N67W-N13W, N12W-N08W and N07W-N47E have kinematics dominated by<br />
dextral, oblique-dextral normal, normal, and oblique normal-sinistral shear, respectively. Stress inversion of the kinematic<br />
data yields high phi values (0.65-0.8) with sigma-1 close in magnitude to sigma-2 and sigma-3 oriented sub-horizontally with<br />
an azimuth of S80W. This demonstrates that kinematic variations of the 2010 rupture are most strongly controlled by regional<br />
stress related to transtensional plate margin.<br />
Detailed mapping of the surface rupture through the Sierra Cucapah demonstrates that scarp array width (SAW) or total local<br />
width of the rupture zone ranges from 5 to 400 m and varies systematically with rock type, fault orientation, and fault<br />
kinematics. We classified 71 discrete fault segments according to the lithologies they juxtapose and in general SAW increases<br />
in the following order: basement-on-basement, sediment-on-basement and sediment-on-sediment faults. Dips of the master<br />
faults vary from 30° to 85° and this parameter shows the strongest correlation with SAW, which increases dramatically with<br />
more shallowly dipping master faults. When faults are classified by both lithology and dip, interesting patterns emerge to<br />
show systematic variations in SAW with strike. Sediment-on-sediment faults that dip greater than 45° show a sinusoidal<br />
variation of strike versus SAW. SAW is minimized with faults that strike ~N68W and ~N08W, which correspond well with the<br />
orientations of pure dextral and pure normal slip, respectively. SAW is maximized with faults that strike ~N30W, which<br />
correspond well with the orientations of oblique dextral-normal slip. Therefore, SAW increases with the increasing kinematic<br />
complexity of oblique slip. Based on stress inversion, the oblique slip segments have higher shear stress, which we conclude is<br />
an important factor controlling SAW. The predictive power resulting from this parametric analysis may allow refined<br />
assessments of future fault surface rupture hazards for critical facilities and lifeline fault crossings.<br />
INCORPORATING GPS VELOCITIES INTO UCERF3 (B-147)<br />
W. Thatcher, P. Bird, J. Bormann, T. Dawson, E. Field, W. Hammond, E. Hearn, K. Johnson, R. McCaffrey, D. Sandwell,<br />
and Y. Zeng<br />
UCERF3 aims to incorporate space geodetic constraints on fault slip rates and off-fault strain rates. A subgroup was formed to<br />
undertake this task and f<strong>org</strong>e a consensus on space geodetic results that could be confidently applied to UCERF3 goals. With<br />
support from both <strong>SCEC</strong> and the California Earthquake Authority (CEA), this activity was initiated in 2010. The activities<br />
included 2-day workshops in April 2010 and June 2011 to solicit comments and guidance from the space geodetic community.<br />
The culmunitation of the efforts is a suite of kinematic inversions of GPS velocities and geologic slip rate data for the<br />
distribution of fault slip rates and off-fault strain rates in California. In this poster we summarize the suite of inversion results<br />
using five different kinematic block and non-block models.<br />
DISCREPANCIES IN OBSERVED VERTICAL MOTION FROM GEODETIC, GEOLOGIC AND<br />
GROUNDWATER DATA ALONG THE SOUTHERN SAN ANDREAS FAULT SYSTEM (A-059)<br />
G.M. Thornton, B.R. Smith-Konter, and J.G. Konter<br />
242 | Southern California Earthquake Center
Poster Abstracts<br />
Geodetic and geologic measurements of vertical deformation in southern California record localized zones of uplift and<br />
subsidence associated with tectonic motions of the San Andreas Fault System (SAFS) and several other factors like ground<br />
water pumping and hydrocarbon extraction. Moreover, investigating the relationship between geodetic and geologic vertical<br />
data is nontrivial, as these datasets differ in geographic coverage area, spatial resolution, signal source, and associated<br />
uncertainties. Here we compare 888 geodetic velocities (from EarthScope PBO) that range from -11.1 to 7.6 mm/yr (average<br />
uncertainty of 1.7 mm/yr) and 1627 geologic velocities (from the <strong>SCEC</strong> Vertical Motion Database) that range from -3.5 to 3.6<br />
mm/yr (average uncertainty of 0.13 mm/yr). The geodetic data are evenly distributed over a relatively large region, while the<br />
geologic data are very closely spaced over small areas. Thus, as these datasets are not spatially co-located, several different<br />
interpolation techniques (surfacing, masking, Delaunay triangulation) were utilized for optimal analysis of the data. While the<br />
number of available data points for each comparison largely depends on the chosen interpolation technique, all methods<br />
suggest that the relationship between geologic and geodetic vertical data is not 1:1, and in several locations the observations<br />
are even anticorrelated. Since anthropogenic effects may contaminate some of the geodetic data signal, a vertical velocity<br />
crustal deformation model of the SAFS was used to help identify locations where tectonic motions should dominate the data<br />
signals. To further improve the data-model misfit, a first-order groundwater correction was developed to isolate groundwater<br />
deformation recorded in the geodetic data. A ground subsidence/groundwater level change ratio of 0.006 was derived from<br />
published measurements and applied to changes in groundwater levels from regional well log data. Applying the<br />
groundwater correction improved the data-model fit by 33% and also doubled the correlation between the geodetic and<br />
geologic data. As we continue to explore the vertical motion discrepancies of the SAFS using regional tide gauge records along<br />
the California coast, we emphasize the fundamental importance of correcting vertical deformation data for ground water<br />
pumping and hydrocarbon extraction, and encourage future deployment of geodetic arrays in locations complimentary to<br />
existing geologic observations.<br />
PATH CALIBRATION FOR EVENTS IN THE LOWER IMPERIAL VALLEY BASIN (B-051)<br />
X. Tian, S. Wei, Z. Zhan, and D.V. Helmberger<br />
The Imperial Valley below the US-Mexican border has few seismic stations but many significant earthquakes. Many of these<br />
events, such as the recent El Mayor-Cucapah event, have complex mechanisms involving a mixture of strike-slip and normal<br />
slip patterns with over 30 aftershocks with magnitudes over 4.5. Unfortunately, many earthquake records from the Southern<br />
Imperial Valley display a great deal of complexity, i.e., strong Rayleigh wave multipathing and extended codas. In short,<br />
regional recordings in the US are too complex to easily separate source properties from complex propagation. Here we present<br />
a hybrid method of using a combination of travel times including surface waves to locate events as well as determine their<br />
mechanisms. This is accomplished by assuming two pure-path models: one basin and one usual SoCal model, and a<br />
combination of Ambient Seismic Noise (ASN) and well located earthquakes. In particular, there was a broadband station<br />
NE70 (NARS array) in the vicinity of the epicenters, which enables us to use ASN calibration. We are finding the lags of<br />
phases of correlated surface waves relative to the reference model is consistent with the time shifts obtained in the cut-andpaste<br />
(CAP) routine. We cross-correlate the stations in the basin with the TriNet stations and measure the time delays of<br />
surface waves, which can be used to reduce the uncertainty of the source mechanisms and locations for earthquakes in the<br />
Lower Imperial Valley Basin without a detailed crustal structure. We will report on both the aftershocks and historic events.<br />
HIGH RESOLUTION INTERSEISMIC VELOCITY MODEL OF THE SAN ANDREAS FAULT FROM GPS AND<br />
INSAR (A-048)<br />
X. Tong, D.T. Sandwell, and B. Smith-Konter<br />
We recover the interseismic deformation along the entire San Andreas Fault System (SAFS) at a spatial resolution of 200<br />
meters by combining InSAR and GPS observations using a dislocation model. Previous efforts to compare 17 different GPSderived<br />
strain rate models of the SAFS shows that GPS data alone cannot uniquely resolve the rapid velocity gradients near<br />
faults, which are critical for understanding the along-strike variations in stress accumulation rate and associated earthquake<br />
hazard.<br />
To improve the near-fault velocity resolution, we integrate new GPS observations with InSAR observations, initially from<br />
ALOS (Advanced Land Observation Satellite launched by Japan Aerospace Exploration Agency) ascending data (spanning<br />
2006.5-2010), using a remove/restore approach. More than 1100 interferograms were processed with the newly developed<br />
InSAR processing software GMTSAR. The integration uses a dislocation-based velocity model to interpolate the Line-Of-Sight<br />
(LOS) velocity at the full resolution of the InSAR data in radar coordinates. The residual between the model and InSAR LOS<br />
velocity are stacked and high-pass filtered, then added back to the model. This LOS velocity map covers almost entire San<br />
2011 <strong>SCEC</strong> <strong>Annual</strong> <strong>Meeting</strong> | 243
Poster Abstracts<br />
Andreas Fault System (see Figure 1) from Maacama Fault to the north to the Superstition Hills Fault to the south. The average<br />
standard deviation of the LOS velocity model ranges from 2 to 4 mm/yr.<br />
Our initial results show previously unknown details in along-strike variations in surface fault creep. Moreover, the high<br />
resolution velocity field can resolve asperities in these creeping sections that are important for understanding moment<br />
accumulation rates and seismic hazards. We find that much of the high resolution velocity signal is related to non-tectonic<br />
processes (e.g., ground subsidence and uplift) sometimes very close to the fault zone. The near-fault deformation signal<br />
extracted from this velocity map can provide tighter constraints on fault slip rates and locking depths of the major fault<br />
segments along the SAFS.<br />
"MAKE YOUR OWN EARTHQUAKE: CURRICULUM DEVELOPMENT FOR GRADES 6 - 12" (A-026)<br />
J.P. Trudeau, S.E. Allen, and H.E. Pence<br />
Public understanding of earthquakes is important when it comes to preparing a community for a seismic event. In California,<br />
the interval between earthquakes is 50 to 100 years so the question becomes not if but when will the next one occur (Press and<br />
Siever 1982). Development of a curriculum to educate students on earthquakes is important. Having knowledge on how and<br />
why an earthquake occurs will help prevent casualties and panic when the next seismic event occurs. The Make Your Own<br />
Earthquake (MYOE) is an Educational Outreach and Training activity (EOT) that originally required university educators to<br />
go to local schools with expensive and heavy equipment. With the development of the Quake Catcher Network (QCN) device<br />
teacher can now use this accelerometer to show students acceleration in the x, y, and z axis. The main focus of this research<br />
was the development of a K-12 activities.<br />
References:<br />
Press, F., and Siever, R. (1982). "Earth, 3rd Ed.", W. H. Freeman and Company, San Francisco.<br />
244 | Southern California Earthquake Center
COMPARISONS AMONG EARTHQUAKE SIMULATOR RESULTS FOR UCERF2 FAULT MODEL OF<br />
CALIFORNIA AND OBSERVED SEISMICITY (B-109)<br />
Poster Abstracts<br />
T.E. Tullis, K. Richards-Dinger, M. Barall, J.H. Dieterich, E.H. Field, E. Heien, L.H. Kellogg, F. Pollitz, J. Rundle, M. Sachs,<br />
D.L. Turcotte, S.N. Ward, B. Yikilmaz, and O. Zielke<br />
We compare simulated histories generated by five different earthquake simulators with one another and with what is known<br />
about actual earthquake history in order to evaluate the usefulness of the simulator results for anticipating the probabilities of<br />
future earthquakes and for contributing to public policy decisions. Although sharing common features, our simulators differ<br />
from one another in their details in many important ways. All simulators use the same fault geometry and the same ~15,000,<br />
3x3 km elements to represent the all strike-slip and thrust faults in California, excluding Cascadia. The set of faults and the<br />
input slip rates on them are essentially those of the UCERF2 fault and deformation model; we will switch to the UCERF3<br />
model once it is available. All simulators use the boundary element method to compute stress transfer between elements.<br />
Differences between the simulators include how they represent fault friction and what assumptions they make to promote<br />
rupture propagation from one element to another.<br />
The behavior of the simulators is encouragingly similar and the results are similar to what is known about real earthquakes,<br />
although some refinements are being made to some of the simulators to improve these comparisons as a result of our initial<br />
results. The frequency magnitude distributions of simulated events from M6 to M7.5 for a 30,000 year simulated history agree<br />
with instrumental observations for all of California. Scaling relations, as seen on plots of slip vs. rupture length, magnitude vs.<br />
rupture area, and magnitude vs rupture length, are similar for the different simulators. On these plots, overlaying results from<br />
several studies characterizing actual earthquake scaling shows good agreement with the simulator results. Importantly,<br />
moment rates and event rates for M7+ events show variations by factors of 3 in 100-yr moving averages throughout the 30,000<br />
year simulated histories, with event rates for M6+ events correlating with M7+ event rates and 200 year periods being too<br />
short to characterize the moment and event rates. This suggests that in California our observational instrumental and<br />
historical record is too short to characterize seismicity rates adequately. For fault sections where paleoseismic data exist to<br />
constrain interevent times, fault stress drops assumed by the simulators can be adjusted to agree with observations. Lacking<br />
constraining data the simulated interevent times may be off, perhaps by up to a factor of 2.<br />
A SEQUENCE OF DISTINCT DYNAMIC RUPTURES IN THE EARLY STAGE OF THE 2011 TOHOKU<br />
EARTHQUAKE (A-106)<br />
T. Uchide, H. Yao, and P.M. Shearer<br />
The 2011 M9 Tohoku earthquake gives us numerous mysteries. One of them is the exceptionally huge shallow slip of up to 30-<br />
40 m close to the Japan Trench. This massive slip is inferred from seismic, geodetic, and tsunami slip inversions, and is also<br />
implied by ocean bottom GPS observations [Sato et al., 2011]. The shallow slip started about 40 s after the onset. Such large<br />
shallow slip was not found in the 2004 Sumatra and the 2010 Chile earthquakes. What enabled the huge shallow slip in<br />
Tohoku? Although there are issues related to how the required strain energy accumulated for hundreds of years, this study<br />
attempts only to address the question how the source process evolved around the hypocenter in the first 40 s and its<br />
relationship with the shallow slip event.<br />
Seismic slip inversions and back-projection studies suggest that the initial slip rate and rupture velocity are small. Two<br />
possibilities exist: (1) the slip rate and rupture velocity are actually small, or (2) a sequence of individual subevents is seen as<br />
apparently slow continuous rupture due to a lack of resolution. Since these two models have different physical interpretations,<br />
we investigate the early stage in some detail.<br />
An iterative back projection (IBP) method [Yao et al., this meeting] detects bursts of high-frequency radiation, which may<br />
represent individual subevents or rapid changes in the rupture velocity [e.g., Spudich and Frazer, 1984]. In the first 40 s, many<br />
high-frequency radiation sources are found within 30 km of the hypocenter at a variety of azimuths from the hypocenter.<br />
Multiscale slip inversion [Uchide and Ide, 2007] reveals the rupture process both in the early stage and the entire rupture<br />
process. In the early stage, the rupture propagated westward first, then from 20 s propagated eastward. This is consistent with<br />
the IBP result. Both the slip rate of about 1 m/s and the westward propagating rupture velocity are comparable to results from<br />
other earthquakes.<br />
These results imply that the early stage until 40 s is a sequence of distinct dynamic ruptures, which do not spread linearly<br />
from the hypocenter, rather than continuous slip with a low slip rate and a low rupture velocity. The rupture may grow by<br />
2011 <strong>SCEC</strong> <strong>Annual</strong> <strong>Meeting</strong> | 245
Poster Abstracts<br />
triggering subevents around the hypocenter by dynamic and static stress transfer. Resolving the details of this process should<br />
help in understanding what triggered the large shallow slip event.<br />
DYNAMIC TRIGGERING EVENTS IN HIDA REGION BY THE P WAVE FROM THE 2011 TOHOKU<br />
EARTHQUAKE (A-107)<br />
T. Uchide<br />
Seismicity rates in the Hida region of central Japan, located about 400 km west of the source area of the 2011 M9 Tohoku<br />
earthquake, significantly increased at a time coincident with the passage of the Tohoku's P-wave. These local events are clearly<br />
identifiable in 8 Hz high-pass filtered Hi-net data in the region. Here, I systematically search for P-wave triggered events in<br />
the Hida region using a matched filter analysis. I examine data spanning 600 s before to 600 s after the origin time of the<br />
Tohoku mainshock, which nets 887 events, of these 82% occurred on or after the Tohoku P-wave arrival. I hypothesize the<br />
passage of the mainshock generated P-wave played an important role in raising the seismicity rate in the Hida region. Using<br />
50s of waveform data, starting at the time of the mainshock's' P-wave arrival, I estimate the dynamic Coulomb stress change<br />
induced by the M9 mainshock reaches a maximum level of 1 - 10 kPa in the Hida region. This value, although on the low end,<br />
is comparable to other triggering thresholds. The immediacy of remote earthquake triggering at the time of the P-waves<br />
passage indicates secondary triggering processes, such as fluid movement or stress recalibration, are not necessarily required<br />
to remotely triggered earthquakes in this region.<br />
SAN BERNARDINO GPS NETWORK: TIME SERIES THROUGH 2010 (A-049)<br />
E. Upton, S. McGill, R. Bennett, J. Spinler, and A. Torrens-Bonano<br />
As the Pacific plate slides past the North American plate along the San Andreas Fault (SAF) it exerts stress upon the fault.<br />
Although there has been no major earthquake in San Bernardino along the SAF in the past two centuries, the plates are in<br />
constant motion, moving a small amount every year. Yearly Global Positioning System (GPS) monitoring at benchmark sites<br />
around the SAF and other faults allows us to calculate the velocity of the Pacific plate in relation to stable North America.<br />
These calculations allow us to test hypotheses regarding the slip rate of the SAF as well as other faults. This year we<br />
conducted GPS monitoring at 25 locations. The data collected this summer is currently being processed at the University of<br />
Arizona. This poster summarizes the data collected in 2010 and previous years into a set of time series plots for 34 locations<br />
around the San Bernardino area. Our analysis shows the horizontal motion of the benchmarks is bounded by a minimum of<br />
11.6 mm/yr (Site 7211, in the San Bernardino Mountains) and a maximum of 33.8 mm/yr (Site NORC, in Norco). Our results<br />
also show a distinct northwesterly trend of movement for stations in the San Bernardino GPS Network. The benchmarks<br />
display a direction of motion of between N17.6˚W (Site RICU, near Landers) and N56.7˚W (Site LACY, near Hemet).<br />
Furthermore, there is a noticeable increase in plate velocity the farther to the west as one moves from the North American<br />
plate onto the Pacific plate. Although they lie on a stable plate, there are locations on the North American plate are moving in<br />
the direction of the Pacific plate—northwest—due to the deformation of the plate boundaries along the locked SAF. While<br />
sites on the stable North American plate are moving to the northwest, sites located on the Pacific plate are moving to the<br />
northwest at greater velocities. Site NORC, which is the westernmost site of our survey, has a horizontal velocity of 33.8<br />
mm/yr. In comparison, site RICU, located the farthest to the east, shows a horizontal motion of 16.2 mm/yr. Both sites are<br />
moving to the northwest but the locations on the Pacific plate are moving at a greater speed.<br />
AUTO-ACOUSTIC COMPACTION IN STEADY SHEAR FLOWS: EXPERIMENTAL EVIDENCE FOR<br />
SUPPRESSION OF SHEAR DILATANCY BY INTERNAL ACOUSTIC VIBRATION (A-089)<br />
N.J. van der Elst and E.E. Brodsky<br />
Granular shear flows are intrinsic to many geophysical processes, ranging from landslides and debris flows to earthquake<br />
rupture on gouge-filled faults. The rheology of a granular flow depends strongly on the boundary conditions and shear rate.<br />
Earthquake rupture involves a runaway transition from quasi-static to rapid shear rates. Understanding the rheology of the<br />
granular flow in this transition is therefore crucial for understanding the rupture process and the coseismic strength of faults.<br />
Here we explore this transition experimentally using a commercial torsional rheometer. We measure the dilatation of a steadystate<br />
shear flow at velocities ranging between 10 -3 and 10 2 cm/s, and observe that dilatation is suppressed at intermediate<br />
velocities (0.1 - 10 cm/s) for angular particles, but not for smooth glass beads. The maximum reduction in thickness is on the<br />
order of 10% of the active shear zone thickness, and scales with the amplitude of shear-generated acoustic vibration. By<br />
examining the response to externally applied vibration, we confirm that the intermediate-velocity compaction represents a<br />
feedback between internally generated acoustic vibration and flow rheology. We link this phenomenon to that of acoustic<br />
246 | Southern California Earthquake Center
Poster Abstracts<br />
compaction of a dilated granular medium, and formulate an empirical model for the steady-state thickness of a shear-zone<br />
based on a balance between shear induced dilatation and “auto-acoustic” compaction. This mechanism is activated when the<br />
acoustic pressure is on the order of the confining pressure, and results in a velocity-weakening granular flow regime at shear<br />
rates four orders of magnitude below the range traditionally associated with the inertial transition to dispersive granular flow.<br />
CREATIVE WORLD EARTHQUAKE PREPAREDNESS PROGRAM (A-006)<br />
M.J. Vanegas, R.M. de Groot, and M. Barajas<br />
Created in partnership with the California Science Center (CSC), <strong>SCEC</strong>, and the Earthquake Country Alliance (ECA), this 15minute<br />
interactive program covers key concepts of earthquake science and preparedness. Beginning in fall 2011 this program<br />
will be offered as a Science Spectacular! show at the CSC with the goal of implementing it in other free-choice learning<br />
institutions especially with members of the Earthquake Education and Public Information Center (EPIcenter) Network. Part of<br />
the ECA, the EPIcenter Network is a collaborative of free-choice learning institutions devoted to enhancing earthquake<br />
education programs and exhibits. EPIcenters are found in a variety of venues such as museums, science centers, parks,<br />
libraries, and universities. The main goals of the presentation are to raise public awareness of earthquakes and seismic risk<br />
throughout California and to stimulate public interest (especially among children ages 6 - 12) in earth science. The<br />
presentation focuses on three key learning points: the geology of earthquakes, disaster preparedness, and earthquake survival.<br />
One of the challenges of creating such a presentation is communicating complex concepts of geology and natural disasters in a<br />
way that promotes understanding, interest, and ultimately action. Research for this project consisted of a literature review on<br />
effective teaching strategies in informal environments. The presentation, script, and interactive activities were reviewed by the<br />
management and staff of the CSC Education Department. The first half of the presentation discusses the relationship between<br />
the earth’s composition, plate tectonics, and earthquakes. The second half focuses on creating a disaster supplies kit and why<br />
it is important to be prepared for a natural disaster. The interactive portions of the presentation include having volunteers<br />
participate in demonstrations such as fault movement using blocks, sorting through an unsatisfactory disaster supplies kit,<br />
and proper earthquake survival techniques (drop, cover, and hold on).<br />
3-D FINITE ELEMENT MODELING OF PRECARIOUSLY BALANCED ROCKS (B-006)<br />
S. Veeraraghavan and S. Krishnan<br />
Many Precariously Balanced Rocks (PBRs) have been found in California. Since these rocks have been precariously placed for<br />
thousands of years, they can help in providing a constraint on the maximum ground shaking experienced by that region<br />
during the age of the PBR. Shake table tests and field tests have been conducted on some rocks to establish the importance of<br />
PBRs. Since most of the rocks are either very large or present in unapproachable locations, these tests cannot be conducted on<br />
majority of the rocks. Therefore, we are creating detailed 3-D finite element models of some of the PBRs that have been imaged<br />
using Terrestrial Laser Scanning techniques. We have validated the methodology by creating a FEM model of Housner's<br />
rectangular block. To establish the proof of concept, we are modeling the Echo Cliff PBR which is located in the Western Santa<br />
Monica Mountain. We model the rock by generating the mesh on MatLab and then analyze its response to various ground<br />
motions using LS-Dyna. The Echo Cliff PBR survived the 1994 Northridge earthquake and we will use this ground motion to<br />
validate the rock model. The success of this prototype study will provide an impetus to 3-D imaging and analysis of hundreds<br />
of PBRs. The ultimate goal is to arrive at probabilistic constraints on region-wide ground shaking intensity by combining the<br />
results of this study with cosmogenic dating of these rocks. Besides providing a better constraint on the US Seismic Hazard<br />
maps,this could also help in improving the ground motion simulations.<br />
SUB-SURFACE EVIDENCE OF FAULTING RELATED TO THE COMPTON-LOS ALAMITOS FAULT AND<br />
IMPLICATIONS FOR STRAIN PARTITIONING IN THE WESTERN LA BASIN (A-126)<br />
D.M. Verdugo Madugo and R.S. Yeats<br />
Recent structural models for the Los Angeles (LA) Basin attribute deformation along the Compton-Los Alamitos fault (CLA)<br />
to fault-bend folding above a NE-dipping ramp rather, than to a near-surface fault, as had been interpreted in earlier studies.<br />
Our discovery last year of repeated stratigraphic sections on oil well logs across the northwestern CLA, however, support the<br />
earlier interpretation. To test whether the fault we observe represents a significant structure, rather than localized fold-related<br />
faulting, we focused our efforts this year on confirming our earlier work, and extending our study further southeast along the<br />
CLA. Our new analysis of exploratory well data, petroleum industry seismic lines, and cross-sections of seismicity across the<br />
central and southeastern CLA (generously provided by Shaw/Plesch and Yang/Hauksson, respectively) reveal a complex<br />
fault that cannot be explained by folding. According to seismic lines, truncated reflectors on the section north of the LA River<br />
2011 <strong>SCEC</strong> <strong>Annual</strong> <strong>Meeting</strong> | 247
Poster Abstracts<br />
extend to about 600 m below the surface, and well data shows evidence of faulting at ~4 km, dipping towards the NIFZ. The<br />
southeastern 5 km of this section of the fault, between the LA River and Long Beach Blvd, corresponds to the deepest part of<br />
the LA Basin, as contoured in Wright, 1991, and truncates reflectors to within 200 m of the surface, exhibiting the greatest<br />
deformation along the CLA and defining perhaps oldest section of the fault. Newly relocated seismicity by Yang and<br />
Hauksson reveal primarily reverse focal solutions below this section of the CLA. South of the LA River, seismic lines and well<br />
data reveal truncated reflectors up to depths of 5-1.5 km and gently warped basinal stratigraphy, exhibiting less apparent<br />
vertical separation than observed on the northwestern section of CLA. Newly relocated seismicity shows the fault coincides<br />
with southwest-dipping strike-slip foci. This southeastern section of the CLA also corresponds to the easternmost extent of<br />
uplift measured by Gilluly and Grant after the 1933 Long Beach earthquake. Repeated evidence of faulting in seismic lines and<br />
well data suggests the CLA is a significant fault. Its proximity to the eastern boundary of uplift measured in the Long Beach<br />
earthquake by Gilluly and Grant and oblique strike-slip focal mechanisms calculated by Yang and Hauksson suggest a<br />
structural connection between the southeastern extent of the CLA and NIFZ, implying a strain-partitioning relationship<br />
between the two faults.<br />
SEISMIC ANISOTROPY OF THE PELONA SCHIST FROM ELECTRON BACKSCATTER DIFFRACTION<br />
(EBSD) MEASUREMENTS OF CRYSTAL PREFERRED ORIENTATIONS (CPOS) (B-136)<br />
K.C. Wagner, S. Brownlee, and B. Hacker<br />
Seismic Anisotropy of the mid to lower crust is difficult to measure in the field by seismologists. Using a scanning electron<br />
microscope (SEM) to obtain crystal preferred orientations (CPO’s) of mineral grains from samples taken from this region<br />
allows us to calculate seismic anisotropy theoretically using published mineral elastic constants. Calculations are made<br />
according to methods described in Mainprice et. al. (1990). Polished thin sections from the Pelona Schist were analyzed using<br />
electron back scatter diffraction (EBSD) in an SEM. The slide was tilted 70 degrees from horizontal. The samples included: 4<br />
mica schists that were cut parallel to foliation, 3 corresponding mica schists cut perpendicular to foliation, and 2 xenoliths with<br />
high amphibole content. The 4 mica schists had max Vp's that ranged from 6.44 to 7.26 km/s; Vp anisotropies that ranged<br />
from 4.8% to 29.2%; and max Vs anisotropies from 7.0% to 42.6%. The 3 corresponding mica schists had max Vp's that ranged<br />
from 6.26 to 6.61 km/s; Vp anisotropies from 3.1% to 7.9%; and Vs anisotropies from 4.9% to 6.61%. In samples that were cut<br />
orthogonal to foliation biotite is difficult to index using the automated indexing routine and had to be found manually to<br />
improve calculations. This may account for significant differences in anisotropy between corresponding samples. The<br />
xenoliths had max Vp's of 6.14 and 6.48 km/s; their Vp anisotropies were both 6.5%; and their Vs anisotropies were 8.35 and<br />
8.37. Our calculations give slightly higher maximum Vp than the average Vp reported in Pellerin and Christensen (1997) for<br />
similar rock types from the area. Calculated anisotropies are comparable to Pellerin and Christensen (1997). Samples with<br />
large amounts of mica had the highest anisotropy. On average, the calculated velocities have approximately hexagonal<br />
symmetry with a unique slow axis. In contrast, one sample contained significant plagioclase that caused velocities to be fast<br />
perpendicular to foliation. An assumption of hexagonal symmetry with a unique slow axis is a valid assumption for the<br />
Pelona Schist.<br />
PBO SOUTHWEST REGION: NETWORK OPERATIONS AND BAJA EARTHQUAKE RESPONSE (A-068)<br />
C. Walls, A. Basset, D. Mann, S. Lawrence, C. Jarvis, J. Sklar, K. Feaux<br />
M. Jackson<br />
The SW region of the Plate Boundary Observatory consists of 455 continuously operating GPS stations located principally<br />
along the transform system of the San Andreas fault and Eastern California Shear Zone. In the past year network uptime<br />
exceeded an average of 97% with greater than 99% data acquisition. Communications range from CDMA modem (307), radio<br />
(92), Vsat (30), DSL/T1/other (25) to manual downloads (1). Sixty-three stations stream 1 Hz data over the VRS3Net typically<br />
with
Poster Abstracts<br />
installed and telemetered through a UNAM relay at the Sierra San Pedro Martir. Four of these stations have Vaisala WXT520<br />
meteorological sensors. An additional site in the Sierra Cucapah (PTAX) that was built by CICESE, an Associate UNAVCO<br />
Member institution in Mexico, and Caltech has been integrated into PBO dataflow. The stations will be maintained as part of<br />
the PBO network in coordination with CICESE.<br />
UNAVCO is working with NOAA to upgrade PBO stations with WXT520 meteorological sensors and communications<br />
systems capable of streaming real-time GPS and met data. The real-time GPS and meteorological sensor data streaming<br />
support watershed and flood analyses for regional early-warning systems related to NOAA’s work with California<br />
Department of Water Resources. Currently 19 stations are online and streaming with 7 more in preparation.<br />
DIRECTIVITY-BASIN COUPLING IN THE LOS ANGELES REGION FROM THE CYBERSHAKE HAZARD<br />
MODEL (B-005)<br />
F. Wang, T.H. Jordan, S. Callaghan, K. Milner, P. Maechling, R. Graves, and CyberShake Collaboration<br />
The coupling between source directivity effects and basin amplification effects can substantially enhance the low-frequency<br />
seismic hazards in sedimentary basins. These effects have been qualitatively illustrated by TeraShake (Olsen et al., 2006),<br />
ShakeOut (Graves et al., 2008), and other earthquake scenarios simulated by the Southern California Earthquake Center. In<br />
this study, we use version 1 of the CyberShake Hazard Model (CSHM-1) for the Los Angeles region (Graves et al., 2010) to<br />
quantify directivity-basin effects in low-frequency response spectra. The CyberShake computational platform employs the<br />
reversal symmetries of linear wave propagation (seismic reciprocity) to numerically simulate suites of synthetic time-histories<br />
large enough for the probabilistic mapping of shaking intensities. In CSHM-1, a set of more than 600,000 rupture realizations<br />
was generated that stochastically sample the Uniform California Earthquake Rupture Forecast (UCERF2); horizontalcomponent<br />
seismograms were computed at 250 sites in the Los Angeles region, and hazard curves and hazard maps were<br />
constructed from the UCERF2 probabilities. We use the response spectra calculated from these seismograms in the band 0.1-<br />
0.3 Hz to analyze the dependence of strong-motion amplitudes on basin and source geometry, from which we extract<br />
measures of directivity-basin coupling. These measures indicate how directivity-basin coupling is enhanced by the tectonic<br />
branching structure of the San Andreas system. Additionally, we analyze the dependence of this coupling on source<br />
complexity and earth structure.<br />
LOVE WAVE TRIGGERS TREMOR ALONG SAN JACINTO FAULT IN THE ANZA REGION, CALIFORNIA<br />
(B-038)<br />
T.-H. Wang, E.S. Cochran, and D.D. Oglesby<br />
We investigate the stress amplitude required to trigger tremor along the San Jacinto fault. We examine continuous broadband<br />
recordings from 11 Southern California Seismic Network (SCSN) stations located near Anza, California, of 41 Mw>=7.0<br />
teleseismic events that occurred between 2001 andn 2009. These events occurred at a wide range of backazimuths and<br />
hypocentral distances. An initial visual inspection of 2 to 8 Hz bandpassed time series reveals only one clear episode of<br />
triggered tremor, during the 3 November 2002 Mw 7.8 Denali earthquake. The triggered tremor episode is 300 seconds long<br />
and composed of 12 tremor bursts around 15 km depth. We compare the frequency spectra of tremor, local earthquakes, and<br />
background noise. We find that the tremor at Anza lacks high frequency energy above 1 Hz compared to local earthquakes.<br />
Such a frequency characteristic is similar to tremor observed in other regions. The start of the tremor episode correlates well<br />
with surface wave particle motions primarily in the transverse direction, suggesting that Love wave may have triggered<br />
tremor.<br />
We tested the hypothesis that similar, but lower amplitude episodes of tremor occurred during the teleseismic earthquakes.<br />
We manually identify high amplitude bursts, or low frequency earthquakes (LFEs), that occur during the Denali tremor<br />
episode, cross-correlate these LFE templates with the continuous time series of the 41 teleseismic events, and stack the<br />
correlation coefficients across 11 stations. We find sufficiently high correlation values only in the Denali earthquake<br />
wavetrains. We examine the amplitude and the dominant period of the posited triggering surface waves for all the teleseismic<br />
events. We find that the Denali earthquake had the highest amplitude surface waves but similar spectral shape to other<br />
teleseismic events, suggesting that the amplitude of the incoming surface wave primarily controls triggering of tremor on the<br />
San Jacinto fault. In addition, since the backazimuth of the Denali surface wave is parallel to strike of the near-vertical San<br />
Jacinto fault, the shear stress applied to the fault by the radial-direction gradients in the Love wave particle displacement is<br />
maximized.<br />
2011 <strong>SCEC</strong> <strong>Annual</strong> <strong>Meeting</strong> | 249
Poster Abstracts<br />
COMPOUND EARTHQUAKES ON A BIMATERIAL INTERFACE AND IMPLICATIONS FOR RUPTURE<br />
MECHANICS (B-040)<br />
E. Wang and A.M. Rubin<br />
Rubin and Ampuero [2007] simulated slip-weakening ruptures on a 2-D (line fault) bimaterial interface and observed<br />
differences in the timescales for the two edges to experience their peak stress after being slowed by barriers. The barrier on the<br />
"negative" side reached its peak stress when the P-wave stopping phase arrives from the opposite end, which takes ~20 ms for<br />
a 100 m event. This may be long enough for a potential secondary rupture to be observed as a distinct subevent. In contrast,<br />
the same timescale for a barrier at the "positive" front is nearly instantaneous, possibly making a secondary event there<br />
indistinguishable from the main rupture. Rubin and Gillard [2000] observed that 5 of a family of 72 similar earthquakes along<br />
the San Andreas fault in Northern California are compound and in all cases the second event was located on the negative<br />
(NW) side of the main event. Based on their simulations, Rubin and Ampuero interpreted this as being due to the abovementioned<br />
asymmetry in the dynamic stressing-rate history on the two sides of a rupture on a bimaterial interface.<br />
In this study, we search more systematically for secondary arrivals within 0.15 s of the first P arrival for microearthquakes on<br />
the San Andreas. Using an iterative deconvolution method described in Kikuchi & Kanamori [1982], we deconvolve the first<br />
0.64 s following the P arrival of a target event using a nearby Empirical Green's Function (EGF). When the EGF is a simple<br />
earthquake and the target is compound, the deconvolution result is expected to show two positive spikes, corresponding to<br />
the main and secondary events. A subevent is considered robust only when the difference between the waveforms of the<br />
target event and the aligned and scaled EGF is similar enough to the EGF at multiple stations. The azimuthal consistency of<br />
delays between the main and secondary arrivals is more convincing evidence that the target is a compound event.<br />
Using these criteria we temporarily identified ~70 compound events out of ~8300 in our catalog. Future work will include<br />
improving the quality of the inter-event delay time by using Monte Carlo simulations to allow the amplitudes and arrival<br />
times of both spikes (as opposed to just the second spike) to vary. Accurate relative locations and times can improve our<br />
understanding of the triggering mechanism of the subevents and perhaps the longer-timescale aftershock asymmetry<br />
observed in this region as well.<br />
AUTOMATIC DETECTION OF SHALLOW FAULT CREEP IN INSAR DATA (A-065)<br />
M. Wei, D. Sandwell, and J. McGuire<br />
Fault creep in Southern California mostly occurs at the shallow part of a fault with clear surface breakage. Monitoring and<br />
observing these shallow fault creep is important for regional seismic hazard assessment and improving our understanding of<br />
fault mechanics. Many fault creep occurred in remote area where no other observation instruments nearby. Even on faults<br />
with creepmeters, partial creep on sections that do not coincide with the creepmeter becomes undetectable. InSAR has been<br />
used to study fault creep in this region. However, as the volume of InSAR data has increased dramatically, over ~1000 scenes<br />
in California, and will continue to increase as future missions such as DESDynI start, searching for fault creep manually in<br />
InSAR data becomes time consuming and unrealistic. An automatic detector of fault creep in InSAR data is called for.<br />
Here, we developed an automatic detector using pattern recognition algorithm developed for road detection in SAR data to<br />
find shallow fault creep in InSAR data. The main workflow includes: process InSAR data, make gradient image of the phase<br />
image, detect linear features, and report possible fault creep. We tested this detector in Salton Trough with ERS, ENVISAT and<br />
ALOS data. Our method successfully detected most fault creep, mainly on the Superstition Hills Fault and San Andreas Fault.<br />
Limitations of the method include: prefer flat area with little sharp topography change; only be able to detect displacement<br />
larger than ~1 cm; can't detect deep fault creep. Nevertheless, this detector is a useful tool for monitoring shallow fault creep.<br />
REGIONAL BROADBAND WAVEFORM MODELING USING UPGOING AND DOWNGOING WAVE FIELDS<br />
(A-116)<br />
S. Wei and D. Helmberger<br />
3D crustal structure usually complicates the modeling of regional waveforms. The Cut and Paste (CAP) waveform inversion<br />
method, on the other hand, is much less sensitive to velocity models and lateral crustal variation, because it breaks the<br />
waveforms into Pnl and Surface waves and inverts them separately, allowing different time shifts to align the data and the<br />
synthetics for different portions of the waveform. These time shifts represent the difference between the 1D structure and the<br />
real earth. Similar idea is applied to the upgoing and downgoing wave fields, where we use different time adjustments for<br />
upgoing and downgoing waveforms to improve the broadband waveform fits. Furthermore, different source-time-functions<br />
250 | Southern California Earthquake Center
Poster Abstracts<br />
are adopted for upgoing and downgoing phases to take into account of the directivity effect of the source process in vertical<br />
direction. The sensitivity tests indicate that, the separation with adjustable time shifts can better fit the waveforms especially<br />
the depth phases. The improved method is applied to the 2003 Big Bear sequence to derive lateral crustal structure.<br />
CAN FAULT MAPS CONSTRAIN FUTURE EARTHQUAKE MAGNITUDES? (B-082)<br />
D.A. Weiser<br />
Can one use an existing fault map to accurately determine maximum magnitude for earthquakes in a region? It is generally<br />
assumed that fault traces constrain the location, orientation, and size of future earthquakes. Yet many earthquakes, like the<br />
M7.3, 1992 Landers, CA and M7.9, 1999 Denali, AK earthquakes, rupture beyond previousl 251 y 251<br />
251 m 251 a 251 p 251 p 251 e 251 d 251 251 t 251 r 251 a 251 c 251 e 251 s 251 251 o 251 r 251 251 a 251 r 251 e 251<br />
251 t 251 r 251 a 251 n 251 s 251 f 251 e 251 r 251 r 251 e 251 d 251 251 o 251 n 251 t 251 o 251 251 a 251 251 s 251 p 251 l 251 a 251 y 251<br />
251f 251a 251u 251l 251t 251. 251 251 O 251t 251h 251e 251r 251 251 e 251v 251e 251n251t 251s 251, 251 251l251i251 k 251e 251<br />
251t251h251e251 251M2516251.2517251,251 2511251925192514251 251N251o251r251t251h251r251i251d251g251e251,251<br />
251C251A251,251 251t251h251e251 251M2517251.2510251 2512251025112510251 251D251a251r251f251i251e251l251d251,251<br />
251N251e251w251 251Z251e251a251l251a251n251d251,251 251a251n251d251 251M2516251.2513251 2512251025112511251<br />
251C251h251r251i251s251t251c251h251u251r251c251h251,251 251N251e251w251 251Z251e251a251l251a251n251d251<br />
251 e 251 a 251 r 251 t 251 h 251 q 251 u 251 a 251 k 251 e 251 s 251 , 251 251 s 251 e 251 r 251 v 251 e 251 251 a 251 s 251<br />
251 a 251 d 251 d 251 i 251 t 251 i 251 o 251 n 251 a 251 l 251 251 e 251 v 251 i 251 d 251 e 251 n 251 c 251 e 251 251 t 251 h 251 a 251 t 251<br />
251l251a251r 251g251e251 251e251a251r251t251h251q 251u 251a 251k251e251s251 251c251a251n251 251a251n251d251<br />
251d251o251 251o251c251c251u251r251 251w251h251e251r251e251 251n251o251 251f251a251u251l251t251 251h251a251d251<br />
251b 251e 251 e 251n 251 251i 251d 251e 251n 251t 251i 251f 251 i 251e 251d 251. 251 251 251 T 251h 251i 251s251 251i251 s 251<br />
251 i 251 m 251 p 251 o 251 r 251 t 251 a 251 n 251 t 251 251 b 251 e 251 c 251 a 251 u 251 s 251 e 251<br />
251 r 251 e 251 g 251 r 251 e 251 s 251 s 251 i 251 o 251 n 251 s 251 251 b 251 e 251 t 251 w 251 e 251 e 251 n 251<br />
251 m 251 a 251 g 251 n 251 i 251 t 251 u 251 d 251 e 251 251 a 251 n 251 d 251 251 r 251 u 251 p 251 t 251 u 251 r 251 e 251<br />
251 d 251 i 251 m 251 e 251 n 251 s 251 i 251 o 251 n 251 s 251 251 a 251 r 251 e 251 251 b 251 a 251 s 251 e 251 d 251 251 o 251 n 251<br />
251p251o251s251t251-251e251a251r251t251h251q251u251a251k251e251 251m251a251p251s251 251o251f251 251t251h251e251<br />
251 s 251 u 251 r 251 f 251 a 251 c 251 e 251 251 r 251 u 251 p 251 t 251 u 251 r 251 e 251 251 a 251 n 251 d 251<br />
251 i 251 n 251 s 251 t 251 r 251 u 251 m 251 e 251 n 251 t 251 a 251 l 251 251 d 251 a 251 t 251 a 251 . 251 251 T 251 h 251 e 251 s 251 e 251<br />
251 r 251 e 251 g 251 r 251 e 251 s 251 s 251 i 251 o 251 n 251 s 251 251 a 251 r 251 e 251 251 t 251 h 251 e 251 n 251<br />
251 e 251 m 251 p 251 l 251 o 251 y 251 e 251 d 251 251 t 251 o 251 251 e 251 s 251 t 251 i 251 m 251 a 251 t 251 e 251<br />
251 m 251 a 251 g 251 n 251 i 251 t 251 u 251 d 251 e 251 251 o 251 f 251 251 f 251 u 251 t 251 u 251 r 251 e 251<br />
251e251a251r251t251h251q251u251a251k251e251s251,251 251u251s251i251n251g251 251e251x251i251s251t251i251n251g251<br />
251f251a251u251l251t251 251m251a251p251s251.251 251S251i<br />
SPATIAL DISTRIBUTIONS OF FORESHOCKS AND AFTERSHOCKS: STATIC OR DYNAMIC TRIGGERING?<br />
(B-027)<br />
M.J. Werner and A.M. Rubin<br />
In recent years, the spatial distributions of foreshocks and aftershocks have been scrutinized for evidence supporting either<br />
triggering by static stress changes induced by the permanent deformation from prior earthquakes or triggering by the<br />
dynamic stresses from seismic waves. Felzer & Brodsky (2006) identified mainshocks and triggered aftershocks, stacked the<br />
distances between these pairs and observed a single power-law decay with distance that extends beyond the zone<br />
traditionally thought to be affected by static stress changes. On this basis, they argued that dynamic stresses are responsible<br />
for triggering 251 e 251a 251r 251 t 251 h 251 q 251 u 251a 251 k 251e 251s 251. 251 251 R 251i 251c 251 h 251a 251r 251 d 251 s 251-<br />
251 D 251 i 251 n 251 g 251 e 251 r 251 251 e 251 t 251 251 a 251 l 251 . 251 251 ( 251 2 251 0 251 1 251 0 251 ) 251 251 a 251 n 251 d 251<br />
251 o 251 t 251 h 251 e 251 r 251 251 s 251 t 251 u 251 d 251 i 251 e 251 s 251 , 251 251 h 251 o 251 w 251 e 251 v 251 e 251 r 251 , 251<br />
251h251a251v251e251 251p251r251e251s251e251n251t251e251d251 251s251e251v251e251r251a251l251 251l251i251n251e251s251<br />
251 o 251 f 251 251 e 251 v 251 i 251 d 251 e 251 n 251 c 251 e 251 251 t 251 h 251 a 251 t 251 251 s 251 u 251 g 251 g 251 e 251 s 251 t 251<br />
251 o 251 t 251 h 251 e 251 r 251 w 251 i 251 s 251 e 251 . 251 251 O 251 n 251 e 251 251 c 251 r 251 u 251 c 251 i 251 a 251 l 251<br />
251 q 251 u 251 e 251 s 251 t 251 i 251 o 251 n 251 251 i 251 s 251 251 w 251 h 251 e 251 t 251 h 251 e 251 r 251 251 t 251 h 251 e 251<br />
251s251t251a251c251k251e251d251 251d251i251s251t251a251n251c251e251s251 251o251f251 251p251a251i251r251s251<br />
251 o 251 f 251 251 e 251 a 251 r 251 t 251 h 251 q 251 u 251 a 251 k 251 e 251 s 251 , 251<br />
251 r 251 e 251 p 251 r 251 e 251 s 251 e 251 n 251 t 251 i 251 n 251 g 251 251 e 251 i 251 t 251 h 251 e 251 r 251<br />
2011 <strong>SCEC</strong> <strong>Annual</strong> <strong>Meeting</strong> | 251
Poster Abstracts<br />
252 m 252 a 252 i 252 n 252 s 252 h 252 o 252 c 252 k 252 - 252 a 252 f 252 t 252 e 252 r 252 s 252 h 252 o 252 c 252 k 252 252 o 252 r 252<br />
252f252o252r252e252s252h252o252c252k252-252m252a252i252n252s252h252o252c252k252 252p252a252i252r252s252,252<br />
252 a 252 r 252 e 252 252 i 252 n 252 252 f 252 a 252 c 252 t 252 252 c 252 o 252 r 252 r 252 e 252 c 252 t 252 l 252 y 252<br />
252 i 252 d 252 e 252 n 252 t 252 i 252 f 252 i 252 e 252 d 252 252 a 252 n 252 d 252 252 n 252 o 252 t 252<br />
252 m 252 i 252 s 252 a 252 t 252 t 252 r 252 i 252 b 252 u 252 t 252 e 252 d 252 , 252 252 u 252 n 252 r 252 e 252 l 252 a 252 t 252 e 252 d 252<br />
252e252a252r252t252h252q252u252a252k252e252s252.252 252T252h252i252s252 252q252u252e252s252t252i252o252n252<br />
252i252s252 252e252s252p252e252c252i252a252l252l252y252 252i252m252p252o252r252t252a252n252t252 252i252n252<br />
252t252h252e252 252c252r252i252t252i252c252a252l252 252d252i252s252t252a252n252c252e252 252r252a252n252g252e252<br />
252 o 252 f 252 252 s 252 e 252 v 252 e 252 r 252 a 252 l 252 252 t 252 o 252 252 t 252 e 252 n 252 s 252 252 o 252 f 252<br />
252 e 252 a 252 r 252 t 252 h 252 q 252 u 252 a 252 k 252 e 252 252 r 252 a 252 d 252 i 252 i 252 , 252 252 o 252 v 252 e 252 r 252<br />
252w 252h 252i 252c 252h 252 252s252t252a252t 252i252c 252 252s 252t 252r 252e 252s 252s 252e252s 252 252a 252r 252e 252<br />
252t252h252o252u252g252h252t252 252t252o252 252b252e252 252t252o252o252 252s252m252a252l252l252 252t252o252<br />
252 a 252 f 252 f 252 e 252 c 252 t 252 252 s 252 e 252 i 252 s 252 m 252 i 252 c 252 i 252 t 252 y 252 . 252 252 I 252 f 252<br />
252 e 252 a 252 r 252 t 252 h 252 q 252 u 252 a 252 k 252 e 252 252 p 252 a 252 i 252 r 252 s 252 252 i 252 n 252 252 t 252 h 252 i 252 s 252<br />
252 r 252 a 252 n 252 g 252 e 252 252 a 252 r 252 e 252 252 n 252 o 252 t 252 252 c 252 a 252 u 252 s 252 a 252 l 252 l 252 y 252<br />
252r252e252l252a252t252e252d252,252 252t252h252e252n252 252t252h252e252 252h252i252s252t252o252g252r252a252m252<br />
252o252f252 252f252o252r252e252s252h252o252c252k252-252m252a252i252n252s252h252o252c252k252 252a252n252d252<br />
252m252a252i252n252s252h252o252c252k252-252a252f252t252e252r252s252h252o252c252k252 252p252a252i252r252s252<br />
252 s 252 h 252 o 252 u 252 l 252 d 252 252 b 252 e 252 252 i 252 d 252 e 252 n 252 t 252 i 252 c 252 a 252 l 252 . 252<br />
252P 252r252e252l252i252m252i252n252a 252r 252y 252 252r 252e 252s 252u252l252t252s252 252u252s252i252n 252g 252<br />
252 s 252 o 252 u 252 t 252 h 252 e 252 r 252 n 252 252 C 252 a 252 l 252 i 252 f 252 o 252 r 252 n 252 i 252 a 252<br />
252s252e252i252s252m252i252c252i252t252y252 252r252o252u252g252h252l252y252 252r252e252p<br />
INJECTING INFORMATION FROM STATIC COULOMB MODELS INTO STATISTICAL AFTERSHOCK<br />
MODELS FOR THE CANTERBURY, NEW ZEALAND, EARTHQUAKE SEQUENCE (B-101)<br />
C.A. Williams, M.C. Gerstenberger, and S. Steacy<br />
The Canterbury earthquake sequence began with the Mw 7.1 Darfield earthquake in September, 2010, and continues to the<br />
present. This event was followed by events in February, 2011 (Mw 6.3) and June, 2011 (Mw 6.0), causing severe damage to the<br />
city of Christchurch, where the level of seismic hazard was previously thought to be moderate. The occurrence of these events,<br />
as well as numerous smaller aftershocks, will obviously perturb the pre-existing stress field in this vicinity. We are exploring<br />
methods of estimating these stress changes and then using this information to revise existing statistical models of earthquake<br />
occurrence. The problem is made more difficult by the uncertainties involved in Coulomb stress calculations. These<br />
uncertainties involve both the source fault parameters (e.g., fault geometry and slip distribution) and target fault parameters<br />
(orientation, frictional properties, etc.). We address these problems by allowing the different parameters to vary, thus<br />
providing a suite of possible models. Using this suite of models, we can then compute the mean and variance of the computed<br />
Coulomb stresses and use this as the input for the modified statistical models. We use the estimated stress changes in two<br />
different ways. In the first approach, we use a rate and state model to forecast aftershock probabilities. In the second, we use a<br />
simplified approach that uses only the polarity of the stress changes to redistribute the forecasts from statistical aftershock<br />
models. Using these approaches, we plan to provide revised aftershock probabilities for the Canterbury region.<br />
TSUNAMI HAZARD MAPPING ACTIVITIES IN SOUTHERN CALIFORNIA (B-098)<br />
R. Wilson, K. Miller, C. Real, J. Goltz, and J. Treiman<br />
The California Geological Survey (CGS) and its partner agency in the state tsunami program, the California Emergency<br />
Management Agency (CalEMA), have completed a number of tsunami hazard mapping products and plan additional work in<br />
southern California over the next several years. Funded by the National Tsunami Hazard Mitigation Program (NTHMP), CGS,<br />
CalEMA, and the University of Southern California – Tsunami Research Center completed work on 130 tsunami inundation<br />
maps for emergency response planning that cover all at-risk communities within the state (maps on www.tsunami.ca.gov).<br />
These maps are based on extreme, but realistic scenarios from forty local and distant sources, and cover all at-risk, populated<br />
areas along the coast, including over 90% of the southern California coast. New maps for Catalina Island will be completed<br />
within by the end of 2011.<br />
Additional tsunami hazard mapping activities by CGS and CalEMA include: 1) production of tsunami hazard zone maps for<br />
land-use planning under the 1990 Seismic Hazard Zonation Act; 2) production of tsunami current hazard maps and offshore<br />
252 | Southern California Earthquake Center
Poster Abstracts<br />
safety zones for the maritime community; 3) completion of a tsunami deposit and tsunami source database; and, 4) formation<br />
of pre-tsunami field teams to observe and collect data during and after a tsunami. A pilot project for the land-use planning<br />
maps, which will require a probabilistic tsunami hazard analysis, has been initiated in the City of Huntington Beach. The<br />
maritime community maps, which will include in-harbor tsunami hazard maps and offshore safety zone, have also been<br />
initiated with likely “pilot” locations in Ventura Harbor, the Ports of Los Angeles and Long Beach, and San Diego Bay. The<br />
two tsunami databases for deposits and sources will be completed by 2012 to help evaluate existing tsunami hazard mapping<br />
products and guide future products for both emergency response and land-use planning. During and after the March 11, 2011<br />
tsunami, which caused over $50-million in damage to two dozen harbors in the state, data collected by the pre- and posttsunami<br />
field team will also help evaluate the tsunami modeling and mapping methods used by the state, especially as they<br />
relate to strong tsunami currents within harbors.<br />
CORRELATION OF PEAK DYNAMIC AND STATIC COULOMB FAILURE STRESS WITH SEISMICITY<br />
RATE CHANGE AFTER THE M7.2 EL MAYOR-CUCAPAH EARTHQUAKE (B-102)<br />
K.B. Withers and K.B. Olsen<br />
We have investigated the relation between the April 4 Mw7.2 El Mayor-Cucapah earthquake and seismicity rate changes in<br />
southern California and northern Baja California in the months following the mainshock. Specifically, we use dynamic rupture<br />
models with observational constraints for the event simulated in the <strong>SCEC</strong> 3D CVM4.0 (Roten and Olsen, 2009) to calculate the<br />
resulting static (ΔCFS) and dynamic Coulomb failure stress changes, ΔCFS(t), parameterized by its largest positive amplitude<br />
(peak ΔCFS(t)). The seismicity rate changes are estimated using the Z-value (Haberman, 1983) using both undeclustered and<br />
declustered datasets (with a magnitude of completeness equal to 1.5), and show varying goodness of fit values with different<br />
time periods after the mainshock (ranging from a day to 1 year). We employ different methods to measure the correlation<br />
between the seismicity rate change and both ΔCFS and peak ΔCFS(t) in time and space, in order to estimate the most efficient<br />
triggering parameter for the aftershocks, including a ternary map comparison (as used by Kilb et. al, 2002) and crosscorrelation.<br />
We perform this analysis using both CVM-4 and CVM-H, investigating, in particular, which model better<br />
describes the increased seismicity NW of the rupture. We have rotated the stress changes onto focal mechanisms of several<br />
Mw5 aftershocks as well as onto optimum oriented planes (King, 1994). We find that increases in static stress changes closer to<br />
the fault can explain nearby aftershocks, while the triggering of those farther away are more likely attributed to dynamic stress<br />
changes, where static stress change is nearly zero. We attempted to define an estimate of potential threshold level of static and<br />
dynamic stress change required to trigger earthquakes/aftershocks of different magnitude, but thus far have found no<br />
definitive relation.<br />
THERMAL FLUID AND FAULT INTERACTIONS AT THE INTERSECTION OF TWO FAULTS, AGUA<br />
CALIENTE, CALIFORNIA (A-099)<br />
R.E. Wood and J.P. Evans<br />
Agua Caliente Springs lies at a unique intersection between the NNW-trending Elsinore fault and the 40° northeast-dipping,<br />
likely inactive West Salton detachment fault; it provides an opportunity to study damage zone geometry, fault behavior in<br />
crystalline rocks, a left-stepover, microseismicity, and the influence of thermal fluids on rock deformation. The Elsinore fault<br />
bounds the northwestern flank of the Tierra Blanca Mountains with strike-slip and normal motion; the detachment fault wraps<br />
around the northernmost portion of the mountains. Damage along the Elsinore ranges in thickness from a narrow slip plane to<br />
> 100 m along the eastern flank of the Tierra Blanca Mountains. Subsidiary faults trend northeast and southeast, and slip<br />
orientations vary from normal to strike-slip horizontal motion. Thermal fluids (~30°C) emerge at the intersection of the West<br />
Salton detachment and Elsinore faults actively alter the 94 Ma La Posta tonalite pluton, already fractured and crushed during<br />
fault slip, to a fine-grained white to orange powder through mineral re-equilibration. Grain sizes decrease with closer<br />
proximity to the faults. Fault cores contain thin dark green zones of chlorite ± epidote, and fault surfaces are coated with a thin<br />
layer of the same. Origin of the mineralization may be from reworked biotite crystals. We present water chemistry data from<br />
the hot springs at Agua Caliente in conjunction with geochemical and petrographic analysis of the surrounding rock. Water<br />
analyses include cation and anion measurements, bicarbonate, stable isotopes, tritium, and a multi-month recording of spring<br />
conductivity, water level, and temperature fluctuations. Cation geothermometry shows the fluids are enriched in Na, Ca, Mg,<br />
K, and Si from broken down quartz, plagioclase, and orthoclase. Water level and temperature data are compared to seismicity<br />
during the logging interval; temperatures so far have diurnal fluctuations indicating air temperature plays a larger role than<br />
anticipated for the subsurface fluids. Conductivity also displays daily cycles. We propose a larger scale map of the intersection<br />
of the two faults and the continuation of the Elsinore farther south showing the current extent and probable growth of the<br />
2011 <strong>SCEC</strong> <strong>Annual</strong> <strong>Meeting</strong> | 253
Poster Abstracts<br />
damage and alteration as more slip occurs. Spring flow increases post seismic events, and we believe by monitoring fluid<br />
chemistry and comparing seismicity along the faults we will see precursors to and effects from fault motion.<br />
TELESEISMIC P WAVE CODA OF SUBDUCTION EARTHQUAKES FROM WAVE INTERACTION NEAR<br />
TRENCHES (B-059)<br />
W. Wu and S. Ni<br />
Teleseismic P waves are essential for imaging rupture processes of great earthquakes, either in the back projection method or<br />
in finite fault inversion method involving of quantitative waveform modeling. In these studies, P waves are assumed to be<br />
direct P waves generated by localized patches of the ruptured fault. However these methods fail to produce accurate rupture<br />
models when some portion of the P waves are later arrivals generated by structural complexities such as mantle<br />
discontinuities or rapid lateral variation. For ~M7 earthquakes near the 2011 M9 Tohoku-Oki earthquake, we observed strong<br />
long period (10~20s) signals between P and PP on seismic network in eastern and central US. These P wave coda signals show<br />
strong coherence and are frequency dependent. The coda's amplitudes are comparable with those of the direct P wave in the<br />
10-20s band and are much weaker in shorter period. With array analysis, we find that the coda's slowness is very close to that<br />
of the direct P wave, suggesting that they are generated near the source region. There have been reports of the coherent P<br />
wave coda interpreted as the P wave converted or reflected in the upper mantle discontinuities, but their amplitudes should<br />
be much smaller than those of the direct P wave. As the earthquakes occur near the Japan trench featuring rapid variation in<br />
bathymetry, we hypothesize that the coda waves are converted from surface waves at the trench.<br />
To investigate the effects of the bathymetry on P wave coda, we apply ray theory to interface full wave field from spectralelement<br />
simulation to get the teleseismic P waves. With this approach, computation efficiency is greatly improved. The<br />
simulation results demonstrate that the surface wave can be severely scattered by the trench structure and coherent P waves<br />
are generated. We find that the coda's amplitudes are mainly controlled by the focal mechanism and depth. The frequency<br />
dependent feature from our simulation is also consistent with the observation that P coda is strongest in the 10-20s band. Thus,<br />
the coherent long period P codas are confirmed to be generated by the rapid variation of bathymetry near the trenches. Our<br />
study argues that the topography/bathymetry effect should be taken into account when imaging rupture processes of mega<br />
thrust earthquakes with teleseismic P waves.<br />
PROPERTIES OF INELASTIC YIELDING ZONES GENERATED BY IN-PLANE DYNAMIC RUPTURES (A-079)<br />
S. Xu, Y. Ben-Zion, and J.-P. Ampuero<br />
We investigate the spatial distribution and intensity of off-fault yielding, the local orientation of the expected microfractures<br />
inside the yielding zone, and scaling relations or correlations among different measurable quantities. The study employs<br />
simulations of in-plane dynamic ruptures on a frictional fault governed by slip-weakening and rate-and-state friction laws,<br />
with a Mohr-Coulomb type off-fault inelastic response and a possible contrast of elasticity across the fault. The results indicate<br />
in agreement with previous studies that the location and spatial pattern of the yielding zones are strongly affected by the<br />
angle \Psi of the background maximum compressive stress relative to the fault. The yielding extent depends strongly on<br />
rupture mode (crack- or pulse-like), the seismic S ratio representing the initial stress level relative to failure, and the value of<br />
rock cohesion c. For cracks, the yielding zone thickness T linearly increases with the rupture distance L and the ratio of T/L is<br />
inversely proportional to the square of S. For pulses, the local T positively correlates with the maximum slip velocity at the<br />
point, while the average T along-strike approaches a constant for a range of S values (although it can change for other S levels).<br />
The yielding zone thickness for both rupture modes is reduced by increasing c. The magnitude of plastic strain decays<br />
logarithmically with fault normal distance, while its maximum value close to the fault approaches a constant along strike as<br />
the rupture speed is gradually stabilized. The local angle to the fault of the expected microfractures (assumed to be tensile)<br />
inferred from the distributed plastic strain is generally shallower and steeper than \Psi in the compressional and tensional<br />
quadrants, respectively. With a velocity contrast across the fault, ruptures can have preferred propagation direction that is the<br />
same as the slip in the compliant medium (positive direction) or opposite propagation direction, depending on a competition<br />
between dynamic changes of normal stress across the bimaterial interface and generation of off-fault yielding. With large<br />
values of \Psi representing large strike-slip faults, the off-fault yielding enhances the bimaterial effect and promotes<br />
propagation in the positive direction, with larger rupture and slip velocities, and with a more prominent off-fault yielding<br />
zone.<br />
FULL-3D WAVEFORM TOMOGRAPHY FOR NORTHERN CALIFORNIA USING AMBIENT-NOISE CROSS-<br />
CORRELATION GREEN'S-FUNCTIONS (B-042)<br />
254 | Southern California Earthquake Center
Z. Xu and P. Chen<br />
Poster Abstracts<br />
We cross-correlate the vertical components of ambient seismic noise data recorded on USArray broadband stations in the<br />
northern California area to estimate inter-station Green's functions.These ambient-noise Green’s functions are then compared<br />
with synthetic Green’s functions computed using the finite-difference method in a hybrid 3D reference model obtained by<br />
combining the California state-wide 3D seismic velocity model provided by Lin et al. (2010) with the USGS 3D seismic velocity<br />
model for the San Francisco Bay Region. The adjoint method is adopted to construct the gradient of the misfit functional,<br />
which is defined in terms of the frequency-dependent phase-delay measurements made on time-localized surface waves on<br />
the ambient-noise Green’s functions and the synthetics computed using our 3D starting model. The first iteration of our<br />
inversion involves nearly 3200 inter-station paths that provide good coverage of northern California. After the first iteration,<br />
the updated 3D seismic velocity model provides nearly 50% reduction in the misfit functional. By carrying out more iterations<br />
and including more waveforms from ambient-noise Green’s functions as well as waveforms from natural earthquakes, our<br />
studies will gradually improve the regional seismic velocity model in northern California.<br />
THE PERMEABILITY VARIATIONS ON THE WENCHUAN FAULT MEASURED ON THE WATER LEVEL<br />
RESPONSE TO SOLID EARTH TIDES (A-088)<br />
L. Xue, E.E. Brodsky, H. Li, H. Wang, and J. Pei<br />
The mechanics of slip during an earthquake depends critically on the hydrologic properties. The in situ fault zone<br />
hydrological properties are difficult to measure and have never directly been constrained on the fault zone immediately after a<br />
large earthquake. In this work, we analyze 1.5 years of continuous data from the Wenchuan Fault Zone which was the site of<br />
the Mw 7.9 Wenchuan earthquake. We find that the hydraulic diffusivity D of Wenchuan Fault Zone is 0.03 m2/s, which is<br />
two orders of magnitude larger than pump test values on the Chelungpu Fault which is the site of the Mw 7.6 Chi-Chi<br />
earthquake. This measurement at Wenchuan was made by continuously monitoring the response of the well to the solid Earth<br />
tides. The solid earth tides impose a dilatational strain on the formation that pumps water cyclically in and out of the well. By<br />
measuring the phase and amplitude response, we can constrain the transmissivity and storage of the damage zone at 200-600<br />
m form the principal slip zone assuming an isotropic, homogenous and laterally extensive aquifer. We evaluated the phase<br />
and amplitude responses for solid Earth tide in both frequency domain and time domain, and these two separate methods<br />
yield almost identical results. The average phase lag is 25 degree, and the average amplitude response is 6x10⁻⁷ strain/m.<br />
According to the Heish model, we solve for storage coefficient S 2.2x10⁻⁴ and transmissivity T 6.6x10⁻⁶ m2.<br />
Calculation for the hydraulic diffusivity D with D=T/S, yields the reported value of D is 0.03 m2/s,which is a high number<br />
compared with the thermal diffusivity 10-6 m2/s.If the value is representative of the fault zone,then this means the hydrology<br />
processes should have an effect on the earthquake rupture process.One advantage of this tidal response method is that it is<br />
passive and so the D is accurately recording the in situ permeability undisturbed by the potential effects of a pump test. In the<br />
previous studies, Kitagawa et al.,[2002] reported the permeability of Nojima Fault decreased 50% over three years and<br />
Brenguier et al.,[2008] observed seismic velocity decreased by 0.08% immediately after the Parkfield earthquake and<br />
posetseismic velocity remained low for 3 years.We did not observe a significant healing signal recorded in the well after the<br />
2008 Wenchuan earthquake. It seems that permeability of Wenchuan Fault does not follow expected healing behavior. This<br />
poses constraints on any geochemically-based model of fault zone healing.<br />
COMPUTING A LARGE REFINED CATALOG OF FOCAL MECHANISMS FOR SOUTHERN CALIFORNIA<br />
(1981 – 2010) (B-077)<br />
W. Yang, E. Hauksson, and P.M. Shearer<br />
We calculate focal mechanisms for earthquakes that occurred in the southern California region from 1981 to 2010 using the<br />
HASH method and locations derived from waveform cross-correlation. Each focal mechanism is obtained from grid searching<br />
for the best-fitting double-couple focal mechanism solution to both the P-wave first motion records that were picked by<br />
network analysts, and the S/P amplitude ratios computed from three-component seismograms. We process more than 410,000<br />
earthquakes, and analyze the statistical features of the whole data set. As more S/P amplitude ratios become available after<br />
2000, the average focal plane uncertainty decreases significantly compared with solutions that include only P-wave first<br />
motions. We filter the preliminary data set with criteria associated with mean fault plane uncertainty and azimuthal gap, and<br />
obtain a high quality focal mechanisms catalog with approximately 179,000 earthquakes. In general the parameters of the focal<br />
mechanisms have been stable during the three decades. The dominant style of faulting is high angle right-lateral strike-slip<br />
faulting with the most likely strike angle centered at 150°/330°. For earthquakes of M < 2.5, there are more normal faulting<br />
2011 <strong>SCEC</strong> <strong>Annual</strong> <strong>Meeting</strong> | 255
Poster Abstracts<br />
events than reverse faulting events while the opposite holds for M>2.5 events. A comparison of 23,000 common earthquakes<br />
shows our results generally agree with the focal mechanism catalog obtained by Hardebeck and Shearer (2003). Using 211<br />
moment tensor solutions in Tape et al (2010) as benchmarks, we compare the focal plane rotation angles of common events in<br />
the catalog. 69% of common earthquakes in both catalogs match well, with rotation angles less than 35°. The common events<br />
with relatively large rotation angles are either located around the edge of the SCSN network or poorly recorded.<br />
PRELIMINARY RESULTS ON THE ANALYSIS OF THE DEVIATORIC STRESS FIELD FROM FOCAL<br />
MECHANISMS AND SLIP-LINE FIELD FROM CONJUGATE LINEAR SEISMICITY CLUSTERS IN<br />
SOUTHERN CALIFORNIA (B-139)<br />
W. Yang and E. Hauksson<br />
We analyze the spatial and temporal variations of the deviatoric stress field and the geometric properties of conjugate linear<br />
seismicity clusters in the southern California region using earthquake data recorded by the SCSN from 1981 to 2011. Using a<br />
data set with about 179,000 high quality focal mechanisms that were determined from P first motions and S/P amplitude<br />
ratios, we invert for the variation in the stress field in time and space using the SATSI method. The inversion results match<br />
with results from prior studies with a predominant NS to NNE orientation of maximum horizontal stress, but our results<br />
reveal the stress field at higher level of resolution because we use a larger data set than was available before. The results show<br />
that the stress field exhibits minimal regional temporal variations, but some variations exist in small areas close to large<br />
mainshocks. Similarly, localized depth variations in the stress field suggest the possible existence of vertical strain partitioning.<br />
We determine a data set with approximate 8,000 seismicity clusters using waveform cross-correlation and a clustering method.<br />
We calculate the geometrical properties of clusters. Pairs of conjugated linear clusters exist across southern California. The<br />
angles between conjugate linear clusters in the direction of maximum shortening range from 80 [deg] to 160 [deg], with a<br />
median value of 120 [deg] and a mode value of 115 [deg]. The bisection of conjugate linear clusters in the direction of<br />
maximum shortening generally match with the maximum horizontal stress orientation, which implies a relation between<br />
orientation of the stress field and the orientation of clusters. We infer that the variation of conjugate angles is associated with<br />
brittle and ductile deformation, and apply slip-line field theory to interpret such observations. Overall, our observations<br />
provide new understanding of the kinematic crustal process in southern California.<br />
COMPLEX RUPTURE MODES OF THE 2011 MW 9.0 TOHOKU-OKI EARTHQUAKE INFERRED FROM<br />
TELESEISMIC AND LOCAL WAVEFORMS (B-037)<br />
H. Yao<br />
The 2011 Mw 9.0 Tohoku-Oki earthquake occurred in the offshore Tohoku region in Japan, the Western Pacific subduction<br />
zone. It had very large coseismic slip (30-40 m) in the up-dip region close to the trench and tens of thousands of aftershocks<br />
dominantly in the down-dip region close to the coast. We have analyzed broadband teleseismic P-wave data from about 500<br />
stations in the central and western US as well as local strong-motion waveforms from F-net and KiK-net in Japan to infer the<br />
rupture characteristics. We apply the newly developed time-domain iterative back-projection (IBP) method (with subevent<br />
waveform stripping and subevent relocation) to investigate the spatiotemporal distribution of subevents (P-wave energy<br />
radiation) in the source region in two frequency bands (0.2-1 and 0.05-0.2Hz). We also use a new frequency-domain method<br />
for sparse source inversion, compressive sensing (CS), to study the spatiotemporal distribution of P-wave energy radiation in<br />
four frequency bands between 0.05 and 1 Hz. In addition, we resolve slip details from finite-fault slip inversion of strong<br />
motion data from F-net and KiK-net in the low frequency band (0.005-0.05 Hz). Our results suggest a complicated rupture<br />
process, which is not well described by a constant velocity rupture from the hypocenter. Our results suggest that most highfrequency<br />
seismic energy was radiated near the epicenter for at least the first 80 s. Although the rupture was bilateral,<br />
significant southward rupture mainly occurred after 100 s, as seen from the spatiotemporal distribution of subevents or<br />
energy radiation in both low and high-frequency bands. Our analyses show that the earthquake has frequency-dependent<br />
rupture modes. Radiated high-frequency energy mainly came from the down-dip region, which is similar to the aftershock<br />
distribution pattern. However, radiated low-frequency energy was dominant in the up-dip (offshore) region, which is<br />
consistent with much larger slip in the up-dip region from the low-frequency seismic slip inversion. This frequency-dependent<br />
rupture may be caused by differences in rupture behavior (more intermittently at high frequencies and more continuous at<br />
low frequencies) at the plate interface due to heterogeneous friction properties.<br />
STRAIN PARTITIONING IN LOS ANGELES (A-123)<br />
R.S. Yeats and D. Verdugo<br />
256 | Southern California Earthquake Center
Poster Abstracts<br />
The Whittier fault offsets major streams in the foothills of the Puente Hills, and it presents a hazard from a strike-slip<br />
earthquake. However, the fault has reverse separation, north-side-up, and its footwall is uplifted by folding imaged by oilwell<br />
data supported by shallow instrumental seismicity from Yang and Hauksson (2011). The Whittier fault masks an anticline<br />
deformed on an underlying blind reverse fault that poses a separate hazard.<br />
Similarly, the earthquake hazard from the Newport-Inglewood fault has been limited previously to right-lateral strike slip,<br />
similar to the 1933 Long Beach earthquake. However, Gilluly and Grant (1949) documented coseismic uplift immediately east<br />
of the fault in 1933, suggesting a reverse-fault subevent northwest of the strike-slip mainshock near Newport Beach. In<br />
addition, Hauksson (1987) documented reverse-fault-plane solutions, particularly in the northern half of the onshore fault<br />
trace. In addition, the discontinuous strike-slip fault traces in this part of the Newport-Inglewood zone extend along the crest<br />
of the broad Central Uplift anticline, bounded on the northeast by the active Compton-Los Alamitos reverse fault. We suggest<br />
that this deformation, like the Whittier fault system, involves strain partitioning.<br />
The Palos Verdes fault has a right-lateral strike-slip rate of 2.7-3.8 mm/yr in Los Angeles Harbor. However, marine terraces in<br />
the Palos Verdes Hills show reverse-oblique slip along the fault of 3.0-3.7 mm/yr. Brankman and Shaw (2009) identified a<br />
southwest-dipping reverse-oblique-slip fault with a long-term oblique-slip rate of 4 mm/yr.<br />
The next earthquake on one of these faults, then, could be a strike-slip fault like the 1933 Long Beach earthquake, a reverse-slip<br />
earthquake like the aftershocks of the 2010 Léogâne earthquake, or an oblique-reverse-slip event like the 1989 Loma Prieta<br />
earthquake. Each of these possibilities should be considered in the Community Fault Model.<br />
THE FUTURE OF VIRTUAL CALIFORNIA SIMULATIONS (B-110)<br />
M.B. Yikilmaz, J.B. Rundle, D.L. Turcotte, E.M. Heien, M.K. Sachs, and L.H. Kellogg<br />
The Virtual California (VC) simulation code produces a long term synthetic catalog of earthquakes on major faults in<br />
California. The input is the slip rates and the recurrence intervals on the faults. At the present time the simulations produce<br />
complexity and statistical distribution of earthquakes on major faults. Straight forward future studies can:<br />
1) Produce fault to fault correlations of activity (cross-correlations)<br />
2) Produce maps of shaking for California based on the long term synthetic catalogs available from VC.<br />
3) It is desirable to include the extension of displacements beneath the seismogenic zone. This is particularly important for<br />
fault to fault jumps.<br />
4) Currently, fault jumps are inhibited by the stiff elastic region between faults. It may be necessary to introduce damage zone<br />
to enhance transfer of stress.<br />
CHANGE IN STATISTICS FROM A DIMENSIONAL TRANSITION: MEASURING B = 1.5 FOR LARGE<br />
EARTHQUAKES (B-083)<br />
M.R. Yoder, J.R. Holliday, D.L. Turcotte, and J.B. Rundle<br />
We identify two distinct scaling regimes in the frequency-magnitude distribution of global earthquakes. Specifically, we<br />
measure the scaling exponent b = 1.0 for “small” earthquakes with 5.5 < m < 7.6 and b = 1.5 for “large” earthquakes with 7.6 <<br />
m < 9.0. This transition at mb = 7.6, can be explained by geometric constraints on the rupture. In conjunction with supporting<br />
literature, this corroborates theories in favor of fully self-similar and magnitude independent earthquake physics. We also<br />
show that the scaling behavior and abrupt transition between the scaling regimes implies that earthquake ruptures have<br />
compact shapes and smooth rupture-fronts.<br />
PRODUCTS AND SERVICES AVAILABLE FROM THE SOUTHERN CALIFORNIA EARTHQUAKE DATA<br />
CENTER (SCEDC) AND THE SOUTHERN CALIFORNIA SEISMIC NETWORK (SCSN) (B-066)<br />
E. Yu, A. Bhaskaran, S. Chen, M.J. Ihrig, F. Chowdhury, S. Meisenhelter, K. Hutton, D. Given, E. Hauksson, and R. Clayton<br />
Currently the SCEDC archives continuous and triggered data from nearly 8400 data channels from 425 SCSN recorded<br />
stations, processing and archiving an average of 6.4 TB of continuous waveforms and 12,000 earthquakes each year. The<br />
SCEDC provides public access to these earthquake parametric and waveform data through its website www.data.scec.<strong>org</strong> and<br />
through client applications such as STP and DHI. This poster will describe the most significant developments at the SCEDC<br />
during 2011.<br />
2011 <strong>SCEC</strong> <strong>Annual</strong> <strong>Meeting</strong> | 257
Poster Abstracts<br />
• The SCEDC has revamped its website. The changes make it easier for users to search the archive, discover<br />
updates and new content.<br />
• Post processing on El Mayor Cucapah 7.2 sequence continues. To date there have been 11847 events reviewed.<br />
Updates are available in the earthquake catalog immediately.<br />
• A double difference catalog (Hauksson et. al 2011) spanning 1981 to 6/30/11 will be available for download at<br />
www.data.scec.<strong>org</strong> and available via STP.<br />
• A focal mechanism catalog determined Yang et al. 2011 is available for distribution at www.data.scec.<strong>org</strong>.<br />
• Waveforms from Southern California NetQuake stations are now being stored in the SCEDC archive and<br />
available via STP as event associated waveforms.<br />
• As part of a NASA/AIST project in collaboration with JPL and SIO, the SCEDC will receive real time 1 sps<br />
streams of GPS displacement solutions from the California Real Time Network<br />
(http://sopac.ucsd.edu/projects/realtime; Genrich and Bock, 2006, J. Geophys. Res.). These channels will be archived<br />
at the SCEDC as miniSEED waveforms, which then can be distributed to the user community via applications<br />
such as STP.<br />
• STP sac output now includes picks from the SCSN.<br />
• The SCEDC is exploring the feasibility of archiving and distributing waveform data using cloud computing such<br />
as Google Apps. A month of continuous data from the SCEDC archive will be stored in Google Apps and a client<br />
developed to access it in a manner similar to STP. The data is stored in miniseed format with gzip compression.<br />
Time gaps between time series were padded with null values, which substantially increases search efficiency by<br />
make the records uniform in length.<br />
• In the past year, the SCEDC has collaborated with with NCEDC and USGS Golden, and IRIS to review the<br />
StationXML schema, make suggested changes, and and determine what software would be needed to develop<br />
StationXML writers and readers. Information on StationXML can be found at http://www.data.scec.<strong>org</strong>/xml/station/<br />
PALEOSEISMOLOGY AND SLIP RATE OF THE SAN GORGONIO PASS FAULT ZONE AT MILLARD<br />
CANYON: TESTING THE LIKELIHOOD OF THROUGH-GOING SAN ANDREAS RUPTURES (A-142)<br />
J.D. Yule and P.L. McBurnett<br />
Understanding the San Andreas fault (SAF) behavior in San G<strong>org</strong>onio Pass is essential to assess earthquake and hazard risks<br />
in southern California. Within the San G<strong>org</strong>onio Pass region the SAF system becomes complex and diffuse. Here, strike-slip<br />
segments to the north and south intersect with the thrust-dominated San G<strong>org</strong>onio Pass fault zone (SGPFZ). Two end-member<br />
hypotheses explain this 20 km wide, left-stepping zone in terms large earthquake behavior. The ‘enabler’ model suggests a<br />
through going rupture of M7.8 that ruptures from the Salton Trough to the Mojave Desert whereas the ‘barrier’ model forecast<br />
< M7.5 ruptures to the north and south that are arrested by the complexity of SGPFZ. Trenches excavated at the northern<br />
Millard Canyon site test these competing hypotheses by constraining the timing of large ruptures on the SGPFZ and<br />
comparing them chronologies on the SAF to the north and south of the Pass.<br />
Two ~55 m-long and 2-5 m-deep trenches cross a 2.5 m-high scarp that cuts an abandoned terrace riser. Paleoearthquakes are<br />
recognized by growth strata relations and secondary reverse faults. On lapping sequences buttress ground surface rupture<br />
events with intervals of unconformities between each on lapping unit. Ample detrital charcoal was present allowing dating of<br />
on lapping sequences constraining rupture timing and uplift rates. Displacement in Trench 1 shows growth folding of fluvial<br />
material with minor faulting. Preliminary total displacement measurements suggest ~9 m of total offset within the last ~2700<br />
yrs giving an average slip rate of 3 mm/yr. Four individual faulting events can be seen implying recurrence intervals of ~600-<br />
700 yrs.<br />
Our preferred model is the ‘enabler’ which allows SAF ruptures to propagate through the SGPFZ. Recurrence intervals change<br />
from ~100-200 yrs, as is common throughout the SAF, to intervals of ~600-700 yrs coinciding with lower slip rates. The SGPFZ<br />
complex structure may discourage through going ruptures, as with the 1812 rupture ending in Burro Flats, with through<br />
going ruptures occurring every 600-700 yrs on average. We also cannot rule out local ruptures contained within the SGPFZ as<br />
a possible source of faulting without surface rupture continuing north or south of the zone. Since 1906 most segments of the<br />
258 | Southern California Earthquake Center
Poster Abstracts<br />
SAF have had a major rupture event with the exception of the southern SAF. With no historical record or rupture on this<br />
segment of the SAF within the last 600-700 yrs, a rupture event may be imminent.<br />
RELATIONS BETWEEN PROPERTIES OF SEISMICITY AND REGIONAL HEAT FLOW IN CALIFORNIA (B-<br />
028)<br />
I. Zaliapin and Y. Ben-Zion<br />
This work continues exploration of the relations between dynamics of seismicity and physical properties of the lithosphere.<br />
We establish quantitative connections between the existence and productivity of different types of seismicity (foreshocks,<br />
aftershocks, background activity, swarms) and regional heat flow in California. Methodologically, we first represent the<br />
seismicity as a sequence of statistically significant clusters using the approach of Zaliapin et al. [PRL, 2008]. The multi-event<br />
clusters largely correspond to individual foreshock-mainshock-aftershock sequences or swarms. Within each cluster we<br />
compute the number, total seismic moment, and rupture area of events. We demonstrate that the heat flow is positively<br />
correlated with (i) total offspring number, seismic moment, and rupture area, (ii) foreshock production relative to that of<br />
aftershocks, measured by number, moment, or rupture area, and (iii) average duration of foreshock and aftershock series<br />
(absolute as well as normalized by the mainshock magnitude). In addition, the heat flow is (iv) negatively correlated with<br />
average distance between offsprings and the respective mainshock (absolute as well as normalized by the mainshock<br />
magnitude), and (v) the local b-value is negatively correlated with the heat flow. The above results are obtained in two<br />
consecutively more detailed approaches: (i) for spatio-temporal averages, and (ii) for time-averaged space intensities. To study<br />
the second case, we introduce a novel methodology for quantifying coupling between two (multidimensional) intensities or<br />
between intensity and a point field. The proposed methodology is focused on detecting non-linear relations and is shown to<br />
have particular advantages on the likelihood approach and classical correlation. The presented methodology and results<br />
contribute to better understanding of detailed non-universal relations between time-space-size varying features of seismicity<br />
and physical properties of a region. The results can be used to develop improved region-specific estimates of earthquake<br />
hazard assessment.<br />
CORSSA: COMMUNITY ONLINE RESOURCE FOR STATISTICAL SEISMICITY ANALYSIS - STATUS &<br />
OUTLOOK (A-023)<br />
J.D. Zechar, J.L. Hardebeck, A.J. Michael, M. Naylor, S. Steacy, S. Wiemer, J. Zhuang<br />
Statistical seismology is critical to the understanding of seismicity, the evaluation of proposed earthquake prediction and<br />
forecasting methods, and the assessment of seismic hazard. Unfortunately, despite its importance to seismology—especially to<br />
those aspects with great impact on public policy—statistical seismology is mostly ignored in the education of seismologists,<br />
and there is no central repository for the existing open-source software tools. To remedy these deficiencies, and with the<br />
broader goal to enhance the quality of statistical seismology research, we have begun building the Community Online<br />
Resource for Statistical Seismicity Analysis (CORSSA, www.corssa.<strong>org</strong>). We anticipate that the users of CORSSA will range<br />
from beginning graduate students to experienced researchers.<br />
More than 20 scientists from around the world met for a week in Zurich in May 2010 to kick-start the creation of CORSSA: the<br />
format and initial table of contents were defined; a governing structure was <strong>org</strong>anized; and workshop participants began<br />
drafting articles. CORSSA materials are <strong>org</strong>anized with respect to six themes, each will contain between four and eight articles.<br />
CORSSA now includes seven articles with an additional six in draft form along with forums for discussion, a glossary, and<br />
news about upcoming meetings, special issues, and recent papers. Each article is peer-reviewed and presents a balanced<br />
discussion, including illustrative examples and code snippets. Topics in the initial set of articles include: introductions to both<br />
CORSSA and statistical seismology, basic statistical tests and their role in seismology; understanding seismicity catalogs and<br />
their problems; basic techniques for modeling seismicity; and methods for testing earthquake predictability hypotheses. We<br />
have also begun curating a collection of statistical seismology software packages.<br />
ETAS VS. STEP (B-123)<br />
J.D. Zechar, D. Schorlemmer, M.C. Gerstenberger, and D.A. Rhoades<br />
Since September 2007, there has been an experiment in California to test and evaluate two models that yield next-day<br />
seismicity forecasts: the Epidemic-Type Aftershock Sequence, or ETAS, model and the Short Term Earthquake Probability, or<br />
STEP, model. ETAS and STEP are statistical models that incorporate well-studied empirical relations such as the Gutenberg-<br />
Richter magnitude distribution and the Omori-Utsu relation for the temporal decay of "aftershock" activity. The objective of<br />
2011 <strong>SCEC</strong> <strong>Annual</strong> <strong>Meeting</strong> | 259
Poster Abstracts<br />
the experiment is for each model to generate a forecast that specifies the expected number of earthquakes for the next 24 hours<br />
in bins specified by ranges of latitude, longitude, and magnitude. The spatial cells are 0.1 degrees by 0.1 degrees, and the<br />
models target all earthquakes with magnitude greater than or equal to 3.95 in bins of 0.1 units. We examined the first three<br />
years of results; during this time, 270 target earthquakes occurred in the testing region, including a swarm in Baja California<br />
throughout February 2008 and the April 2010 M 7.2 El Mayor-Cucapah earthquake.<br />
Through the testing component of this experiment, we discovered a flaw in the STEP implementation; it was corrected, and<br />
we evaluated forecasts based on the revised implementation. To evaluate the models, we conducted investigations of<br />
consistency (each model relative to the observation) and comparison (each model relative to the other). Based on joint loglikelihood<br />
measures, we found that both models are reasonably consistent with the observations of interest: the number of<br />
earthquakes, their spatial distribution, their magnitude distribution, and the joint distribution. To compare the models, we<br />
computed the rate-corrected average information gain per earthquake; this is the natural logarithm of the probability gain.<br />
STEP had an average information gain of 0.43 relative to ETAS; in other words, STEP had, on average, a 54% higher forecast<br />
rate than ETAS in bins where target earthquakes occurred, indicating that STEP was superior in this experiment.<br />
FOCAL MECHANISM WITH ERROR ESTIMATION USING REGIONAL WAVEFORMS: A CASE STUDY<br />
WITH THE 2008 CHINO HILLS EARTHQUAKE (B-072)<br />
Z. Zhan, S. Wei, and D. Helmberger<br />
Earthquake focal mechanisms are now routinely reported using regional records. However, due to difficulties in fitting<br />
seismograms with inadequate velocity model, and the usually non-linear inverse methodology, error estimation of focal<br />
mechanism is not a trivial problem. Here we explore the potential of using the bootstrapping method to estimate the error of<br />
focal mechanism from Cut-And-Paste (CAP). CAP first cuts the regional seismograms into Pnl wave and surface wave<br />
segments, then fits them allowing different time shifts, period bands and weights. CAP finds the best waveform-fitting focal<br />
mechanism by grid-searching the whole model space so we have the full information about each station's waveform misfit for<br />
every possible focal mechanism. This information naturally goes into the bootstrapping method. We validate this technique<br />
with the 2008 Chino Hills earthquake, which is well recorded and studied with the dense regional data from the TriNet. We<br />
also test the possibility to correct Amplitude Amplification Factors (AAFs) for each station using the information from the<br />
large number of bootstrapping solutions. Tests with both synthetic test and real data show largely reduced errors of focal<br />
mechanism parameters.<br />
STRAIN LOCALIZATION AND CRUSTAL THICKNESS VARIATION ACROSS MAJOR STRIKE SLIP<br />
FAULTS IN SOUTHERN CALIFORNIA REVEALED BY RECEIVER FUNCTION STUDIES (B-140)<br />
P. Zhang, M.S. Miller, J.F. Dolan, I.W. Bailey, and D.A. Okaya<br />
The degree to which faults are localized or distributed within the continental lithosphere has been a controversial subject for<br />
decades. Reflection and refraction studies indicate that the San Andreas fault (SAF) extends into the lower crust as a narrow<br />
fault zone in northern California and along the Mojave segment of the fault. However, the discretness of lithospheric<br />
deformation along the southernmost segments of the SAF system (e.g., the Elsinore, the San Jacinto and the Coachella segment<br />
of the San Andreas) remains unclear. We have begun a detailed study of how the distribution of strain at depth is in southern<br />
California using P receiver functions to image crustal and lithospheric thickness variations. We specifically focus on the<br />
depths of the Moho and lithosphere-asthenosphere boundary (LAB) underneath the major faults. Our results for the geometry<br />
of crustal and lithospheric interfaces provide insight into the strain localization in this region. Our preliminary results using<br />
events recorded by Southern California Seismic Network and USarray reveal complex crustal and lithospheric structure in this<br />
region. A SW-NE profile across the Elsinore, San Jacinto, and and San Andreas faults indicates that the Moho dips to the<br />
southwest. Moreover, receiver gathers at certain stations near the faults show a strong back-azimuthal variation. Using simple<br />
velocity models to project the Ps conversions to depth, we find that some of the back-azimuth variation can be related to<br />
different sides of the faults. These back-azimuthal variations of the Moho signal indicate three-dimensional complexity<br />
beneath the central San Jacinto fault that may suggest strain localization at these depths.<br />
AWP-ODC-SGT: WAVE PROPAGATION AND DYNAMIC RUPTURE SIMULATION SOFTWARE WITH<br />
STRAIN GREEN’S TENSOR (SGT) CAPABILITIES FOR CYBERSHAKE 2.0 (A-031)<br />
J. Zhou, S. Callaghan, S. Song, P. Chen, K. Olsen, R. Graves, P. Small, P. Maechling, Y. Cui, and T. Jordan<br />
CyberShake (Graves, et al., 2008/2011) is a <strong>SCEC</strong> research project to develop a physics-based computational approach to<br />
create a probabilistic seismic hazard analysis (PSHA). CyberShake uses fully 3D wave propagation simulations to forecast<br />
260 | Southern California Earthquake Center
Poster Abstracts<br />
ground motions which is expected to produce significantly more accurate PSHA estimates as compared to those<br />
conventionally produced by attenuation relationships. In the planned CyberShake 2.0 project, <strong>SCEC</strong> plans to include multiple<br />
Community Velocity Models with state-wide capabilities for frequencies up to 1Hz. Toward this goal we are in the process of<br />
implementing and verifying strain green’s tensor (SGT) creation, seismogram synthesis, and error minimization from<br />
numerical differentiation (Zhao, et al., 2006) in AWP-ODC, a <strong>SCEC</strong> community software package which simulates earthquake<br />
dynamic rupture and wave propagation using a fourth-order accurate staggered grid finite difference scheme. The use of<br />
AWP-ODC for CyberShake 2.0 is based on the need for maximum computational efficiency in the waveform modeling of the<br />
project. AWP-ODC has demonstrated its petascale scalability by successfully simulating a magnitude-8 earthquake on the<br />
southern San Andreas fault up to 2 Hz using 223,074 cores on NCCS Jaguar (Cui et al., 2010).<br />
ACCELERATION OF 3D FINITE DIFFERENCE AWP-ODC FOR SEISMIC SIMULATION ON GPU FERMI<br />
ARCHITECTURE (A-039)<br />
J. Zhou, Y. Cui, and D.J. Choi<br />
AWP-ODC, a highly scalable parallel finite-difference application, enables petascale 3D earthquake calculations. This<br />
application generates realistic dynamic earthquake source description and detailed physics-based anelastic ground motions at<br />
frequencies pertinent to safe building design. In 2010, the code achieved M8, a full dynamical simulation of a magnitude-8<br />
earthquake on the southern San Andreas fault up to 2-Hz, the largest-ever earthquake simulation.<br />
Building on the success of the previous work, we have implemented CUDA on AWP-ODC to accelerate wave propagation on<br />
GPU platform. Our CUDA development aims on aggressive parallel efficiency, optimized global and shared memory access to<br />
make the best use of GPU memory hierarchy. The benchmark on NVIDIA Tesla C2050 graphics cards demonstrated many<br />
tens of speedup in single precision compared to serial implementation at a testing problem size, while an MPI-CUDA<br />
implementation is in the progress to extend our solver to multi-GPU clusters. Our CUDA implementation has been carefully<br />
verified for accuracy.<br />
2011 <strong>SCEC</strong> <strong>Annual</strong> <strong>Meeting</strong> | 261
Poster Abstracts<br />
<strong>Meeting</strong> Participants<br />
AAGAARD Brad, USGS<br />
ABERS Geoffrey, LDEO<br />
ABRAHAMSON Norman, PG&E<br />
AFFADONIS Mikkail, Terrace Hills MS<br />
AGUIAR Ana, Stanford<br />
AKCIZ Sinan, UC Irvine<br />
ALANIZ Emigdio, ELAC<br />
ALLAM Amir, USC<br />
ALLEN Richard, UC Berkeley<br />
ALLEN Sean, UNR<br />
AMPUERO Jean Paul, Caltech<br />
ANDERSON Robert, California<br />
Earthquake Authority<br />
ANDERSON John, UNR<br />
ANDREWS Dudley, USGS-retired<br />
ARCHULETA Ralph, UCSB<br />
ARROWSMITH J Ramon, ASU<br />
ASPIOTES Aris, USGS<br />
ASSIMAKI Dominic, Ge<strong>org</strong>ia Tech<br />
ATKINSON Gail, U Western Ontario<br />
BAILEY Iain, USC<br />
BAKER Jack, Stanford<br />
BANESH Divya, UC Davis<br />
BARBA Magali, UC Berkeley<br />
BARBOT Sylvain, Caltech<br />
BARBOUR Andrew, UCSD<br />
BARRETT Sarah, Stanford<br />
BAYLESS Jeff, URS<br />
BEAUDOIN Bruce, IRIS PASSCAL<br />
BECKER Thorsten, USC<br />
BEHR Whitney, Brown<br />
BEN-ZION Yehuda, USC<br />
BENNETT Richard, U Arizona<br />
BENTHIEN Mark, <strong>SCEC</strong>/USC<br />
BEROZA Gregory, Stanford<br />
BEUTIN Thomas, GFZ Potsdam<br />
BHAT Harsha, USC/Caltech<br />
BIASI Glenn, UNR<br />
BIELAK Jacobo, CMU<br />
BILHAM Roger, Colorado<br />
BIRD Peter, UCLA<br />
BLANPIED Michael, USGS<br />
BLISNIUK Kimberly, UC Davis<br />
BOESE Maren, Caltech<br />
BOHON Wendy, ASU<br />
BOORE David, USGS<br />
BORMANN Jayne, UNR<br />
262 | Southern California Earthquake Center<br />
BORSA Adrian, UNAVCO<br />
BOSS Stephanie, LMU<br />
BOWMAN David, CSU Fullerton<br />
BOYD Oliver, USGS<br />
BRADLEY Brendon, U Canterbury<br />
BRIDGES Peter, UMass<br />
BROCHER Thomas, USGS<br />
BRODSKY Emily, UC Santa Cruz<br />
BROWN Justin, Stanford<br />
BROWNLEE Sarah, UCSB<br />
BRUNE James, UNR<br />
BUGA Michael, SDSU<br />
BULL William, U Arizona<br />
BUTCHER Amber, Cal Poly<br />
Pomona<br />
BUTSCHER William, Bloomington HS<br />
BWARIE John, USGS<br />
BYDLON Samuel, Penn State<br />
BYKOVTSEV Alexander, Regional<br />
Acad of Natural Sciences<br />
CADENA Ana, CWU<br />
CALLAGHAN Scott, <strong>SCEC</strong>/USC<br />
CARLSON Erica, Hesperia HS<br />
CASTRO Raúl, CICESE<br />
CATCHINGS Rufus, USGS<br />
CATO Kerry, Cato Geoscience<br />
CHAO Kevin, Ge<strong>org</strong>ia Tech<br />
CHEN Shang-Lin, Caltech<br />
CHEN Tao, China Earthquake<br />
Administration / USGS<br />
CHEN Raymond, UCLA<br />
CHEN Xiaowei, UCSD<br />
CHEN Po, U Wyoming<br />
CHESTER Judith, Texas A&M<br />
CHIOU Ray, NAVFAC<br />
CHOI Dong Ju, SDSC<br />
CHUANG Yun-Ruei, Indiana<br />
CHUNG Angela, Stanford<br />
CIVILINI Francesco, UCSB<br />
CLAYTON Robert, Caltech<br />
COCHRAN Elizabeth, USGS<br />
COLELLA Harmony, UC Riverside<br />
COMPTON Tracy, UC Davis<br />
COOKE Michele, UMass<br />
COON Ethan, LANL<br />
COWGILL Eric, UC Davis<br />
COX Paul, UCLA<br />
CREMPIEN J<strong>org</strong>e, UCSB<br />
CROSBY Christopher, SDSC/UCSD<br />
CROWELL Brendan, UCSD<br />
CRUZ JIMENEZ Hugo, KAUST<br />
CUI Yifeng, SDSC<br />
CURRIE Trevor, Caltech<br />
DAHMEN Karin, Illinois<br />
DAVATZES Nicholas, Temple U<br />
DAVIDGE Lindsey, USC<br />
DAVIS Lindsay, Colorado State<br />
DAVIS Paul, UCLA<br />
DAWSON Timothy, CGS<br />
DAY Steve, SDSU<br />
DE CRISTOFARO Jason, USGS<br />
DE GROOT Robert, <strong>SCEC</strong>/USC<br />
DEL PARDO Cecilia, UTEP<br />
DELAUDER Audra, U Virginia<br />
DENOLLE Marine, Stanford<br />
DETERMAN Daniel, USGS<br />
DIEHL John, GEOVision<br />
DIETERICH James, UC Riverside<br />
DMOWSKA Renata, Harvard<br />
DOLAN James, USC<br />
DOMINGUEZ Luis, UCLA<br />
DONNELLAN Andrea, NASA JPL<br />
DONOVAN Jessica, USC<br />
DRISCOLL Neal, SIO<br />
DUAN Benchun, Texas A&M<br />
DUNHAM Eric, Stanford<br />
EISSES Amy, UNR<br />
ELBANNA Ahmed, UCSB<br />
ELLIOTT Austin, UC Davis<br />
ELLSWORTH William, USGS<br />
ELY Geoffrey, Argonne National Lab<br />
ERICKSON Brittany, Stanford<br />
EVANS Eileen, Harvard<br />
FANG Zijun, Stanford<br />
FARHAT Tarana, Hampton<br />
FENNING Neil, USGS<br />
FERGUSON Alex, USGS<br />
FIALKO Yuri, UCSD<br />
FIELD Edward, USGS<br />
FILSON John, USGS-Retired<br />
FLETCHER John, CICESE<br />
FLOYD Michael, MIT<br />
FREEMAN Stephen, GeoPentech<br />
FRENCH Melodie, Texas A&M
FREYMUELLER Jeffrey, U Alaska<br />
Fairbanks<br />
FUIS Gary, USGS<br />
FUNNING Gareth, UC Riverside<br />
GALASSO Carmine, UC Irvine<br />
GALETZKA John, Caltech<br />
GALLOVIC Frantisek, Charles Univ<br />
in Prague<br />
GARDNER Max, USGS<br />
GAVILLOT Yann, Oregon State<br />
GEE Robin, UCSB<br />
GERSTENBERGER Matthew, GNS<br />
Science<br />
GERSTOFT Peter, UCSD<br />
GILCHRIST Jacquelyn, UC<br />
Riverside<br />
GLOWACKA Ewa, CICESE<br />
GOEBEL Thomas, USC<br />
GOLD Peter, UC Davis<br />
GOLDBERG Daniel, USC<br />
GOLDMAN Mark, USGS<br />
GOLTZ James, CalEMA<br />
GONZALEZ-ORTEGA Alejandro,<br />
CICESE<br />
GOODING Margaret, LSA Assoc<br />
GORMLEY Deborah, <strong>SCEC</strong>/USC<br />
GOULET Christine, UC Berkeley<br />
GRANAT Robert, NASA JPL<br />
GRANT LUDWIG Lisa, UC Irvine<br />
GRAVES Robert, USGS<br />
GREENWOOD Rebecca, Cal Poly<br />
Pomona<br />
GRIJALVA Ashley, UTEP<br />
GULOTTA Bryan, UC Riverside<br />
HADDAD David, ASU<br />
HAKAMATA Tomohiro, UCSB<br />
HALLER Kathleen, USGS<br />
HANKS Audra, Cal Poly Pomona<br />
HARDEBECK Jeanne, USGS<br />
HARDY Gregory, SGH<br />
HARRIS Sheri, Arlington HS<br />
HARRIS Sharon, QuakeSafeKits<br />
HARRIS Bob, QuakeSafeKits<br />
HARRIS Ruth, USGS<br />
HARVEY Jonathan, UCSB<br />
HAUKSSON Egill, Caltech<br />
HEARN Elizabeth, UBC<br />
HEATON Thomas, Caltech<br />
HEERMANCE Richard, CSUN<br />
HEIEN Eric, UC Davis<br />
HELLIGE Bridget, USC<br />
HELMBERGER Donald, Caltech<br />
HENRY Pamela, Fault Line<br />
HERBERT Justin, UMass<br />
HERNANDEZ Stephen, UC Santa<br />
Cruz<br />
HERRING Thomas, MIT<br />
HILL David, USGS<br />
HINOJOSA-CORONA Alejandro,<br />
CICESE<br />
HIRAKAWA Evan, SDSU<br />
HOGAN Phillip, Fugro Consultants<br />
HOLDEN Caroline, GNS Science<br />
HOLE John, Virginia Tech<br />
HOLLIDAY James, UC Davis<br />
HOLLIS Daniel, NodalSeismic<br />
HOLT William, SUNY-Stony Brook<br />
HOOKS Benjamin, UTM<br />
HOUGH Susan, USGS<br />
HUANG Yihe, Caltech<br />
HUBBARD Judith, Harvard<br />
HUDNUT Kenneth, USGS<br />
HUMPLEMAN Heather, USC<br />
HUYNH Tran, <strong>SCEC</strong>/USC<br />
IMANISHI Kazutoshi, GS Japan<br />
INBAL Asaf, Caltech<br />
ISBILIROGLU Yigit, CMU<br />
JACKSON David, UCLA<br />
JANECKE Susanne, Utah State<br />
JI Chen, UCSB<br />
JIANG Junle, Caltech<br />
JIMENEZ Ernesto, PCC<br />
JOHANSON Ingrid, UC Berkeley<br />
JOHNSON Kaj, Indiana<br />
JOHNSON Marilyn, PCC<br />
JONES Andrea, USC<br />
JONES Lucile, USGS<br />
JORDAN Thomas, <strong>SCEC</strong>/USC<br />
JORDAN, JR. Frank, John R Byerly<br />
KAGAN Yan, UCLA<br />
KANEKO Yoshihiro, UCSD<br />
KANG Jingqian, Texas A&M<br />
KARAOGLU Haydar, CMU<br />
KEDAR Sharon, NASA JPL<br />
KELL Annie, UNR<br />
KELLER Edward, UCSB<br />
KELLER Brenton, USC<br />
KELLOGG Louise, UC Davis<br />
KENDRICK Katherine, USGS<br />
KENT Graham, UNR<br />
KENT Tyler, UNR<br />
KILB Debi, UCSD<br />
KIM Hyun-Tae, ASU<br />
<strong>Meeting</strong> Participants<br />
KING Nancy, USGS<br />
KIRBY Matthew , CSU Fullerton<br />
KIRKPATRICK James, UC Santa<br />
Cruz<br />
KITAJIMA Hiroko, Penn State<br />
KLEIN Mark, Banning HS<br />
KNOWLTON Michael,<br />
SCE/SONGS<br />
KNUDSEN Keith, USGS<br />
KOHLI Arjun, Stanford<br />
KOZDON Jeremy, Stanford<br />
KRISHNAN Swaminathan, Caltech<br />
KROLL Kayla, UC Riverside<br />
KUMAR Sandarsh, <strong>SCEC</strong>/USC<br />
KURZON Ittai, UCSD<br />
LAJOIE Lia, UC Santa Cruz<br />
LAMBERT Valère, Caltech<br />
LANGENHEIM Victoria, USGS<br />
LAPUSTA Nadia, Caltech<br />
LAVALLEE Daniel, UCSB<br />
LAVIER Luc, UT Austin<br />
LAWSON Michael, UCLA<br />
LEE Ya Ting, NCU Taiwan<br />
LEE En-Jui, U Wyoming<br />
LEEPER Robert, USGS<br />
LEGG Mark, Legg Geophysical<br />
LEKIC Vedran, Brown<br />
LEMERSAL Elizabeth, USGS<br />
LEMME Nathan, NAVFAC<br />
ESC/US Navy<br />
LEMNITZER Anne, UC Irvine<br />
LEPRINCE Sebastien, Caltech<br />
LI Xiangyu, UCSB<br />
LI Yong-Gang, USC<br />
LIAO Eric, UCR<br />
LIEOU Charles, UCSB<br />
LILLIE Robert, Oregon State<br />
LIM Amy, PCC<br />
LIN Fan-Chi, Caltech<br />
LIN Kevin, USC<br />
LINDSEY Eric, SIO/IGPP<br />
LINDVALL Scott, Fugro<br />
Consultants<br />
LINO Susana, Cal Poly Pomona<br />
LIPOVSKY Brad, Stanford<br />
LIPPOLDT Rachel, Oregon<br />
LIU Zaifeng, Texas A&M<br />
LIU Qiming, UCSB<br />
LIU Xin, USC<br />
2011 <strong>SCEC</strong> <strong>Annual</strong> <strong>Meeting</strong> | 263
<strong>Meeting</strong> Participants<br />
LIUKIS Maria, <strong>SCEC</strong>/USC<br />
LLENOS Andrea, USGS<br />
LOGAN John, Oregon<br />
LOHMAN Rowena, Cornell<br />
LONG Kate, CalEMA<br />
LOUIE John, UNR<br />
LOZOS Julian, UCR<br />
LUCERO Jaron, UCSB<br />
LUCO Nicolas, USGS<br />
LUI Ka Yan Semechah, Caltech<br />
LUO Yingdi, Caltech<br />
LUTHER Amy, New Mexico Tech<br />
LUTTRELL Karen, USGS<br />
LYDEEN William, USGS<br />
LYNCH David, USGS<br />
LYNETT Patrick, USC<br />
MA Shuo, SDSU<br />
MACCARTHY Dawn, USGS<br />
MADDEN Elizabeth, Stanford<br />
MADDEN MADUGO Christopher,<br />
Oregon State<br />
MAECHLING Philip, <strong>SCEC</strong>/USC<br />
MAI P. Martin, KAUST<br />
MAK Chi Ming, PCC<br />
MANJARREZ Uriel, CICESE<br />
MARLIYANI Gayatri, ASU<br />
MARQUIS John, <strong>SCEC</strong>/USC<br />
MARSHALL Scott, Appalachian<br />
State<br />
MASON Robert, PCC<br />
MATTI Jonathan, USGS<br />
MAZZONI Silvia, Degenkolb<br />
MCAULIFFE Lee, USC<br />
MCBURNETT Paul, CSUN<br />
MCCAFFREY Robert, Portland State<br />
MCCARTHY Christine, Columbia<br />
MCCARTHY Jill, USGS<br />
MCGILL Sally, CSU San<br />
Bernardino<br />
MCGUIRE Kathleen, CSUN<br />
MCKAY Hannah, CSUN<br />
MCLELLAN Mary, PCC<br />
MCRANEY John, <strong>SCEC</strong>/USC<br />
MEADE Brendan, Harvard<br />
MEHTA Gaurang, USC/ISI<br />
MEIJER Michelle, Eleanor Roosevelt HS<br />
MELGAR Diego, SIO/UCSD<br />
MELTZER Anne, Lehigh<br />
MELTZNER Aron, Nanyang Tech U<br />
MENCIN David, UNAVCO<br />
264 | Southern California Earthquake Center<br />
MENDES Laura, ASU/UFR Rio de<br />
Janeiro<br />
MENG Lingsen, Caltech<br />
MENG Xiaofeng, Ge<strong>org</strong>ia Tech<br />
MENGES Christopher, USGS<br />
MERRIAM Martha, Caltrans<br />
MICHAEL Andrew, USGS<br />
MILETI Dennis, U Colorado<br />
MILLER Meghan, USC<br />
MILLINER Chris, USC<br />
MILNER Kevin, <strong>SCEC</strong>/USC<br />
MINSTER Jean, UCSD<br />
MITCHELL Thomas, Bochum<br />
MITCHELL Erica, UCSD<br />
MOONEY Walter, USGS<br />
MORELAN Alexander, UNR<br />
MORESI Louis, Monash University<br />
MORI James, Kyoto University<br />
MORTON Nissa, SDSU<br />
MOURHATCH Ramses, Caltech<br />
MUELLER Karl, U Colorado<br />
MUHAMMAD Kaliymah, CSU San<br />
Bernardino<br />
MURPHY Janice, USGS<br />
NADEAU Robert, UC Berkeley<br />
NAEIM Farzad, John A Martin &<br />
Associates<br />
NALE Stephanie, UC Santa Cruz<br />
NEIGHBORS Corrie, UCR<br />
NI Sidao, U Science & Tech of China<br />
NICHOLSON Craig, UCSB<br />
NISSEN Edwin, ASU<br />
NYST Marleen, RMS<br />
OGLESBY David, UC Riverside<br />
OKAYA David, USC<br />
OLSEN Kim, SDSU<br />
OLSEN Anna, USGS<br />
ONDERDONK Nate, CSU Long<br />
Beach<br />
ORTEGA Gustavo, CALTRANS-LA<br />
OSKIN Michael, UC Davis<br />
OWEN Susan, NASA JPL<br />
OZAKIN Yaman, USC<br />
PACE Alan, Petra Geotechnical<br />
PAGE M<strong>org</strong>an, USGS<br />
PAPIKYAN Tatev, UCLA<br />
PARKER Jay, NASA JPL<br />
PASEDA Sulaimon, Howard<br />
PATTON Patrick, Colorado<br />
PEARSON Eric, La Sierra HS<br />
PELTIES Christian, LMU Munich<br />
PENG Zhigang, Ge<strong>org</strong>ia Tech<br />
PENNINGTON Alan, Valley View HS<br />
PEREZ Florante, CGS<br />
PERRY Suzanne, USGS<br />
PETAL Marla, Risk RED<br />
PETERSEN Mark, USGS<br />
PETERSON Dana, UW Madison<br />
PITARKA Arben, URS<br />
PITRUZELLO Trey, Martin Luther<br />
King HS<br />
PLATT John, Harvard<br />
PLATT John, USC<br />
PLESCH Andreas, Harvard<br />
POLET Jascha, Cal Poly Pomona<br />
PONCE-ZEPEDA Moises, ELAC<br />
PORTER Keith, U Colorado<br />
POTTER Hannah, Cal Poly Pomona<br />
POWELL Robert, USGS<br />
POWERS Peter, USGS<br />
PRUDENCIO Ernesto, UT Austin<br />
PURASINGHE Rupa, CSU Los<br />
Angeles<br />
PURASINGHE Ruwanka, UC Davis<br />
RAMZAN Shahid, CSUN<br />
REUVENI Yuval, NASA JPL<br />
REZAEIAN Sanaz, USGS<br />
RHOADES David, GNS Science<br />
RHODES Brady, CSU Fullerton<br />
RHODES Edward, UCLA<br />
RICE James, Harvard<br />
RICHARDS-DINGER Keith, UC<br />
Riverside<br />
ROCKWELL Thomas, SDSU<br />
RODER Belinda, UCLA<br />
RODRIGUEZ-CASTRO David,<br />
Puerto Rico at Mayaguez<br />
ROGERS-MARTINEZ Marshall,<br />
Columbia<br />
ROLLINS John, USC<br />
ROMANO Mark, USC<br />
ROOD Dylan, LLNL<br />
ROSE Elizabeth, USGS<br />
ROSOVE Sari, UBC<br />
ROSS Zachary, USC<br />
ROSS Stephanie, USGS<br />
ROUSSEAU Nick, <strong>SCEC</strong>/USC<br />
ROUSSET Baptiste, Caltech<br />
ROWE Kristen, U Colorado<br />
ROWSHANDEL Badie, CGS/CEA<br />
RUBINO Vito, Caltech<br />
RUBINSTEIN Justin, USGS
RUIZ Ricardo, Chaffey HS<br />
RUNDLE John, UC Davis<br />
RYAN Kenny, UC Riverside<br />
RYNGE Mats, USC/ISI<br />
SACHS Michael, UC Davis<br />
SAHAKIAN Valerie, UCSD<br />
SALISBURY James, ASU<br />
SANCHEZ Dominga, UCSD<br />
SANDWELL David, UCSD<br />
SATO Tsurue, ASU<br />
SAVAGE Heather, LDEO<br />
SAVRAN William, UNR<br />
SAWYER Christine, SBCC<br />
SCHARER Katherine, USGS<br />
SCHMANDT Brandon, Caltech<br />
SCHMITT Stuart, Stanford<br />
SCHORLEMMER Danijel,<br />
USC/GFZ<br />
SCOTT Eric, San Bernardino<br />
County Museum<br />
SEALE Sandra, NEES@UCSB<br />
SEDKI Ziad, CSULB<br />
SEGALL Paul, Stanford<br />
SEGOU Margarita, USGS<br />
SELIGSON Hope, MMI<br />
Engineering<br />
SEVERSON Chad, UC Riverside<br />
SHAFER Debora, Hesperia HS<br />
SHAO Guangfu, UCSB<br />
SHAW John, Harvard<br />
SHAW Bruce, LDEO<br />
SHEARER Peter, UCSD<br />
SHELLY David, USGS<br />
SHERVAIS Katherine, Wesleyan<br />
SHI Zheqiang, SDSU<br />
SHOME Nilesh, RMS<br />
SICKLER Robert, USGS<br />
SIRIKI Hemanth, Caltech<br />
SLEEP Norman, Stanford<br />
SMALL Patrick, <strong>SCEC</strong>/USC<br />
SMITH Deborah, CIW<br />
SMITH-KONTER Bridget, UTEP<br />
SOLIS Teira, UTEP<br />
SOMALA Surendra, Caltech<br />
SOMERVILLE Paul, URS<br />
SONG Seok Goo, ETH Zurich<br />
SONG Shiyu, UCSD<br />
SPELZ Ronald, UABC<br />
SPINLER Joshua, U Arizona<br />
SPRINGER Kathleen, San<br />
Bernardino County Museum<br />
STARK Keith, SCIGN<br />
STEIDL Jamison, UCSB<br />
STERN Aviel, UC Santa Cruz<br />
STIRLING Mark, GNS Science<br />
STOCK Joann, Caltech<br />
STRADER Anne, UCLA<br />
STREIG Ashley, Oregon<br />
STUBAILO Igor, UCLA<br />
SU Feng, US Bureau of Reclamation<br />
SUMY Danielle, USGS<br />
SYMCOX Carl, Dartmouth<br />
TABORDA Ricardo, CMU<br />
TAHTINEN Hillary, UCSD<br />
TAKEUCHI Christopher, UCSD<br />
TAPE Carl, U Alaska Fairbanks<br />
TARNOWSKI Jennifer, UCR<br />
TAYLOR Michael, U Kansas<br />
TERAN Orlando, CICESE<br />
THATCHER Wayne, USGS<br />
THIO Hong Kie, URS<br />
THOMAS Marion, Caltech<br />
THOMAS Helen, USGS<br />
THORNOCK Steve, Utah State<br />
THORNTON Garrett, UTEP<br />
THURBER Clifford, UW Madison<br />
TIAN Xiangyan, Caltech<br />
TINSLEY John, USGS<br />
TODD Erin, UC Santa Cruz<br />
TOKE Nathan, Utah Valley U<br />
TONG Xiaopeng, IGPP/SIO<br />
TORRENS-BONANO Angel,<br />
Puerto Rico at Mayaguez<br />
TRAER James, UCSD<br />
TREIMAN Jerome, CGS<br />
TRUDEAU Joseph, UCSB<br />
TSAI Victor, Caltech<br />
TULLIS Terry, Brown<br />
TURCOTTE Donald, UC Davis<br />
TURKLE Katharine, USGS<br />
UCHIDE Takahiko, UCSD<br />
UPTON Elizabeth, Occidental<br />
VALEN Christina, UCSD<br />
VAN DER ELST Nicholas, UC Santa<br />
Cruz<br />
VANEGAS Michelle, PCC<br />
VARGAS Bernadette, Etiwanda HS<br />
VARGAS Bernadette, Etiwanda HS<br />
VEERARAGHAVAN Swetha,<br />
Caltech<br />
VERDUGO MADUGO Danielle,<br />
Earth Consultants International<br />
<strong>Meeting</strong> Participants<br />
VIDALE John, U Washington<br />
WAGNER Kelsey, USC<br />
WAGNER Max, USC<br />
WALKER Brendon, SDSU<br />
WALLACE Seth, Bloomington HS<br />
WALLS Christian, UNAVCO<br />
WALTERS Randi, Stanford<br />
WANG Enning, Princeton<br />
WANG Tien-Huei, UCR<br />
WANG Feng, USC<br />
WARD Steven, UC Santa Cruz<br />
WEI Shengji, Caltech<br />
WEI Meng, WHOI<br />
WEISER Deborah, UCLA and USGS<br />
WELDON Ray, Oregon<br />
WERNER Maximilian, Princeton<br />
WESNOUSKY Steven, UNR<br />
WESSON Rob, USGS<br />
WHITCOMB James, NSF<br />
WICKER Cary, CSULB<br />
WILLIAMS Charles, GNS Science<br />
WILLIAMS Patrick, SDSU<br />
WILLS Chris, CGS<br />
WILSON Rick, CGS<br />
WITHERS Kyle, SDSU<br />
WONG-ORTEGA Victor Manuel,<br />
CICESE<br />
WOOD Michele, CSU Fullerton<br />
WOOD Rebekah, Utah State<br />
WU Wenbo, U Science & Tech of<br />
China<br />
WYATT Frank, UCSD<br />
XU Zhiguo, China Earthquake<br />
Administration<br />
XU Xiaohua, UCLA<br />
XU Shiqing, USC<br />
XUE Lian, UC Santa Cruz<br />
YANG Wenzheng, Caltech<br />
YANO Tomoko, UCSB<br />
YAO Huajian, SIO/UCSD<br />
YE Lingling, UC Santa Cruz<br />
YEATS Robert, Oregon State<br />
YIKILMAZ Mehmet, UC Davis<br />
YODER Mark, UC Davis<br />
YONG Alan, USGS<br />
YOUNG Karen, USC<br />
YU Ellen, Caltech<br />
YU John, <strong>SCEC</strong>/USC<br />
YULE Doug, CSUN<br />
YUN Sang-Ho, JPL<br />
ZALIAPIN Ilya, UNR<br />
2011 <strong>SCEC</strong> <strong>Annual</strong> <strong>Meeting</strong> | 265
<strong>Meeting</strong> Participants<br />
ZANZERKIA Eva, NSF<br />
ZAREIAN Farzin, UC Irvine<br />
ZECHAR Jeremy, ETH Zurich<br />
ZENG Yuehua, USGS<br />
ZHAN Zhongwen, Caltech<br />
ZHANG Panxu, USC<br />
ZHOU Jun, SDSC<br />
266 | Southern California Earthquake Center