E-WASTE ASSESSMENT IN SOUTH AFRICA - e-Waste. This guide
E-WASTE ASSESSMENT IN SOUTH AFRICA - e-Waste. This guide
E-WASTE ASSESSMENT IN SOUTH AFRICA - e-Waste. This guide

Create successful ePaper yourself
Turn your PDF publications into a flip-book with our unique Google optimized e-Paper software.
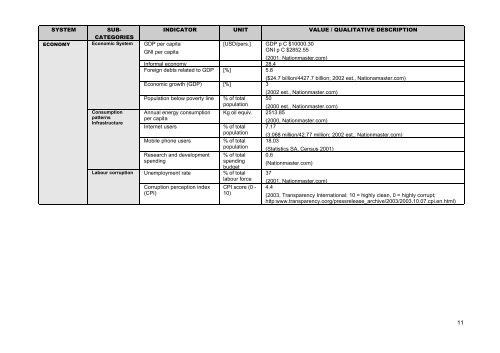
SYSTEMSUB-<strong>IN</strong>DICATOR UNIT VALUE / QUALITATIVE DESCRIPTIONCATEGORIESECONOMY Economic System GDP per capitaGNI per capita[USD/pers.] GDP p C $10000.30GNI p C $2852.55(2001, Nationmaster.com)Informal economy 28.4Foreign debts related to GDP [%] 5.8ConsumptionpatternsInfrastructure($24.7 billion/4427.7 billion; 2002 est., Nationamaster.com)Economic growth (GDP) [%] 3Population below poverty lineAnnual energy consumptionper capitaInternet usersMobile phone usersResearch and developmentspending% of totalpopulation(2002 est., Nationmaster.com)50(2000 est., Nationmaster.com)Kg oil equiv. 2513.85% of totalpopulation% of totalpopulation% of totalspendingbudgetLabour corruption Unemployment rate % of totallabour forceCorruption perception index(CPI)CPI score (0 -10)(2000, Nationmaster.com)7.17(3.068 million/42.77 million; 2002 est., Nationmaster.com)18.03(Statistics SA, Census 2001)0.6(Nationmaster.com)37(2001, Nationmaster.com)4.4(2003, Transparency International; 10 = highly clean, 0 = highly corrupt;http:www.transparency.oorg/pressrelease_archive/2003/2003.10.07.cpi.en.html)11