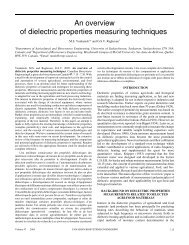
432 Can. J. Civ. Eng. Vol. 30, 2003Table 2. Survey <strong>of</strong> concrete floor thickness variability from 2000.Thickness difference (mm)TypicalWorstCase Min. Max. Min. Max. Bias CoV Note50 mm topping on precast –5 +10 –10 +20 1.00–1.10 0.140–0.400–10 +10 –40 +50 1.00–1.23 0.077–0.176 Depends on camber <strong>of</strong> precast member65–75 mm cover slab, –5 +5 — —steel deck–5 +15 –10 +50 1.02–1.06 0.049–0.078 Extreme values are <strong>for</strong> unshoredconstruction150 mm one-way slabbetween beams–5 +5 –5 +25 Slopes tough, especially if sloped in twodirections–5 +10 –25 +25200 mm two-way slab –10 +20 — — 1.03–1.06 0.062–0.065–10 +15 –15 +40 Always have more around <strong>the</strong> columns;<strong>the</strong>re is a buildup <strong>the</strong>re300 mm two-way slab –10 +10 — — 1.00–1.06 0.033–0.056–10 +20 –20 +50expected value <strong>of</strong> <strong>the</strong> 50 year maximum equivalent uni<strong>for</strong>mlydistributed live load, Lmax (in kN/m 2 ), isFig. 1. Fifty year maximum live load bias coefficient versus influencearea.[2] Lmax = 0. 895 + 76 . / AIwhere A I is <strong>the</strong> influence area (in m 2 ). The correspondingnominal live load, L (in kN/m 2 ), from <strong>the</strong> 1995 NBCC is[3] L = 24 . ( 03 . + 98 . / B)where 2.4 is <strong>the</strong> specified live load (in kN/m 2 ) and B is <strong>the</strong>tributary area (in m 2 ). According to ASCE7-98 (ASCE2000), <strong>the</strong> influence area equals <strong>the</strong> tributary area <strong>for</strong> twowayslabs, twice <strong>the</strong> tributary area <strong>for</strong> interior beams, andfour times <strong>the</strong> tributary area <strong>for</strong> columns. Using <strong>the</strong>se relationships,<strong>the</strong> bias is simply <strong>the</strong> ratio <strong>of</strong> eq. [2] to eq. [3] andso depends on <strong>the</strong> type <strong>of</strong> element and its influence area.The 50 year maximum live load bias is shown in Fig. 1<strong>for</strong> realistic ranges <strong>of</strong> influence areas <strong>of</strong> two-way slabs,beams, and columns. The ASCE (2000) curve in Fig. 1 indicates<strong>the</strong> bias if <strong>the</strong> nominal live load is reduced with increasinginfluence area in accordance with ASCE7-98instead <strong>of</strong> eq. [2]. The 30 year extreme live load model used<strong>for</strong> previous Canadian design code <strong>calibration</strong> (Allen 1975)has a bias <strong>of</strong> 0.70 and a CoV <strong>of</strong> 0.30; <strong>the</strong> equivalent 50 yearmaximum live load has a bias <strong>of</strong> 0.78 and a CoV <strong>of</strong> 0.27 andis also shown in Fig. 1.The present study adopted a bias <strong>for</strong> <strong>the</strong> 50 year maximumlive load effect <strong>of</strong> 0.90, based on several considerations.Two-way slabs and o<strong>the</strong>r components with smallinfluence areas have greater bias, but <strong>the</strong> consequences <strong>of</strong>failure <strong>of</strong> <strong>the</strong>se elements are less severe than those <strong>for</strong> elementssupporting larger tributary areas. Provided <strong>the</strong>y arenot weak in shear, two-way slab systems possess considerablestrength reserves that are not usually considered by <strong>the</strong>designer. The average bias <strong>for</strong> beams, as computed <strong>for</strong> <strong>the</strong>12 values shown by <strong>the</strong> markers in Fig. 1 and so weightedtowards <strong>the</strong> smaller influence areas, is 0.94. The averagebias <strong>for</strong> columns, as computed <strong>for</strong> <strong>the</strong> 16 values shown by<strong>the</strong> markers in Fig. 1 and so weighted towards <strong>the</strong> smallerinfluence areas, is 0.87. Although larger bias occurs <strong>for</strong>larger influence areas, <strong>the</strong> large dead load that <strong>the</strong> columnmust sustain in this case makes <strong>the</strong> design relatively insensitiveto <strong>the</strong> magnitude <strong>of</strong> <strong>the</strong> live load. Figure 1 also indicatesthat <strong>the</strong> live load reduction specified in <strong>the</strong> NBCC is conservativewith respect to that in ASCE7-98 <strong>for</strong> beams and <strong>for</strong>columns with influence areas less than 1000 m 2 , and so <strong>the</strong>live load bias is less than <strong>the</strong> value <strong>of</strong> 1.00 used to calibrateASCE7-98 (Ellingwood 1999). The average ratios <strong>of</strong> NBCCbias to ASCE7-98 bias, as determined by averaging <strong>the</strong>points shown by markers in Fig. 1, are 0.95 <strong>for</strong> beams and0.84 <strong>for</strong> columns. Lastly, <strong>the</strong> bias <strong>of</strong> 0.90 <strong>for</strong> use and occupancyload is greater than <strong>the</strong> value 0.78, which is equivalentto that used to calibrate <strong>the</strong> 1975 <strong>edition</strong> <strong>of</strong> <strong>the</strong> NBCC(Allen 1975).The CoV <strong>of</strong> <strong>the</strong> maximum equivalent uni<strong>for</strong>mly distributedlive load <strong>for</strong> <strong>of</strong>fice floors during a 50 year referenceperiod is also based on <strong>the</strong> simulation results <strong>for</strong> <strong>of</strong>ficebuildings (Ellingwood and Culver 1977). This study reported2<strong>the</strong> variance <strong>of</strong> <strong>the</strong> 50 year maximum live load, σ L max (inkN/m 2 ), is© 2003 NRC Canada
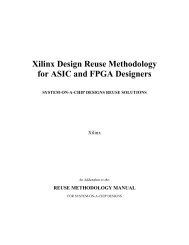
Bartlett et al. 4332[4] σ L max = 0. 033 + 4. 025/A IThus <strong>the</strong> CoV <strong>of</strong> <strong>the</strong> live load is obtained by dividing <strong>the</strong>square root <strong>of</strong> eq. [4] by eq. [2]. The resulting relationshipbetween <strong>the</strong> CoV and <strong>the</strong> influence area is represented by<strong>the</strong> curve marked “load only” in Fig. 2. The CoV values arerelatively insensitive to <strong>the</strong> influence area considered, rangingfrom 0.162 to 0.182.The trans<strong>for</strong>mation <strong>of</strong> <strong>the</strong> live load into a live load effectintroduces modelling and analysis <strong>factor</strong>s. The modelling<strong>factor</strong> addresses <strong>the</strong> idealization <strong>of</strong> <strong>the</strong> actual live load as anequivalent uni<strong>for</strong>mly distributed load and has been assumedunbiased with a CoV <strong>of</strong> 0.20 (Ellingwood et al. 1980). Kariyawasam(1996) assumed <strong>the</strong>se values pertain to columns,and a reduced CoV <strong>of</strong> 0.10 pertains to beams. The analysis<strong>factor</strong> reflects <strong>the</strong> trans<strong>for</strong>mation <strong>of</strong> load to load effect andhas been assumed unbiased with a CoV <strong>of</strong> 0.05 (Ellingwoodet al. 1980). Using <strong>the</strong>se values, <strong>the</strong> variation <strong>of</strong> CoV <strong>for</strong> <strong>the</strong>50 year maximum equivalent uni<strong>for</strong>mly distributed load withinfluence area is plotted in Fig. 2. The CoV values <strong>for</strong>beams <strong>proposed</strong> by Kariyawasam are consistently smallerthan those <strong>for</strong> columns. All CoV values are relatively insensitiveto <strong>the</strong> influence area. The CoV values <strong>for</strong> columns aresimilar to that assumed by Allen (1975) <strong>for</strong> <strong>calibration</strong> <strong>of</strong>previous <strong>edition</strong>s <strong>of</strong> <strong>the</strong> NBCC, if <strong>the</strong> difference between <strong>the</strong>30 year and 50 year reference periods is taken into accounted.In past investigations, a Gumbel distribution has beenused to represent <strong>the</strong> total live load effect, including modellingand analysis <strong>factor</strong>s (Ellingwood et al. 1980;Kariyawasam 1996). In <strong>the</strong> present investigation, <strong>the</strong> liveload was assumed to be a Gumbel variate with a bias <strong>of</strong> 0.9and a CoV <strong>of</strong> 0.17. The combined effect <strong>of</strong> <strong>the</strong> modellingand analysis <strong>factor</strong>s has a bias <strong>of</strong> 1.0 and a CoV <strong>of</strong> [0.20 2 +0.05 2 ] 1/2 = 0.206 and was assumed to be time-independent. Itis fur<strong>the</strong>r assumed that <strong>the</strong> overall effect <strong>of</strong> modelling andanalysis is normally distributed, because its uncertainty isdominated by a single <strong>factor</strong>, <strong>the</strong> modelling uncertainty, andbecause in <strong>the</strong> absence <strong>of</strong> data or studies concerning <strong>the</strong>modelling uncertainty, a normal distribution seems as reasonableas any o<strong>the</strong>r.Point-in-time live loadsStatistical analyses <strong>of</strong> point-in-time live load have beencarried out by o<strong>the</strong>rs (Ellingwood and Culver 1977; Chalkand Corotis 1980; Ellingwood et al. 1980). The load may bemodelled as a sustained component, with a duration from 2to 8 years, and an extraordinary live load that occurs once ortwice per year. For <strong>the</strong> present study, it is assumed that <strong>the</strong>duration <strong>of</strong> <strong>the</strong> point-in-time live load, which includes both<strong>the</strong> sustained component and <strong>the</strong> extraordinary live loadevent, is 6 months.The point-in-time live load is assumed to have a Weibulldistribution, with parameters derived from those <strong>of</strong> <strong>the</strong>50 year maximum live load distribution following <strong>the</strong> procedurespresented by Wen (1990). The bias is 0.273 and <strong>the</strong>CoV is 0.674. The trans<strong>for</strong>mation <strong>factor</strong>s used to convertload into load effect were assumed identical <strong>for</strong> <strong>the</strong> 50 yearmaximum live load and <strong>the</strong> point-in-time live load.Fig. 2. Fifty year maximum live load coefficient <strong>of</strong> variation(CoV) versus influence area.Wind loadThe simplified procedure in <strong>the</strong> 1995 NBCC adopts a simple“gust <strong>factor</strong>” approach to estimate wind load on buildings.The wind pressure, p, against <strong>the</strong> surface <strong>of</strong> a buildingis[5] p = qC e C p C gwhere q is <strong>the</strong> reference velocity pressure, C e is <strong>the</strong> exposure<strong>factor</strong>, C p is <strong>the</strong> external pressure coefficient, and C g is <strong>the</strong>gust <strong>factor</strong>. Although values <strong>for</strong> each <strong>of</strong> <strong>the</strong>se variables arespecified in <strong>the</strong> NBCC, all are uncertain. As described in <strong>the</strong>next section, <strong>the</strong> reference velocity pressure depends on <strong>the</strong>climatic conditions at <strong>the</strong> site and, assuming <strong>the</strong>se conditionsdo not change, can be considered as a stochastic process.Thus <strong>the</strong> distribution <strong>of</strong> <strong>the</strong> maximum pressure that will occurover a given design life can be derived from <strong>the</strong> annualmaximum pressure distribution. The various coefficients thattrans<strong>for</strong>m <strong>the</strong> reference velocity pressure to a pressure on <strong>the</strong>surface <strong>of</strong> a building will be considered time-independentrandom variables.Reference wind pressuresIn Appendix C <strong>of</strong> <strong>the</strong> 1995 NBCC, <strong>the</strong> 1 in T year referencewind pressure, q T , is determined from <strong>the</strong> 1 in T yearwind velocity, V T ,as2[6] qT= 1 ρVT2where ρ is <strong>the</strong> density <strong>of</strong> air (1.2929 kg/m 3 <strong>for</strong> dry air at 0°Cand standard atmospheric pressure). The density <strong>of</strong> air wasconsidered deterministic because its CoV, roughly 2.5–5.0%(Ellingwood et al. 1980; MacGregor et al. 1997), is considerablyless than <strong>the</strong> CoV <strong>of</strong> V 2 T .Reference velocity pressures presented in Appendix C <strong>of</strong><strong>the</strong> 1995 NBCC are derived from 1 h wind velocity datafrom over 100 sites, typically airports, with 10–22 years <strong>of</strong>record (NBCC 1995). Maps were prepared showing contours<strong>of</strong> <strong>the</strong> 1 in 30 year wind velocity and dispersion parameters<strong>for</strong> Gumbel distributions fit to <strong>the</strong> data. For <strong>the</strong> locations© 2003 NRC Canada