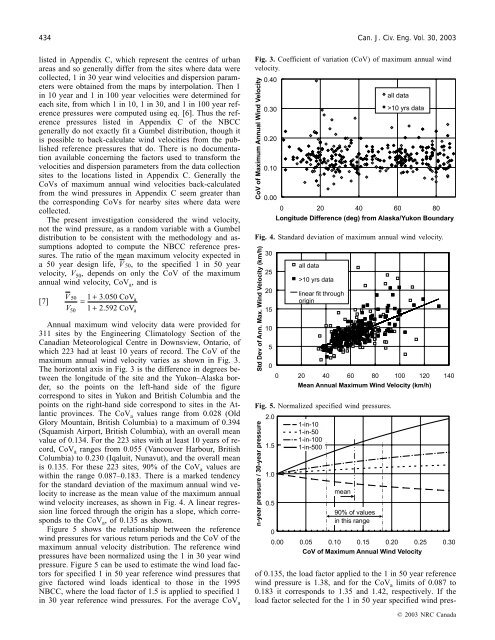
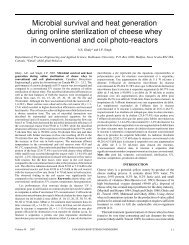
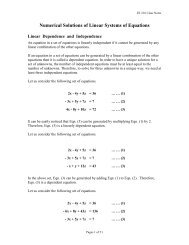
434 Can. J. Civ. Eng. Vol. 30, 2003listed in Appendix C, which represent <strong>the</strong> centres <strong>of</strong> urbanareas and so generally differ from <strong>the</strong> sites where data werecollected, 1 in 30 year wind velocities and dispersion parameterswere obtained from <strong>the</strong> maps by interpolation. Then 1in 10 year and 1 in 100 year velocities were determined <strong>for</strong>each site, from which 1 in 10, 1 in 30, and 1 in 100 year referencepressures were computed using eq. [6]. Thus <strong>the</strong> referencepressures listed in Appendix C <strong>of</strong> <strong>the</strong> NBCCgenerally do not exactly fit a Gumbel distribution, though itis possible to back-calculate wind velocities from <strong>the</strong> publishedreference pressures that do. There is no documentationavailable concerning <strong>the</strong> <strong>factor</strong>s used to trans<strong>for</strong>m <strong>the</strong>velocities and dispersion parameters from <strong>the</strong> data collectionsites to <strong>the</strong> locations listed in Appendix C. Generally <strong>the</strong>CoVs <strong>of</strong> maximum annual wind velocities back-calculatedfrom <strong>the</strong> wind pressures in Appendix C seem greater than<strong>the</strong> corresponding CoVs <strong>for</strong> nearby sites where data werecollected.The present investigation considered <strong>the</strong> wind velocity,not <strong>the</strong> wind pressure, as a random variable with a Gumbeldistribution to be consistent with <strong>the</strong> methodology and assumptionsadopted to compute <strong>the</strong> NBCC reference pressures.The ratio <strong>of</strong> <strong>the</strong> mean maximum velocity expected ina 50 year design life, V 50, to <strong>the</strong> specified 1 in 50 yearvelocity, V 50 , depends on only <strong>the</strong> CoV <strong>of</strong> <strong>the</strong> maximumannual wind velocity, CoV a , and isV 50 1[7] = + 3.050 CoVaV 1 + 2.592 CoV50aAnnual maximum wind velocity data were provided <strong>for</strong>311 sites by <strong>the</strong> Engineering Climatology Section <strong>of</strong> <strong>the</strong>Canadian Meteorological Centre in Downsview, Ontario, <strong>of</strong>which 223 had at least 10 years <strong>of</strong> record. The CoV <strong>of</strong> <strong>the</strong>maximum annual wind velocity varies as shown in Fig. 3.The horizontal axis in Fig. 3 is <strong>the</strong> difference in degrees between<strong>the</strong> longitude <strong>of</strong> <strong>the</strong> site and <strong>the</strong> Yukon–Alaska border,so <strong>the</strong> points on <strong>the</strong> left-hand side <strong>of</strong> <strong>the</strong> figurecorrespond to sites in Yukon and British Columbia and <strong>the</strong>points on <strong>the</strong> right-hand side correspond to sites in <strong>the</strong> Atlanticprovinces. The CoV a values range from 0.028 (OldGlory Mountain, British Columbia) to a maximum <strong>of</strong> 0.394(Squamish Airport, British Columbia), with an overall meanvalue <strong>of</strong> 0.134. For <strong>the</strong> 223 sites with at least 10 years <strong>of</strong> record,CoV a ranges from 0.055 (Vancouver Harbour, BritishColumbia) to 0.230 (Iqaluit, Nunavut), and <strong>the</strong> overall meanis 0.135. For <strong>the</strong>se 223 sites, 90% <strong>of</strong> <strong>the</strong> CoV a values arewithin <strong>the</strong> range 0.087–0.183. There is a marked tendency<strong>for</strong> <strong>the</strong> standard deviation <strong>of</strong> <strong>the</strong> maximum annual wind velocityto increase as <strong>the</strong> mean value <strong>of</strong> <strong>the</strong> maximum annualwind velocity increases, as shown in Fig. 4. A linear regressionline <strong>for</strong>ced through <strong>the</strong> origin has a slope, which correspondsto <strong>the</strong> CoV a , <strong>of</strong> 0.135 as shown.Figure 5 shows <strong>the</strong> relationship between <strong>the</strong> referencewind pressures <strong>for</strong> various return periods and <strong>the</strong> CoV <strong>of</strong> <strong>the</strong>maximum annual velocity distribution. The reference windpressures have been normalized using <strong>the</strong> 1 in 30 year windpressure. Figure 5 can be used to estimate <strong>the</strong> wind load <strong>factor</strong>s<strong>for</strong> specified 1 in 50 year reference wind pressures thatgive <strong>factor</strong>ed wind loads identical to those in <strong>the</strong> 1995NBCC, where <strong>the</strong> load <strong>factor</strong> <strong>of</strong> 1.5 is applied to specified 1in 30 year reference wind pressures. For <strong>the</strong> average CoV aFig. 3. Coefficient <strong>of</strong> variation (CoV) <strong>of</strong> maximum annual windvelocity.Fig. 4. Standard deviation <strong>of</strong> maximum annual wind velocity.Fig. 5. Normalized specified wind pressures.<strong>of</strong> 0.135, <strong>the</strong> load <strong>factor</strong> applied to <strong>the</strong> 1 in 50 year referencewind pressure is 1.38, and <strong>for</strong> <strong>the</strong> CoV a limits <strong>of</strong> 0.087 to0.183 it corresponds to 1.35 and 1.42, respectively. If <strong>the</strong>load <strong>factor</strong> selected <strong>for</strong> <strong>the</strong> 1 in 50 year specified wind pres-© 2003 NRC Canada
Bartlett et al. 435sure exceeds <strong>the</strong>se values, and <strong>the</strong> resistance <strong>factor</strong>s areunchanged, designs to <strong>the</strong> <strong>2005</strong> NBCC will require a greaternominal resistance than designs to <strong>the</strong> 1995 NBCC.Figure 5 can also be used to estimate <strong>the</strong> importance <strong>factor</strong><strong>for</strong> wind load <strong>for</strong> post-disaster buildings, which in <strong>the</strong>1995 NBCC are designed <strong>for</strong> <strong>the</strong> 1 in 100 year wind load.These provisions are equivalent to an importance <strong>factor</strong> thatranges from 1.14 to 1.26, with a mean value <strong>of</strong> 1.21.Calibration <strong>for</strong> wind load was carried out <strong>for</strong> Regina,Rivière du Loup, and Halifax. The annual maximum windvelocity was treated as a Gumbel variate with bias computedusing eq. [7] and CoV a values derived from <strong>the</strong> CanadianMeteorological Centre data. These values are summarized inTable 3.Trans<strong>for</strong>mation <strong>factor</strong>sAs implied by eq. [5], <strong>the</strong> reference velocity pressuremust be trans<strong>for</strong>med using gust, exposure, and pressure coefficientsto obtain <strong>the</strong> pressure applied to <strong>the</strong> surface <strong>of</strong> abuilding. Given that <strong>the</strong> trans<strong>for</strong>mation is represented as aproduct <strong>of</strong> independent random variables, <strong>the</strong> Central LimitTheorem implies that <strong>the</strong> overall trans<strong>for</strong>mation <strong>factor</strong> hasa log-normal distribution. It was fur<strong>the</strong>r assumed that <strong>the</strong>trans<strong>for</strong>mation <strong>factor</strong> is time independent. The current literaturepresents a considerable range <strong>of</strong> statistical parameters<strong>for</strong> <strong>the</strong>se coefficients; rationale <strong>for</strong> <strong>the</strong> particular values selectedis summarized briefly in <strong>the</strong> following paragraphs.The literature pertaining to <strong>the</strong> wind load approach inASCE7-98 (ASCE 2000) has limited relevance becausesome <strong>factor</strong>s differ markedly from those in <strong>the</strong> NBCC.Statistical parameters <strong>for</strong> <strong>the</strong> exposure coefficient, C e , and<strong>the</strong> combined gust and pressure coefficients, C g C p , reportedby o<strong>the</strong>rs are presented in Table 4. The C e parametersadopted <strong>for</strong> <strong>the</strong> current investigation are consistent withthose <strong>proposed</strong> by Davenport (1982, 2000). The C g C p biasadopted is conservative with respect to values <strong>proposed</strong> <strong>for</strong>low (Davenport 1982) or tall buildings (Davenport 2000),and <strong>the</strong> CoV adopted is at <strong>the</strong> higher end <strong>of</strong> <strong>the</strong> range <strong>of</strong> valuesreported by o<strong>the</strong>rs.ASCE7-98 (ASCE 2000) specifies a <strong>factor</strong> <strong>of</strong> 0.85 <strong>for</strong>directionality that was neglected in <strong>the</strong> present investigationbecause <strong>the</strong> gust and pressure coefficients used <strong>for</strong> lowbuilding design in <strong>the</strong> NBCC have been reduced to account<strong>for</strong> directionality and o<strong>the</strong>r <strong>factor</strong>s. Also, <strong>the</strong> pressure coefficientsin <strong>the</strong> NBCC <strong>for</strong> taller buildings are less severe thanthose in ASCE7-98 because <strong>the</strong>y permit <strong>the</strong> designer tocompute <strong>the</strong> leeward suction at <strong>the</strong> mid-height <strong>of</strong> <strong>the</strong> building,not at <strong>the</strong> top.Thus <strong>the</strong> overall bias coefficient accounting <strong>for</strong> exposure,gust, and pressure coefficients, ignoring wind directionality,is 0.80 × 0.85 = 0.68, with a CoV <strong>of</strong> 0.219, say 0.22. Asshown in Table 4, <strong>the</strong>se values are similar to those <strong>proposed</strong>by Ellingwood and Tekie (1999) and are comparable to values<strong>proposed</strong> by Davenport (1981, 1982).Point-in-time wind velocitiesPoint-in-time wind loads were derived assuming that <strong>the</strong>wind velocity (and <strong>the</strong>re<strong>for</strong>e pressure) is a stochastic processand <strong>the</strong> <strong>factor</strong> that trans<strong>for</strong>ms <strong>the</strong> reference pressure to aload against <strong>the</strong> building surface is a time-independent randomvariable. The duration <strong>of</strong> each wind pulse was assumedTable 3. Statistical parameters <strong>for</strong> maximum wind velocity in50 year and 3 h periods.to be 3 h, so <strong>the</strong> annual number <strong>of</strong> pulses is 365.25 × 24/3 =2922. The central tendency and dispersion parameters <strong>for</strong><strong>the</strong> point-in-time distributions are summarized in Table 3.Snow loadMaximum 50 yearMaximum 3 hSite CoV a Bias CoV Bias CoVRegina 0.108 1.039 0.081 0.130 0.785Rivière du Loup 0.170 1.054 0.112 0.066 1.095Halifax 0.150 1.049 0.103 0.080 1.001The actual snow load on a ro<strong>of</strong> is <strong>the</strong> difference between<strong>the</strong> quantity <strong>of</strong> snow or rain that has accumulated and <strong>the</strong>quantity that has been removed by wind, melting, or evaporation(Ellingwood and O’Rourke 1985), but data are notreadily available to quantify snow load in this manner. Instead,<strong>the</strong> model used <strong>for</strong> design, which expresses <strong>the</strong> snowload on <strong>the</strong> ro<strong>of</strong> <strong>of</strong> a structure, S, as a snow component anda rain component, was adopted:[8] S =(C b C w C s C a )S s + S rwhere S s is <strong>the</strong> ground snow load, S r is <strong>the</strong> associated rainload, C b is <strong>the</strong> basic ro<strong>of</strong> snow load <strong>factor</strong> and equals 0.8,C w is <strong>the</strong> wind exposure <strong>factor</strong>, C s is <strong>the</strong> slope <strong>factor</strong>, and C ais <strong>the</strong> accumulation <strong>factor</strong>. The trans<strong>for</strong>mation <strong>factor</strong>, C gr ,that converts <strong>the</strong> ground snow load at a given site to an appropriatero<strong>of</strong> snow load is[9] C gr = C b C w C s C aAccording to <strong>the</strong> 1995 NBCC, S r need not be takengreater than C gr S s .Ground snow loadThe ground snow load, S s , is determined in Appendix C <strong>of</strong><strong>the</strong> 1995 NBCC as <strong>the</strong> product <strong>of</strong> <strong>the</strong> depth <strong>of</strong> snow, d, and<strong>the</strong> unit weight <strong>of</strong> snow, γ. These values were computed(NBCC 1995; Newark et al. 1989) by first fitting Gumbeldistributions to maximum annual accumulated snow depthdata <strong>for</strong> 1618 stations with 7–38 years <strong>of</strong> record and calculating1 in 30 year values. Then snow densities were determined,<strong>for</strong> various geographical regions with commonclimatic features as manifested by <strong>for</strong>est type, that averaged2.01 kN/m 3 east <strong>of</strong> <strong>the</strong> continental divide, 2.55–4.21 kN/m 3west <strong>of</strong> <strong>the</strong> continental divide, and 2.94 kN/m 3 above <strong>the</strong>treeline in <strong>the</strong> Northwest Territories and Nunavut. The loadswere normalized to account <strong>for</strong> <strong>the</strong> site elevation, assuminga linear variation <strong>of</strong> load above sea level, and smoo<strong>the</strong>d contourmaps were prepared. The final loads corresponding to<strong>the</strong> various geographical locations in Appendix C were derivedby interpolation and rectified to account <strong>for</strong> elevation.There is no documentation available concerning <strong>the</strong> interpolationweighting <strong>factor</strong>s used to trans<strong>for</strong>m <strong>the</strong> ground snowload values from <strong>the</strong> data collection sites to <strong>the</strong> locationslisted in Appendix C.The present investigation considered <strong>the</strong> maximum annualsnow accumulation depth to have a Gumbel distribution, <strong>for</strong>consistency with <strong>the</strong> basis <strong>for</strong> computation <strong>of</strong> <strong>the</strong> specified© 2003 NRC Canada