comparison of alternative asphalt concrete rut characterization
comparison of alternative asphalt concrete rut characterization
comparison of alternative asphalt concrete rut characterization

Create successful ePaper yourself
Turn your PDF publications into a flip-book with our unique Google optimized e-Paper software.
COMPARISON OF ALTERNATIVE TEST METHODS FORPREDICTING ASPHALT CONCRETE RUT PERFORMANCEPrepared By:Curtis Berthelot, Assistant Pr<strong>of</strong>essorBill Crockford, PresidentRobert Lytton, Pr<strong>of</strong>essorPresented in:Canadian Technical Asphalt Association Proceedings44 th Annual ConferenceVol XLVL, pp 405-4341999ACKNOWLEDGMENTSThe authors would like to acknowledge the assistance provided by Ms. Stella White P.Eng. <strong>of</strong>Saskatchewan Highways and Transportation. In addition, the participation and support provided byPounder Emulsions Division <strong>of</strong> Husky Asphalt Marketing, Imperial Oil, Koch Materials, Moose JawAsphalt, and the National Science and Engineering Research Council is greatly appreciated.
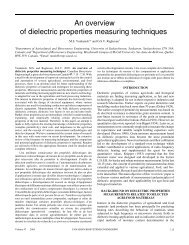
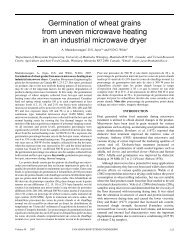
BERTHELOT, CROCKFORD & LYTTON 3NRadisson SPS-9A Test Site LayoutDirection <strong>of</strong> TrafficBasic SPS-9A RequirementsTransition7+1357+0896+8176+3546+0826+0195+1505+7474+9534+8294+6174+5294+2574+1883+9163+870900961SHT MarshallTransition900962SuperpaveRecycleTransition900960SuperpaveTransition900901SHT MarshallTransition900903SuperpaveTransition900902SuperpaveTransition900959SuperpaveTransitionRadisson SPS-9A Pavement Structure Cross-SectionC L120 mm Asphalt Concrete200 mm Granular Base230 mm Silty Sand SubbaseClay Till Subgrade (CBR 6)Figure 1 Radisson Specific Pavement Studies -9A Test Site Layout and Pavement StructureCross-SectionTable 1 Asphalt Binder Grade and Mix Design Method used in Radisson Specific PavementStudies - 9A Test Sections GoodSPS-9A Test SHRP PG and SDHT Penetration Mix Design MethodSectionAsphalt Binder Grade900901900959PG 58-28 (AC 150/200)PG 58-28 (AC 150/200)SHT Marshall Mix DesignSuperpave Mix Design900903900961PG 52-34 (AC 200/300)PG 52-34 (AC 200/300)Superpave Mix DesignSHT Marshall Mix Design900960 PG 46-34 (AC 300/400) Superpave Mix Design900902900962PG 52-40PG 52-40Superpave Mix DesignSuperpave Recycle Mix DesignSDHT = Saskatchewan Department <strong>of</strong> Highways and Transportation
BERTHELOT, CROCKFORD & LYTTON 44.0 RADISSON SPS-9A ASPHALT CONCRETE CHARACTERIZATION RESULTS4.1 Marshall Stability and Flow CharacterizationMarshall stability and flow testing <strong>of</strong> <strong>asphalt</strong> <strong>concrete</strong> has been widely used by the road industry and isstandardized in ASTM D 1560 and AASHTO T245. Marshall stability and flow measurements weretaken on triplicate gyratory compacted samples at seven percent air voids from each Radisson SPS-9A<strong>asphalt</strong> <strong>concrete</strong> mix. Table 2 summarizes the Marshall stability measurements and Table 3 summarizesthe Marshall flow measurements <strong>of</strong> the Radisson SPS-9A <strong>asphalt</strong> <strong>concrete</strong> mixes.Table 2 Marshall Stability Measurements and Duncan's Pairwise Comparison <strong>of</strong> RadissonSpecific Pavement Studies-9A Asphalt Concrete MixesSPS-9A TestDuncan's Grouping*SectionMean MarshallStability(N)MarshallStabilityCoefficient <strong>of</strong>Variation(Percent)900901 3958 10.84 C900902 7562 6.55 A900903 5115 15.72 B C900959 7176 13.02 A900960 5975 8.63 B900961 4685 14.22 C900962 7828 9.30 AMean 6042 11.18* Asphalt <strong>concrete</strong> mixes with same letter are not significantly different.Table 3 Marshall Flow Measurements and Duncan's Pairwise Comparison <strong>of</strong> Radisson SpecificPavement Studies9A Asphalt Concrete MixesSPS-9A TestDuncan's Grouping*SectionMean MarshallFlow(0.25 mmIncrements)Marshall FlowCoefficient <strong>of</strong>Variation(Percent)900901 12.0 8.33 C900902 14.3 4.03 B C900903 14.3 4.03 B C900959 16.3 18.70 A B900960 14.3 4.03 B C900961 12.0 8.33 C900962 18.7 17.22 AMean 14.6 9.23* Asphalt <strong>concrete</strong> mixes with same letter are not significantly different.A statistical analysis was performed at a 95 percent confidence level to evaluate the significance <strong>of</strong> theMarshall stability and flow measurements <strong>of</strong> the Radisson SPS-9A <strong>asphalt</strong> <strong>concrete</strong> mixes. A one-wayanalysis <strong>of</strong> variance concluded that Radisson SPS-9A <strong>asphalt</strong> <strong>concrete</strong> mix type had a significant effecton the mean Marshall stability measurements. Duncan's pairwise <strong>comparison</strong> (25) determined that themean Marshall stability measurements <strong>of</strong> mixes 900902, 900959, and 900962 were not significantly
BERTHELOT, CROCKFORD & LYTTON 5different; mixes 900903 and 900960 were not significantly different; and mixes 900901, 900903, and900961 were not significantly different.A one-way analysis <strong>of</strong> variance concluded that Radisson SPS-9A <strong>asphalt</strong> <strong>concrete</strong> mix type had asignificant effect on the mean Marshall flow measurements. Duncan's pairwise <strong>comparison</strong> determinedthat the mean Marshall flow <strong>of</strong> mixes 900959 and 900962 were not significantly different; mixes 900902,900903, 900959, and 900960 were not significantly different; and mixes 900901, 900902, 900903,900960, and 900961 were not significantly different.The Marshall stabilometer is widely used throughout the road industry due to its simplicity, costeffectiveness, repeatability, and concomitant empirical experience. The Marshall stabilometer was foundto distinguish some significant differences between the Radisson SPS-9A <strong>asphalt</strong> <strong>concrete</strong> mixes.Limitations <strong>of</strong> the Marshall stabilometer include: it is unable to provide feedback controlled on-samplemulti-axial mechanistic measurements; it specifies a small sample size (62.5 mm by 101 mm); it appliesboundary tractions under curvilinear platens resulting in nonlinear stress-strain fields; it does not have theability to apply confinement tractions to the sample; and it is designed for testing <strong>asphalt</strong> <strong>concrete</strong> at 60°Cat a specified displacement rate <strong>of</strong> 1.3 mm/min. As a result, the Marshall stabilometer cannot be used tocharacterize the fundamental thermomechanical constitutive behavior <strong>of</strong> <strong>asphalt</strong> <strong>concrete</strong> across stressand strain states, stress and strain rates, and temperatures representative <strong>of</strong> those experienced in the fieldas required for mechanistic road-modeling. The Marshall stabilometer was found not to provide properranking <strong>of</strong> the Radisson SPS-9A <strong>asphalt</strong> <strong>concrete</strong> mixes concomitant to field <strong>rut</strong>ting performance afterthree years <strong>of</strong> service.4.2 Hveem Stability CharacterizationHveem stability <strong>characterization</strong> <strong>of</strong> <strong>asphalt</strong> <strong>concrete</strong> has been widely used by the road industry and isspecified in ASTM D1561 and AASHTO T246. Hveem stability testing was performed on triplicategyratory compacted samples at seven percent air voids from each Radisson SPS-9A <strong>asphalt</strong> <strong>concrete</strong> mix.Table 4 summarizes the Hveem stability measurements across the Radisson SPS-9A <strong>asphalt</strong> <strong>concrete</strong>mixes.A statistical analysis was performed at a 95 percent confidence level to evaluate the significance <strong>of</strong> theHveem stability measurements across the Radisson SPS-9A <strong>asphalt</strong> <strong>concrete</strong> mixes. A one-way analysis<strong>of</strong> variance concluded that Radisson SPS-9A <strong>asphalt</strong> <strong>concrete</strong> mix type had a significant effect on themean Hveem stability measurements. Duncan's pairwise <strong>comparison</strong> determined that the mean Hveemstability <strong>of</strong> mix 900902 was significantly different from all other mixes; however, mixes 900960 and900962 were not significantly different; mixes 900903, 900959, and 900961 were not significantlydifferent; and mixes 900901 and 900961 were not significantly different.The Hveem stabilometer was found to distinguish some significant differences between the RadissonSPS-9A <strong>asphalt</strong> <strong>concrete</strong> mixes and produced a low mean coefficient <strong>of</strong> variation. A drawback to theHveem stabilometer is it requires a high capacity load frame, which increases the owning and operatingcosts and renders it impractical for field testing. In addition, like the Marshall stabilometer, the Hveemstabilometer does not provide feedback controlled on sample multi-axial mechanistic measurements and itspecifies a small sample size (62.5 mm diameter by 101 mm tall). As a result, the Hveem stabilometercannot be used to characterize the fundamental thermomechanical constitutive behavior <strong>of</strong> <strong>asphalt</strong><strong>concrete</strong> across stress and strain states, stress and strain rates, and temperatures representative <strong>of</strong> thoseexperienced in the field as required for mechanistic road-modeling. The Hveem stabilometer was found
BERTHELOT, CROCKFORD & LYTTON 6not to provide proper ranking <strong>of</strong> the Radisson SPS-9A <strong>asphalt</strong> <strong>concrete</strong> mixes concomitant to field <strong>rut</strong>tingperformance after three years <strong>of</strong> service.Table 4 Hveem Stability Measurements and Duncan's Pairwise Comparison <strong>of</strong> Radisson SpecificPavement Studies-9A Asphalt Concrete MixesSPS-9A Test Mean Hveem HveemDuncan's Grouping*Section Stability StabilityCoefficient <strong>of</strong>Variation(Percent)900901 28.61 1.94 D900902 40.02 1.44 A900903 32.53 3.32 C900959 30.95 7.38 C900960 34.78 3.71 B900961 30.80 2.70 C D900962 35.32 3.68 BMean 33.29 3.45* Asphalt <strong>concrete</strong> mixes with same letter are not significantly different.4.3 Unconfined Compressive Strength CharacterizationUnconfined compressive strength testing <strong>of</strong> <strong>asphalt</strong> <strong>concrete</strong> is standardized in ASTM D1074 andAASHTO T167. Unconfined compressive strength testing was performed on triplicate gyratorycompacted samples at seven percent air voids from each Radisson SPS-9A <strong>asphalt</strong> <strong>concrete</strong> mix at 5°C,20°C, 40°C, 70°C, and 100°C. Tables 5 and 6 summarize the mean unconfined compressive strengthmeasurements across the Radisson SPS-9A <strong>asphalt</strong> <strong>concrete</strong> mixes and test temperatures respectively.A statistical analysis was performed at a 95 percent confidence level to evaluate the significance <strong>of</strong> theunconfined compressive strength measurements across the Radisson SPS-9A <strong>asphalt</strong> <strong>concrete</strong> mixes andtest temperatures employed in the analysis. A two-way analysis <strong>of</strong> variance concluded that RadissonSPS-9A <strong>asphalt</strong> <strong>concrete</strong> mix type, test temperature and the interaction effects <strong>of</strong> mix type and testtemperature had a significant effect on the mean unconfined compressive strength measurements..Duncan's pairwise <strong>comparison</strong> determined that the mean unconfined compressive strength <strong>of</strong> mixes900959 and 900962 were significantly different from all other mixes; however, mixes 900901, 900902,900903, and 900960 were not significantly different; and mixes 900901, 900902, 900903 and 900961were not significantly different. Duncan's pairwise <strong>comparison</strong> across the test temperatures grouped byRadisson SPS-9A <strong>asphalt</strong> <strong>concrete</strong> mix determined that the mean unconfined compressive strengths at5°C, 20°C, and 40°C were significantly different from those at all other temperatures; however, there wasno significant difference between 70°C and 100°C.
BERTHELOT, CROCKFORD & LYTTON 7Table 5 Unconfined Compressive Strength Measurements and Duncan's Pairwise Comparison <strong>of</strong>Radisson Specific Pavement Studies-9A Asphalt Concrete Mixes Grouped by Test TemperatureSPS-9A TestDuncan's Grouping*SectionMeanUnconfinedCompressiveStrength(kPa)MeanUnconfinedCompressiveStrengthCoefficient <strong>of</strong>Variation(Percent)900901 1725 17.66 B C900902 1679 11.57 B C900903 1726 16.16 B C900959 2576 5.40 A900960 1874 7.89 B900961 1589 13.10 C900962 1222 9.60 DMean 1770 11.31* Asphalt <strong>concrete</strong> mixes with same letter are not significantly different.Table 6 Unconfined Compressive Strength Measurements and Duncan's Pairwise Comparisonacross Test Temperatures Grouped by Radisson Specific Pavement Studies -9A Asphalt ConcreteMixTestTemperatureMeanUnconfinedCompressiveStrength(kPa)MeanUnconfinedCompressiveStrengthCoefficient <strong>of</strong>Variation(Percent)Duncan's Grouping*5°C 6134 10.90 A20°C 1601 6.37 B40°C 713 11.46 C70°C 298 14.51 D100°C 106 13.31 DMean 1770 11.31* Test temperatures with same letter are not significantly different.Unconfined compressive strength testing was found to distinguish some significant differences betweenthe Radisson SPS-9A <strong>asphalt</strong> <strong>concrete</strong> mixes. However, because confinement tractions are not applied tothe sample and the compressive tractions required to fail the sample are significantly greater than thosetypically experienced under field loading conditions, the stress state generated during the unconfinedcompressive strength test does not accurately represent the true stress state experienced under fieldloading conditions. Unconfined compressive strength testing also requires a heavy capacity load frame,which increases owning and operating costs and renders it impractical for field testing. Like the Marshalland Hveem stabilometers, unconfined compressive strength testing does not provide feedback control onsample multi-axial measurements and therefore cannot characterize the thermomechanical constitutivebehavior <strong>of</strong> <strong>asphalt</strong> <strong>concrete</strong> across stress and strain states, stress and strain rates, and temperaturesrepresentative <strong>of</strong> those experienced in the field as required for mechanistic road-modeling. The
BERTHELOT, CROCKFORD & LYTTON 8unconfined compressive strength test was found not to provide proper ranking <strong>of</strong> the Radisson SPS-9A<strong>asphalt</strong> <strong>concrete</strong> mixes concomitant to field <strong>rut</strong>ting performance after three years <strong>of</strong> service.4.4 SHRP Shear Tester CharacterizationThe Strategic Highway Research Program developed a prototype suite <strong>of</strong> tests to characterize thethermomechanical behavior <strong>of</strong> <strong>asphalt</strong> <strong>concrete</strong> mixes and they are specified in AASHTO TP7-94 (25).The SHRP suite <strong>of</strong> shear tests include: volumetric-hydrostatic test, uniaxial strain at constant radius test,simple shear at constant height test, frequency sweep shear at constant height test, and repeated shear atconstant stress ratio test.The repeated shear at constant height is specified in AASHTO TP7-94 (25) as optional procedure F.However, it was not performed in this study. Asphalt <strong>concrete</strong> samples used for the SHRP Level III sheartester <strong>characterization</strong> were prepared using SHRP specified gyratory compaction protocols as outlined inAASHTO TP4 (25). Figure 2 shows an <strong>asphalt</strong> <strong>concrete</strong> sample mounted in the SHRP shear tester for thevolumetric-hydrostatic and uniaxial strain at constant radius tests. Figure 3 shows an <strong>asphalt</strong> <strong>concrete</strong>sample mounted in the SHRP shear tester for the simple shear at constant height, frequency sweep shearat constant height and repeated shear at constant stress ratio tests.Figure 2 SHRP Shear Tester Uniaxial Strain and Volumetric-Hydrostatic Sample Configuration
BERTHELOT, CROCKFORD & LYTTON 9Figure 3 SHRP Shear Tester Simple Shear, Frequency Sweep Shear, and Repeated Shear SampleConfiguration4.4.1 SHRP Volumetric-Hydrostatic CharacterizationThe SHRP volumetric-hydrostatic test evaluates the bulk elastic properties <strong>of</strong> <strong>asphalt</strong> <strong>concrete</strong> underdifferent states <strong>of</strong> hydrostatic stress and temperature. SHRP volumetric-hydrostatic testing wasperformed on triplicate gyratory compacted samples at seven percent air voids from each Radisson SPS-9A <strong>asphalt</strong> <strong>concrete</strong> mix at test temperatures <strong>of</strong> 4°C, 20°C, and 40°C, and corresponding peak hydrostatictractions <strong>of</strong> 830 kPa, 690 kPa, and 550 kPa, respectively. Tables 7 and 8 summarize the SHRP bulkmodulus measurements across the Radisson SPS-9A <strong>asphalt</strong> <strong>concrete</strong> mixes and stress states-testtemperatures considered in this analysis respectively.A statistical analysis was performed at a 95 percent confidence level to evaluate the significance <strong>of</strong> theSHRP bulk modulus measurements across the Radisson SPS-9A <strong>asphalt</strong> <strong>concrete</strong> mixes and stress statestesttemperatures employed in the analysis. A two-way analysis <strong>of</strong> variance concluded that RadissonSPS-9A <strong>asphalt</strong> <strong>concrete</strong> mix type had a significant effect on the mean SHRP bulk moduli measurements.However, test temperature-stress state, and the interaction effects between Radisson SPS-9A <strong>asphalt</strong><strong>concrete</strong> mix type and test temperature-stress state did not have a significant effect on the mean SHRPbulk measurements. Duncan's pair wise <strong>comparison</strong> <strong>of</strong> the mean SHRP bulk modulus <strong>of</strong> the RadissonSPS-9A <strong>asphalt</strong> <strong>concrete</strong> mixes grouped by test temperature-stress state determined that: mixes 900901,900902, 900903, 900960, and 900962 were not significantly different; mixes 900901, 900902, 900903,900959, and 900962 were not significantly different; and mixes 900901, 900903, 900959, 900961, and900962 were not significantly different. Duncan's pairwise <strong>comparison</strong> <strong>of</strong> the mean SHRP bulk modulusacross test temperatures-stress states grouped by Radisson SPS-9A <strong>asphalt</strong> <strong>concrete</strong> mix determined that
BERTHELOT, CROCKFORD & LYTTON 10no significant difference existed between the mean SHRP bulk modulus measurements at 4°C (830 kPa),20°C (690 kPa), and 40°C (550 kPa).Table 7 SHRP Bulk Modulus Measurements and Duncan's Pairwise Comparison <strong>of</strong> RadissonSpecific Pavement Studies-9A Asphalt Concrete Mixes Grouped by Test Temperature-Stress StateSPS-9A TestDuncan's Grouping*SectionMean SHRPBulk Modulus(MPa)Mean SHRPBulk ModulusCoefficient <strong>of</strong>Variation(Percent)900901 256.091 70.93 A B C900902 409.220 67.79 A B900903 374.032 53.25 A B C900959 205.111 25.80 B C900960 450.165 48.23 A900961 185.729 43.39 C900962 363.446 27.46 A B CMean 320.542 48.12* Asphalt <strong>concrete</strong> mixes with same letter are not significantly different.Table 8 SHRP Bulk Modulus Measurements and Duncan's Pairwise Comparison <strong>of</strong> TestTemperatures-Stress States Grouped by Radisson Special Pavement Studies -9A Asphalt ConcreteMixTestTemperature(HydrostaticTraction)Mean SHRPBulk Modulus(MPa)Mean SHRPBulk ModulusCoefficient <strong>of</strong>Variation(Percent)Duncan's Grouping*4°C (830 kPa) 347.698 55.07 A20°C (690 kPa) 273.068 43.66 A40°C (550 kPa) 339.899 45.63 AMean 320.542 48.12* Test temperatures-stress states with same letter are not significantly different.4.4.2 SHRP Uniaxial Strain at Constant Radius CharacterizationThe SHRP uniaxial strain at constant radius test employs the SHRP shear tester to characterize the elasticand plastic behavior <strong>of</strong> <strong>asphalt</strong> <strong>concrete</strong> under constrained uniaxial loading. SHRP uniaxial strain atconstant radius testing was performed on triplicate gyratory compacted samples at seven percent air voidsfrom each Radisson SPS-9A <strong>asphalt</strong> <strong>concrete</strong> mix at test temperatures <strong>of</strong> 4°C, 20°C, and 40°C, andcorresponding uniaxial tractions <strong>of</strong> 655 kPa, 550 kPa, and 345 kPa, respectively. Tables 9 and 10summarize the SHRP uniaxial constrained modulus measurements across the Radisson SPS-9A <strong>asphalt</strong><strong>concrete</strong> mixes and stress states-test temperatures considered in this analysis respectively.A statistical analysis was performed at a 95 percent confidence level to evaluate the significance <strong>of</strong> theSHRP uniaxial constrained compression modulus measurements across the Radisson SPS-9A <strong>asphalt</strong><strong>concrete</strong> mixes and test temperatures-stress states employed in the analysis. A two-way analysis <strong>of</strong>
BERTHELOT, CROCKFORD & LYTTON 11variance concluded that Radisson SPS-9A <strong>asphalt</strong> <strong>concrete</strong> mix type had a significant effect on the themean SHRP uniaxial constrained compression modulus measurements. However, test temperature-stressstate and the interaction effects <strong>of</strong> Radisson SPS-9A <strong>asphalt</strong> <strong>concrete</strong> mix type and test temperature-stressstate had no significant effect on the mean SHRP uniaxial compression moduli measurements.. Duncan'spairwise <strong>comparison</strong> <strong>of</strong> the mean SHRP uniaxial constrained compression modulus <strong>of</strong> the Radisson SPS-9A <strong>asphalt</strong> <strong>concrete</strong> mixes grouped by test temperature-stress state determined that: mixes 900903,900959, and 900961 were not significantly different; mixes 900902, 900903, 900960, and 900962 werenot significantly different; and mixes 900901, 900902, 900960, and 900962 were not significantlydifferent. Duncan's pairwise <strong>comparison</strong> <strong>of</strong> the mean SHRP uniaxial constrained compression modulusacross the test temperatures-stress states grouped by Radisson SPS-9A <strong>asphalt</strong> <strong>concrete</strong> mix determinedthat no significant difference existed between the mean SHRP uniaxial constrained compression modulusmeasurements at 4°C (655 kPa), 20°C (550 kPa), and 40°C (345 kPa).Table 9 SHRP Uniaxial Constrained Compression Modulus Measurements and Duncan’s PairwiseComparison <strong>of</strong> Radisson Specific Pavement Studies -9A Asphalt Concrete Mixes Grouped by TestTemperature-Stress StateSPS-9A TestSectionMean SHRPUniaxialConstrainedCompressionModulus(MPa)Mean SHRPUniaxialConstrainedCompressionModulusCoefficient <strong>of</strong>Variation(Percent)Duncan's Grouping*900901 73.570 31.05 C900902 108.728 58.20 B C900903 156.457 37.73 A B900959 209.890 37.22 A900960 112.784 18.42 B C900961 220.411 22.69 A900962 131.344 57.83 B CMean 144.741 37.59* Asphalt <strong>concrete</strong> mixes with same letter are not significantly different.Table 10 SHRP Uniaxial Constrained Compression Modulus Measurements and Duncan’sPairwise Comparison <strong>of</strong> Test Temperatures-Stress States Grouped by Radisson Specific PavementStudies -9A Asphalt Concrete MixTestTemperature(UniaxialTraction)Mean SHRPUniaxialConstrainedModulus(MPa)Mean SHRPUniaxialConstrainedModulusCoefficient <strong>of</strong>Variation(Percent)Duncan's Grouping*4°C (655 kPa) 159.235 43.49 A20°C (550 kPa) 139.528 33.44 A40°C (345 kPa) 135.460 35.84 AMean 144.741 37.59* Test temperatures-stress states with same letter are not significantly different.
BERTHELOT, CROCKFORD & LYTTON 124.4.3 SHRP Simple Shear at Constant Height CharacterizationThe SHRP simple shear at constant height test employs the SHRP shear tester to characterize the elastic,viscoelastic, and plastic behavior <strong>of</strong> <strong>asphalt</strong> <strong>concrete</strong> mixes under states <strong>of</strong> mixed mode shear and uniaxialcreep loading. SHRP simple shear at constant height testing was performed on triplicate gyratorycompacted samples at seven percent air voids from each Radisson SPS-9A <strong>asphalt</strong> <strong>concrete</strong> mix at testtemperatures <strong>of</strong> 4°C, 20°C, and 40°C, and corresponding SHRP simple shear tractions <strong>of</strong> 345 kPa, 105kPa, and 35 kPa, respectively. Tables 11 and 12 summarize the total SHRP simple shear strainmeasurements across the Radisson SPS-9A <strong>asphalt</strong> <strong>concrete</strong> mixes and stress states-test temperaturesconsidered in this analysis respectively.A statistical analysis was performed at a 95 percent confidence level to evaluate the significance <strong>of</strong> thetotal SHRP simple shear strain measurements across the Radisson SPS-9A <strong>asphalt</strong> <strong>concrete</strong> mixes andtest temperatures-stress states employed in the analysis. A two-way analysis <strong>of</strong> variance concluded thatRadisson SPS-9A <strong>asphalt</strong> <strong>concrete</strong> mix type, test temperature-stress state, and the interaction effectsbetween Radisson SPS-9A <strong>asphalt</strong> <strong>concrete</strong> mix type and test temperature-stress state had a significanteffect on the mean total SHRP simple shear strain measurements. Duncan's pairwise <strong>comparison</strong> <strong>of</strong> themean total SHRP simple shear strain across the Radisson SPS-9A <strong>asphalt</strong> <strong>concrete</strong> mixes grouped by testtemperature-stress state determined that: mixes 900961 and 900962 were significantly different from allother mixes; however, mixes 900901, 900903, and 900960 were not significantly different; and mixes900901, 900959, 900960, and 900962 were not significantly different. Duncan's pairwise <strong>comparison</strong>across the test temperatures-stress states grouped by Radisson SPS-9A <strong>asphalt</strong> <strong>concrete</strong> mix determinedthat significant difference existed between the mean total SHRP simple shear strain measurements at 5°C(345 kPa), 20°C (105 kPa) and 40°C (35 kPa).Table 11 Total SHRP Simple Shear Strain Measurements and Duncan’s Pairwise Comparison(reference) <strong>of</strong> Radisson Specific Pavement Studies -9A Asphalt Concrete Mixes Grouped by TestTemperature-Stress StateSPS-9A TestSectionMean TotalSHRP SimpleShear Strain(mm/mm)Mean TotalSHRP SimpleShear StrainCoefficient <strong>of</strong>Variation(Percent)Duncan's Grouping*900901 0.007145 6.21 B C900902 0.002038 55.49 D900903 0.008073 20.44 B900959 0.005119 31.53 C900960 0.006430 15.87 B C900961 0.011165 22.63 A900962 0.006000 31.96 CMean 0.006567 26.30* Asphalt <strong>concrete</strong> mixes with same letter are not significantly different.
BERTHELOT, CROCKFORD & LYTTON 13Table 12 Total SHRP Simple Shear Strain Measurements and Duncan’s Pairwise Comparison <strong>of</strong>Test Temperatures-Stress States Grouped by Radisson Specific Pavement Studies -9A AsphaltConcrete MixTestTemperature(Simple ShearTraction)Mean TotalSHRP SimpleShear Strain(mm/mm)Mean TotalSimple SHRPShear StrainCoefficient <strong>of</strong>Variation(Percent)Duncan's Grouping*4°C (345 kPa) 0.004491 18.50 A20°C (105 Pa) 0.006959 29.68 B40°C (35 kPa) 0.008251 30.73 CMean 0.006567 26.30* Test temperatures-stress states with same letter are not significantly different.4.4.4 SHRP Frequency Sweep Shear at Constant Height CharacterizationThe SHRP frequency sweep shear at constant height test employs the SHRP shear tester to evaluate thecomplex shear behavior <strong>of</strong> <strong>asphalt</strong> <strong>concrete</strong>. SHRP frequency sweep shear testing was performed ontriplicate gyratory compacted samples at seven percent air voids from each Radisson SPS-9A <strong>asphalt</strong><strong>concrete</strong> mix at 4°C, 20°C, and 40°C, respectively. Since the Radisson SPS-9A test site is located onHighway 16 where the design traffic loading is a truck tire traveling at a posted speed limit <strong>of</strong> 100kilometers per hour, detailed analysis <strong>of</strong> the SHRP frequency sweep shear data was restricted to 10 Hzcyclic frequency. Tables 13 and 14 summarize the complex SHRP shear modulus measurements at 10Hz cyclic frequency across the Radisson SPS-9A <strong>asphalt</strong> <strong>concrete</strong> mixes and test temperaturesrespectively.A statistical analysis was performed at a 95 percent confidence level to evaluate the significance <strong>of</strong> thecomplex SHRP shear modulus measurements at 10 Hz cyclic frequency across the Radisson SPS-9A<strong>asphalt</strong> <strong>concrete</strong> mixes and test temperatures employed in the analysis. A two-way analysis <strong>of</strong> varianceconcluded that Radisson SPS-9A <strong>asphalt</strong> <strong>concrete</strong> mix type and test temperature had a significant effecton the mean complex SHRP shear modulus at 10 Hz cyclic frequency. However, the interaction effectsbetween Radisson SPS-9A <strong>asphalt</strong> <strong>concrete</strong> mix type and test temperature was found not to have asignificant effect on the SHRP complex shear modulus measurements at 10 Hz cyclic frequency.Duncan's pairwise <strong>comparison</strong> <strong>of</strong> the mean complex SHRP shear modulus measurements at 10 Hz cyclicfrequency <strong>of</strong> the Radisson SPS-9A <strong>asphalt</strong> <strong>concrete</strong> mixes grouped by test temperature determined that:mix 900902 was significantly different from all other mixes; however, mixes 900901, 900903, 900959,900960, 900961, and 900962 were not significantly different. Duncan's pairwise <strong>comparison</strong> <strong>of</strong> the meancomplex SHRP shear modulus at 10 Hz cyclic frequency across the test temperatures grouped byRadisson SPS-9A <strong>asphalt</strong> <strong>concrete</strong> mix determined that significant difference existed between the meancomplex SHRP shear modulus measurements at 4°C, 20°C, and 40°C.
BERTHELOT, CROCKFORD & LYTTON 14Table 13 Complex SHRP Shear Modulus Measurements and Duncan’s Pairwise Comparison at 10Hz Cyclic Frequency <strong>of</strong> Radisson Specific Pavement Studies-9A Asphalt Concrete Mixes Groupedby Test TemperatureSPS-9A TestSectionMean ComplexSHRP ShearModulus(MPa)Mean ComplexSHRP ShearModulusCoefficient <strong>of</strong>Variation(Percent)Duncan's Grouping *900901 827.791 8.39 B900902 1491.639 55.21 A900903 855.529 11.15 B900959 1029.969 24.37 B900960 798.400 11.26 B900961 655.615 31.59 B900962 681.342 8.38 BMean 905.755 21.48* Asphalt <strong>concrete</strong> mixes with same letter are not significantly different.Table 14 Complex SHRP Shear Modulus Measurements and Duncan’s Pairwise Comparison at 10Hz Cyclic Frequency across Test Temperatures Grouped by Radisson Specific Pavement Studies-9A Asphalt Concrete MixTestTemperatureMean ComplexSHRP ShearModulus(MPa)Mean ComplexSHRP ShearModulusCoefficient <strong>of</strong>Variation(Percent)Duncan's Grouping*4°C 1981.779 15.56 A20°C 526.286 14.97 B40°C 209.170 33.90 CMean 905.745 21.48* Test temperatures with same letter are not significantly different.Tables 15 and 16 summarize the mean complex SHRP shear phase angle measurements at 10 Hz cyclicfrequency across the Radisson SPS-9A <strong>asphalt</strong> <strong>concrete</strong> mixes and test temperatures, respectively. Astatistical analysis was performed at a 95 percent confidence level to evaluate the statistical significance<strong>of</strong> the mean SHRP shear phase angle measurements at 10 Hz cyclic frequency across the Radisson SPS-9A <strong>asphalt</strong> <strong>concrete</strong> mixes and test temperatures employed in the analysis. A two-way analysis <strong>of</strong>variance concluded that Radisson SPS-9A <strong>asphalt</strong> <strong>concrete</strong> mix type and test temperature had asignificant effect on the mean SHRP shear phase angle measurements. However, the interaction effectsbetween Radisson SPS-9A <strong>asphalt</strong> <strong>concrete</strong> mix type and test temperature was found not to have asignificant effect on the mean SHRP shear phase angle measurements. Duncan's pairwise <strong>comparison</strong> <strong>of</strong>the mean SHRP shear phase angle measurements at 10 Hz cyclic frequency for each Radisson SPS-9A<strong>asphalt</strong> <strong>concrete</strong> mix grouped by test temperature determined that: mixes 900901, 900903, 900959,900960, and 900961 were not significantly different; and mixes 900902 and 900962 were notsignificantly different. Duncan's pairwise <strong>comparison</strong> <strong>of</strong> the mean SHRP shear phase anglemeasurements at 10 Hz cyclic frequency across test temperatures grouped by Radisson SPS-9A <strong>asphalt</strong>
BERTHELOT, CROCKFORD & LYTTON 15<strong>concrete</strong> mix determined that significant difference existed between the mean SHRP shear phase anglemeasurements at 4°C, 20°C, and 40°C.Table 15 Mean SHRP Shear Phase Angle Measurements and Duncan’s Pairwise Comparison at 10Hz Cyclic Frequency <strong>of</strong> Radisson Specific Pavement Studies -9A Asphalt Concrete Mixes Groupedby Test TemperatureSPS-9A TestSectionMean SHRPShear PhaseAngle(Degrees)Mean SHRPShear PhaseAngleCoefficient <strong>of</strong>Variation(Percent)Duncan's Grouping *900901 50.99 3.02 A900902 44.58 9.22 B900903 52.27 4.43 A900959 49.76 9.74 A900960 51.27 5.24 A900961 51.58 3.21 A900962 45.57 2.21 BMean 49.43 5.30* Asphalt <strong>concrete</strong> mixes with same letter are not significantly different.Table 16 Mean SHRP Shear Phase Angle Measurements and Duncan’s Pairwise Comparison at 10Hz Cyclic Frequency across Test Temperatures Grouped by Radisson Specific Pavement Studies -9A Asphalt Concrete MixTestTemperatureMean SHRPShear PhaseAngle(Degrees)Mean SHRPShear PhaseAngleCoefficient <strong>of</strong>Variation(Percent)Duncan's Grouping*4°C 33.97 4.19 A20°C 53.99 3.88 B40°C 60.33 7.82 CMean 49.43 5.30* Test temperatures with same letter are not significantly different.4.4.5 SHRP Repeated Shear at Constant Stress Ratio CharacterizationThe SHRP repeated shear at constant stress ratio test employs the SHRP shear tester to characterize therelative potential for <strong>asphalt</strong> <strong>concrete</strong> mixes to exhibit tertiary creep under repeated loads. SHRP repeatedshear at constant stress ratio <strong>characterization</strong> was performed at the permanent deformation effectivetemperature (T effectivePD ) <strong>of</strong> 40°C at 98 percent reliability. SHRP repeated shear at constant stress ratiotesting was performed on triplicate gyratory compacted samples at seven percent air voids and wascontinued for 20,000 load cycles or until the accumulated strain reached five percent. Figure 4 illustratesthe cumulative SHRP shear strain measurements across the Radisson SPS-9A <strong>asphalt</strong> <strong>concrete</strong> mixes. Asseen in Figure 4, none <strong>of</strong> the Radisson SPS-9A <strong>asphalt</strong> <strong>concrete</strong> mixes exhibited tertiary creep at the end<strong>of</strong> 20,000 load cycles.
BERTHELOT, CROCKFORD & LYTTON 16Table 17 summarizes the cumulative repeated shear strain at 20,000 load cycles <strong>of</strong> the Radisson SPS-9A<strong>asphalt</strong> <strong>concrete</strong> mixes. A statistical analysis was performed at a 95 percent confidence level to evaluatethe significance <strong>of</strong> the cumulative shear strain measurements at 20,000 load cycles across the RadissonSPS-9A <strong>asphalt</strong> <strong>concrete</strong> mixes. A one-way analysis <strong>of</strong> variance concluded that Radisson SPS-9A <strong>asphalt</strong><strong>concrete</strong> mix type had a significant effect on the mean cumulative shear strain measurements at 20,000load cycles. Duncan's pairwise <strong>comparison</strong> determined that the mean cumulative shear strainmeasurements at 20,000 load cycles <strong>of</strong> mix 900961 was significantly different from all other mixes;however, mixes 900901, 900903, 900959, and 900960 were not significantly different; mixes 900903,900959, 900960, and 900962 were not significantly different; and mixes 900902, 900959, 900960, and900962 were not significantly different.Cumulative Shear Strain (mm/mm)0.0500.0450.0400.0350.0300.0250.0200.0150.0100.0050.0000 2000 4000 6000 8000 10000 12000 14000 16000 18000 20000Load Cycles900901 900902 900903 900959 900960 900961 900962Figure 4 Cumulative SHRP Repeated Shear Strain versus Number <strong>of</strong> Load Cycles <strong>of</strong> RadissonSpecific Pavement Studies -9A Asphalt Concrete Mixes
BERTHELOT, CROCKFORD & LYTTON 17Table 17 SHRP Repeated Shear Measurements and Duncan's Pairwise Comparison <strong>of</strong> CumulativeShear Strain at 20,000 Load Cycles across Radisson Specific Pavement Studies -9A AsphaltConcrete MixesSPS-9A TestSectionMean SHRPRepeated Shearat CSRCumulativeStrain(mm/mm)SHRPRepeated Shearat CSRCumulativeStrainCoefficient <strong>of</strong>Variation(Percent)Duncan's Grouping*900901 0.028803 22.01 B900902 0.002730 67.35 D900903 0.021173 34.84 B C900959 0.015782 27.81 B C D900960 0.014654 33.01 B C D900961 0.046602 42.95 A900962 0.009083 14.59 C DMean 0.019832 34.65* Asphalt <strong>concrete</strong> mixes with same letter are not significantly different. CSR = Constant Stress RatioAlthough the SHRP shear tester is a highly capable <strong>characterization</strong> apparatus designed to independentlycontrol axial, confinement, and shear tractions, several limitations were found to exist in the SHRP sheartester and the Superpave TM shear testing protocols as specified in AASHTO TP7. The coefficient <strong>of</strong>variation <strong>of</strong> the SHRP shear tester measurements was significantly higher than the phenomenological andrapid triaxial test methods. The SHRP shear tester is expensive to own and operate, and the shear testingprotocols are quite sophisticated, rendering it impractical for use by most public road authorities, roadcontractors, road consultants, and materials suppliers. In addition, sample preparation requires samplesaw cutting and gluing end platens which is time consuming and not conducive to production testing.This research also found problems in regards to several samples failing during SHRP frequency sweepshear testing as illustrated in Figure 5.Another limitation to the SHRP Level III shear testing protocols outlined in AASHTO TP7 is thespecified three unique applied tractions and concomitant test temperatures. As a result, the non-linearstress sensitivity and temperature sensitivity <strong>of</strong> <strong>asphalt</strong> <strong>concrete</strong> mixes cannot be directly andindependently characterized using the current Superpave TM shear tester protocols.
BERTHELOT, CROCKFORD & LYTTON 18Figure 5 Failed SHRP Shear Test Sample4.5 Rapid Triaxial CharacterizationTriaxial testing has been used by the road industry to characterize all types <strong>of</strong> road materials [26, 27].However, drawbacks to traditional triaxial test apparatus include: limited stress state and test temperaturetesting capabilities; sample preparation and instrumentation is time consuming and therefore, notconducive to production testing; limited feedback control capabilities; limited dynamic testingcapabilities; and direct measurement <strong>of</strong> Poisson’s ratio is difficult. To overcome these drawbacks, thisstudy employed a new prototype full feedback controlled rapid triaxial test apparatus shown in Figure 6 tocharacterize the Radisson SPS-9A <strong>asphalt</strong> <strong>concrete</strong> mixes.Dynamic frequency sweep testing for characterizing road materials and is standardized in ASTM D3497.The real and imaginary components <strong>of</strong> the complex modulus may be expressed as:E *= E' + iE"where: E* = complex stiffness modulus (Pa)E’ = real component <strong>of</strong> stiffness modulus (Pa)E” = imaginary component <strong>of</strong> stiffness modulus (Pa)
BERTHELOT, CROCKFORD & LYTTON 19Figure 6 Rapid Triaxial TesterThe applied traction waveform and strain response <strong>of</strong> a dynamic frequency sweep test may be expressedas:iωt() t = eT11 T 11pεi( t )11 ( t)ω −φ= ε11pewhere: T 11 (t) = time dependent boundary traction in X 1 coordinate direction (Pa)T 11p = peak applied boundary traction in X 1 coordinate direction (Pa)ε11 (t) = time dependent axial strain response in X1 coordinate directionε11p= peak axial strain response in X1 coordinate directionω = angular load frequency (radians per second)t = load period (seconds)φ = phase angle (radians)By substitution, the complex modulus <strong>of</strong> a time dependent material may be expressed as:E * =T11P(t)ε11P(t)=εiωtT11pei(ωt−φ)11p e
BERTHELOT, CROCKFORD & LYTTON 20For an elastic material, strain response is instantaneous with the applied traction, therefore, the dynamicelastic modulus may be expressed as the absolute value <strong>of</strong> the complex modulus:*E D = E=T11pε11pIn addition to axial deformations, four radial LVDT’s were used to monitor radial deformations andPoisson’s ratio was measured directly as the ratio <strong>of</strong> the lateral and uniaxial strain.ν11()t =ε−ε2211() t() t=ε−ε3311() t() twhere:ν 11 = Poisson’s ratio in Xε 11ε 22ε 331 coordinate direction= strain in X1 coordinate direction= strain in X2 coordinate direction= strain in X3 coordinate directionTriaxial frequency sweep testing was performed at three fully reversed compression-extension boundarytractions illustrated in Figure 7; test temperatures <strong>of</strong> 4°C, 20°C, 40°C, 70°C, and 100°C; and loadfrequencies <strong>of</strong> 0.1 Hz, 1.0 Hz, 5.0 Hz, 10.0 Hz. However, since the Radisson SPS-9A test site is locatedon Highway 16, detailed analysis <strong>of</strong> the triaxial frequency sweep data analysis presented herein wasrestricted to compressive data at stress state three and 10 Hz cyclic frequency as illustrated in Figure 7.However, it should be noted that statistical differences were found to exist across all triaxialmeasurements at all stress states and cyclic frequencies-.Tables 18 and 19 summarize the triaxial complex compression modulus measurements at 10 Hz cyclicfrequency and stress state three across the Radisson SPS-9A <strong>asphalt</strong> <strong>concrete</strong> mixes and test temperaturesrespectively. A two-way analysis <strong>of</strong> variance concluded that Radisson SPS-9A <strong>asphalt</strong> <strong>concrete</strong> mix type,test temperature and the interaction effects <strong>of</strong> Radisson SPS-9A <strong>asphalt</strong> <strong>concrete</strong> mix type and testtemperature had a significant effect on the mean triaxial complex compression modulus measurements atstress state three and 10 Hz cyclic frequency. Duncan's pairwise <strong>comparison</strong> <strong>of</strong> the mean triaxial complexcompression modulus measurements at stress state three and 10 Hz cyclic frequency <strong>of</strong> the Radisson SPS-9A <strong>asphalt</strong> <strong>concrete</strong> mixes grouped by test temperature determined that: mixes 900959, 900901, and900962 were significantly different from all other mixes; however, mixes 900902 and 900903 and mixes900902, 900960, and 900961 were not significantly different. Duncan's pairwise <strong>comparison</strong> <strong>of</strong> the meantriaxial complex compression modulus at stress state three and 10 Hz cyclic frequency across the testtemperatures grouped by Radisson SPS-9A <strong>asphalt</strong> <strong>concrete</strong> mix type determined that the mean triaxialcompression modulus measurements at 5°C, 20°C, 40°C, 70°C, and 100°C were significantly different.
BERTHELOT, CROCKFORD & LYTTON 21Applied Boundary Tractions (kPa)2501505045025050650350T 11:pT 11:250/50 T22 =T 33:150Stress State 1T 22 =T 33:q• • •Stress State 2time (sec)T 11:450/50T 22 =T 33:250Stress State 3T 11:650/50T22=T 33:350• • •time (sec)• • •50time (sec)Figure 7 Triaxial Compression-Extension Frequency Sweep Boundary TractionsTable 18 Mean Triaxial Complex Compression Modulus and Duncan's Pairwise Comparison atStress State Three and 10 Hz Cyclic Frequency <strong>of</strong> Radisson Specific Pavement Studies -9A AsphaltConcrete Mixes Grouped by Test TemperatureSPS-9A TestSectionMean TriaxialComplexCompressionModulus(MPa)Mean TriaxialComplexCompressionModulusCoefficient <strong>of</strong>Variation(Percent)Duncan's Grouping *900901 1245.862 6.46 B900902 1150.703 7.92 C D900903 1178.431 4.96 C900959 1325.216 5.97 A900960 1121.963 5.26 D900961 1117.473 5.17 D900962 941.386 5.96 EMean 1154.429 5.96* Asphalt <strong>concrete</strong> mixes with same letter are not significantly different.
BERTHELOT, CROCKFORD & LYTTON 22Table 19 Mean Triaxial Complex Compression Modulus and Duncan's Pairwise Comparison atStress State Three and 10 Hz Cyclic Frequency across Test Temperatures Grouped by RadissonSpecific Pavement Studies -9A Asphalt Concrete MixTestTemperatureMean TriaxialComplexCompressionModulus(MPa)Mean TriaxialComplexCompressionModulusCoefficient <strong>of</strong>Variation(Percent)Duncan's Grouping *5°C 2460.274 3.51 A20°C 1938.216 4.31 B40°C 721.486 7.70 C70°C 376.704 5.19 D100°C 275.466 9.07 EMean 1154.429 5.96* Test temperatures with same letter are not significantly different.Tables 20 and 21 summarize the triaxial compression Poisson’s ratio measurements at 10 Hz cyclicfrequency and stress state three across the Radisson SPS-9A <strong>asphalt</strong> <strong>concrete</strong> mixes and test temperaturesrespectively. A two-way analysis <strong>of</strong> variance concluded that Radisson SPS-9A <strong>asphalt</strong> <strong>concrete</strong> mixtype, test temperature and the interaction effects <strong>of</strong> Radisson SPS-9A mix type and test temperature had asignificant effect on the mean triaxial compression Poisson's ratio measurements at stress state three and10 Hz cyclic frequency. Duncan's pairwise <strong>comparison</strong> <strong>of</strong> the mean triaxial compression Poisson's ratiomeasurements at stress state three and 10 Hz cyclic frequency across the Radisson SPS-9A <strong>asphalt</strong><strong>concrete</strong> mixes grouped by test temperature determined that: mixes 900901 and 900961 were notsignificantly different; mixes 900902, 900903, and 900960 were not significantly different; and mixes900959 and 900962 were not significantly different. Duncan's pairwise <strong>comparison</strong> <strong>of</strong> the mean triaxialcompression Poisson's ratio measurements at stress state three and 10 Hz cyclic frequency across the testtemperatures grouped by Radisson SPS-9A <strong>asphalt</strong> <strong>concrete</strong> mix determined that the mean triaxialcompression Poisson’s ratio measurements at 5°C, 20°C, 40°C, 70°C, and 100°C were significantlydifferentTables 22 and 23 summarize the triaxial phase angle measurements at 10 Hz cyclic frequency and stressstate three across the Radisson SPS-9A <strong>asphalt</strong> <strong>concrete</strong> mixes and test temperatures respectively. Atwo-way analysis <strong>of</strong> variance concluded that Radisson SPS-9A <strong>asphalt</strong> <strong>concrete</strong> mix type, testtemperature and the interaction effects <strong>of</strong> Radisson SPS-9A <strong>asphalt</strong> <strong>concrete</strong> mix type and testtemperature had a significant effect on the mean triaxial phase angle measurements at stress state threeand 10 Hz cyclic frequency. Duncan's pairwise <strong>comparison</strong> <strong>of</strong> the mean triaxial phase anglemeasurements at stress state three and 10 Hz cyclic frequency <strong>of</strong> the Radisson SPS-9A <strong>asphalt</strong> <strong>concrete</strong>mixes grouped by test temperature determined that: mixes 900961, 900901, 900960 and 900959 weresignificantly different from all other mixes; however, mixes 900903 and 900962 were not significantlydifferent; and mixes 900902 and 900903 were not significantly different. Duncan's pairwise <strong>comparison</strong><strong>of</strong> the mean triaxial phase angle measurements at stress state three and 10 Hz cyclic frequency across thetest temperatures grouped by Radisson SPS-9A <strong>asphalt</strong> <strong>concrete</strong> mix determined that the mean triaxialphase angle measurements at 5°C, 20°C, 40°C, 70°C, and 100°C were significantly different.
BERTHELOT, CROCKFORD & LYTTON 23Table 20 Mean Triaxial Compression Poisson's Ratio and Duncan's Pairwise Comparison at StressState Three and at 10 Hz Cyclic Frequency <strong>of</strong> Radisson Specific Pavement Studies -9A AsphaltConcrete Mixes Grouped by Test TemperatureSPS-9A TestSectionMean TriaxialCompressionPoisson's RatioMean TriaxialCompressionPoisson's RatioCoefficient <strong>of</strong>Variation(Percent)Duncan's Grouping*900901 0.265 4.42 A900902 0.224 15.01 B900903 0.232 22.20 B900959 0.177 23.34 C900960 0.221 9.49 B900961 0.267 15.37 A900962 0.193 14.75 CMean 0.226 14.94* Asphalt <strong>concrete</strong> mixes with same letter are not significantly different.Table 21 Mean Triaxial Compression Poisson's Ratio and Duncan's Pairwise Comparison at StressState Three and 10 Hz Cyclic Frequency across Test Temperatures Grouped by Radisson SpecificPavement Studies -9A Asphalt Concrete MixTestTemperatureMean TriaxialCompressionPoisson's RatioMean TriaxialComplexCompressionPoisson’s RatioCoefficient <strong>of</strong>Variation(Percent)Duncan's Grouping *5°C 0.045 42.74 E20°C 0.166 9.32 D40°C 0.303 7.51 B70°C 0.269 6.59 C100°C 0.344 8.55 AMean 0.226 14.94* Test temperatures with same letter are not significantly different.
BERTHELOT, CROCKFORD & LYTTON 24Table 22 Mean Triaxial Phase Angle and Duncan's Pairwise Comparison at Stress State Three andat 10 Hz Cyclic Frequency <strong>of</strong> Radisson Specific Pavement Studies -9A Asphalt Concrete MixesGrouped by Test TemperatureSPS-9A TestSectionMean TriaxialPhase Angle(Degrees)Mean TriaxialPhase AngleCoefficient <strong>of</strong>Variation(Percent)Duncan's Grouping*900901 16.81 6.20 B900902 14.71 3.89 E900903 15.02 3.45 D E900959 14.06 3.17 F900960 16.05 4.32 C900961 17.76 1.87 A900962 15.39 5.60 DMean 15.69 4.07* Asphalt <strong>concrete</strong> mixes with same letter are not significantly different.Table 23 Mean Triaxial Phase Angle and Duncan's Pairwise Comparison at Stress State Three andat 10 Hz Cyclic Frequency across Test Temperatures Grouped by Radisson Specific PavementStudies -9A Asphalt Concrete MixTestTemperatureMean TriaxialPhase Angle(Degrees)Mean TriaxialPhase AngleCoefficient <strong>of</strong>Variation(Percent)Duncan's Grouping *5°C 7.63 7.16 E20°C 14.73 3.46 D40°C 19.67 4.19 A70°C 18.48 2.35 B100°C 17.93 3.20 CMean 15.69 4.07* Test temperatures with same letter are not significantly different.In the past, triaxial testing <strong>of</strong> road materials has specified a 2:1 sample height to diameter dimensionalratio. One <strong>of</strong> the benefits to the rapid triaxial tester employed in this study is that it characterizes 150 mmtall by 150 mm diameter SHRP specified gyratory compacted samples without the need for sampletrimming, gluing end platens to the sample, or attaching membranes to the sample. This greatly decreasessample preparation and testing time. In addition, since end platens do not have to be glued to the samples,spatial stress/strain gradients and end shear effects are reduced. The ability to mechanisticallycharacterize 150 mm diameter by 150 mm tall gyratory compacted samples is beneficial given the roadindustry’s adoption <strong>of</strong> the SHRP gyratory compactor for laboratory compaction <strong>of</strong> <strong>asphalt</strong> <strong>concrete</strong>. Therapid triaxial tester could therefore, be employed as a complementary mechanistic <strong>characterization</strong> tool tothe SHRP gyratory compactor for <strong>asphalt</strong> <strong>concrete</strong> mix design and analysis such as the Superpave TM LevelI system. The rapid triaxial tester has also been demonstrated in the field for production testingapplications such as construction quality control/quality assurance [28].
BERTHELOT, CROCKFORD & LYTTON 25This research found the rapid triaxial tester to be capable <strong>of</strong> characterizing the fundamentalthermomechanical constitutive behavior <strong>of</strong> <strong>asphalt</strong> <strong>concrete</strong> mixes required for mechanistic roadmodelingapplications. The rapid triaxial tester distinguished significant differences in the compressionmodulus, compression Poisson’s ratio, and phase angle among the Radisson SPS-9A <strong>asphalt</strong> <strong>concrete</strong>mixes across load frequencies, stress states and test temperatures. The rapid triaxial compressive complexmodulus, Poisson’s ratio and phase angle can be mathematically transformed to provide linearviscoelastic materials constitutive relations that can be input into viscoelastic road models to directlypredict permanent deformation <strong>of</strong> road structures. As a result, the ability to accurately measureviscoelastic constitutive properties under stress states, temperatures and load frequencies representative <strong>of</strong>those in the field may pose significant promise for reliably predicting <strong>rut</strong>ting behavior <strong>of</strong> <strong>asphalt</strong> <strong>concrete</strong>pavements.5.0 COMPARITIVE ANALYSISGood repeatability and accuracy <strong>of</strong> <strong>characterization</strong> results is essential for materials specification androad-modeling purposes. Figure 8 illustrates the mean coefficient <strong>of</strong> variation obtained from each <strong>asphalt</strong><strong>concrete</strong> <strong>characterization</strong> method from triplicate test samples grouped by SPS-9A <strong>asphalt</strong> <strong>concrete</strong> mix,stress state, and test temperature.As seen in Figure 8, the coefficient <strong>of</strong> variation <strong>of</strong> the traditional phenomenological and rapid triaxial<strong>characterization</strong> methods was relatively low. However, the SHRP Level III shear <strong>characterization</strong> and therapid triaxial compression Poisson’s ratio produced a relatively high coefficient <strong>of</strong> variation with theexception <strong>of</strong> the SHRP shear phase angle measurements. Given that the operator <strong>of</strong> the SHRP shear testerin this research had considerable materials testing experience with complex feedback control systems andthat system control problems with the SHRP shear tester could not be detected through detailed and timeconsuming system diagnostics, the high coefficient <strong>of</strong> variation could only be attributed to experimentalerror. It is believed that the relatively short 50 mm sample height may have had a significant influence inthe high variability <strong>of</strong> the SHRP shear tester measurements as witnessed in the high number <strong>of</strong> samplesthat failed during SHRP shear testing.This study found the coefficient <strong>of</strong> variation <strong>of</strong> the rapid triaxial compression Poisson’s ratiomeasurements to be slightly higher than the other rapid triaxial measurements Since the rapid triaxialtester radial transducer instrumentation was not designed for testing at 5°C and 20°C, the Poisson’s ratiomeasurement coefficient <strong>of</strong> variation at 5°C and 20°C were found to be higher than at other temperatures.As a result, the high coefficient <strong>of</strong> variation in the rapid triaxial Poisson’s ratio measurements can beremedied by employing more sensitive linear variable differential transducers at lower temperatures.Figure 9 shows the coefficient <strong>of</strong> variation across the <strong>characterization</strong> methods at the high testtemperatures only. As can be seen, the coefficient <strong>of</strong> variation <strong>of</strong> the rapid triaxial compressive Poisson’sratio decreased significantly when the cold test temperature was excluded from the analysis. However,the coefficient <strong>of</strong> variation <strong>of</strong> the SHRP shear modulus obtained form the frequency sweep shear testincreased significantly, further illustrating the uncertainty in the shear modulus measurements at hightemperature across the Radisson SPS-9A <strong>asphalt</strong> <strong>concrete</strong> mixes.Table 24 summarizes the mean observed <strong>rut</strong> measurements taken with a 1.5 m <strong>rut</strong> bar <strong>of</strong> the RadissonSPS-9A test sections after three years <strong>of</strong> service. As can be seen in Table 24, the coefficient <strong>of</strong> variation<strong>of</strong> the 1.5 m straight edge <strong>rut</strong> depth measurements across the SPS-9A <strong>asphalt</strong> <strong>concrete</strong> mixes relativelyhigh.
BERTHELOT, CROCKFORD & LYTTON 2650Coefficient <strong>of</strong> Variation (%)454035302520151050Marshall FlowMarshall StabilityHv eem StabilityUnconfined Compressive StrengthSHRP Bulk ModulusSHRP Constrained Compression ModulusTriaxial Compression ModulusSHRP Total Simple Shear StrainSHRP Complex Shear ModulusSHRP Shear Phase AngleSHRP RSCSR Cumulative StrainSHRP RSCSR Cumulative Strain RateTriaxial Extension ModulusTriaxial Compression Poisson's RatioTriaxial Extension Poisson's RatioTriaxial Phase AngleFigure 8 Asphalt Concrete Characterization Coefficient <strong>of</strong> Variation <strong>of</strong> Characterization MethodsGrouped by Radisson Specific Pavement Studies-9A Asphalt Concrete Mix, Stress State and TestTemperatureTable 24 Mean Rut Measurements in Radisson Specific Pavement Studies -9A Test Sections afterThree Years <strong>of</strong> ServiceSPS-9A TestSectionMean RutMeasurementsUsing 1.5 m RutBar (mm)RutMeasurementsCoefficient <strong>of</strong>Variation Using1.5 m Rut Bar(Percent)900901 4.3 29.65900902 5.9 23.45900903 4.9 22.78900959 3.5 30.65900960 5.4 16.85900961 7.3 23.31900962 3.4 30.31Mean 5.0 25.29
BERTHELOT, CROCKFORD & LYTTON 2750Coefficient <strong>of</strong> Variation (%)454035302520151050Marshall StabilityMarshall FlowHveem StabilityUnconfined Compressive StrengthSHRP Bulk ModulusSHRP Total Simple Shear StrainSHRP Complex Shear ModulusSHRP Shear Phase AngleSHRP Constrained Compression ModulusSHRP RSCSR Cumulative StrainSHRP RSCSR Cumulative Strain RateTriaxial Compression ModulusTriaxial Extension ModulusTriaxial Compression Poisson's RatioTriaxial Extension Poisson's RatioTriaxial Phase AngleFigure 9 Asphalt Concrete Characterization Coefficient <strong>of</strong> Variation <strong>of</strong> Characterization MethodsGrouped by Radisson Specific Pavement Studies-9A Asphalt Concrete Mix, Stress State and HighTest TemperatureTable 25 summarizes the Duncan’s pairwise <strong>comparison</strong> results <strong>of</strong> the <strong>alternative</strong> <strong>asphalt</strong> <strong>concrete</strong><strong>characterization</strong> methods. As can be seen in Table and 25, the rapid triaxial tester best ranked the relative<strong>rut</strong>ting behavior <strong>of</strong> the Radisson SPS-9A <strong>asphalt</strong> <strong>concrete</strong> mixes with the exception <strong>of</strong> mixes 900902 and900962 which appear to be reversed in order.
BERTHELOT, CROCKFORD & LYTTON 28Table 25 Characterization Method Duncan's Pairwise Comparison <strong>of</strong> Radisson Specific PavementStudies -9A Asphalt Concrete MixesRANKING [Duncan's Pairwise Comparison]MIX PROPERTIES 1 2 3 4 5 6 7Marshall Stability 900901[C]900961[C]900903[B,C]900960[B]900959[A]900902[A]900962[A]Marshall Flow 900901[C]900961[C]900902[B,C]900903[B,C]900960[B,C]900959[A,B]900962[A]Hveem Stability 900901[D]Unconfined Compressive Strength 900962[D]SHRP Bulk Modulus 900961[C]SHRP Constrained Modulus 900901[C]SHRP Total Simple Shear Strain 900902[D]SHRP Complex Shear Modulus at 10Hz900961[B]SHRP Shear Phase Angle at 10 Hz 900902[B]SHRP RSCSR Shear Strain at 20000CyclesTriaxial Complex CompressionModulus at 10 Hz and SS3Triaxial Compression Poisson’s Ratioat 10 Hz and SS3Triaxial Phase Angle at 10 Hz andSS3Mean Field Rutting After ThreeYears Service {mm}900902[D]900962[E]900959[C]900959[F]900961{7.3}SHRP = Strategic Highway Research ProgramRSCSR = Repeated Shear at Constant Stress RatioSS3 = Stress State Three900961[C,D]900961[C]900959[B,C]900902[B,C]900959[C]900962[B]900962[B]900962[C,D]900961[D]900962[C]900902[E]900902{5.9}900959[C]900902[B,C]900901[A,B,C]900960[B,C]900962[C]900960[B]900959[A]900960[B,C,D]900960[D]900960[B]900903[D,E]900960{5.4}900903[C]900901[B,C]900962[A,B,C]900962[B,C]900960[B,C]900901[B]900901[A]900959[B,C,D]900902[C,D]900902[B]900962[D]900903{4.9}900960[B]900903[B,C]900903[A,B,C]900903[A,B]900901[B,C]900903[B]900960[A]900903[B,C]900903[C]900903[B]900960[C]900901{4.3}900962[B]900960[B]900902[A,B]900959[A]900903[B]900959[B]900961[A]900901[B]900901[B]900901[A]900901[B]900959{3.5}900902[A]900959[A]900960[A]900961[A]900961[A]900902[A]900903[A]900961[A]900959[A]900961[A]900961[A]900962{3.4}6.0 SUMMARY AND CONCLUSIONSThis study sought to investigate <strong>alternative</strong> methods for characterizing the <strong>rut</strong>ting behavior <strong>of</strong> <strong>asphalt</strong><strong>concrete</strong> mixes that can be used for material specifications and road modeling Seven Specific PavementStudies-9A <strong>asphalt</strong> <strong>concrete</strong> mixes (two Marshall and five Superpave TM ) built at the Radisson SPS-9A testsite were characterized with respect to Marshall stability and flow, Hveem stability, unconfinedcompressive strength, SHRP Level III shear tester, and triaxial frequency sweep properties. Thecoefficient <strong>of</strong> variation <strong>of</strong> the traditional phenomenological and rapid triaxial <strong>characterization</strong> methodswas relatively low. However, the SHRP Level III shear <strong>characterization</strong> produced a relatively high
BERTHELOT, CROCKFORD & LYTTON 29coefficient <strong>of</strong> variation with the exception <strong>of</strong> the SHRP shear phase angle measurements. The highcoefficient <strong>of</strong> variation could only be attributed to experimental error. It is believed that the relativelyshort 50 mm sample height may have had a significant influence in the high variability <strong>of</strong> the SHRP sheartester measurements as witnessed in the high number <strong>of</strong> samples that failed during SHRP shear testing.This study determined that traditional phenomenological <strong>asphalt</strong> <strong>concrete</strong> <strong>characterization</strong> methodsdistinguished some significant differences between the Radisson SPS-9A <strong>asphalt</strong> <strong>concrete</strong> mixes.However, they did not provide material constitutive relations necessary for mechanistic road responsemodeling. The SHRP shear tester also distinguished some significant differences between the <strong>asphalt</strong><strong>concrete</strong> mixes and can provide material constitutive relations necessary for mechanistic road responsemodeling. However, the SHRP shear tester is expensive to own and operate, produces relatively highvariability, and was found to be impractical for use by most public road authorities, road consultants, androad contractors. The rapid triaxial tester determined the most significant difference between the <strong>asphalt</strong><strong>concrete</strong> mixes and was found to be an efficient mechanistic testing apparatus to complement the SHRPgyratory compactor. The measured materials properties obtained from the rapid triaxial tester were als<strong>of</strong>ound to best correlate predict correlate with the relative <strong>rut</strong>ting behavior <strong>of</strong> the SPS-9A test sections afterthree years <strong>of</strong> service. The complex properties measured by the rapid triaxial tester could bemathematically transformed into linear viscoelastic constitutive relations which could be used forviscoelastic mechanistic road modeling. This ability to accurately measure viscoelastic constitutiveproperties under stress states, temperatures and load frequencies representative <strong>of</strong> those in the field maypose significant promise for reliably predicting <strong>rut</strong>ting behavior <strong>of</strong> <strong>asphalt</strong> <strong>concrete</strong> pavements.DISCLAIMERThe viewpoints expressed herein are those <strong>of</strong> the authors, and are not necessarily endorsed by theagencies involved with this research.7.0 REFERENCES1. University <strong>of</strong> Illinois at Urbana-Champaign Construction Technology Laboratories. "CalibratedMechanistic Structural Analysis Procedures for Pavements" NCHRP 1-26 Final Report, Champaign,Illinois, (1990).2. Von Quintas H. "Development <strong>of</strong> Asphalt-Aggregate Mixture Analysis System: AAMAS" FinalReport, NCHRP 9-6(1), Washington, DC, (1989).3. Fernando E,, Lytton R. "Demonstration <strong>of</strong> Potential Benefits <strong>of</strong> Performance-Oriented Specifications"Transportation Research Record 1353, TRB, National Research Council, Washington, DC, 73-81(1992).4. Anderson D. "Performance Related Specification for Hot Mix Asphalt Concrete" Final Report,NCHRP 10-26A. Pennsylvania Transportation Institute, Pennsylvania State University, UniversityPark (1990).5. Uzan J, Zollinger D, Lytton R. "Mechanistic/Empirical Model for the Structural Design <strong>of</strong> FlexiblePavements" Report No. 455-1. FHWA. Texas Transportation Institute, The Texas A&M UniversitySystem, College Station (1991).6. Little D, Youssef H. "Improved ACP Mixture Design: Development and Verification" Report 1170–1F. Texas Transportation Institute, The Texas A&M University System, College Station, (1992).
BERTHELOT, CROCKFORD & LYTTON 307. Lui M. "Numerical Prediction <strong>of</strong> Pavement Distresses with Geotechnical Constitutive Laws" Ph.D.dissertation. Texas A&M University, College Station (1993).8. Walker RN, Patterson WDO, Freeme CR, Marais CP. "The South African Mechanistic PavementDesign Procedure" Proceedings, Fourth International Conference on the Structural Design <strong>of</strong> AsphaltPavements, University <strong>of</strong> Michigan, 26-31 (1977).9. Maree JH Freeme CR. "The Mechanistic Design Method to Evaluate the Pavement Structures in theCatalogue <strong>of</strong> the Draft TR H4 1980" Technical Report RP/2/81. NITRR, Pretoria, South Africa, 59(1981).10. Freeme CR, Maree JH, Viljoen AW. "Mechanistic Design <strong>of</strong> Asphalt Pavements and VerificationUsing Heavy Vehicle Simulation" Proceedings, Fifth International Conference on the StructuralDesign <strong>of</strong> Asphalt Pavements, University <strong>of</strong> Michigan and Delft University <strong>of</strong> Technology156-173(1982).11. Brown SF, Pell PS, Stock AF. "The Application <strong>of</strong> Simplified, Fundamental Design Procedures forFlexible Pavements" Proceedings, Fourth International Conference on the Structural Design <strong>of</strong>Asphalt Pavements, University <strong>of</strong> Michigan, 227-241 (1977).12. Verstraeten J, Veverka V, Francken l. "Rational and Practical Designs <strong>of</strong> Asphalt Pavements toAvoid Cracking and Rutting" Proceedings, Fifth International Conference on the Structural Design <strong>of</strong>Asphalt Pavements, University <strong>of</strong> Michigan and Delft University <strong>of</strong> Technology 45-58 (1982).13. Thompson MR, Barenberg EJ. "Calibrated Mechanistic Structural Analysis Procedures forPavements: Phase I - Final Report". NCHRP Project 1-26, Transportation Research Board, NationalResearch Council, Washington, DC, March (1989).14. Monismith CL, Epps JA, Finn FN. "Improved Asphalt Mix Design" Proceedings, Association <strong>of</strong>Asphalt Paving Technologists 347-392 (1985).15. Whiffin AC, Lister NW. "The Application <strong>of</strong> Elastic Theory to Flexible Pavements" Proceedings,International Conference on the Structural Design <strong>of</strong> Asphalt Pavements, University <strong>of</strong> Michigan499-452 (1963).16. Skok EL, Finn FN. "Theoretical Concepts Applied to Asphalt Concrete Pavement Design"Proceedings, International Conference on the Structural Design <strong>of</strong> Asphalt Pavements, University <strong>of</strong>Michigan, 412-440 (1963).17. Peattie KR. "A Fundamental Approach to the Design <strong>of</strong> Flexible Pavements" Proceedings,International Conference on the Structural Design <strong>of</strong> Asphalt Pavements, University <strong>of</strong> Michigan403-411 (1963).18. Dormon GM. "The Extension to Practice <strong>of</strong> a Fundamental Procedure for the Design <strong>of</strong> AsphaltPavements" Proceedings, International Conference on the Structural Design <strong>of</strong> Asphalt Pavements,University <strong>of</strong> Michigan 785-793 (1963).19. Chua k, Lytton R. "A Method <strong>of</strong> Time Dependent Analysis Using Elastic Solutions for NonLinearMaterials" International Journal for Numerical and Analytical Methods in Geomechanics, 421-431(1987).20. Park S, Kim R, Schapery R. "A Viscoelastic Continuum Damage Model and Its Application toUniaxial Behavior <strong>of</strong> Asphalt Concrete" Mechanics <strong>of</strong> Materials, 241-255 (1996).21. Schapery R. "Models for Damage Growth and Fracture in Nonlinear Viscoelastic ParticulateComposites" Proceedings, Ninth U.S. National Congress <strong>of</strong> Applied Mechanics, New York, Book NoH00228, American Society <strong>of</strong> Mechanical Engineers (ASME) 237-245 (1984).22. Allen D. "Thermomechanical Coupling in Inelastic Solids" Applied Mechanics Rev., ASME 361-373 (1991).
BERTHELOT, CROCKFORD & LYTTON 3123. Schapery R. "A Theory <strong>of</strong> Crack Growth in Viscoelastic Media" Office <strong>of</strong> Naval Research TechnicalReport No. 2. Mechanics and Materials Research Center, Texas A&M University, College Station(1973).24. Park S Schapery R. "A Viscoelastic Constitutive Model for Particulate Composites with GrowingDamage" Int. J. Solids Structures 931-947 (1996).25. American Association <strong>of</strong> State Highways and Transportation Officials. "AASHTO ProvisionalStandards" Washington, DC (1995).26. Witzak M, Fonseca O. "A Revised Predictive Model for the Dynamic (Complex) Modulus <strong>of</strong>Asphaltic Mixtures" Presented at the Annual Meeting <strong>of</strong> the Transportation Research Board,Washington, DC (1996).27. Texas Department <strong>of</strong> Transportation. "Manual <strong>of</strong> Testing Procedures", Austin, Texas (1995).28. Berthelot C, Crockford W, White S, Sparks G. "Mechanistic Quality Control/Quality AssuranceEvaluation <strong>of</strong> Saskatchewan SPS-9A Asphalt Mixes" Proceedings, Canadian Technical AsphaltAssociation, Ottawa, 201-227 (1997).