Physiological Science 111L - UCLA
Physiological Science 111L - UCLA
Physiological Science 111L - UCLA

You also want an ePaper? Increase the reach of your titles
YUMPU automatically turns print PDFs into web optimized ePapers that Google loves.
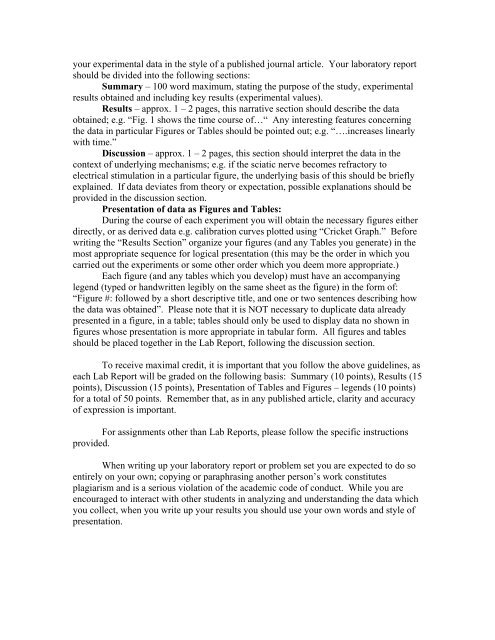
your experimental data in the style of a published journal article. Your laboratory reportshould be divided into the following sections:Summary – 100 word maximum, stating the purpose of the study, experimentalresults obtained and including key results (experimental values).Results – approx. 1 – 2 pages, this narrative section should describe the dataobtained; e.g. “Fig. 1 shows the time course of…“ Any interesting features concerningthe data in particular Figures or Tables should be pointed out; e.g. “….increases linearlywith time.”Discussion – approx. 1 – 2 pages, this section should interpret the data in thecontext of underlying mechanisms; e.g. if the sciatic nerve becomes refractory toelectrical stimulation in a particular figure, the underlying basis of this should be brieflyexplained. If data deviates from theory or expectation, possible explanations should beprovided in the discussion section.Presentation of data as Figures and Tables:During the course of each experiment you will obtain the necessary figures eitherdirectly, or as derived data e.g. calibration curves plotted using “Cricket Graph.” Beforewriting the “Results Section” organize your figures (and any Tables you generate) in themost appropriate sequence for logical presentation (this may be the order in which youcarried out the experiments or some other order which you deem more appropriate.)Each figure (and any tables which you develop) must have an accompanyinglegend (typed or handwritten legibly on the same sheet as the figure) in the form of:“Figure #: followed by a short descriptive title, and one or two sentences describing howthe data was obtained”. Please note that it is NOT necessary to duplicate data alreadypresented in a figure, in a table; tables should only be used to display data no shown infigures whose presentation is more appropriate in tabular form. All figures and tablesshould be placed together in the Lab Report, following the discussion section.To receive maximal credit, it is important that you follow the above guidelines, aseach Lab Report will be graded on the following basis: Summary (10 points), Results (15points), Discussion (15 points), Presentation of Tables and Figures – legends (10 points)for a total of 50 points. Remember that, as in any published article, clarity and accuracyof expression is important.For assignments other than Lab Reports, please follow the specific instructionsprovided.When writing up your laboratory report or problem set you are expected to do soentirely on your own; copying or paraphrasing another person’s work constitutesplagiarism and is a serious violation of the academic code of conduct. While you areencouraged to interact with other students in analyzing and understanding the data whichyou collect, when you write up your results you should use your own words and style ofpresentation.