Split-plot design with covariate
Split-plot design with covariate
Split-plot design with covariate
- No tags were found...

You also want an ePaper? Increase the reach of your titles
YUMPU automatically turns print PDFs into web optimized ePapers that Google loves.
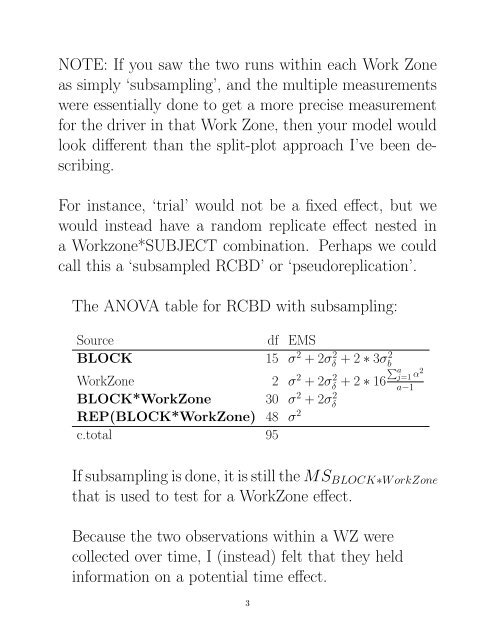
NOTE: If you saw the two runs <strong>with</strong>in each Work Zoneas simply ‘subsampling’, and the multiple measurementswere essentially done to get a more precise measurementfor the driver in that Work Zone, then your model wouldlook different than the split-<strong>plot</strong> approach I’ve been describing.For instance, ‘trial’ would not be a fixed effect, but wewould instead have a random replicate effect nested ina Workzone*SUBJECT combination. Perhaps we couldcall this a ‘subsampled RCBD’ or ‘pseudoreplication’.The ANOVA table for RCBD <strong>with</strong> subsampling:Sourcedf EMSBLOCK15 σ 2 + 2σδ 2 + 2 ∗ 3σ2 ∑baj=1WorkZone 2 σ 2 + 2σδ 2 + 2 ∗ 16 α 2a−1BLOCK*WorkZone 30 σ 2 + 2σδ2REP(BLOCK*WorkZone) 48 σ 2c.total 95If subsampling is done, it is still the MS BLOCK∗W orkZonethat is used to test for a WorkZone effect.Because the two observations <strong>with</strong>in a WZ werecollected over time, I (instead) felt that they heldinformation on a potential time effect.3