Automated Analog Circuit Synthesis using a Linear Representation
Automated Analog Circuit Synthesis using a Linear Representation
Automated Analog Circuit Synthesis using a Linear Representation

You also want an ePaper? Increase the reach of your titles
YUMPU automatically turns print PDFs into web optimized ePapers that Google loves.
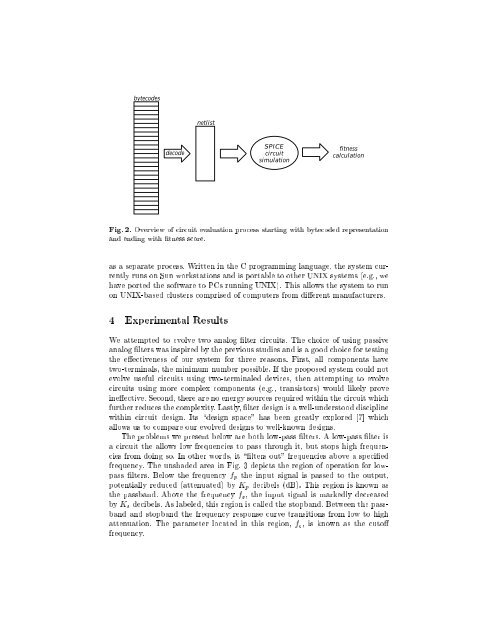
ytecodesnetlistdecodeSPICEcircuitsimulationfitnesscalculationFig. 2. Overview of circuit evaluation process starting with bytecoded representationand ending with tness score.as a separate process. Written in the C programming language, the system currentlyruns on Sun workstations and is portable to other UNIX systems (e.g., wehave ported the software to PCs running UNIX). This allows the system to runon UNIX-based clusters comprised of computers from dierent manufacturers.4 Experimental ResultsWe attempted to evolve twoanalog lter circuits. The choice of <strong>using</strong> passiveanalog lters was inspired by the previous studies and is a good choice for testingthe eectiveness of our system for three reasons. First, all components havetwo-terminals, the minimum number possible. If the proposed system could notevolve useful circuits <strong>using</strong> two-terminaled devices, then attempting to evolvecircuits <strong>using</strong> more complex components (e.g., transistors) would likely proveineective. Second, there are no energy sources required within the circuit whichfurther reduces the complexity. Lastly, lter design is a well-understood disciplinewithin circuit design. Its \design space" has been greatly explored [7] whichallows us to compare our evolved designs to well-known designs.The problems we present below are both low-pass lters. A low-pass lter isa circuit the allows low frequencies to pass through it, but stops high frequenciesfrom doing so. In other words, it \lters out" frequencies above a speciedfrequency. The unshaded area in Fig. 3 depicts the region of operation for lowpasslters. Below the frequency f p the input signal is passed to the output,potentially reduced (attenuated) by K p decibels (dB). This region is known asthe passband. Above the frequency f s , the input signal is markedly decreasedby K s decibels. As labeled, this region is called the stopband. Between the passbandand stopband the frequency response curve transitions from low tohighattenuation. The parameter located in this region, f c , is known as the cutofrequency.