Freshwater Algae: Identification and Use as Bioindicators
Freshwater Algae: Identification and Use as Bioindicators
Freshwater Algae: Identification and Use as Bioindicators

You also want an ePaper? Increase the reach of your titles
YUMPU automatically turns print PDFs into web optimized ePapers that Google loves.
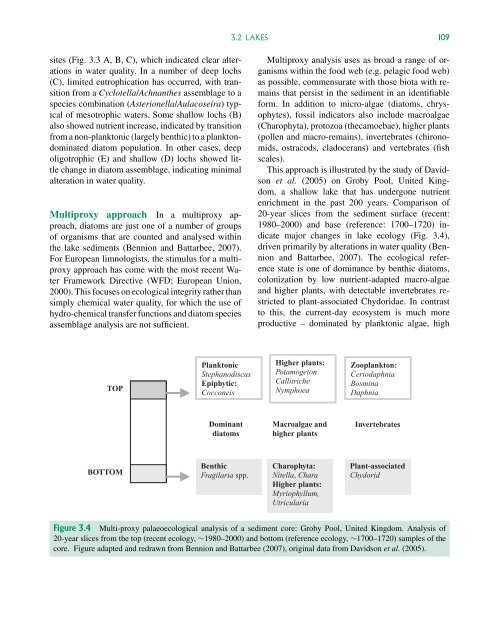
3.2 LAKES 109sites (Fig. 3.3 A, B, C), which indicated clear alterationsin water quality. In a number of deep lochs(C), limited eutrophication h<strong>as</strong> occurred, with transitionfrom a Cyclotella/Achnanthes <strong>as</strong>semblage to <strong>as</strong>pecies combination (Asterionella/Aulacoseira) typicalof mesotrophic waters. Some shallow lochs (B)also showed nutrient incre<strong>as</strong>e, indicated by transitionfrom a non-planktonic (largely benthic) to a planktondominateddiatom population. In other c<strong>as</strong>es, deepoligotrophic (E) <strong>and</strong> shallow (D) lochs showed littlechange in diatom <strong>as</strong>semblage, indicating minimalalteration in water quality.Multiproxy approach In a multiproxy approach,diatoms are just one of a number of groupsof organisms that are counted <strong>and</strong> analysed withinthe lake sediments (Bennion <strong>and</strong> Battarbee, 2007).For European limnologists, the stimulus for a multiproxyapproach h<strong>as</strong> come with the most recent WaterFramework Directive (WFD; European Union,2000). This focuses on ecological integrity rather thansimply chemical water quality, for which the use ofhydro-chemical transfer functions <strong>and</strong> diatom species<strong>as</strong>semblage analysis are not sufficient.Multiproxy analysis uses <strong>as</strong> broad a range of organismswithin the food web (e.g. pelagic food web)<strong>as</strong> possible, commensurate with those biota with remainsthat persist in the sediment in an identifiableform. In addition to micro-algae (diatoms, chrysophytes),fossil indicators also include macroalgae(Charophyta), protozoa (thecamoebae), higher plants(pollen <strong>and</strong> macro-remains), invertebrates (chironomids,ostracods, cladocerans) <strong>and</strong> vertebrates (fishscales).This approach is illustrated by the study of Davidsonet al. (2005) on Groby Pool, United Kingdom,a shallow lake that h<strong>as</strong> undergone nutrientenrichment in the p<strong>as</strong>t 200 years. Comparison of20-year slices from the sediment surface (recent:1980–2000) <strong>and</strong> b<strong>as</strong>e (reference: 1700–1720) indicatemajor changes in lake ecology (Fig. 3.4),driven primarily by alterations in water quality (Bennion<strong>and</strong> Battarbee, 2007). The ecological referencestate is one of dominance by benthic diatoms,colonization by low nutrient-adapted macro-algae<strong>and</strong> higher plants, with detectable invertebrates restrictedto plant-<strong>as</strong>sociated Chydoridae. In contr<strong>as</strong>tto this, the current-day ecosystem is much moreproductive – dominated by planktonic algae, highTOPPlanktonicStephanodiscusEpiphytic:CocconeisHigher plants:PotamogetonCallitricheNymphoeaZooplankton:CeriodaphniaBosminaDaphniaDominantdiatomsMacroalgae <strong>and</strong>higher plantsInvertebratesBOTTOMBenthicFragilaria spp.Charophyta:Nitella, CharaHigher plants:Myriophyllum,UtriculariaPlant-<strong>as</strong>sociatedChydoridFigure 3.4 Multi-proxy palaeoecological analysis of a sediment core: Groby Pool, United Kingdom. Analysis of20-year slices from the top (recent ecology, ∼1980–2000) <strong>and</strong> bottom (reference ecology, ∼1700–1720) samples of thecore. Figure adapted <strong>and</strong> redrawn from Bennion <strong>and</strong> Battarbee (2007), original data from Davidson et al. (2005).