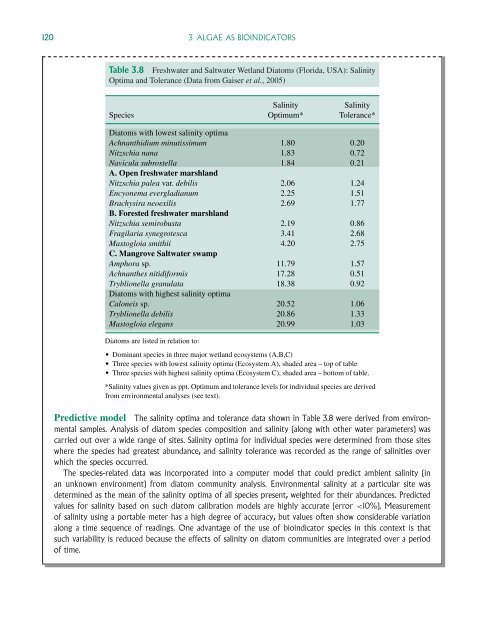
120 3 ALGAE AS BIOINDICATORSTable 3.8 <strong>Freshwater</strong> <strong>and</strong> Saltwater Wetl<strong>and</strong> Diatoms (Florida, USA): SalinityOptima <strong>and</strong> Tolerance (Data from Gaiser et al., 2005)SpeciesSalinityOptimum*SalinityTolerance*Diatoms with lowest salinity optimaAchnanthidium minutissimum 1.80 0.20Nitzschia nana 1.83 0.72Navicula subrostella 1.84 0.21A. Open freshwater marshl<strong>and</strong>Nitzschia palea var. debilis 2.06 1.24Encyonema evergladianum 2.25 1.51Brachysira neoexilis 2.69 1.77B. Forested freshwater marshl<strong>and</strong>Nitzschia semirobusta 2.19 0.86Fragilaria synegrotesca 3.41 2.68M<strong>as</strong>togloia smithii 4.20 2.75C. Mangrove Saltwater swampAmphora sp. 11.79 1.57Achnanthes nitidiformis 17.28 0.51Tryblionella granulata 18.38 0.92Diatoms with highest salinity optimaCaloneis sp. 20.52 1.06Tryblionella debilis 20.86 1.33M<strong>as</strong>togloia elegans 20.99 1.03Diatoms are listed in relation to: Dominant species in three major wetl<strong>and</strong> ecosystems (A,B,C) Three species with lowest salinity optima (Ecosystem A), shaded area – top of table Three species with highest salinity optima (Ecosystem C), shaded area – bottom of table.*Salinity values given <strong>as</strong> ppt. Optimum <strong>and</strong> tolerance levels for individual species are derivedfrom environmental analyses (see text).Predictive model The salinity optima <strong>and</strong> tolerance data shown in Table 3.8 were derived from environmentalsamples. Analysis of diatom species composition <strong>and</strong> salinity (along with other water parameters) w<strong>as</strong>carried out over a wide range of sites. Salinity optima for individual species were determined from those siteswhere the species had greatest abundance, <strong>and</strong> salinity tolerance w<strong>as</strong> recorded <strong>as</strong> the range of salinities overwhich the species occurred.The species-related data w<strong>as</strong> incorporated into a computer model that could predict ambient salinity (inan unknown environment) from diatom community analysis. Environmental salinity at a particular site w<strong>as</strong>determined <strong>as</strong> the mean of the salinity optima of all species present, weighted for their abundances. Predictedvalues for salinity b<strong>as</strong>ed on such diatom calibration models are highly accurate (error
3.4 RIVERS 1213.4 RiversUntil recently, monitoring of river water qualityin many countries (Kw<strong>and</strong>rans et al., 1998) w<strong>as</strong>b<strong>as</strong>ed mainly on Escherichia coli titre (sewage contamination)<strong>and</strong> chlorophyll-a concentration (trophicstatus). Chlorophyll-a cl<strong>as</strong>sification of the FrenchNational B<strong>as</strong>in Network (RNB), for example, distinguishedfive water quality levels (Prygiel <strong>and</strong>Coste, 1996): normal (chlorophyll-a concentration≤10 µgml −1 ), moderate pollution (10–≤60), distinctpollution (60–≤120), severe pollution (120–≤300)<strong>and</strong> cat<strong>as</strong>trophic pollution (>300).The use of microalgae <strong>as</strong> bioindicators w<strong>as</strong> pioneeredby Patrick (Patrick et al., 1954) <strong>and</strong> h<strong>as</strong> concentratedparticularly on benthic organisms, since therapid transit of phytoplankton with water flow meansthat these algae have little time to adapt to environmentalchanges at any point in the river system.In contr<strong>as</strong>t, benthic algae (periphyton <strong>and</strong> biofilms)are permanently located at particular sites, integratingphysical <strong>and</strong> chemical characteristics over time,<strong>and</strong> are ideal for monitoring environmental quality.Examples of benthic algae present on rocks <strong>and</strong>stones within a f<strong>as</strong>t-flowing stream are shown inFig. 2.23. The use of the periphyton communityfor biomonitoring normally involves either the entirecommunity, or one particular taxonomic group – thediatoms.3.4.1 The periphyton communityAnalysis of the entire periphyton community clearlygives a broader taxonomic <strong>as</strong>sessment of the benthicalgal population compared to diatoms only,but the predominance of filamentous algae makesquantitative analysis difficult. Various authors haveused periphyton analysis to characterize water quality,including a study of fluvial lakes by Cattaneoet al. (1995 – Section 3.2.1). This showedthat epiphytic communities could be monitored bothin terms of size structure <strong>and</strong> taxonomic composition,leading to statistical resolution of physical(substrate) <strong>and</strong> water quality (mercury toxicity)parameters.3.4.2 River diatomsContemporary biomonitoring of river water qualityh<strong>as</strong> tended to concentrate on just one periphyton constituent– the diatoms. These have various advantages<strong>as</strong> bioindicators – including predictable tolerancesto environmental variables, widespread occurrencewithin lotic systems, e<strong>as</strong>e of counting <strong>and</strong> a speciesdiversity that permits a detailed evaluation of environmentalparameters. The major drawbacks to diatomsin this respect is the requirement for complexspecimen preparation <strong>and</strong> the need for expert identification.Attached diatoms can be found on a variety of substratesincluding s<strong>and</strong>, gravel, stones, rock, wood <strong>and</strong>aquatic macrophytes (Table 2.6). The composition ofthe communities that develop is in response to waterflow, natural water chemistry, eutrophication, toxicpollution <strong>and</strong> grazing.Various authors have proposed precise protocolsfor the collection, specimen preparation <strong>and</strong> numericalanalysis of benthic diatoms to ensure uniformityof water quality <strong>as</strong>sessment (see below). More general<strong>as</strong>pects of periphyton sampling are discussed inSection 2.10.Sample collectionThe sampling procedure proposed by Round (1993)involves collection of diatom samples from a reachof a river where there is a continuous flow of waterover stones. About five small stones (up to 10 cmin diameter) are taken from the river bed, avoidingthose covered with green algal or moss growths. Thediatom flora can be removed from the stones either inthe field or back in the laboratory. As an alternativeto natural communities, artificial substrates can beused to collect diatoms at selected sample sites. Theseovercome the heterogeneity of natural substrata <strong>and</strong>consequently st<strong>and</strong>ardize comparisons between collectionsites, but presuppose that the full spectrum ofalgal species will grow on artificial media. Dela-Cruzet al. (2006) used this approach to sample diatomsin south-e<strong>as</strong>tern Australian rivers, suspending gl<strong>as</strong>sslides in a sampling frame 0.5 m below the water surface.Slides were exposed over a 4-week period to