Freshwater Algae: Identification and Use as Bioindicators
Freshwater Algae: Identification and Use as Bioindicators
Freshwater Algae: Identification and Use as Bioindicators

You also want an ePaper? Increase the reach of your titles
YUMPU automatically turns print PDFs into web optimized ePapers that Google loves.
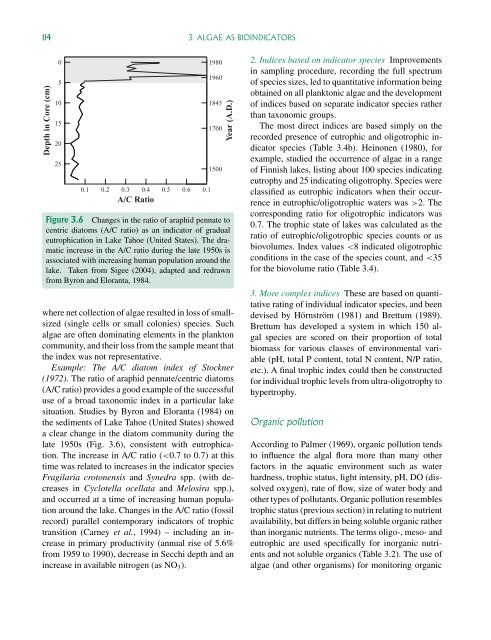
114 3 ALGAE AS BIOINDICATORSDepth in Core (cm)05101520250.1 0.2 0.3 0.4 0.5 0.6 0.1A/C Ratio19801960184517001500Year (A.D.)Figure 3.6 Changes in the ratio of araphid pennate tocentric diatoms (A/C ratio) <strong>as</strong> an indicator of gradualeutrophication in Lake Tahoe (United States). The dramaticincre<strong>as</strong>e in the A/C ratio during the late 1950s is<strong>as</strong>sociated with incre<strong>as</strong>ing human population around thelake. Taken from Sigee (2004), adapted <strong>and</strong> redrawnfrom Byron <strong>and</strong> Eloranta, 1984.where net collection of algae resulted in loss of smallsized(single cells or small colonies) species. Suchalgae are often dominating elements in the planktoncommunity, <strong>and</strong> their loss from the sample meant thatthe index w<strong>as</strong> not representative.Example: The A/C diatom index of Stockner(1972). The ratio of araphid pennate/centric diatoms(A/C ratio) provides a good example of the successfuluse of a broad taxonomic index in a particular lakesituation. Studies by Byron <strong>and</strong> Eloranta (1984) onthe sediments of Lake Tahoe (United States) showeda clear change in the diatom community during thelate 1950s (Fig. 3.6), consistent with eutrophication.The incre<strong>as</strong>e in A/C ratio (2. Thecorresponding ratio for oligotrophic indicators w<strong>as</strong>0.7. The trophic state of lakes w<strong>as</strong> calculated <strong>as</strong> theratio of eutrophic/oligotrophic species counts or <strong>as</strong>biovolumes. Index values