Freshwater Algae: Identification and Use as Bioindicators
Freshwater Algae: Identification and Use as Bioindicators
Freshwater Algae: Identification and Use as Bioindicators

Create successful ePaper yourself
Turn your PDF publications into a flip-book with our unique Google optimized e-Paper software.
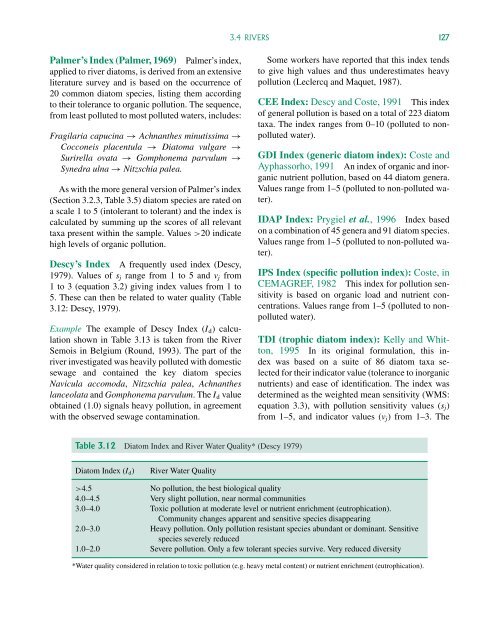
3.4 RIVERS 127Palmer’s Index (Palmer, 1969) Palmer’s index,applied to river diatoms, is derived from an extensiveliterature survey <strong>and</strong> is b<strong>as</strong>ed on the occurrence of20 common diatom species, listing them accordingto their tolerance to organic pollution. The sequence,from le<strong>as</strong>t polluted to most polluted waters, includes:Fragilaria capucina → Achnanthes minutissima →Cocconeis placentula → Diatoma vulgare →Surirella ovata → Gomphonema parvulum →Synedra ulna → Nitzschia palea.As with the more general version of Palmer’s index(Section 3.2.3, Table 3.5) diatom species are rated ona scale 1 to 5 (intolerant to tolerant) <strong>and</strong> the index iscalculated by summing up the scores of all relevanttaxa present within the sample. Values >20 indicatehigh levels of organic pollution.Descy’s Index A frequently used index (Descy,1979). Values of s j range from 1 to 5 <strong>and</strong> v j from1 to 3 (equation 3.2) giving index values from 1 to5. These can then be related to water quality (Table3.12: Descy, 1979).Example The example of Descy Index (I d ) calculationshown in Table 3.13 is taken from the RiverSemois in Belgium (Round, 1993). The part of theriver investigated w<strong>as</strong> heavily polluted with domesticsewage <strong>and</strong> contained the key diatom speciesNavicula accomoda, Nitzschia palea, Achnantheslanceolata <strong>and</strong> Gomphonema parvulum.TheI d valueobtained (1.0) signals heavy pollution, in agreementwith the observed sewage contamination.Some workers have reported that this index tendsto give high values <strong>and</strong> thus underestimates heavypollution (Leclercq <strong>and</strong> Maquet, 1987).CEE Index: Descy <strong>and</strong> Coste, 1991 This indexof general pollution is b<strong>as</strong>ed on a total of 223 diatomtaxa. The index ranges from 0–10 (polluted to nonpollutedwater).GDI Index (generic diatom index): Coste <strong>and</strong>Ayph<strong>as</strong>sorho, 1991 An index of organic <strong>and</strong> inorganicnutrient pollution, b<strong>as</strong>ed on 44 diatom genera.Values range from 1–5 (polluted to non-polluted water).IDAP Index: Prygiel et al., 1996 Index b<strong>as</strong>edon a combination of 45 genera <strong>and</strong> 91 diatom species.Values range from 1–5 (polluted to non-polluted water).IPS Index (specific pollution index): Coste, inCEMAGREF, 1982 This index for pollution sensitivityis b<strong>as</strong>ed on organic load <strong>and</strong> nutrient concentrations.Values range from 1–5 (polluted to nonpollutedwater).TDI (trophic diatom index): Kelly <strong>and</strong> Whitton,1995 In its original formulation, this indexw<strong>as</strong> b<strong>as</strong>ed on a suite of 86 diatom taxa selectedfor their indicator value (tolerance to inorganicnutrients) <strong>and</strong> e<strong>as</strong>e of identification. The index w<strong>as</strong>determined <strong>as</strong> the weighted mean sensitivity (WMS:equation 3.3), with pollution sensitivity values (s j )from 1–5, <strong>and</strong> indicator values (v j ) from 1–3. TheTable 3.12 Diatom Index <strong>and</strong> River Water Quality* (Descy 1979)Diatom Index (I d )River Water Quality>4.5 No pollution, the best biological quality4.0–4.5 Very slight pollution, near normal communities3.0–4.0 Toxic pollution at moderate level or nutrient enrichment (eutrophication).Community changes apparent <strong>and</strong> sensitive species disappearing2.0–3.0 Heavy pollution. Only pollution resistant species abundant or dominant. Sensitivespecies severely reduced1.0–2.0 Severe pollution. Only a few tolerant species survive. Very reduced diversity*Water quality considered in relation to toxic pollution (e.g. heavy metal content) or nutrient enrichment (eutrophication).