The Socio-Economic Importance of Scientific Research To Canada
The Socio-Economic Importance of Scientific Research To Canada
The Socio-Economic Importance of Scientific Research To Canada

Create successful ePaper yourself
Turn your PDF publications into a flip-book with our unique Google optimized e-Paper software.
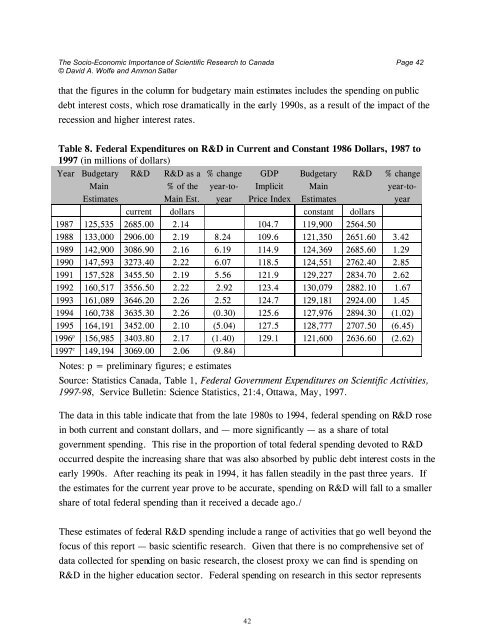
<strong>The</strong> <strong>Socio</strong>-<strong>Economic</strong> <strong>Importance</strong> <strong>of</strong> <strong>Scientific</strong> <strong>Research</strong> to <strong>Canada</strong> Page 42© David A. Wolfe and Ammon Salterthat the figures in the column for budgetary main estimates includes the spending on publicdebt interest costs, which rose dramatically in the early 1990s, as a result <strong>of</strong> the impact <strong>of</strong> therecession and higher interest rates.Table 8. Federal Expenditures on R&D in Current and Constant 1986 Dollars, 1987 to1997 (in millions <strong>of</strong> dollars)Year Budgetary R&D R&D as a % change GDP Budgetary R&D % changeMain % <strong>of</strong> the year-to- Implicit Main year-to-Estimates Main Est. year Price Index Estimates yearcurrent dollars constant dollars1987 125,535 2685.00 2.14 104.7 119,900 2564.501988 133,000 2906.00 2.19 8.24 109.6 121,350 2651.60 3.421989 142,900 3086.90 2.16 6.19 114.9 124,369 2685.60 1.291990 147,593 3273.40 2.22 6.07 118.5 124,551 2762.40 2.851991 157,528 3455.50 2.19 5.56 121.9 129,227 2834.70 2.621992 160,517 3556.50 2.22 2.92 123.4 130,079 2882.10 1.671993 161,089 3646.20 2.26 2.52 124.7 129,181 2924.00 1.451994 160,738 3635.30 2.26 (0.30) 125.6 127,976 2894.30 (1.02)1995 164,191 3452.00 2.10 (5.04) 127.5 128,777 2707.50 (6.45)1996 p 156,985 3403.80 2.17 (1.40) 129.1 121,600 2636.60 (2.62)1997 e 149,194 3069.00 2.06 (9.84)Notes: p = preliminary figures; e estimatesSource: Statistics <strong>Canada</strong>, Table 1, Federal Government Expenditures on <strong>Scientific</strong> Activities,1997-98, Service Bulletin: Science Statistics, 21:4, Ottawa, May, 1997.<strong>The</strong> data in this table indicate that from the late 1980s to 1994, federal spending on R&D rosein both current and constant dollars, and — more significantly — as a share <strong>of</strong> totalgovernment spending. This rise in the proportion <strong>of</strong> total federal spending devoted to R&Doccurred despite the increasing share that was also absorbed by public debt interest costs in theearly 1990s. After reaching its peak in 1994, it has fallen steadily in the past three years. Ifthe estimates for the current year prove to be accurate, spending on R&D will fall to a smallershare <strong>of</strong> total federal spending than it received a decade ago./<strong>The</strong>se estimates <strong>of</strong> federal R&D spending include a range <strong>of</strong> activities that go well beyond thefocus <strong>of</strong> this report — basic scientific research. Given that there is no comprehensive set <strong>of</strong>data collected for spending on basic research, the closest proxy we can find is spending onR&D in the higher education sector. Federal spending on research in this sector represents42