The Socio-Economic Importance of Scientific Research To Canada
The Socio-Economic Importance of Scientific Research To Canada
The Socio-Economic Importance of Scientific Research To Canada

You also want an ePaper? Increase the reach of your titles
YUMPU automatically turns print PDFs into web optimized ePapers that Google loves.
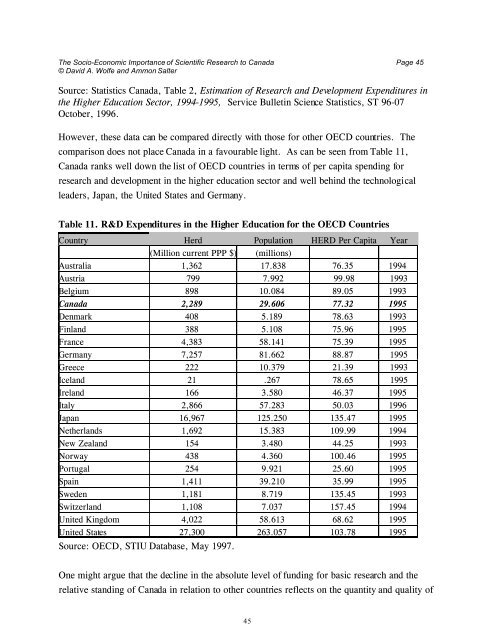
<strong>The</strong> <strong>Socio</strong>-<strong>Economic</strong> <strong>Importance</strong> <strong>of</strong> <strong>Scientific</strong> <strong>Research</strong> to <strong>Canada</strong> Page 45© David A. Wolfe and Ammon SalterSource: Statistics <strong>Canada</strong>, Table 2, Estimation <strong>of</strong> <strong>Research</strong> and Development Expenditures inthe Higher Education Sector, 1994-1995, Service Bulletin Science Statistics, ST 96-07October, 1996.However, these data can be compared directly with those for other OECD countries. <strong>The</strong>comparison does not place <strong>Canada</strong> in a favourable light. As can be seen from Table 11,<strong>Canada</strong> ranks well down the list <strong>of</strong> OECD countries in terms <strong>of</strong> per capita spending forresearch and development in the higher education sector and well behind the technologicalleaders, Japan, the United States and Germany.Table 11. R&D Expenditures in the Higher Education for the OECD CountriesCountry Herd Population HERD Per Capita Year(Million current PPP $) (millions)Australia 1,362 17.838 76.35 1994Austria 799 7.992 99.98 1993Belgium 898 10.084 89.05 1993<strong>Canada</strong> 2,289 29.606 77.32 1995Denmark 408 5.189 78.63 1993Finland 388 5.108 75.96 1995France 4,383 58.141 75.39 1995Germany 7,257 81.662 88.87 1995Greece 222 10.379 21.39 1993Iceland 21 .267 78.65 1995Ireland 166 3.580 46.37 1995Italy 2,866 57.283 50.03 1996Japan 16,967 125.250 135.47 1995Netherlands 1,692 15.383 109.99 1994New Zealand 154 3.480 44.25 1993Norway 438 4.360 100.46 1995Portugal 254 9.921 25.60 1995Spain 1,411 39.210 35.99 1995Sweden 1,181 8.719 135.45 1993Switzerland 1,108 7.037 157.45 1994United Kingdom 4,022 58.613 68.62 1995United States 27,300 263.057 103.78 1995Source: OECD, STIU Database, May 1997.One might argue that the decline in the absolute level <strong>of</strong> funding for basic research and therelative standing <strong>of</strong> <strong>Canada</strong> in relation to other countries reflects on the quantity and quality <strong>of</strong>45