A multilevel analysis of job satisfaction in Britain - WERS 2004
A multilevel analysis of job satisfaction in Britain - WERS 2004
A multilevel analysis of job satisfaction in Britain - WERS 2004

You also want an ePaper? Increase the reach of your titles
YUMPU automatically turns print PDFs into web optimized ePapers that Google loves.
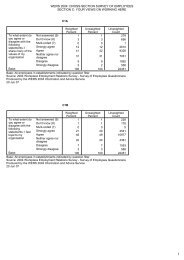
100 women work<strong>in</strong>g p-t -0.028 -0.210 -0.062 -0.124 -0.772 0.156 -0.509 -0.224 -0.571(0.194) (0.309) (0.235) (0.211) (0.307)* (0.264) (0.205)* (0.313) (0.291)*No worker aged 16-17 -0.200 -0.250 -0.214 0.076 -0.142 0.182 -0.189 -0.457 -0.032(0.134) (0.179) (0.170) (0.151) (0.188) (0.182) (0.148) (0.199)* (0.175)>5 workers aged 16-17 -0.042 0.073 -0.034 -0.030 -0.554 0.186 0.332 -0.208 0.630(0.146) (0.257) (0.169) (0.202) (0.276)* (0.230) (0.293) (0.258) (0.355)No worker aged 18-21 -0.142 -0.422 0.008 -0.128 -0.296 0.020 -0.247 -0.195 -0.266(0.108) (0.167)* (0.131) (0.132) (0.165) (0.153) (0.128) (0.192) (0.143)B/n 6-25 workers aged 18-21 -0.208 -0.290 -0.231 -0.125 0.100 -0.176 -0.177 -0.015 -0.202(0.130) (0.204) (0.165) (0.282) (0.267) (0.319) (0.275) (0.222) (0.314)>25 workers aged 18-21 -0.163 -0.253 -0.322 -0.302 0.078 -0.525 -0.108 0.498 -0.516(0.148) (0.293) (0.182) (0.356) (0.358) (0.405) (0.239) (0.237)* (0.303)No worker aged over 50 -0.003 -0.079 -0.047 -0.018 -0.077 0.049 -0.075 -0.426 0.074(0.146) (0.228) (0.165) (0.175) (0.219) (0.208) (0.164) (0.218) (0.196)B/n 6-25 workers over 50 0.163 0.191 0.147 -0.217 -0.212 -0.228 -0.061 -0.232 0.030(0.102) (0.164) (0.129) (0.099)* (0.137) (0.128) (0.121) (0.179) (0.150)>25 workers aged over 50 0.327 0.597 0.142 -0.218 -0.102 -0.255 -0.056 -0.342 0.070(0.145)* (0.267)* (0.184) (0.156) (0.225) (0.208) (0.147) (0.224) (0.216)No ethnic m<strong>in</strong>ority worker 0.253 0.349 0.243 0.100 0.091 0.080 0.168 0.015 0.245(0.100)* (0.180) (0.124) (0.120) (0.171) (0.146) (0.115) (0.177) (0.137)Between 6-25 ethnic m<strong>in</strong>ority 0.215 0.278 0.132 0.018 0.094 -0.104 0.278 0.324 0.073(0.182) (0.259) (0.162) (0.174) (0.274) (0.149) (0.230) (0.312) (0.172)Over 25 eth m<strong>in</strong>ority workers -0.036 -0.153 0.116 -0.002 0.044 -0.000 0.070 -0.020 -0.050(0.162) (0.237) (0.209) (0.167) (0.226) (0.224) (0.202) (0.268) (0.268)No disabled worker 0.079 0.239 0.060 -0.142 -0.197 -0.033 -0.016 -0.091 0.073(0.116) (0.157) (0.138) (0.114) (0.168) (0.141) (0.131) (0.180) (0.165)Over 5 disabled workers 0.195 0.238 0.084 -0.060 -0.185 0.003 -0.186 -0.378 -0.044(0.173) (0.306) (0.191) (0.129) (0.184) (0.180) (0.169) (0.245) (0.251)Manufactur<strong>in</strong>g 0.040 0.245 -0.382 0.188 0.479 -0.244 0.095 0.069 0.301(0.205) (0.239) (0.266) (0.237) (0.299) (0.298) (0.240) (0.282) (0.271)Construction 0.079 0.018 0.320 0.192 0.405 -0.012 0.317 0.239 1.054(0.298) (0.331) (0.605) (0.355) (0.355) (0.568) (0.235) (0.380) (0.534)*Trade, electricity, gas & water 0.248 0.135 0.401 0.116 0.188 0.120 -0.073 0.235 -0.191(0.159) (0.231) (0.208) (0.213) (0.258) (0.266) (0.195) (0.243) (0.232)Hotels & rest, transp & comm. -0.070 -0.139 -0.006 -0.051 0.004 -0.042 0.262 0.376 0.09722