Assam - Ministry of Environment and Forests
Assam - Ministry of Environment and Forests
Assam - Ministry of Environment and Forests

You also want an ePaper? Increase the reach of your titles
YUMPU automatically turns print PDFs into web optimized ePapers that Google loves.
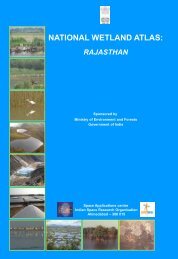
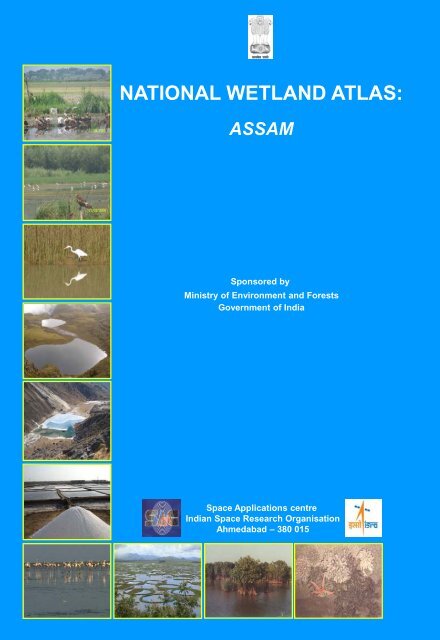
NATIONAL WETLAND ATLAS:ASSAMSponsored by<strong>Ministry</strong> <strong>of</strong> <strong>Environment</strong> <strong>and</strong> <strong>Forests</strong>Government <strong>of</strong> IndiaSpace Applications centreIndian Space Research OrganisationAhmedabad – 380 015
This publication deals with the updated database <strong>and</strong>status <strong>of</strong> wetl<strong>and</strong>s, compiled in Atlas format. Increasingconcern about how our wetl<strong>and</strong>s are being influenced hasled to formulation <strong>of</strong> a project entitled “National Wetl<strong>and</strong>Inventory <strong>and</strong> Assessment (NWIA)” to create an updateddatabase <strong>of</strong> the wetl<strong>and</strong>s <strong>of</strong> India. The wetl<strong>and</strong>s arecategorised under 19 classes <strong>and</strong> mapped using satelliteremote sensing data from Indian Remote SensingSatellite: IRS P6- LISS III sensor. The results areorganised at 1: 50, 000 scales at district, state <strong>and</strong>topographic map sheet (Survey <strong>of</strong> India reference) levelusing Geographic Information System (GIS). Thispublication is a part <strong>of</strong> this national work <strong>and</strong> deals withthe wetl<strong>and</strong> status <strong>of</strong> a particular State/Union Territory <strong>of</strong>India, through text, statistical tables, satellite images,maps <strong>and</strong> ground photographs.The atlas comprises wetl<strong>and</strong> information arranged intonine sections. How the NWIA project work has beenexecuted highlighted in the first six sections viz:Introduction, NWIA project, Study area, Data used,Methodology, <strong>and</strong> Accuracy. This is the first time that highresolution digital remote sensing data has been used tomap <strong>and</strong> decipher the status <strong>of</strong> the wetl<strong>and</strong>s at nationalscale. The methodology highlights how the four spectralb<strong>and</strong>s <strong>of</strong> LISS III data (green, red, near infra red <strong>and</strong> shortwave infra red) have been used to derive various indices<strong>and</strong> decipher information regarding water spread,turbidity <strong>and</strong> aquatic vegetation. Since, the aim was togenerate a GIS compatible database, details <strong>of</strong> thest<strong>and</strong>ards <strong>of</strong> database are also highlighted in themethodology.The results <strong>and</strong> finding are organised in three sections;viz: Maps <strong>and</strong> Statistics, Major wetl<strong>and</strong> types, <strong>and</strong>Important Wetl<strong>and</strong>s <strong>of</strong> the area. The Maps <strong>and</strong> Statisticsare shown for state <strong>and</strong> district level. It gives details <strong>of</strong>what type <strong>of</strong> wetl<strong>and</strong>s exists in the area, how manynumbers in each type, their area estimates in hectare.Since, the hydrology <strong>of</strong> wetl<strong>and</strong>s are influenced bymonsoon performance, extent <strong>of</strong> water spread <strong>and</strong> theirturbidity (qualitative) in wet <strong>and</strong> dry season (postmonsoon<strong>and</strong> pre-monsoon period) are also given.Similarly the status <strong>of</strong> aquatic vegetation (mainly floating<strong>and</strong> emergent types) in two seasons is also accounted for.Status <strong>of</strong> small wetl<strong>and</strong>s are also accounted as numbers<strong>and</strong> depicted in maps as points. Wetl<strong>and</strong> map also showimportant ancillary information like roads/rail, relevanthabitations. False Colour Composite (FCC) <strong>of</strong> the satelliteimage used (any one season) is shown along with thederived wetl<strong>and</strong> map to give a feeling <strong>of</strong> manifestation <strong>of</strong>wetl<strong>and</strong>s in remote sensing data <strong>and</strong> synoptic view <strong>of</strong> thearea. The status <strong>of</strong> some <strong>of</strong> the important wetl<strong>and</strong>s likeRamsar sites, National Parks are shown with recent fieldphotographs.For further details contact:Director,Space Applications Centre, ISRO,Ambawadi Vistar (P.O.)Ahmedabad – 380 015director@sac.isro.gov.in
AtlasSAC/RESA/AFEG/NWIA/ATLAS/18/2009NATIONAL WETLAND ATLASASSAMSponsored by<strong>Ministry</strong> <strong>of</strong> <strong>Environment</strong> <strong>and</strong> <strong>Forests</strong>, Government <strong>of</strong> IndiaAs a part <strong>of</strong> the project on National Wetl<strong>and</strong> Inventory <strong>and</strong> Assessment (NWIA)Space Applications Centre (ISRO), Ahmedabad<strong>and</strong><strong>Assam</strong> Remote Sensing Applications Centre, GuwahatiApril 2010
First Publication: April 2010, Space Applications Centre (ISRO), AhmedabadCopyright:2010, SAC, ISROThis publication may be produced in whole or in part <strong>and</strong> in any form for education or non-pr<strong>of</strong>it uses,without special permission from the copyright holder, provided acknowledgement <strong>of</strong> source is made. SACwill appreciate a copy <strong>of</strong> any publication which uses this publication as a source.Citation: National Wetl<strong>and</strong> Atlas: <strong>Assam</strong>, SAC/RESA/AFEG/NWIA/ATLAS/18/2010, Space ApplicationsCentre(ISRO), Ahmedabad, India, 174p.Available from:Production:Space Applications Centre, ISRO, Ahmedabad – 380 015, IndiaSAC carried out the work jointly with <strong>Assam</strong> Remote Sensing Applications Centre, Guwahati, Sponsored by<strong>Ministry</strong> <strong>of</strong> <strong>Environment</strong> <strong>and</strong> <strong>Forests</strong>, Govt. <strong>of</strong> India.
FOREWORDWetl<strong>and</strong>s defined as areas <strong>of</strong> l<strong>and</strong> that are either temporarily or permanently covered by water exhibitenormous diversity according to their genesis, geographical location, water regime <strong>and</strong> chemistry. Wetl<strong>and</strong>sare one <strong>of</strong> the most productive ecosystems <strong>and</strong> play crucial role in hydrological cycle. Utility wise, wetl<strong>and</strong>sdirectly <strong>and</strong> indirectly support millions <strong>of</strong> people in providing services such as storm <strong>and</strong> flood control, cleanwater supply, food, fiber <strong>and</strong> raw materials, scenic beauty, educational <strong>and</strong> recreational benefits. TheMillennium Ecosystem Assessment estimates conservatively that wetl<strong>and</strong>s cover seven percent <strong>of</strong> the earth’ssurface <strong>and</strong> deliver 45% <strong>of</strong> the world’s natural productivity <strong>and</strong> ecosystem services. However, the veryexistence <strong>of</strong> these unique resources is under threat due to developmental activities, <strong>and</strong> population pressure.This calls for a long term planning for preservation <strong>and</strong> conservation <strong>of</strong> these resources. An updated <strong>and</strong>accurate database that will support research <strong>and</strong> decision is the first step towards this. Use <strong>of</strong> advancedtechniques like Satellite remote sensing, Geographic Information System (GIS) is now essential for accurate<strong>and</strong> timely spatial database <strong>of</strong> large areas. Space Applications Centre (ISRO) took up this challenging taskunder the project “NWIA” (National Wetl<strong>and</strong> Inventory <strong>and</strong> Assessment) sponsored by <strong>Ministry</strong> <strong>of</strong><strong>Environment</strong> & <strong>Forests</strong>. To account for numerous small yet important wetl<strong>and</strong>s found in the country, mappingat 1:50,000 scales has been taken up. Two date IRS LISS III data acquired during pre <strong>and</strong> post monsoonseason are used for inventory to account for wet <strong>and</strong> dry season hydrology <strong>of</strong> wetl<strong>and</strong>s. The map outputsinclude the status <strong>of</strong> water spread, aquatic vegetation <strong>and</strong> turbidity. Ancillary layers like road/rail, habitationsare also created. Very small wetl<strong>and</strong>s below the mappable unit are also identified <strong>and</strong> shown points. Theresults are complied as Atlases <strong>of</strong> wetl<strong>and</strong>s for states/Union Territories <strong>of</strong> India. This Atlas highlights resultsfor a particular state/UT <strong>and</strong> hopes to improve our underst<strong>and</strong>ing <strong>of</strong> the dynamics <strong>and</strong> distribution <strong>of</strong> wetl<strong>and</strong>s<strong>and</strong> their status in the area.I congratulate the team for bringing out this informative atlas <strong>and</strong> sincerely hope that this will serve as auseful source <strong>of</strong> information to researchers, planners <strong>and</strong> general public.January 25, 2010
ACKNOWLEDGEMENTSThe project “National Wetl<strong>and</strong> Inventory & Assessment (NWIA)” is sponsored by <strong>Ministry</strong> <strong>of</strong> <strong>Environment</strong> &Forestry (MoEF), Govt. <strong>of</strong> India <strong>and</strong> executed by Space Applications Centre, ISRO, Ahmedabad. We aregrateful to Dr. Ranganath R. Navalgund, Director, Space Applications Centre, for his encouragement to takeup this challenging task <strong>and</strong> formulation <strong>of</strong> the project team for timely implementation. Earnest thanks arealso due to Dr. Jai Singh Parihar, Dy. Director, Earth, Ocean, Atmosphere, Planetary Sciences <strong>and</strong>Applications Area (EPSA), Space Applications Centre, for his overall guidance <strong>and</strong> support. The present Atlasfor the state <strong>of</strong> <strong>Assam</strong> is a part <strong>of</strong> the “National Wetl<strong>and</strong> Atlas” . We acknowledge the active support providedby Director, <strong>Assam</strong> Remote Sensing Application Centre (ARSAC), Guwahati in ground truth data collection forthe entire state <strong>and</strong> end to end work for 15 districts <strong>of</strong> the state.This project has benefited from the wisdom <strong>of</strong> many people. It is a pleasure to acknowledge the contributionsmade by the wetl<strong>and</strong> experts especially to Pr<strong>of</strong>. C.K. Varshney, Former Dean, School <strong>of</strong> <strong>Environment</strong>alSciences, Jawaharlal Nehru University, New Delhi, Pr<strong>of</strong>. A.R. Yousuf, The University <strong>of</strong> Kashmir, Srinagar,Pr<strong>of</strong>. Pradeeep Shrivastava, Head, Wetl<strong>and</strong> Research Centre, Barakatullah University, Bhopal, Dr. PrikshitGautam, Director, WWF-India, Dr. S. Narendra Prasad, Salim Ali Centre for Ornithology <strong>and</strong> Nature,Coimbtore <strong>and</strong> Dr. R.K. Suri, Additional Director, <strong>Ministry</strong> <strong>of</strong> <strong>Environment</strong> <strong>and</strong> <strong>Forests</strong>, Govt. <strong>of</strong> India, NewDelhi, to finalise the “Wetl<strong>and</strong> Classification System” followed in this project by their active participation in thePeer Review meeting. We are thankful to the database experts from ISRO who participated in the peerReview meeting to finalise the hierarchical classification system.We acknowledge the positive role played by 16 th SC-B (St<strong>and</strong>ing Committee on Bioresources <strong>and</strong><strong>Environment</strong>) <strong>of</strong> NNRMS (National Natural Resources Management System) meeting in formulating thisproject. We are extremely thankful to the members <strong>of</strong> the” Steering Committee” <strong>of</strong> the project, under thechairmanship <strong>of</strong> Dr E J James, Director – Water University, Karunya University, for their periodical review,critical comments <strong>and</strong> appreciation <strong>of</strong> the efforts by the project team. We are thankful to SC-B under thechairmanship <strong>of</strong> Secretary, MoEF, for periodic review <strong>of</strong> the progress <strong>of</strong> the project <strong>and</strong> guidance towardstimely completion <strong>of</strong> the work. We acknowledge the valuable contributions made by Dr J K Garg, the thenscientist <strong>of</strong> SAC for his active role in formulation <strong>of</strong> this project, co-authoring the procedure manual document.We are grateful to Dr G V Subramanyam, Adviser, MoEF for his very active <strong>and</strong> positive role forimplementation <strong>of</strong> the project. We are also thankful to Dr Jag Ram, Director, MoEF , Dr Harendra Kharwal,MoEF for their support. We are thankful to the “Technical Review” team <strong>of</strong> SAC for critical comments <strong>and</strong>suggestion <strong>of</strong> the Atlas. We acknowledge the support received from Dr P S Roy, Dy Director, NRSC <strong>and</strong> Dr SSudhakar, Head, LRD, NRSC in terms <strong>of</strong> valuable suggestions <strong>and</strong> providing the geo-referenced image <strong>of</strong>NRC-LU&LC project for use as master image in this project. We are thankful to Dr P P Nageswar Rao,Director, NESAC, Shillong for his encouragement to Ms Kasturi to carry on the supervision <strong>of</strong> theimplementation <strong>of</strong> the work.We thank Dr R D Shah, Mr Pragnesh Kumar Vaishnav <strong>and</strong> Ms Yatisha P Vaishnav, Geology Department, MG Science Institute, Ahmedabad for their support in finalization <strong>of</strong> GIS database.
PROJECT TEAMProject Director: Dr. (Mrs) Sushma PanigrahySpace Applications Centre, ISRO, AhmedabadShri J. G. PatelDr. T. S. SinghShri T.V.R. Murthy<strong>Assam</strong> Remote Sensing Applications Centre, GuwahatiShri Utpal SarmaShri Prasanna BaruahMs. Navamallika SharmaNorth Eastern Space Applications Centre, Umiam, MeghalayaMs. Kasturi Chakraborty
List <strong>of</strong> FiguresFigure 1: Spectral Signature <strong>of</strong> various targetsFigure 2: Various l<strong>and</strong> features as they appear in four spectral b<strong>and</strong>s <strong>and</strong> in a typical three b<strong>and</strong> FCC.Figure 3: Location mapFigure 4: Spatial framework <strong>of</strong> <strong>Assam</strong>Figure 5: IRS P6 LISS-III coverage <strong>of</strong> <strong>Assam</strong>Figure 6: IRS LISS-III FCC (Post-monsoon <strong>and</strong> Pre-monsoon): Part <strong>of</strong> <strong>Assam</strong> stateFigure 7: Flow chart <strong>of</strong> the methodology usedFigure 8: Steps in the extraction <strong>of</strong> wetl<strong>and</strong> componentsFigure 9: Various combinations <strong>of</strong> the indices/spectral b<strong>and</strong>s used to identify wetl<strong>and</strong> componentsFigure 10: Type-wise wetl<strong>and</strong> distributionFigure 11: District-wise graphical distribution <strong>of</strong> wetl<strong>and</strong>sList <strong>of</strong> TablesTable 1: Wetl<strong>and</strong> Classification System <strong>and</strong> codingTable 2: Satellite data usedTable 3: Qualitative turbidity ratingsTable 4: Area estimates <strong>of</strong> wetl<strong>and</strong>s in <strong>Assam</strong>Table 5: District-wise wetl<strong>and</strong> statisticsTable 6: Area estimates <strong>of</strong> wetl<strong>and</strong>s in KokrajharTable 7: Area estimates <strong>of</strong> wetl<strong>and</strong>s in DhubriTable 8: Area estimates <strong>of</strong> wetl<strong>and</strong>s in GoalparaTable 9: Area estimates <strong>of</strong> wetl<strong>and</strong>s in BongaigaonTable 10: Area estimates <strong>of</strong> wetl<strong>and</strong>s in BarpetaTable 11: Area estimates <strong>of</strong> wetl<strong>and</strong>s in KamrupTable 12: Area estimates <strong>of</strong> wetl<strong>and</strong>s in NalbariTable 13: Area estimates <strong>of</strong> wetl<strong>and</strong>s in DarrangTable 14: Area estimates <strong>of</strong> wetl<strong>and</strong>s in MarigaonTable 15: Area estimates <strong>of</strong> wetl<strong>and</strong>s in NagaonTable 16: Area estimates <strong>of</strong> wetl<strong>and</strong>s in SonitpurTable 17: Area estimates <strong>of</strong> wetl<strong>and</strong>s in LakhimpurTable 18: Area estimates <strong>of</strong> wetl<strong>and</strong>s in DhemajiTable 19: Area estimates <strong>of</strong> wetl<strong>and</strong>s in TinsukiaTable 20: Area estimates <strong>of</strong> wetl<strong>and</strong>s in DibrugarhTable 21: Area estimates <strong>of</strong> wetl<strong>and</strong>s in SibsagarTable 22: Area estimates <strong>of</strong> wetl<strong>and</strong>s in JorhatTable 23: Area estimates <strong>of</strong> wetl<strong>and</strong>s in GolaghatTable 24: Area estimates <strong>of</strong> wetl<strong>and</strong>s in Karbi AnglongTable 25: Area estimates <strong>of</strong> wetl<strong>and</strong>s in North Cachar HillsTable 26: Area estimates <strong>of</strong> wetl<strong>and</strong>s in CacharTable 27: Area estimates <strong>of</strong> wetl<strong>and</strong>s in KarimganjTable 28: Area estimates <strong>of</strong> wetl<strong>and</strong>s in Hailak<strong>and</strong>iList <strong>of</strong> PlatesPlate 1: Major wetl<strong>and</strong> types <strong>of</strong> <strong>Assam</strong>Plate 2a <strong>and</strong> 2b: Field photographs <strong>and</strong> ground truth data <strong>of</strong> different wetl<strong>and</strong> types in <strong>Assam</strong>Plate 3: Field observation on the status <strong>of</strong> hydrophytes (free floating mat type emergent anchored <strong>and</strong> swamp type)Plate 4: Deepor BeelPlate 5: Wetl<strong>and</strong> map - 5 km buffer area <strong>of</strong> Deepor BeelPlate 6: IRS LISS-III FCC - 5 km buffer area <strong>of</strong> Deepor BeelPlate 7: Dhir BeelPlate 8: Wetl<strong>and</strong> map - 5 km buffer area <strong>of</strong> Dhir BeelPlate 9: IRS LISS-III FCC - 5 km buffer area <strong>of</strong> Dhir BeelPlate 10: Sareswar BeelPlate 11: Wetl<strong>and</strong> map - 5 km buffer area <strong>of</strong> Sareswar BeelPlate 12: IRS LISS-III FCC - 5 km buffer area <strong>of</strong> Sareswar BeelPlate 13: Sone LakePlate 14: Wetl<strong>and</strong> map - 5 km buffer area <strong>of</strong> Sone LakePlate 15: IRS LISS-III FCC - 5 km buffer area <strong>of</strong> Sone LakePlate 16: Tamaranga BeelPlate 17: Wetl<strong>and</strong> map - 5 km buffer area <strong>of</strong> Tamaranga BeelPlate 18: IRS LISS-III FCC - 5 km buffer area <strong>of</strong> Tamaranga BeelPlate 19: Sonai Beel (N<strong>and</strong>ini/Mer/Sonai/Raumari/Dobarani/Patiab<strong>and</strong>ha beel)Plate 20: Wetl<strong>and</strong> map - 5 km buffer area <strong>of</strong> Sonai BeelPlate 21: IRS LISS-III FCC - 5 km buffer area <strong>of</strong> Sonai Beel
1.0 INTRODUCTIONIt is increasingly realized that the planet earth is facing grave environmental problems with fast depletingnatural resources <strong>and</strong> threatening the very existence <strong>of</strong> most <strong>of</strong> the ecosystems. Serious concerns are voicedamong scientists, planners, sociologists, politicians, <strong>and</strong> economists to conserve <strong>and</strong> preserve the naturalresources <strong>of</strong> the world. One <strong>of</strong> the constraints most frequently faced for decision making is lack <strong>of</strong> scientificdata <strong>of</strong> our natural resources. Often the data are sparse or unauthentic, rarely in the form <strong>of</strong> geospatialdatabase (map), thus open to challenges. Hence, the current emphasis <strong>of</strong> every country is to have anappropriate geospatial database <strong>of</strong> natural resources based on unambiguous scientific methods. The wetl<strong>and</strong>atlas <strong>of</strong> <strong>Assam</strong>, which is part <strong>of</strong> the National Wetl<strong>and</strong> Atlas <strong>of</strong> India, is an attempt in this direction.1.1 Wetl<strong>and</strong>sWetl<strong>and</strong>s are one <strong>of</strong> the crucial natural resources. Wetl<strong>and</strong>s are areas <strong>of</strong> l<strong>and</strong> that are either temporarily orpermanently covered by water. This means that a wetl<strong>and</strong> is neither truly aquatic nor terrestrial; it is possiblethat wetl<strong>and</strong>s can be both at the same time depending on seasonal variability. Thus, wetl<strong>and</strong>s exhibitenormous diversity according to their genesis, geographical location, water regime <strong>and</strong> chemistry, dominantplants <strong>and</strong> soil or sediment characteristics. Because <strong>of</strong> their transitional nature, the boundaries <strong>of</strong> wetl<strong>and</strong>sare <strong>of</strong>ten difficult to define. Wetl<strong>and</strong>s do, however, share a few attributes common to all forms. Of these,hydrological structure (the dynamics <strong>of</strong> water supply, throughput, storage <strong>and</strong> loss) is most fundamental tothe nature <strong>of</strong> a wetl<strong>and</strong> system. It is the presence <strong>of</strong> water for a significant period <strong>of</strong> time which is principallyresponsible for the development <strong>of</strong> a wetl<strong>and</strong>. One <strong>of</strong> the first widely used classifications systems, devised byCowardin et al, 1979, was associated to its hydrological, ecological <strong>and</strong> geological aspects, such as: marine(coastal wetl<strong>and</strong>s including rock shores <strong>and</strong> coral reefs, estuarine (including deltas, tidal marshes, <strong>and</strong>mangrove swamps), lacustarine (lakes), riverine (along rivers <strong>and</strong> streams), palustarine ('marshy'- marshes,swamps <strong>and</strong> bogs). Given these characteristics, wetl<strong>and</strong>s support a large variety <strong>of</strong> plant <strong>and</strong> animal speciesadapted to fluctuating water levels, making the wetl<strong>and</strong>s <strong>of</strong> critical ecological significance. Utility wise,wetl<strong>and</strong>s directly <strong>and</strong> indirectly support millions <strong>of</strong> people in providing services such as food, fiber <strong>and</strong> rawmaterials, storm <strong>and</strong> flood control, clean water supply, scenic beauty <strong>and</strong> educational <strong>and</strong> recreationalbenefits. The Millennium Ecosystem Assessment estimates conservatively that wetl<strong>and</strong>s cover seven percent<strong>of</strong> the earth’s surface <strong>and</strong> deliver 45% <strong>of</strong> the world’s natural productivity <strong>and</strong> ecosystem services <strong>of</strong> which thebenefits are estimated at $20 trillion a year (Source: www.MAweb.org). The Millennium Assessment (MA)uses the following typology to categorise ecosystem services:Provisioning services: The resources or products provided by ecosystems, such as food, raw materials(wood), genetic resources, medicinal resources, ornamental resources (skin, shells,flowers).Regulating services: Ecosystems maintain the essential ecological processes <strong>and</strong> life support systems, likegas <strong>and</strong> climate regulation, water supply <strong>and</strong> regulation, waste treatment, pollination,etc.Cultural <strong>and</strong> Amenity services: Ecosystems are a source <strong>of</strong> inspiration to human culture <strong>and</strong> educationthroughout recreation, cultural, artistic, spiritual <strong>and</strong> historic information, Science <strong>and</strong>education.Supporting services: Ecosystems provide habitat for flora <strong>and</strong> fauna in order to maintain biological <strong>and</strong>genetic diversity.Despite these benefits, wetl<strong>and</strong>s are the first target <strong>of</strong> human interference <strong>and</strong> are among the mostthreatened <strong>of</strong> all natural resources. Around 50% <strong>of</strong> the earth’s wetl<strong>and</strong> area is estimated to already havedisappeared over the last hundred years through conversion to industrial, agricultural <strong>and</strong> residentialdevelopments. Even in current scenario, when the ecosystem services provided by wetl<strong>and</strong>s are betterunderstood - degradation <strong>and</strong> conversion <strong>of</strong> wetl<strong>and</strong>s continues. This is largely due to the fact that the‘full value’ <strong>of</strong> ecosystem functions is <strong>of</strong>ten ignored in policy-making, plans <strong>and</strong> corporate evaluations <strong>of</strong>development projects.1.2 Mapping <strong>and</strong> Geospatial TechniqueTo conserve <strong>and</strong> manage wetl<strong>and</strong> resources, it is important to have inventory <strong>of</strong> wetl<strong>and</strong>s <strong>and</strong> theircatchments. The ability to store <strong>and</strong> analyse the data is essential. Digital maps are very powerful tools toachieve this. Maps relate the feature to any given geographical location has a strong visual impact. Maps arethus essential for monitoring <strong>and</strong> quantifying change over time scale, assist in decision making.The technique used in the preparation <strong>of</strong> map started with ground survey. The Survey <strong>of</strong> India (SOI)topographical maps are the earliest true maps <strong>of</strong> India showing various l<strong>and</strong> use/cover classes includingwetl<strong>and</strong>s. Recent years have seen advances in mapping technique to prepare maps with much moreinformation. Of particular importance is the remote sensing <strong>and</strong> geographic information system (GIS)1
technique. Remote sensing is now recognised as an essential tool for viewing, analyzing, characterizing, <strong>and</strong>making decisions about l<strong>and</strong>, water <strong>and</strong> atmospheric components.From a general perspective, remote sensing is the science <strong>of</strong> acquiring <strong>and</strong> analyzing information aboutobjects or phenomena from a distance (Jensen, 1986; Lilles<strong>and</strong> <strong>and</strong> Keifer, 1987). Today, satellite remotesensing can be defined as the use <strong>of</strong> satellite borne sensors to observe, measure, <strong>and</strong> record theelectromagnetic radiation (EMR) reflected or emitted by the earth <strong>and</strong> its environment for subsequent analysis<strong>and</strong> extraction <strong>of</strong> information. EMR sensors includes visible light, near-, mid- <strong>and</strong> far-infrared (thermal),microwave, <strong>and</strong> long-wave radio energy. The capability <strong>of</strong> multiple sources <strong>of</strong> information is unique toremote sensing. Of specific advantage is the spectral, temporal, <strong>and</strong> spatial resolution. Spectral resolutionrefers to the width or range <strong>of</strong> each spectral b<strong>and</strong> being recorded. Since each target affects differentwavelengths <strong>of</strong> incident energy differently, they are absorbed, reflected or transmitted in different proportions.Currently, there are many l<strong>and</strong> resource remote sensing satellites that have sensors operating in the green,red, near infrared <strong>and</strong> short wave Infra red regions <strong>of</strong> the electromagnetic spectrum giving a definite spectralsignature <strong>of</strong> various targets due to difference in radiation absorption <strong>and</strong> reflectance <strong>of</strong> targets. Thesesensors are <strong>of</strong> common use for l<strong>and</strong> cover studies, including wetl<strong>and</strong>s. Figure 1 shows typical spectralsignature <strong>of</strong> few targets from green to SWIR region. Converted to image, in a typical false colour composite(FCC) created using NIR, red <strong>and</strong> green b<strong>and</strong>s assigned as red, green <strong>and</strong> blue colour, the features becomevery distinct as shown in Figure 2. In FCC, the vegetation thus appears invariably red (due to high reflectionin NIR from green leaves).Since the early 1960s, several satellites with suitable sensors have been launched into orbit to observe <strong>and</strong>monitor the earth <strong>and</strong> its environment. Most early satellite sensors acquired data for meteorological purposes.The advent <strong>of</strong> earth resources satellite sensors (those with a primary objective <strong>of</strong> mapping <strong>and</strong> monitoringl<strong>and</strong> cover) occurred, when the first L<strong>and</strong>sat satellite was launched in July 1972. Currently, more than adozen orbiting satellites <strong>of</strong> various types provide data crucial to improving our knowledge <strong>of</strong> the earth’satmosphere, oceans, ice <strong>and</strong> snow, <strong>and</strong> l<strong>and</strong>. Of particular interest to India is the indigenous series <strong>of</strong>satellites called Indian Remote Sensing satellites (IRS-Series). Since the launch <strong>of</strong> the first satellite IRS 1A in1987, India has now a number <strong>of</strong> satellites providing data in multi-spectral b<strong>and</strong>s with different spatialresolution. IRS P6/RESOURCESAT 1 is the current generation satellite that provides multi-spectral images inspatial resolution <strong>of</strong> 5.8 m (LISS IV), 23.5 m (LISS III) <strong>and</strong> 56m (AWiFS). Over the past few decades, Indianremote sensing data has been successfully used in various fields <strong>of</strong> natural resources (Navalgund et al,2002).Development <strong>of</strong> technologies like Geographic Information System (GIS) has enhanced the use <strong>of</strong> RS data toobtain accurate geospatial database. GIS specialises in h<strong>and</strong>ling related, spatially referenced data, combiningmapped information with other data <strong>and</strong> acts as analytical tool for research <strong>and</strong> decision making. During thepast few decades, technological advances in the field <strong>of</strong> satellite remote sensing (RS) sensors, computerizedmapping techniques, global positioning system (GPS) <strong>and</strong> geographic information system (GIS) hasenhanced the ability to capture more detailed <strong>and</strong> timely information about the natural resources at variousscales catering to local, regional, national <strong>and</strong> global level study.Figure 1: Spectral Signature <strong>of</strong> various targets2
RedGreenNIR RED GREENNIRSWIRFigure 2: Various l<strong>and</strong> features as they appear in four spectral b<strong>and</strong>s <strong>and</strong> in a typical three b<strong>and</strong> FCC.3
1.3 Wetl<strong>and</strong> Inventory <strong>of</strong> IndiaIndia with its large geographical spread supports large <strong>and</strong> diverse wetl<strong>and</strong> classes, some <strong>of</strong> which areunique. Wetl<strong>and</strong>s, variously estimated to be occupying 1-5 per cent <strong>of</strong> geographical area <strong>of</strong> the country,support about a fifth <strong>of</strong> the known biodiversity. Like any other place in the world, there is a looming threat tothe aquatic biodiversity <strong>of</strong> the Indian wetl<strong>and</strong>s as they are <strong>of</strong>ten under a regime <strong>of</strong> unsustainable humanpressures. Sustainable management <strong>of</strong> these assets therefore is highly relevant. Realising this, Govt. <strong>of</strong> Indiahas initiated many appropriate steps in terms <strong>of</strong> policies, programmes <strong>and</strong> plans for the preservation <strong>and</strong>conservation <strong>of</strong> these ecosystems. India is a signatory to the Ramsar Convention for management <strong>of</strong>wetl<strong>and</strong>, for conserving their biodiversity <strong>and</strong> wise use extending its scope to a wide variety <strong>of</strong> habitats,including rivers <strong>and</strong> lakes, coastal lagoons, mangroves, peat-l<strong>and</strong>s, coral reefs, <strong>and</strong> numerous human-madewetl<strong>and</strong>, such as fish <strong>and</strong> shrimp ponds, farm ponds, irrigated agricultural l<strong>and</strong>, salt pans reservoirs, gravelpits, sewage farms, <strong>and</strong> canals. The <strong>Ministry</strong> <strong>of</strong> <strong>Environment</strong> <strong>and</strong> <strong>Forests</strong> has identified a number <strong>of</strong> wetl<strong>and</strong>sfor conservation <strong>and</strong> management under the National Wetl<strong>and</strong> Conservation Programme <strong>and</strong> some financialassistance is being provided to State Governments for various conservation activities through approval <strong>of</strong> theManagement Action Plans. The need to have an updated map database <strong>of</strong> wetl<strong>and</strong>s that will support suchactions has long been realized.Mapping requires a st<strong>and</strong>ard classification system. Though there are many classification systems forwetl<strong>and</strong>s in the world, the Ramsar classification system is the most preferred one. The 1971 RamsarConvention on Wetl<strong>and</strong>s <strong>of</strong> International Importance especially as Waterfowl Habitat is the oldestconservation convention. It owes its name to its place <strong>of</strong> adoption in Iran. It came into being due to seriousdecline in populations <strong>of</strong> waterfowl (mainly ducks) <strong>and</strong> conservation <strong>of</strong> habitats <strong>of</strong> migratory waterfowl.Convention provides framework for the conservation <strong>and</strong> ‘wise use’ <strong>of</strong> wetl<strong>and</strong> biomes. Ramsar convention isthe first modern global intergovernmental treaty on conservation <strong>and</strong> wise use <strong>of</strong> natural resources(www.ramsar.org). Ramsar convention entered into force in 1975. Under the text <strong>of</strong> the Convention (Article1.1) wetl<strong>and</strong>s are defined as:“areas <strong>of</strong> marsh, fen, peat-l<strong>and</strong> or water, whether natural or artificial, permanent or temporary, with water thatis static or flowing, fresh, brackish or salt, including areas <strong>of</strong> marine water the depth <strong>of</strong> which at low tide doesnot exceed six meters”.In addition, the Convention (Article 2.1) provides that wetl<strong>and</strong>s:“may incorporate riparian <strong>and</strong> coastal zones adjacent to the wetl<strong>and</strong>s, <strong>and</strong> isl<strong>and</strong>s or bodies <strong>of</strong> marine waterdeeper than six meters at low tide lying within the wetl<strong>and</strong>s”.The first scientific mapping <strong>of</strong> wetl<strong>and</strong>s <strong>of</strong> India was carried out during1992-93 by Space Applications Centre(ISRO), Ahmedabad, at the behest <strong>of</strong> the <strong>Ministry</strong> <strong>of</strong> <strong>Environment</strong> <strong>and</strong> <strong>Forests</strong> (MoEF), Govt. <strong>of</strong> India usingremote sensing data from Indian Remote Sensing satellites (IRS-Series). The mapping was done at1:250,000 scale using IRS 1A LISS-I/II data <strong>of</strong> 1992-93 timeframe under the Nation-wide Wetl<strong>and</strong> MappingProject. Since, no suitable wetl<strong>and</strong> classification existed for comprehensive inventory <strong>of</strong> wetl<strong>and</strong>s in thecountry at that time; the project used a classification system based on Ramsar Convention definition <strong>of</strong>wetl<strong>and</strong>s. The classification considers all parts <strong>of</strong> a water mass including its ecotonal area as wetl<strong>and</strong>. Inaddition, fish <strong>and</strong> shrimp ponds, saltpans, reservoirs, gravel pits were also included as wetl<strong>and</strong>s. Thisinventory put the wetl<strong>and</strong> extent (inl<strong>and</strong> as well as coastal) at about 8.26 million ha (Garg et al, 1998). Theseestimates (24 categories) do not include rice/paddy fields, rivers, canals <strong>and</strong> irrigation channels.Further updating <strong>of</strong> wetl<strong>and</strong> maps <strong>of</strong> India was carried out by SAC using IRS P6/Resourcesat AWiFS data <strong>of</strong>2004-05 at 1:250000 scale. In recent years, a conservation atlas has been brought out by Salim Ali Centre forOrnithology <strong>and</strong> Natural History (SACON, 2004), which provide basic information required by stakeholders inboth wetl<strong>and</strong> habitat <strong>and</strong> species conservation. Space Applications Centre has carried out many pilot projectsfor development <strong>of</strong> GIS based wetl<strong>and</strong> information system (Patel et al, 2003) <strong>and</strong> Lake Information system(Singh et al, 2003).4
2.0 NATIONAL WETLAND INVENTORY AND ASSESSMENT (NWIA) PROJECTRealising the importance <strong>of</strong> many small wetl<strong>and</strong>s that dot the Indian l<strong>and</strong>scape, it has been unanimously feltthat inventory <strong>of</strong> the wetl<strong>and</strong>s at 1:50,000 scale is essential. The task seemed challenging in view <strong>of</strong> the vastgeographic area <strong>of</strong> our country enriched with diverse wetl<strong>and</strong> classes. Space Applications Centre with itsexperience in use <strong>of</strong> RS <strong>and</strong> GIS in the field <strong>of</strong> wetl<strong>and</strong> studies, took up this challenging task. This is furtherstrengthened by the fact that guidelines to create geospatial framework, codification scheme, data basestructure etc. for natural resources survey has already been well established by the initiative <strong>of</strong> ISRO undervarious national level mapping projects. With this strength, the National Wetl<strong>and</strong> Inventory <strong>and</strong> Assessment(NWIA) project was formulated by SAC, which was approved <strong>and</strong> funded by MoEF.The main objectives <strong>of</strong> the project are:• To map the wetl<strong>and</strong>s on 1:50000 scale using two date (pre <strong>and</strong> post monsoon) IRS LISS III digital datafollowing a st<strong>and</strong>ard wetl<strong>and</strong> classification system.• Integration <strong>of</strong> ancillary theme layers ( road, rail, settlements, drainage, administrative boundaries)• Creation <strong>of</strong> a seamless database <strong>of</strong> the states <strong>and</strong> country in GIS environment.• Preparation <strong>of</strong> State-wise wetl<strong>and</strong> atlases.The project was initiated during 2007. The first task was to have a classification system that can be used bydifferent types <strong>of</strong> users while amenable to database. An expert/peer group was formed <strong>and</strong> the peer reviewwas held at SAC on June 2007 where wetl<strong>and</strong> experts <strong>and</strong> database experts participated <strong>and</strong> finalized theclassification system. It was agreed to follow the classification system that has been used for the earlierproject <strong>of</strong> 1:250,000 scale, with slight modification. Modified National Wetl<strong>and</strong> Classification system forwetl<strong>and</strong> delineation <strong>and</strong> mapping comprise 19 wetl<strong>and</strong> classes which are organized under a Level IIIhierarchical system. The definition <strong>of</strong> each wetl<strong>and</strong> class <strong>and</strong> its interpretation method was finalized.The technical/procedure manual was prepared as the st<strong>and</strong>ard guideline for the project execution across thecountry (Garg <strong>and</strong> Patel, 2007). The present atlas is part <strong>of</strong> the national level data base <strong>and</strong> deals with thestate <strong>of</strong> <strong>Assam</strong>.2.1 Wetl<strong>and</strong> Classification SystemIn the present project, Modified National Wetl<strong>and</strong> Classification system is used for wetl<strong>and</strong> delineation <strong>and</strong>mapping comprising 19 wetl<strong>and</strong> classes which are organized under a Level III hierarchical system (Table 1).Level one has two classes: inl<strong>and</strong> <strong>and</strong> coastal, these are further bifurcated into two categories as: natural <strong>and</strong>man-made under which the 19 wetl<strong>and</strong> classes are suitably placed. Two-date data pertaining to pre-monsoon<strong>and</strong> post-monsoon was used to confirm the classes. Wetl<strong>and</strong>s put to agriculture use in any <strong>of</strong> the two datesare not included as wetl<strong>and</strong> class. Definitions <strong>of</strong> wetl<strong>and</strong> categories used in the project is given in Annexure-I.2.2 Spatial Framework <strong>and</strong> GIS DatabaseThe National Spatial Framework (NSF) has been used as the spatial framework to create the database(Anon. 2005a). The database design <strong>and</strong> creation st<strong>and</strong>ard suggested by NRDB/NNRMS guidelines isfollowed. Feature codification scheme for every input element has been worked out keeping in view thenationwide administrative as well as natural hierarchy (State-district- within the feature class for each <strong>of</strong> thetheme. All data elements are given a unique name, which are self explanatory with short forms.Following wetl<strong>and</strong> layers are generated for each inl<strong>and</strong> wetl<strong>and</strong>:• Wetl<strong>and</strong> extent: As wetl<strong>and</strong>s encompass open water, aquatic vegetation (submerged, floating <strong>and</strong>emergent), the wetl<strong>and</strong> boundary should ideally include all these. Satellite image gives a clear signature<strong>of</strong> the wetl<strong>and</strong> extent from the imprint <strong>of</strong> water spread over the years.• Water spread: There are two layers representing post-monsoon <strong>and</strong> pre-monsoon water spread duringthe year <strong>of</strong> data acquisition.• Aquatic vegetation spread: The presence <strong>of</strong> vegetation in wetl<strong>and</strong>s provides information about itstrophic condition. As is known, aquatic vegetation is <strong>of</strong> four types, viz. benthic, submerged, floating5
<strong>and</strong> emergent. It is possible to delineate last two types <strong>of</strong> vegetation using optical remote sensing data.A qualitative layer pertaining to presence <strong>of</strong> vegetation is generated for each season (as manifested onpre-monsoon <strong>and</strong> post-monsoon imagery).• Turbidity <strong>of</strong> open water: A layer pertaining to a qualitative turbidity rating is generated.Three qualitative turbidity ratings ( low, medium <strong>and</strong> high) is followed for pre- <strong>and</strong> post-monsoonturbidity <strong>of</strong> lakes, reservoirs, barrages <strong>and</strong> other large wetl<strong>and</strong>s.• Small wetl<strong>and</strong>s (smaller than minimum mappable unit: < 2.25 ha) are mapped as point features.• Base layers like major road network, railway, settlements, <strong>and</strong> surface drainage are created (either fromthe current image or taken from other project data base).Table 1: Wetl<strong>and</strong> Classification System <strong>and</strong> codingWettcode* Level I Level II Level III1000 Inl<strong>and</strong> Wetl<strong>and</strong>s1100 Natural1101 Lakes1102 Ox-Bow Lakes/ Cut-Off Me<strong>and</strong>ers1103 High altitude Wetl<strong>and</strong>s1104 Riverine Wetl<strong>and</strong>s1105 Waterlogged1106 River/stream1200 Man-made1201 Reservoirs/ Barrages1202 Tanks/Ponds1203 Waterlogged1204 Salt pans2000 Coastal Wetl<strong>and</strong>s2100 Natural2101 Lagoons2102 Creeks2103 S<strong>and</strong>/Beach2104 Intertidal mud flats2105 Salt Marsh2106 Mangroves2107 Coral Reefs2200 Man-made2201 Salt pans2202 Aquaculture ponds* Wetl<strong>and</strong> type code6
3.0 STUDY AREA<strong>Assam</strong> is one <strong>of</strong> the 7 states <strong>of</strong> Northeast India. It extends between the latitudes <strong>of</strong> 24°8’ N - 28°2’ N <strong>and</strong>longitudes <strong>of</strong> 89°42’ E - 96° E. The T-shaped state is sprawled in an area <strong>of</strong> 78,438 km²(Figure-3). It isbordered by the Indian states <strong>of</strong> Arunachal Pradesh, Nagal<strong>and</strong>, Manipur, Mizoram, Tripura, Meghalaya, <strong>and</strong>West Bengal. The name "<strong>Assam</strong>" is derived from the term "Asom" which, in Sanskrit, refers to unequal orunrivalled. The uneven topography <strong>of</strong> the l<strong>and</strong>, full <strong>of</strong> hills <strong>and</strong> plains might, have contributed to the name.The Mongolian Ahom dynasty that had ruled <strong>Assam</strong> for more than six hundred years might also be the causefor the name. <strong>Assam</strong> can be broadly divided into three distinct physical units, the Brahmaputra Valley in thenorth, the Barak Valley in the narrow protruding south, <strong>and</strong> the state’s hilly region (Mikir <strong>and</strong> Cachar )separating the two valleys. Entering <strong>Assam</strong>, the Brahmaputra becomes a braided river <strong>and</strong> along with itstributaries, creates the flood plain <strong>of</strong> the Brahmaputra Valley. The Brahmaputra Valley in <strong>Assam</strong> isapproximately 80 to 100 km wide <strong>and</strong> almost 1000 km long <strong>and</strong> the width <strong>of</strong> the river itself is 16 km at manyplaces within the valley. The hills <strong>of</strong> Karbi Anglong <strong>and</strong> North Cachar <strong>and</strong> those in <strong>and</strong> around Guwahati <strong>and</strong>North Guwahati (along with the Khasi <strong>and</strong> Garo Hills) are originally parts <strong>of</strong> the South Indian Plateau system.These are eroded <strong>and</strong> dissected by the numerous rivers in the region. Average height <strong>of</strong> these hills in <strong>Assam</strong>varies from 300 to 400mt. The southern Barak Valley is separated by the Karbi Anglong <strong>and</strong> North CacharHills from the Brahmaputra Valley in <strong>Assam</strong>. The Barak originates from the Barail Range in the border areas<strong>of</strong> <strong>Assam</strong>, Nagal<strong>and</strong> <strong>and</strong> Manipur <strong>and</strong> flowing through the district <strong>of</strong> Cachar, it confluences with theBrahmaputra in Bangladesh. Barak Valley in <strong>Assam</strong> is a small valley with an average width <strong>and</strong> length <strong>of</strong>approximately 40 to 50 km.<strong>Assam</strong> weather is characterized by heavy downpour <strong>and</strong> humidity. The hilly areas usually experience subalpineclimatic condition, while excessive sultriness is observed in the plain l<strong>and</strong>s <strong>of</strong> <strong>Assam</strong>. The humidity thatis brought into <strong>Assam</strong> by the southwest monsoons, shower an average annual rainfall <strong>of</strong> 120 inches or moreon the great Brahmaputra valley <strong>and</strong> the surrounding region. The temperature ranges from a maximum <strong>of</strong> 29°to a minimum <strong>of</strong> 16°. <strong>Assam</strong>'s economy is based on agriculture <strong>and</strong> oil. <strong>Assam</strong> produces a significant part <strong>of</strong>the total tea production <strong>of</strong> the world. <strong>Assam</strong> produces more than half <strong>of</strong> India's petroleum.The current state capital <strong>of</strong> <strong>Assam</strong>, Guwahati, was known in ancient time as Pragjyotishpura or The EasternCity <strong>of</strong> Light. Other major towns are Dhubri, Barpeta, Dibrugarh, Tinsukia, Jorhat, Nagaon, Sivasagar, Silchar,Tezpur. The population <strong>of</strong> <strong>Assam</strong> is 26.66 million according to 2001 census <strong>and</strong> is scattered over 26312villages. Administratively, it is divided into 23 districts: Barpeta, Bongaigaon, Cachar, Darrang, Dhemaji,Dhubri, Dibrugarh, Goalpara, Golaghat, Hailak<strong>and</strong>i, Jorhat, Kamrup, Karbi Anglong, Karimganj, Kokrajhar,Lakhimpur, Marigaon, Nagaon, Nalbari, North Cachar Hills, Sibsagar, Sonitpur, <strong>and</strong> Tinsukia.The spatial framework was prepared using 15’ x 15’ grid. The state is covered by 171 Survey <strong>of</strong> Indiatopographic maps on 1:50,000 scale that form the spatial frame work for mapping (Figure 4).A detail <strong>of</strong> district information followed in the atlas is given in Annexure-II.7
Figure 3: Location MapFigure 4: Spatial Framework <strong>of</strong> <strong>Assam</strong>8
4.0 DATA USED4.1 Remote sensing dataIRS P6 LISS III data was used to map the wetl<strong>and</strong>s. IRS P6 LISS III provide data in 4 spectral b<strong>and</strong>s; green,red, Near Infra Red (NIR) <strong>and</strong> Short wave Infra Red (SWIR), with 23.5 m spatial resolution <strong>and</strong> 24 day repeatcycle. The spatial resolution is suitable for 1:50,000 scale mapping. The state <strong>of</strong> <strong>Assam</strong> is covered in 17 IRSLISS III scene (Figure 5). Two date data, one acquired during March <strong>and</strong> another during January were usedto capture the pre-monsoon <strong>and</strong> post-monsoon hydrological variability <strong>of</strong> the wetl<strong>and</strong>s respectively (Table-2).Figure 6 shows the overview <strong>of</strong> the part <strong>of</strong> <strong>Assam</strong> as seen in the LISS III FCC <strong>of</strong> post-monsoon pre-monsoondata respectively.4.2 Ground truth dataRemote sensing techniques require certain amount <strong>of</strong> field observation called “ground truth” in order toconvert into meaningful information. Such work involves visiting a number <strong>of</strong> test sites, usually taking thesatellite images. The location <strong>of</strong> the features is recorded using the GPS. The st<strong>and</strong>ard pr<strong>of</strong>orma as per theNWIA manual was used to record the field data. Field photographs are also taken to record the water quality(subjective), status <strong>of</strong> aquatic vegetation <strong>and</strong> water spread. All field verification work has been done duringOctober <strong>and</strong> November 2008.4.3 Other dataSurvey <strong>of</strong> India topographical maps (SOI) were used for reference purpose. Lineage data <strong>of</strong> National Wetl<strong>and</strong>Maps at 1:250,000 scale was used for reference.Figure 5: IRS P6 LISS-III coverage (path-row) <strong>of</strong> <strong>Assam</strong>9
Table-2: Satellite data usedSr. IRS P6 LISS-III DataDate <strong>of</strong> AcquisitionNo. (Path / Row)Post-monsoonPre-monsoon1 109-52 October 27, 2006 March 20, 20072 109-53 October 27, 2006 March 20, 20073 110-52 November 06, 2005 May 17, 20064 110-53 November 01, 2006May 17, 2006 &March 25, 20075 111-52 November 11, 2005 January 03, 20076 111-53 November 30, 2006 March 30, 20077 111-54 November 30, 2006 March 30, 20078 111-55 November 11, 2005 -9 112-52 December 05, 2006January 27, 2006 &April 14, 200510 112-53December 10, 2005 &March 11, 2007 &December 05, 2006April 14, 200511 112-54December 10, 2005 &December 05, 2006January 22, 200712 112-55 December 10, 2005 -13 113-52 January 27, 2007 May 03, 200714 113-53 January 27, 2007 May 03, 200715 113-54 January 27, 2007 May 03, 200716 114-52 September 15, 2005 April 14, 200717 114-53 September 15, 2005 February 06, 200610
October 27, 2006March 20, 2007Figure 6: IRS LISS-III FCC (Post-monsoon <strong>and</strong> Pre-monsoon): Part <strong>of</strong> <strong>Assam</strong> state11
5.0 METHODOLOGYThe methodology to create the state level atlas <strong>of</strong> wetl<strong>and</strong>s is adhered to NWIA technical guidelines <strong>and</strong>procedure manual (Garg <strong>and</strong> Patel, 2007). The overview <strong>of</strong> the steps used is shown in Figure 7. Salientfeatures <strong>of</strong> methodology adopted are• Generation <strong>of</strong> spatial framework in GIS environment for database creation <strong>and</strong> organisation.• Geo-referencing <strong>of</strong> satellite data• Identification <strong>of</strong> wetl<strong>and</strong> classes as per the classification system given in NWIA Manual <strong>and</strong> mapping <strong>of</strong>the classes using a knowledge based digital classification <strong>and</strong> onscreen interpretation• Generation <strong>of</strong> base layers (rail, road network, settlements, drainage, administrative boundaries) fromsatellite image <strong>and</strong> ancillary data.• Mosaicing/edge matching to create district <strong>and</strong> state level database.• Coding <strong>of</strong> the wetl<strong>and</strong>s following the st<strong>and</strong>ard classification system <strong>and</strong> codification as per NWIAmanual.• Preparation <strong>of</strong> map compositions <strong>and</strong> generation <strong>of</strong> statistics• Outputs on A3 size prints <strong>and</strong> charts for atlas.Work was carried out using ERDAS Imagine, Arc/Info <strong>and</strong> Arcgis s<strong>of</strong>twares.5.1 Creation <strong>of</strong> Spatial FrameworkThis is the most important task as the state forms a part <strong>of</strong> the national frame work <strong>and</strong> covered in multiplemap sheets. To create NWIA database, NNRMS/NRDB st<strong>and</strong>ards is followed <strong>and</strong> four corners <strong>of</strong> the1:50,000 (15’ x 15’) grid is taken as the tics or registration points to create each map taking master grid as thereference. Spatial framework details are given in NWIA manual (Patel <strong>and</strong> Garg, 2007). The spatialframework for <strong>Assam</strong> state is shown in Figure 4.5.2 Geo-referencing <strong>of</strong> Satellite DataIn this step the raw satellite images were converted to specific map projection using geometric correction.This is done using archive geometrically corrected LISS III data (ISRO-NRC-l<strong>and</strong> use / l<strong>and</strong> cover project).St<strong>and</strong>ard image processing s<strong>of</strong>tware was used for geo-referencing. First one date data was registered withthe archive image. The second date data was then registered with the first date data.5.3 Mapping <strong>of</strong> Wetl<strong>and</strong>sThe delineation <strong>of</strong> wetl<strong>and</strong>s through image analysis forms the foundation for deriving all wetl<strong>and</strong> classes <strong>and</strong>results. Consequently, a great deal <strong>of</strong> emphasis has been placed on the quality <strong>of</strong> the image Interpretation. Inthe present study, the mapping <strong>of</strong> wetl<strong>and</strong>s was done following digital classification <strong>and</strong> onscreen visualinterpretation. Wetl<strong>and</strong>s were identified based on vegetation, visible hydrology <strong>and</strong> geography. There arevarious methods for extraction <strong>of</strong> water information from remote sensing imagery, which according to thenumber <strong>of</strong> b<strong>and</strong>s used, are generally divided into two categories, i.e. Single-b<strong>and</strong> <strong>and</strong> multi-b<strong>and</strong> methods.Single-b<strong>and</strong> method usually involves choosing a b<strong>and</strong> from multi-spectral image to distinguish water froml<strong>and</strong> by subjective threshold values. It may lead to over- or under-estimation <strong>of</strong> open water area. Multi-b<strong>and</strong>method takes advantage <strong>of</strong> reflective differences <strong>of</strong> each b<strong>and</strong>.In this project, five indices known in literature that enhances various wetl<strong>and</strong> characteristics were used(McFeetres, 1986; Xu Hanqiu, 2006; Lacaux et al, 2007; Townshend <strong>and</strong> Justice, 1986; Tucker <strong>and</strong> Sellers,1986) as given below:i) Normalised Difference Water Index (NDWI) = (Green-NIR) / (Green + NIR)ii)iii)iv)Modified Normalised Difference Water Index (MNDWI) = (Green-MIR) / (Green + MIR)Normalised Difference Vegetation Index (NDVI) = (NIR - Red) / (NIR + Red)Normalised Difference Pond Index (NDPI) = (MIR – Green / MIR + Green)v) Normalised Difference Turbidity Index (NDTI) = (Red – Green) / (Red + Green)12
IRS P6 LISS III(pre- <strong>and</strong> post-monsoon data)Spatial frame workLegacy dataGeo-referenced imagesAdmin. Boundaries(State, District)On-screen interpretation/Digital analysisSOI topographic mapsGround truthMorphometric(Wetl<strong>and</strong> extent)Physical(Wetl<strong>and</strong> type)Biological(Wetl<strong>and</strong> vegetation)Base layers(Road, Settlement, drainage)Quality CheckGIS DATABASE(Wetl<strong>and</strong> layers, Base layers)NWIA Database Organisation(District, State, Country)Accuracy Assessment/Quality CheckAnalysisAtlases/ReportFigure 7: Flow chart <strong>of</strong> the methodology usedThe indices were generated using st<strong>and</strong>ard image processing s<strong>of</strong>tware, stacked as layers (Figure 8). Variouscombinations <strong>of</strong> the indices/spectral b<strong>and</strong>s were used to identify the wetl<strong>and</strong> features as shown in Figure 9.The following indices were used for various layer extractions:• Extraction <strong>of</strong> wetl<strong>and</strong> extent :MNDWI, NDPI <strong>and</strong> NDVI image was used to extract the wetl<strong>and</strong> boundary through suitable hierarchicalthresholds.• Extraction <strong>of</strong> open water :MNDWI was used with in the wetl<strong>and</strong> mask to delineate the water <strong>and</strong> no-water areas.• Extraction <strong>of</strong> wetl<strong>and</strong> vegetation :NDPI <strong>and</strong> NDVI image was used to generate the vegetation <strong>and</strong> no-vegetation areas within a wetl<strong>and</strong>using a suitable threshold.• Turbidity information extraction :MNDWI image was used to generate qualitative turbidity level (high, moderate <strong>and</strong> low) based onfollowing steps:a) Conversion <strong>of</strong> post <strong>and</strong> pre-monsoon water spread polygons into Area <strong>of</strong> Interest (AoI).b) Grouping <strong>of</strong> all AoIs excluding all non-wetl<strong>and</strong> areas into a single entity.c) Generate a signature statistics like minimum, maximum, mean <strong>and</strong> st<strong>and</strong>ard deviations.d) Generate a raster turbidity image through a model for AoI only with conditional categorisation.e) Convert the raster into vector <strong>and</strong> update the attributes or edit the water spread layer (copied asturbidity layer) in polygon mode so as to retain all the attributes.f) Assign turbidity classes as per the table 3.13
Table 3: Qualitative turbidity ratingsSr. No. Qualitative Turbidity Conditional criteria Hue on False Colour Composite (FCC)1. Low > +1σ Dark blue/blackish2. Moderate > -1σ to
Map composition for atlas has been done at district <strong>and</strong> state level. A st<strong>and</strong>ard color scheme has been usedfor the wetl<strong>and</strong> classes <strong>and</strong> other layers. The digital files are made at 1:50,000 scale. The hard copy outputsare taken in A3 size.Open waterMNDWI NDPI NDVIUseful for wetl<strong>and</strong> boundary extraction/delineationG R NIRVegetationOpen waterNDWI NDVI NDPIUseful for wetl<strong>and</strong> vegetation & open water featuresG R SWIRDipor Beel,IRS LISS III data, 01 November 2006HighMNDWI MNDWI NDTIUseful for qualitative turbidity delineationFigure 9: Various combinations <strong>of</strong> the indices/spectral b<strong>and</strong>s used to identify wetl<strong>and</strong> components15
6.0 ACCURACY ASSESSMENTA comprehensive accuracy assessment protocol has been followed for determining the quality <strong>of</strong> informationderived from remotely sensed data. Accuracy assessment involves determination <strong>of</strong> thematic (classification)as well as location accuracy. In addition, GIS database(s) contents have been also evaluated for accuracy.To ensure the reliability <strong>of</strong> wetl<strong>and</strong> status data, the project adhered to established quality assurance <strong>and</strong>quality control measures for data collection, analysis, verification <strong>and</strong> reporting.This study used well established, time-tested, fully documented data collection conventions. It employedskilled <strong>and</strong> trained personnel for image interpretation, processing <strong>and</strong> digital database creation. All interpretedimagery was reviewed by technical expert team for accuracy <strong>and</strong> code. The reviewing analyst adhered to allst<strong>and</strong>ards, quality requirements <strong>and</strong> technical specifications <strong>and</strong> reviewed 100 percent <strong>of</strong> the work. Thevarious stages <strong>of</strong> quality check include:1. Image-Image Geo-referencing/Data generation2. Reference layer preparation using NWIA post monsoon <strong>and</strong> pre-monsoon LISS-III data.3. Wetl<strong>and</strong> mapping using visual/digital interpretation techniques.4. Geo-data base creation <strong>and</strong> organization5. Output products.6.1 Data verification <strong>and</strong> quality assurance <strong>of</strong> output digital data filesAll digital data files were subjected to rigorous quality control inspections. Digital data verification includedquality control checks that addressed the geospatial correctness, digital integrity <strong>and</strong> some cartographicaspects <strong>of</strong> the data. Implementation <strong>of</strong> quality checks ensured that the data conformed to the specifiedcriteria, thus achieving the project objectives. There were tremendous advantages in using newertechnologies to store <strong>and</strong> analyze the geographic data. The geospatial analysis capability built into this studyprovided a complete digital database to better assist analysis <strong>of</strong> wetl<strong>and</strong> change information. All digital datafiles were subjected to rigorous quality control inspections. Automated checking modules incorporated in thegeographic information system (Arc/GIS) were used to correct digital artifacts including polygon topology.Additional customized data inspections were made to ensure that the changes indicated at the imageinterpretation stage were properly executed.16
MAPS AND STATISTICS17
7.0 WETLANDS OF ASSAM: MAPS AND STATISTICSArea estimates <strong>of</strong> various wetl<strong>and</strong> categories for <strong>Assam</strong> have been carried out using GIS layers <strong>of</strong> wetl<strong>and</strong>boundary, water-spread, aquatic vegetation <strong>and</strong> turbidity. Total 5097 wetl<strong>and</strong>s have been mapped at1:50,000 scale in the state. In addition, 6081small wetl<strong>and</strong>s (< 2.25 ha) have also been identified. Totalwetl<strong>and</strong> area estimated is 764372 ha that is around 9.74 per cent <strong>of</strong> the geographic area (Table-4). Naturalwetl<strong>and</strong>s dominate the state. The major wetl<strong>and</strong> types are River/Stream accounting for 84 percent <strong>of</strong> thewetl<strong>and</strong>s (637164 ha), Lake/Ponds (51257 ha), waterlogged (47141 ha) <strong>and</strong> Ox-bow lakes (14173 ha). Thereare two Reservoir/Barrarges mapped with 2833 ha area, which is the major man made wetl<strong>and</strong> type.Graphical distribution <strong>of</strong> wetl<strong>and</strong> type is shown in Figure 10.Aquatic vegetation is observed in Lakes/pond, Waterlogged, Riverine wetl<strong>and</strong> type. The area under aquaticvegetation is more during pre monsoon (76036 ha) than that <strong>of</strong> post monsoon (36817 ha). The open waterspread in River/stream showed very little seasonal fluctuations. However, the open water spread in case <strong>of</strong>Lakes/ponds, Waterlogged is significantly lower during pre monsoon compared to post monsoon.Sr.No.WettcodeTable-4: Area estimates <strong>of</strong> wetl<strong>and</strong>s in <strong>Assam</strong>Wetl<strong>and</strong> CategoryNumber<strong>of</strong>Wetl<strong>and</strong>sTotalWetl<strong>and</strong>Area% <strong>of</strong>wetl<strong>and</strong>areaArea in haOpen WaterPostmonsoonAreaPremonsoonArea1100 Inl<strong>and</strong> Wetl<strong>and</strong>s - Natural1 1101 Lakes/Ponds 1175 51257 6.71 34408 145262 1102 Ox-bow lakes/ Cut-<strong>of</strong>f me<strong>and</strong>ers 873 14173 1.85 7721 58483 1103 High altitude wetl<strong>and</strong>s - - - - -4 1104 Riverine wetl<strong>and</strong>s 139 4258 0.56 1669 9425 1105 Waterlogged 2461 47141 6.17 33660 126306 1106 River/Stream 213 637164 83.63 342197 3537561200 Inl<strong>and</strong> Wetl<strong>and</strong>s -Man-made7 1201 Reservoirs/Barrages 2 2833 0.37 2185 13468 1202 Tanks/Ponds 180 921 0.12 892 8019 1203 Waterlogged 54 544 0.07 336 303Sub-Total 5097 758291 99.20 423068 390152Wetl<strong>and</strong>s (
District-wise wetl<strong>and</strong> area estimates is given in Table-5. Figure 11 shows district-wise graphical distribution <strong>of</strong>wetl<strong>and</strong>s. Wetl<strong>and</strong> statistics followed by wetl<strong>and</strong> map <strong>and</strong> corresponding satellite data for each district isgiven to have a fairly good idea about the distribution pattern <strong>and</strong> density <strong>of</strong> wetl<strong>and</strong>s in the district..Figure 10: Type-wise wetl<strong>and</strong> distribution in <strong>Assam</strong>Table-5: District-wise wetl<strong>and</strong> AreaSr.No.DistrictGeographicArea(sq. km)Wetl<strong>and</strong>Area(ha)% <strong>of</strong>totalwetl<strong>and</strong>area% <strong>of</strong> districtGeographicarea01 Kokrajhar 3129 24833 3.25 7.9402 Dhubri 2838 56538 7.40 19.9203 Goalpara 1824 33221 4.35 18.2104 Bongaigaon 2510 22149 2.90 8.8205 Barpeta 3245 59038 7.72 18.1906 Kamrup 4345 43655 5.71 10.0507 Nalbari 2257 20140 2.63 8.9208 Darrang 3481 48983 6.41 14.0709 Marigaon 1704 28737 3.76 16.8610 Nagaon 3831 35695 4.67 9.3211 Sonitpur 5324 83427 10.91 15.6712 Lakhimpur 2277 27307 3.57 11.9913 Dhemaji 3237 33468 4.38 10.3414 Tinsukia 3790 40626 5.31 10.7215 Dibrugarh 3381 72461 9.48 21.4316 Sibsagar 2668 12582 1.65 4.7217 Jorhat 2851 45979 6.02 16.1318 Golaghat 3502 43635 5.71 12.4619 Karbi Anglong 10434 5810 0.76 0.5620 North Cachar Hills 4888 6619 0.87 1.3521 Cachar 3786 10419 1.36 2.7522 Karimganj 1809 6450 0.84 3.5723 Hailak<strong>and</strong>i 1327 2600 0.34 1.96Total 78438 764372 100.00 9.7420
Figure 11: District-wise graphical distribution <strong>of</strong> wetl<strong>and</strong>s21
7.1.1 KokrajharKokrajhar district is situated in the lower Brahmaputra valley <strong>of</strong> <strong>Assam</strong> between 26 o 20'N <strong>and</strong> 26 o 45'N latitudes<strong>and</strong> 89 o 45'E <strong>and</strong> 91 o 00'E longitudes. It occupies 3,49,800 hectares <strong>of</strong> area. The district is bounded by the interstate boundary <strong>of</strong> West Bengal on the west <strong>and</strong> Bhutan in the north. The topography <strong>of</strong> the district is almost flat,with elevations ranging from 303 meter above m.s.l. in the north <strong>and</strong> 18 metre above m.s.l. in the south.Themajor rivers flowing through the district are Gaurang, Ai <strong>and</strong> Sankosh. All the rivers originate from Bhutan hills<strong>and</strong> flow into the Brahmaputra. The soil in the hillocks is old mountain valley alluvial <strong>and</strong> in the foot hills, it ismainly s<strong>and</strong>y to loamy textured soils. The soil pH ranges from 4.7 to 7.8 i.e. acidic in nature. During monsoon itreceives an average rainfall <strong>of</strong> 248 mm, while in the post monsoon season 280 mm. The maximum <strong>and</strong>minimum temperatures in the district are 38 o C <strong>and</strong> 10 o C respectively. As per Census Report, 2001, the districthas a total population <strong>of</strong> 9, 05,764.Natural Inl<strong>and</strong> wetl<strong>and</strong>s dominated the district. Total area under wetl<strong>and</strong> is 24833 ha, which includes 152 smallwetl<strong>and</strong> (
7.1.3 GoalparaGoalpara district is situated in the south western part <strong>of</strong> <strong>Assam</strong> between 25°53' N <strong>and</strong> 26° 30' N latitudes <strong>and</strong>90°07' E <strong>and</strong> 91°05' E longitudes having 1,91,100 hectares <strong>of</strong> area. The Brahmaputra River is flowing along thenorthern boundary <strong>of</strong> the district in the east-west direction. The other two main rivers are Dudhnai <strong>and</strong> Jinjiram.Dhudnai <strong>and</strong> Krishnai rivers originating from hills <strong>of</strong> Meghalaya. The rivers are all perennial in nature. Thetopography <strong>of</strong> the district is characterised by an almost flat plain except for few hills with elevations ranging from100 to 500 meters. The soils <strong>of</strong> the district consist <strong>of</strong> Newer Alluvium on the bank <strong>of</strong> the Bramhaputra <strong>and</strong> OlderAlluvium near the hillocks <strong>and</strong> foot hills. The soil pH ranges from 5.5 to 6.8. The maximum temperature rises upto 33 o C during July <strong>and</strong> August but the minimum temperature falls up to 7 o C in January. The average annualrainfall in the district is 1614 mm. As per Census Report, 2001, the district has a total population <strong>of</strong> 8, 22,035 .Anumber <strong>of</strong>` wetl<strong>and</strong>s (locally called as Beels) viz. Urpad beel, Hasila beel <strong>and</strong> several artificial ponds exist in thedistrict.Total wetl<strong>and</strong> area in the district is 33221 ha that includes 151 small wetl<strong>and</strong>s (
7.1.4 BongaigaonThe district is situated in the northwestern part <strong>of</strong> <strong>Assam</strong> between 26 o 10'N <strong>and</strong> 26 o 45'N latitudes <strong>and</strong> 90 o 50'E<strong>and</strong> 91 o 00'E longitudes. It occupies 2, 15,900 hectares <strong>of</strong> area. It is bounded on the east by Barpeta <strong>and</strong> on thewest by Dhubri district. The topography <strong>of</strong> the district is n almost flat plain except for few hills with elevationsranging from 100 to 500 metres. The Brahmaputra River flows along the southern part <strong>of</strong> the district. The othertwo main rivers are Manas <strong>and</strong> Ai. Both the rivers rise on the hills <strong>of</strong> Bhutan, The Rivers are perennial in nature.There are considerable flood prone areas in the district, caused mainly due to inundation by overflowing rivers<strong>and</strong> congestion <strong>of</strong> rain water run <strong>of</strong>f from the l<strong>and</strong> side. A number <strong>of</strong>`beels (natural lakes) exist in the district viz.Tamranga , Konara <strong>and</strong> Dalani. Several artificial ponds are also seen in the district. The soils <strong>of</strong> the districtconsist <strong>of</strong> Newer Alluvium on the bank <strong>of</strong> the Bramhaputra <strong>and</strong> Older Alluvium near the hillocks <strong>and</strong> foot hills.The soil pH ranges from 5.5 to 6.8. The average annual rainfall in the district is 1,614 mm. The maximumtemperature rises up to 33 o C during July <strong>and</strong> August but the minimum temperature falls up to 7 o C in January.As per Census Report, 2001, the district has a total population <strong>of</strong> 9, 04,835.Total wetl<strong>and</strong> area in the district is 22149 ha that includes 71 small wetl<strong>and</strong>s (
7.1.5 BarpetaThe district is situated in the lower Brahmaputra valley <strong>of</strong> <strong>Assam</strong> between 26°5'N <strong>and</strong> 26°51 'N latitudes <strong>and</strong>90 o 38'E <strong>and</strong> 91°20'E longitudes. It occupies 320704 hectares <strong>of</strong> area. It is bounded by Nalbari District on theeast <strong>and</strong> its north boundary is marked by the kingdom <strong>of</strong> Bhutan.The district is characterised by almost plaintopography with the highest elevation <strong>of</strong> 200 m above m.s.l. in north, while in the south it is below 18 m abovem.s.l. The rivers flowing through the district are Tihu, Kaldia, Pahumara, Palla, Beki <strong>and</strong> Bhalukadoba whichoriginate from Bhutan hills <strong>and</strong> are perennial in nature. The southern side <strong>of</strong> the district is very low lying <strong>and</strong> isfrequently subjected to flood. Besides these, there are a number <strong>of</strong> small streams, ab<strong>and</strong>oned channels <strong>and</strong>marshy l<strong>and</strong>s. The major soil groups are Recent Riverine Alluvial Soil (Entisols), Old Riverine Alluvial soils(Inceptisols) <strong>and</strong> Old Mountain Valley Alluvial soils (Alfisols). The general pH value <strong>of</strong> the soils <strong>of</strong> the districtvaries from 4.5 to 7.3 i.e. acidic to neutral. The area receives an average rainfall <strong>of</strong> 1409 mm. The maximum<strong>and</strong> minimum temperatures recorded for the district are 35°C <strong>and</strong> 7°C respectively. As per Census Report,2001, the district has a total population <strong>of</strong> 16, 47,201.Total wetl<strong>and</strong> area in the district is 59038 ha that includes 195 small wetl<strong>and</strong>s (
7.1.6 KamrupThe district is situated in the lower Brahmaputra valley <strong>of</strong> <strong>Assam</strong> between 25°44' N <strong>and</strong> 26°51'N latitudes <strong>and</strong>90 o 56'E <strong>and</strong> 92°10' E longitudes, with total area <strong>of</strong> 4,35,009 hectares. It is bounded by Darrang <strong>and</strong> Nagaondistrict on the east <strong>and</strong> the northern boundary is marked by the Kingdom <strong>of</strong> Bhutan <strong>and</strong> the Southernboundary is covered by Meghalaya State. The northern <strong>and</strong> southern parts <strong>of</strong> the district are characterised byhill ranges. The middle portion <strong>of</strong> the district, being a part <strong>of</strong> the Brahmaputra valley, is characterised byalmost plain topography. The drainage system <strong>of</strong> the district is represented by the river Brahmaputra <strong>and</strong> itstributaries, namely Barnadi, Puthimari, Sessa Noi, Baralia <strong>and</strong> Nona. All these rivers originate from theBhutan hills <strong>and</strong> subsequently flow into the Brahmaputra. Several rivers originating from the Khasi hills in thesouth, namely Digaru, Kulsi, Kukurmara, Boko <strong>and</strong> Singra also flow into the Brahmaputra. The general pHvalue <strong>of</strong> the soils <strong>of</strong> the district varies from 4.5 to 6.2. The average rainfall is 2124 mm. The maximum <strong>and</strong>minimum temperatures recorded in the district are 35°C <strong>and</strong> 6°C respectively. As per Census Report, 2001,the district has a total population <strong>of</strong> 25, 22,324.Total wetl<strong>and</strong> area in the district is 43655 ha that includes 228 small wetl<strong>and</strong>s (
7.1.7 NalbariThe district is situated in the lower Brahmaputra valley <strong>of</strong> <strong>Assam</strong> between 26 o 07’N <strong>and</strong> 26°51’N latitude <strong>and</strong>91°13’E <strong>and</strong> 91°43’E longitude. It occupies 221844 hectares area. The district is characterised by almostplain topography with the highest elevation in the north is 219.6 m. above MSL <strong>and</strong> that in the south below 18m. above m.s.l.. All the rivers are perennial in nature. The rivers flowing through the district are Pagladia,Nona, Baralia, Mara Pagladia <strong>and</strong> Buradia. All these rivers originate from Bhutan hills. There are some smallstreams, ab<strong>and</strong>oned channels <strong>and</strong> marshy l<strong>and</strong>s existing in the district. The soil texture <strong>of</strong> the north zone inthe district is clay loam <strong>and</strong> that <strong>of</strong> south zone s<strong>and</strong>y loam. The soil pH varies from 4.5 to 7.0 i.e. acidic toneutral. The maximum <strong>and</strong> minimum temperatures are 35 o C <strong>and</strong> 6 o C respectively. The normal rainfall in thedistrict is 2685.5 mm. As per Census Report, 2001, the district has a total population <strong>of</strong> 11,48,824.Total wetl<strong>and</strong> area in the district is 20140 ha that includes 239 small wetl<strong>and</strong>s (
7.1.8 DarrangThe district is situated in the northern part <strong>of</strong> <strong>Assam</strong> State between 26°10'N <strong>and</strong> 26°58'N Latitudes <strong>and</strong>91°43'E <strong>and</strong> 92°22'E longitudes. It occupies 341399 hectares <strong>of</strong> area. It is bounded on the east by Sonitpurdistrict, on the north by Bhutan <strong>and</strong> Arunachal Pradesh <strong>and</strong> on the south by the river Brahmaputra. Thetopography <strong>of</strong> the district is almost flat Swampy areas <strong>and</strong> naturally depressed vast wetl<strong>and</strong>s locally known asbeels constitute a sizeable area. The major rivers that traverse through the district are Barnoi, Nanai, Noa-nai,Mangaldai nai, Mora Dhansiri <strong>and</strong> Dhansiri. The rivers are all perennial in nature. Both new Alluvium Soils(Entisols) <strong>and</strong> old Alluvium soils (Inceptisols) are found in the district. The average annual rainfall recorded is1477.72 mm. The maximum temperature recorded is 35.6 o C in the month <strong>of</strong> July-August <strong>and</strong> the minimum is6 o C in the months <strong>of</strong> December - January. As per Census Report, 2001, the district has a total population <strong>of</strong> 15,04,320Total wetl<strong>and</strong> area in the district is 48983 ha that includes 450 small wetl<strong>and</strong>s (
7.1.9 MarigaonThe district is situated in the Central Brahmaputra valley <strong>of</strong> <strong>Assam</strong> between 26 o 00' N <strong>and</strong> 26 o 40'N latitudes <strong>and</strong>91 o 59'E <strong>and</strong> 92 o 35'E longitudes. It occupies 1, 91,100 hectares <strong>of</strong> area. It is bounded on the east by Nagaondistrict,on the west by Kamrup district, on the north by Darrang district <strong>and</strong> south by Karbi Anglong.district. Thetopography <strong>of</strong> the district is almost flat plain.The Brahmaputra river flows on the northern side <strong>of</strong> the district. Theflood plain along the river Brahmaputra <strong>and</strong> its tributaries suffer from regular floods during the rainy season. Theother major rivers are Kapili, Kalang, Killing <strong>and</strong> Barapani. The rivers flowing through the district are all perennialin nature. A number <strong>of</strong> ox-bow lakes <strong>and</strong> ponds also exist in the district. Besides, there are many low lying areas<strong>and</strong> swamps. The soils <strong>of</strong> the district vary from s<strong>and</strong>y to clay loam <strong>and</strong> acidic to near neutral in nature. Thenormal rainfall in the district is 2000 mm. The average minimum <strong>and</strong> maximum temperatures are 8 o C (inJanuary) <strong>and</strong> 34.3 o C (during July/Augus) respectively. As per Census Report, 2001, the district has a totalpopulation <strong>of</strong> 7, 76,256Total wetl<strong>and</strong> area in the district is 28737 ha that includes 158 small wetl<strong>and</strong>s (
7.1.10 NagaonThe district is situated in the Central Brahmaputra valley <strong>of</strong> <strong>Assam</strong> between 25 o 35'N <strong>and</strong> 26 o 55'N latitudes <strong>and</strong>92 o 15'E <strong>and</strong> 93 o 20'E longitudes. It occupies 397600 hectares <strong>of</strong> area. It is bounded on the east by Golaghat <strong>and</strong>Karbi Anglong districts, on the west by Marigoan district, on the north by Sonitpur district <strong>and</strong> south by N.C. Hills<strong>and</strong> Karbi Anglong district. The topography <strong>of</strong> the district is almost flat. The Brahmaputra River flows along thenorthern side <strong>of</strong> the district. A number <strong>of</strong> `Char' area [s<strong>and</strong> bars] are observed along the Brahmaputra river bed.Kaziranga, Loakhowa wild life sanctuary exists in the valley close to the river Brahmaputra. The other majorrivers are Kapili, Diju, Misa, Haria, Jamuna, Kalang <strong>and</strong> Barapani. A number <strong>of</strong> ox-bow lakes <strong>and</strong> ponds alsoexist in the district. Besides, there are many low lying areas <strong>and</strong> swamps. The soils <strong>of</strong> the district vary froms<strong>and</strong>y to clay loam. <strong>and</strong> generally acidic to near neutral in nature. The normal average rainfall in the district is2000 mm. The average minimum <strong>and</strong> maximum temperatures is 8 o C in January <strong>and</strong> about 34.3 o C inJuly/August. As per Census Report, 2001, the district has a total population <strong>of</strong> 23, 14,629Total wetl<strong>and</strong> area in the district is 35659 ha that includes 233 small wetl<strong>and</strong>s (
7.1.11 SonitpurThe district is situated in the northern part <strong>of</strong> <strong>Assam</strong> between 26°30'N <strong>and</strong> 27°02'N latitudes <strong>and</strong> 92°17'E <strong>and</strong>93°47'E longitudes. It occupies an area <strong>of</strong> 492145 Hectares. It is bounded on the east by Lakhimpur district <strong>of</strong><strong>Assam</strong>, on the west by Darrang district, on the north by Arunachal Pradesh <strong>and</strong> on the south by the riverBrahmaputra. The topography <strong>of</strong> the district is almost flat. Along the river Brahmaputra <strong>and</strong> between thecentral belt <strong>and</strong> the Brahmaputra are chronically flood affected. Swamps are seen mainly in these areaswhich represent naturally depressed vast wetl<strong>and</strong>s. The major rivers (tributaries <strong>of</strong> the Brahmaputra) thattraverse this district are Pachnai, Belsiri Nai, Jia Gabharu, Jia Bhoroli, Bardikrai, Bargang <strong>and</strong> Burai. Therivers are all perennial in nature. Both New Alluvium Soils (Entisols) <strong>and</strong> Old Alluvium Soils (Inceptisols) arefound in the district. Soils are s<strong>and</strong>y loam to clay loam in texture <strong>and</strong> are acidic with pH 4.5 to 6.5. Theaverage annual rainfall is 1563 mm. The maximum temperature recorded is 35°C in the months <strong>of</strong> July-August <strong>and</strong> the minimum is 11°C in the months <strong>of</strong> December-January. As per Census Report, 2001, thedistrict has a total population <strong>of</strong> 16, 81,513.Total wetl<strong>and</strong> area in the district is 83427 ha that includes 980 small wetl<strong>and</strong>s (
7.1.12 LakhimpurThe district is situated in the north eastern part <strong>of</strong> <strong>Assam</strong> between 26o 45'N <strong>and</strong> 27 o 35'N latitudes <strong>and</strong> 93 o 40'E<strong>and</strong> 94 o 53'E longitudes. It occupies 3, 00,800 hectares <strong>of</strong> area. It is bounded on the east by Dhemaji <strong>and</strong>Dibrugarh districts, on the west by Sonitpur district <strong>and</strong> part <strong>of</strong> Arunachal Pradesh, on the north by ArunachalPradesh <strong>and</strong> Dhemaji district. The topography <strong>of</strong> the district varies from undulating upl<strong>and</strong>s on the northernfoothill belt to low lying plains on the south with elevation range <strong>of</strong> 35 metres (areas in riverine belt) to 140metres (areas in the foothill belt) above the m. s.l. The mean altitude <strong>of</strong> the district is 102 metres above m.s.l. Allthe rivers in the district are perennial in nature. The river Brahmaputra flows on the southern side <strong>of</strong> the district.The other major rivers are Subansiri, Simen <strong>and</strong> Dikrai. The soils <strong>of</strong> the district are broadly fall into three majorgroups i.e. Older Alluvium along the foothill Older Alluvium on the flood plains <strong>and</strong> Newer Alluvium on the recentflood plains. The annual mean rainfall in the district is 300 cm. The maximum <strong>and</strong> minimum temperatures are31 o C <strong>and</strong> 7 o C respectively, while the mean temperature is 19 o C. As per Census Report, 2001, the district has atotal population <strong>of</strong> 8, 89,010.Total wetl<strong>and</strong> area in the district is 27307 ha that includes 458 small wetl<strong>and</strong>s (
7.1.13 DhemajiThe district is situated in the north eastern part <strong>of</strong> <strong>Assam</strong> between 27 o 15'N <strong>and</strong> 27 o 55'N latitudes <strong>and</strong> 94 o 10'E<strong>and</strong> 95 o 30'E longitudes. It occupies 2, 63,701 hectares <strong>of</strong> area. It is bounded on the north by ArunachalPradesh. The topography <strong>of</strong> the district varies from undulating upl<strong>and</strong>s on the northern foothill belt to low lyingplains on the south. The mean altitude <strong>of</strong> the district is 102 metres above m.s.l. The river Brahmaputra flowsalong the southern side <strong>of</strong> the district. The other major rivers are Subansiri, Jiadhal, Simen <strong>and</strong> Dikrai. All therivers in the district are perennial in nature. These rivers flow through the high rainfall region at the foothill <strong>of</strong> the<strong>Assam</strong> Himalayas; so the district acts as a run<strong>of</strong>f zone for the excess water from Arunachal Pradesh. Anextensive area <strong>of</strong> the district is, thus invariably subjected to 3 to 4 waves <strong>of</strong> flood during the monsoon period.The soils <strong>of</strong> the district broadly fall into Older Alluvium <strong>and</strong> New Aluvium. The annual mean rainfall in the districtis 300 cm. The maximum <strong>and</strong> minimum temperatures are 31 o C <strong>and</strong> 7 o C respectively, while the meantemperature is 19 o C. As per Census Report, 2001, the district has a total population <strong>of</strong> 5, 71,944.Total wetl<strong>and</strong> area in the district is 33468 ha that includes 314 small wetl<strong>and</strong>s (
7.1.14 TinsukiaThe district is situated in the north eastern part <strong>of</strong> <strong>Assam</strong> between 27 o 15'N <strong>and</strong> 28 o 00'N latitudes <strong>and</strong> 95 o 15'E<strong>and</strong> 96 o 00'E longitudes. It occupies 3,47,600 hectares <strong>of</strong> l<strong>and</strong>.. It is bounded on the east by Arunachal Pradesh,on the west by Dibrugarh district, on the north by Lakhimpur district <strong>and</strong> south by the Dibrugarh district <strong>and</strong> part<strong>of</strong> Arunachal Pradesh. The district is characterised by a flat monotonous terrain from the Brahmaputra riversouthwards upto the upper Dihing R.F. where it starts rising slowly into the broken hills that comprise the foothills<strong>of</strong> the Tirap district <strong>of</strong> Arunachal Pradesh. The tract is drained by the Brahmaputra river <strong>and</strong> its main tributaryBurhi Dihing. Soils <strong>of</strong> this district are divided into three distinct categories. viz. new alluvial soils in an areaextending few kms to the south <strong>of</strong> the Brahmaputra river, old alluvial soils in the central part <strong>of</strong> the district <strong>and</strong>old mountain valley alluvial soil located on the foothills <strong>of</strong> Arunachal Pradesh. .The average annual rainfallranges from a minimum <strong>of</strong> 2134 mm to a maximum <strong>of</strong> 3785 mm. The minimum <strong>and</strong> maximum temperaturesrecorded are 7 o C <strong>and</strong> 37 o C during winter <strong>and</strong> summer respectively. As per Census Report, 2001, the district hasa total population <strong>of</strong> 11, 50,062.Total wetl<strong>and</strong> area in the district is 40626 ha that includes 478 small wetl<strong>and</strong>s (
7.1.15 DibrugarhThe district is situated in the north eastern part <strong>of</strong> <strong>Assam</strong> between 27 o 10'N <strong>and</strong> 27 o 45'N latitudes <strong>and</strong> 94 o 30'E<strong>and</strong> 95 o 30'E longitudes. It occupies 3,54,500 hectares <strong>of</strong> area, which accounts for 4.52 per cent area <strong>of</strong> thestate. It is bounded on the east by Tinsukia, on the west by part <strong>of</strong> Sibsagar <strong>and</strong> Lakhimpur districts, on thenorth by Lakhimpur district <strong>and</strong> south by the Sibsagar district <strong>and</strong> part <strong>of</strong> Arunachal Pradesh. The district ischaracterised by a flat monotonous terrain from the Brahmaputra river southwards upto the upper Dihing R.F.where it starts rising slowly into the broken hills that comprise the foothills <strong>of</strong> the Tirap district <strong>of</strong> ArunachalPradesh. The tract is drained by the Brahmaputra river <strong>and</strong> its main tributary the Burhi Dihing <strong>and</strong> the Mai Janriver. Soils <strong>of</strong> this district are divided into three distinct categories. viz. new alluvial soils in an area extending fewkms to the south <strong>of</strong> the Brahmaputra river, old alluvial soils in the central part <strong>of</strong> the district <strong>and</strong> old mountainvalley alluvial soil located on the foothills <strong>of</strong> Arunachal Pradesh on the district. The average annual rainfallranges from a minimum <strong>of</strong> 2134mm to a maximum <strong>of</strong> 3785mm. The minimum <strong>and</strong> maximum temperaturesrecorded are 7 o C <strong>and</strong> 37 o C respectively. As per Census Report, 2001, the district has a total population <strong>of</strong> 11,85,072.Total wetl<strong>and</strong> area in the district is 72461 ha that includes 535 small wetl<strong>and</strong>s (
7.1.16 SibsagarThe district is situated in the north-eastern part <strong>of</strong> <strong>Assam</strong> between 26°42' <strong>and</strong> 27°15' north latitude <strong>and</strong> 94°24'<strong>and</strong> 95°23' east longitude. The district occupies an area <strong>of</strong> 64250 hectares. It is bounded on the east byDibrugarh The district is situated in the north-eastern part <strong>of</strong> <strong>Assam</strong> between 26°42' <strong>and</strong> 27°15' north latitude<strong>and</strong> 94°24' <strong>and</strong> district <strong>of</strong> <strong>Assam</strong> <strong>and</strong> Tirap district <strong>of</strong> Arunachal Pradesh, on the west by Jorhat <strong>and</strong>Dibrugarh districts <strong>of</strong> <strong>Assam</strong>, on the north by Dibrugarh district <strong>and</strong> on the south by Jorhat district <strong>of</strong> <strong>Assam</strong><strong>and</strong> Mokokchung district <strong>of</strong> Nagal<strong>and</strong>. The main rivers <strong>of</strong> the district are the Brahmaputra <strong>and</strong> its tributariesviz. Disang, Dikhow, Jhanzi <strong>and</strong> Burhidihing, which are perennial in nature. The soils <strong>of</strong> the district are dividedinto three main categories viz. New alluvial soil in an area <strong>of</strong> few kilometres on the south <strong>of</strong> Brahmaputra, oldalluvial soil on the central part <strong>of</strong> the district <strong>and</strong> old mountain valley alluvial soils located along the foot hills <strong>of</strong>Nagal<strong>and</strong>. The district possesses the famous Panidihing wild life sanctuary.The normal annual rainfall in thedistrict is 2244.5 mm. The minimum <strong>and</strong> maximum temperatures are 6.9°C <strong>and</strong> 37.2°C during winter <strong>and</strong> midsummer respectively. As per Census Report, 2001, the district has a total population <strong>of</strong> 10, 51,736.Total wetl<strong>and</strong> area in the district is 12582 ha that includes 530 small wetl<strong>and</strong>s (
7.1.17 JorhatJorhat district is situated in the eastern part <strong>of</strong> <strong>Assam</strong> state between 26°20'N <strong>and</strong> 27°11'N latitudus <strong>and</strong>93°58'E <strong>and</strong> 94°33'E longitudes. It occupies 2,73,047.15 hectares area.. It is bounded on the north byLakhimpur district <strong>of</strong> <strong>Assam</strong>, <strong>and</strong> on the south by Wokha <strong>and</strong> Mokakchung districts <strong>of</strong> Nagal<strong>and</strong>. The riverBrahmaputra flows along the northern side <strong>of</strong> the district separating Majuli sub-division from the main l<strong>and</strong>. Allrivers in the district are <strong>of</strong> perennial nature. The soils <strong>of</strong> the district vary from s<strong>and</strong>y loam to clay loam. Thesoil is mainly acidic in reaction with pH ranging from 4.5 to 6.5. Shifting cultivation areas are found in the Disai<strong>and</strong> Tiru hill region <strong>of</strong> the district. The mean annual rainfall in the district is 230 cm. The maximum <strong>and</strong>minimum temperatures recorded in the district are 32°C <strong>and</strong> 5°C during summer <strong>and</strong> winter respectively,while the mean temperature is recorded as 18°C. As per Census Report, 2001, the district has a totalpopulation <strong>of</strong> 9,99,221.Total wetl<strong>and</strong> area in the district is 45979 ha that includes 363 small wetl<strong>and</strong>s (
7.1.18 GolaghatGolaghat district is situated in the south-east part <strong>of</strong> <strong>Assam</strong> state between 25°45'N to 26°40'N latitudes <strong>and</strong>93°30'E to 94°29'E longitudes. It occupies 335879.83 hectares. It is bounded on the east by Jorhat district <strong>of</strong><strong>Assam</strong>, on the west by Nowgong <strong>and</strong> Korbi Anglong districts <strong>of</strong> <strong>Assam</strong>, on the north by Sonitpur <strong>and</strong>Lakhimpur districts <strong>of</strong> <strong>Assam</strong> <strong>and</strong> on the south by Kohima <strong>and</strong> Wokha districts <strong>of</strong> Nagal<strong>and</strong>.The district ischaracterised by medium <strong>and</strong> low l<strong>and</strong> topography. In the north-west is the famous Kaziranga National Park,the natural habitat <strong>of</strong> the one-horned Rhino. The river Brahmaputra flows through the northern side <strong>of</strong> thedistrict. The other major tributary river is Dhansiri. The soil <strong>of</strong> the district varies from s<strong>and</strong>y loam to clay loam.It can be classified into three major soil croups i.e. Recent Riverine alluvial soils (Entisols), Old Riverinealluvial soils (Inceptisols) <strong>and</strong> Old Mountain valley alluvial soils (Altisols). The soil is acidic, pH ranging from4.5 to 6.5. The mean annual rainfall in the district is 216 cm. The maximum <strong>and</strong> minimum temperaturesrecorded are 32°C <strong>and</strong> 6°C respectively while, the mean temperature is 19°C. As per Census Report, 2001,the district has a total population <strong>of</strong> 9, 46,279.Total wetl<strong>and</strong> area in the district is 43635 ha that includes 165 small wetl<strong>and</strong>s (
7.1.19 Karbi AnglongKarbi Anglong district is situated in central part <strong>of</strong> <strong>Assam</strong> between 25°32'N to 26° 36'N latitudes <strong>and</strong> 92° 10' Eto 93°50' E longitudes. It occupies an area <strong>of</strong> 1000257 hectares. It is bounded on the east by.Golaghat district<strong>of</strong> <strong>Assam</strong>, on the west.by East Khasi Hills <strong>of</strong> Meghalaya, <strong>and</strong> on the south by Kohima district <strong>of</strong> Nagal<strong>and</strong>,Nortb Cachar hills district <strong>of</strong> <strong>Assam</strong> <strong>and</strong> Jaintia hills district <strong>of</strong> Meghalaya. The district can be broadly dividedinto two physiographic units viz., hills <strong>and</strong> plains. About 85 percent <strong>of</strong> the districtis covered by hills. Thehighest peak in the district rises to a height <strong>of</strong> 1360 metres. The area located between the northern <strong>and</strong>southern hills in Diphu sub-division is characterised by undalating plains <strong>of</strong> subdued relief. The plain areasconsist <strong>of</strong> valleys <strong>of</strong> the Jamuna, Kapili <strong>and</strong> Dhansiri rivers flowing through its eastern part. Other minorstreams include Kaliani, Barpani, Patradisa <strong>and</strong> Digaru. The soils <strong>of</strong> the district are made up <strong>of</strong> laterised Redsoils <strong>and</strong> non-laterised Red soils. The surface soils are generally pale red to reddish brown or bright red incolour. Shifting cultivation is a part <strong>of</strong> l<strong>and</strong> use/cover. The mean annual rainfall in the district is 141 cm. Themaximum <strong>and</strong> minimum temperatures recorded are 25°C <strong>and</strong> 4°C respectively while the mean temperature is14.5°C. As per Census Report, 2001, the district has a total population <strong>of</strong> 8, 13,311.Total wetl<strong>and</strong> area in the district is 5810 ha that includes 89 small wetl<strong>and</strong>s (
100
101
7.1.20 North Cachar HillslNorth Cachar Hills is situated in the south central part .<strong>of</strong> <strong>Assam</strong> between 24°58' <strong>and</strong> 25°47. North latitudes<strong>and</strong> 92°32' <strong>and</strong> 93°28" East longitudes. The district occupies an area <strong>of</strong> 4,89,793 hectares. The only big townis Haflong which is the district head quarter also It is bounded on the east by the Jaintia. hills <strong>of</strong> Meghalayastate, on the west by Tamenglong <strong>and</strong> Kohima districts <strong>of</strong> Nagal<strong>and</strong>, on the north by Karbi Anglong <strong>and</strong>Nagaon districts <strong>of</strong> <strong>Assam</strong> <strong>and</strong> on the south by Cachar district <strong>of</strong> <strong>Assam</strong>. The district consists mainly <strong>of</strong> hillytracts <strong>and</strong> valleys with a negligible extent <strong>of</strong> plain area. The topography is rugged with elevations varying from600 metres to 900 metres. The main rivers are Diyang, Kopili, Jiri <strong>and</strong> Dhansiri. The soils <strong>of</strong> the district varyfrom non-laterised red soil to laterised red soil ranging from s<strong>and</strong>y loam to clayey loam in texture. The nonlaterisedred soils occupy a relatively less area along a strip in the southern part <strong>of</strong> the district. The soi1 isacidic in reaction with pH varying from 4.10 to 6.20. The average annual rainfall varies from 2200 to 2300mm. The maximum <strong>and</strong> minimum temperatures are 25.8°C <strong>and</strong> 5.3°C respectively. As per Census Report,2001, the district has a total population <strong>of</strong> 1, 88,079.Total wetl<strong>and</strong> area in the district is 6619 ha that includes 44 small wetl<strong>and</strong>s (
103
104
105
7.1.21 CacharCachar district is situated in the lower Brahmaputra valley <strong>of</strong> <strong>Assam</strong> between 24 o 20'N <strong>and</strong> 25 o 10'N latitudes <strong>and</strong>92 o 15'E <strong>and</strong> 93 o 15'E longitudes. It occupies 3, 77,600 hectares <strong>of</strong> area. The district is bounded by Manipur onthe east, y Hailak<strong>and</strong>i district <strong>and</strong> Bangladesh in west, <strong>and</strong> Mizoram state on the south. Most <strong>of</strong> the areas in thedistrict consist <strong>of</strong> hills <strong>and</strong> inselbergs leaving behind very little plain area. The main river flowing along theCentral part <strong>of</strong> the district is the Barak <strong>and</strong> its tributaries viz., the Rukni <strong>and</strong> the Sonai. The Barak river flowsalong east-west direction. All the rivers are perennial in nature. The lowlying areas are usually characterised bythe presence <strong>of</strong> natural lakes <strong>and</strong> swamps, locally known as `haors'. The soils <strong>of</strong> the district vary from alluvial tolateritic, the major areas having a clayey loam to clayey texture. Loam to s<strong>and</strong>y loam soils are found in riverinetracts <strong>of</strong> the main river Barak <strong>and</strong> its tributaries. The average annual rainfall as recorded in the district is2717mm. The maximum temperature recorded is 37.4°C <strong>and</strong> the minimum temperature is 9°C. As per CensusReport, 2001, the district has a total population <strong>of</strong> 14, 44,921.Total wetl<strong>and</strong> area in the district is 10419 ha that includes 46 small wetl<strong>and</strong>s (
107
108
109
7.1.22 KarimganjKarimganj district is situated in the S-W part <strong>of</strong> <strong>Assam</strong> state between 24°14'N <strong>and</strong> 24°54'N latitudes <strong>and</strong>92°16'E <strong>and</strong> 92°35'E longitudes. It occupies 1, 76,285 hectares <strong>of</strong> area. It is bounded on the east by theCachar district <strong>of</strong> <strong>Assam</strong> <strong>and</strong> the state <strong>of</strong> Mizoram, on the west by the state <strong>of</strong> Tripura <strong>and</strong> Bangladesh, onthe north by the Cachar district <strong>of</strong> <strong>Assam</strong> <strong>and</strong> Bangladesh <strong>and</strong> on the south by the state <strong>of</strong> Mizoram. Thetopography <strong>of</strong> the district is characterised by hills <strong>and</strong> valley fills. The Barak river flows on the northern part <strong>of</strong>the district <strong>and</strong> meet the river Surma near Bhanga from where it flows as river Kusiyara along the northernboundary <strong>of</strong> the district. There are two other main rivers flowing from the south to the north <strong>and</strong> these areLongai <strong>and</strong> Singla rivers which join with the river Kusiyara in the north. The average annual rainfall in thedistrict is 3759.6 mm. The maximum temperature recorded during the month <strong>of</strong> June is about 36°c <strong>and</strong>minimum temperature is about 8°C during the month <strong>of</strong> December-January. The soils <strong>of</strong> the district are mostlymade <strong>of</strong> older. Alluvium having a texture <strong>of</strong> clay loam to clayey. In some parts it is s<strong>and</strong>y loam in texture. Thesoil in the district is acidic to neutral in reaction with pH ranging from 4.5 to 6.0. As per Census Report, 2001,the district has a total population <strong>of</strong> 10, 07,976.Total wetl<strong>and</strong> area in the district is 6450 ha that includes 98 small wetl<strong>and</strong>s (
111
112
113
7.1.23 Hailak<strong>and</strong>iHailak<strong>and</strong>i district is situated in the lower Brahmaputra valley <strong>of</strong> <strong>Assam</strong> between 24 o 10'N <strong>and</strong> 24 o 55'N latitudes<strong>and</strong> 92 o 25'E <strong>and</strong> 92 o 45'E longitudes. It occupies 1, 32,600 hectares <strong>of</strong> area e. The district is bounded by theinterstate boundary <strong>of</strong> Mizoram <strong>and</strong> Cachar district <strong>of</strong> <strong>Assam</strong> on the east, Karimganj district on the west. Thenorth boundary is marked by parts <strong>of</strong> Cachar <strong>and</strong> Karimganj districts while Mizoram is on the south. The districtshares the Son Beel wetl<strong>and</strong>, largest in the state, along the western boundary with Karimganj district. Most <strong>of</strong>the areas in the district consist <strong>of</strong> hills <strong>and</strong> inselbergs leaving behind very little plain area. The low lying areasare usually characterised by the presence <strong>of</strong> natural lakes <strong>and</strong> beels, locally known as `haors'. The main riverflowing along the northern boundary <strong>of</strong> the district is the Barak <strong>and</strong> its tributaries viz., the Katakhal <strong>and</strong> theDhaleswari. All the rivers flow northwards from the hills <strong>of</strong> Mizoram. The Barak river flows along east-westdirection. The soils <strong>of</strong> the district mostly made <strong>of</strong> older alluvium having a texture <strong>of</strong> clay-loam to clayey. Beelsoils (peat soils) are also found in some areas. The soil in the district is acidic to neutral in reaction with pHranging from 4.5 to 6.0. As per Census Report, 2001, the district has a total population <strong>of</strong> 5, 42,872. Theaverage annual rainfall is 2717mm. The maximum temperature recorded during summer is 37.4°C <strong>and</strong> theminimum temperature recorded during winter is 9°C.Total wetl<strong>and</strong> area in the district is 2600 ha that includes 30 small wetl<strong>and</strong>s (
115
116
117
118
MAJOR WETLAND TYPES119
120
8.0 MAJOR WETLAND TYPES OF ASSAMMajor wetl<strong>and</strong> types observed in the state are Rivers/streams, Lakes/ponds, Waterlogged, <strong>and</strong> ox-bow lakes.The manifestation <strong>of</strong> representative wetl<strong>and</strong>s in satellite image is given in Plate-1a <strong>and</strong> 1b. Field photographs<strong>of</strong> representative wetl<strong>and</strong> types along with their location are shown in Plates 2a <strong>and</strong> 2b.A :Post-monsoon dataABLakes/PondsPart <strong>of</strong> Western <strong>Assam</strong>(IRS P6 LISS-III FCC, Post-monsoon data,October 27, 2006)Pre-monsoon dataAB :BOx-bow lakesPart <strong>of</strong> Western <strong>Assam</strong>(IRS P6 LISS-III FCC, Post-monsoon data,March 20, 2007)Post-monsoon dataPre-monsoon dataPlate – 1a: Major wetl<strong>and</strong> types <strong>of</strong> <strong>Assam</strong>121
Post-monsoon dataOx-bow lakesRiverWaterloggedPart <strong>of</strong> Western <strong>Assam</strong>Ox-bow lakesRiverWaterloggedPre-monsoonPlate – 1b: Major wetl<strong>and</strong> types <strong>of</strong> <strong>Assam</strong>122
Sr. No.1.Wetl<strong>and</strong> Type: River/streamWetl<strong>and</strong> Name: Brahmaputra RiverLocation:Longitude: 92°14’10.2”ELatitude : 26°24’29.2” NTurbidity: lowDescriptionField photograph2.Wetl<strong>and</strong> Type: LakeWetl<strong>and</strong> Name: Deepor BeelLocation:Longitude: 91°39’30.9” ELatitude : 26°06’46” NTurbidity: HIgh3.Wetl<strong>and</strong> Type: Waterlogged(natura)lLocation:Longitude : 92°15’30.5”ELatitude : 26°19’29.3”NTurbidity: Moderate4.Wetl<strong>and</strong> Type: Tank / PondWetl<strong>and</strong> Name: Anua BeelLocation:Longitude: 90°21.02’ELatitude : 26°32.94” NTurbidity: ModeratePlate 2a: Field observations <strong>of</strong> different wetl<strong>and</strong> types in <strong>Assam</strong>123
Sr. No.5.DescriptionWetl<strong>and</strong> Type: River/streemWetl<strong>and</strong> Name: Beki RiverLocation:Longitude: 90°55’02.6”ELatitude : 26°31’01.5”NTurbidity: ModerateField photograph2.Wetl<strong>and</strong> Type: Ox-bow lakeWetl<strong>and</strong> Name: Saren BeelLocation:Longitude: 91°46’42.5”ELatitude : 26°06’46” NTurbidity: Moderate3.Wetl<strong>and</strong> Type: Waterlogged(natura)lWetl<strong>and</strong> Name: Naitara BeelLocation:Longitude : 90°59.07”ELatitude : 26°03.16’NTurbidity: Moderate4.Wetl<strong>and</strong> Type: Tank / PondWetl<strong>and</strong> Name: Hajo PukhuriLocation:Longitude: 91°31’54”ELatitude : 26°14’36”NTurbidity : LowPlate 2b: Field photographs <strong>and</strong> ground truth data <strong>of</strong> different wetl<strong>and</strong> types in <strong>Assam</strong>124
A large diversity <strong>of</strong> aquatic plants belonging to angiosperms <strong>and</strong> ferns are found in the wetl<strong>and</strong>s <strong>of</strong> <strong>Assam</strong>.The floating <strong>and</strong> emergent hydrophytes are well captured in the LISS III data (Plate-3), while, the submergedones are not. Some <strong>of</strong> the dominant <strong>and</strong> major hydrophytes belonging to the floating <strong>and</strong> emergent typeobserved in the state are listed here.Free Floating Hydrophytes:The species are found coming in contact with water <strong>and</strong> air only. These species has a tendency to formcomplete carpet over water surface during certain period. Usually these plants grow well in still waters atshallow depths, sometimes in very slow flowing shallow water bodies.Angiosperms:Eichhomia crassipes (Mart.) Solms.; Lemna perpusilla Torr.; Pistia stratiotes L; Spirodela polyrrhiza(L) Schleid.,S. punctata (Meyer.) Thompson; WoljJia arrhiza (L) Hook. ex WimmAquatic ferns:Azolla pinnata RBr.; Salvinia cucullata Roxb. ex Bory; S. natans (L) All.Floating leaves anchored Hydrophytes:The plants are usually in contact with soil, water as well as air. Except the developing leaves, the maturedones remain floating. The leaves frequently form a continuous cover in such an extent that water does not getwarmed. Different kinds <strong>of</strong> fishes are found to take shelter during the hottest period <strong>of</strong> the day. Usually theseplants grow well in still waters. Commonly found plants are:Aponogeton n,atans (L) Engl. & Krause; Euryale ferox Salisb; Nelumbo nucifera Gaertn.; Nymphaeanouchali Burm. f., N. pubescens Willd., N. rubra Roxb. ex. Andrews; Nymphoides cristata (Roxb.) O.Kuntze, N. indicum (L) O. Kuntze; Potamogeton oct<strong>and</strong>rous Poir.; Trapa natans L var. bispinosa(Roxb.) Makino, T. natans L var. quadrispinosa (Rqxb.) Makino.Floating shoots anchored Hydrophytes:These aquatics have contact with soil, water <strong>and</strong> air. They usually grow along the margins <strong>of</strong> shallow waterpools rooted in marsh <strong>and</strong> spread branches with their shoots floating on water. The main stem remainssubmerged wholly or partially. They <strong>of</strong>ten produce spongy respiratory roots at the nodes. When water levelrecede these plants become terrestrial, their stems <strong>and</strong> leaves get reduced. At the advent <strong>of</strong> rains theseplants again show normal growth <strong>and</strong> development. The species are:Hygroryza aristata Nees ex Weight & Am.; Ipomoea aquatica Forsk.; Limnophila sessiliflora (Vahl) Bl.;Ludwigia adscendens (L) Hara; Myriophyllum indicum Willd., M. tuberculatum Roxb.; Neptuniaprostrata (Lam.) Bail.; Paspalidium punctatum (Burm.) A. Camus; Polygonum glabrum Willd.;Pseudoraphis brunoniana Griff.Emergent anchored Hydrophytes:Usually these plants grow along the water's edge. The roots, lower parts <strong>of</strong> stems <strong>and</strong> sometimes the lowerleaves remain submerged. The apical parts <strong>and</strong> flowers rise above the water surface. A large number <strong>of</strong>species are recorded <strong>and</strong> found in abundance. Many species <strong>of</strong> the following genus are observed:Cyperu, Eleochari, Echinochloa, Hygrophila, Polygonum, Limnophila , Ranunculus, ScirpusSwamps, Marsh vegetation:This category <strong>of</strong> plants are found to grow well all along the banks <strong>of</strong> rivers <strong>and</strong> tributaries, ponds, heels,ditches, Ox-bow lakes, in swamps <strong>and</strong> marshes (locally known as 'pitoni', 'metakani', 'hola', 'torani', 'ikorani'<strong>and</strong> 'doloni') where the soil is saturated with water at least in the early part <strong>of</strong> plant life. Most <strong>of</strong> them continueto thrive even after the substratum has considerably dried. Good number <strong>of</strong> plants have been recorded <strong>and</strong>are found well distributed in almost all parts <strong>of</strong> <strong>Assam</strong>. Amongst these sedges <strong>and</strong> grasses form the largestcomponent <strong>of</strong> vegetation. Many species <strong>of</strong> the following genus occur in abundance:Alternanthera, Amaranthus, Bacopa, Blumea, Canna, Crataev, Hedyotis, Justicia, Lindemia, LudwigiaPolygonum, Ranunculus125
Plate 3: Field observation on the status <strong>of</strong> hydrophytes ( free floating mat type emergent anchored <strong>and</strong>swamp type )126
IMPORTANT WETLANDS OF ASSAM127
128
9.0 IMPORTANT WETLANDS OF ASSAMThe state has a large number <strong>of</strong> lakes/ponds, rivers, ox-bow lakes <strong>and</strong> waterlogged area. The Brahamputra<strong>and</strong> Barak are two important rivers <strong>of</strong> <strong>Assam</strong>. Deepor beel, Dhir beel, Sareswar beel, Sone beel, Tamarangabeel <strong>and</strong> Sonai beel are some <strong>of</strong> the important wetl<strong>and</strong> sites <strong>of</strong> <strong>Assam</strong> .Extensive field work was carried out for these wetl<strong>and</strong> areas. Wetl<strong>and</strong> maps have been prepared for 5kmbuffer area <strong>of</strong> each wetl<strong>and</strong> sites. Details <strong>of</strong> the wetl<strong>and</strong>s <strong>and</strong> wetl<strong>and</strong> maps <strong>of</strong> 5 km buffer area are shown inplates 4 to 21.129
9.1 Deepor BeelNameLocationAreaAltitudeWetl<strong>and</strong> TypeClimateStatusDescriptionBio-diversityCurrent StatusDeepor Beel26° 07' 30" N, 91° 38' 35" EDistrict: KamrupOwnership: State, Fishery Department589 ha53 mFreshwater Swamp, LakeRainfall : >2000 mmTemperature: 7 °C to 37 °CWildlife Sanctuary, established in January 1989. Presently it is a Ramsar Site (designated inNovember 2002).This is a fresh water lake, on the southern bank <strong>of</strong> the Brahmaputra River, covering an area <strong>of</strong>about 900 ha. The main source <strong>of</strong> water <strong>of</strong> this lake is from rainfall run<strong>of</strong>f <strong>and</strong> from the Basistha <strong>and</strong>Kalamoni rivers. The Beel drains into the Brahmaputra River, located about 5 km away through asmall rivulet called Khanajan. The southern side <strong>of</strong> the lake is contiguous with Rani Reserve Forest.About half <strong>of</strong> the Beel dries out during the winter <strong>and</strong> the exposed shores are converted into paddyfields. At maximum flooding, it is c. 4 m deep, while during the dry season, the depth drops to about1.0 m..A large variety <strong>of</strong> aquatic flora <strong>of</strong> tropical wetl<strong>and</strong> is found in Deepor Beel <strong>and</strong> its adjoining areas.The dominant aquatic plants include Azolla pinnata, Nymphaea rubra, Ottelia alismoides,Eleocharis plantaginea, Pistia stratiotes ,Hydrilla verticillata, Potamogeton crispus, Ipomoeareptans, Sagittaria sagittifolia, Nymphaea albea, Vallisneria spiralis. The giant water lily (Euryaleferox) also grows here. Eichhornia crassipes is the dominate weed.The diversity <strong>and</strong> concentration <strong>of</strong> indigenous fresh water fish species in this lake is very high(around50 species under 19 families). It harbors many species <strong>of</strong> migratory birds in winter as wellas resident birds. Around 150 species <strong>of</strong> birds have been recorded so far in <strong>and</strong> around theSanctuary, including nine threatened species. The wetl<strong>and</strong> is used for fishery, domestic watersupply, collection <strong>of</strong> natural products, fodder <strong>and</strong> food supply, transport, <strong>and</strong> recreation.Current status: Heavy siltation, pollution from city/industry effluents, poaching <strong>and</strong> unregulatedfishing, encroachment.As observed in the image, the beel is fragmented, surrounded with waterlogged areas in the 5 kmbuffer zone. The intensive growth <strong>of</strong> the weed water hyacinth is very prominent. The fieldphotograph shows the shallowness <strong>of</strong> water, growth <strong>of</strong> vegetation in <strong>and</strong> around the lake.IRS LISS-III Post monsoon data (November 1, 2006) IRS LISS-III Pre-monsoon data (May 27, 2007)Plate 4: Deepor Beel130
Plate 5: Wetl<strong>and</strong> map - 5 km buffer area <strong>of</strong> Deepor Beel131
132
Plate 6: IRS LISS III FCC - 5 km buffer area <strong>of</strong> Deepor Beel133
9.2 Dhir BeelNameLocationAreaWetl<strong>and</strong> TypeDescriptionCurrent StatusDhir Beel26° 16’ 55” N, 90°21’ 10”EDistrict : DhubriOwnership : State (Fisheries Department)1003 haLakes/pondsDhir beel is situated 30 km from Kokrajhar town at the base <strong>of</strong> Chakrashila Wildlife Sanctuary.During the rainy season, this wetl<strong>and</strong> gets connected with the Brahmaputra river through a smallriver called Dhir River. The wetl<strong>and</strong> is rich in aquatic flora <strong>and</strong> fauna <strong>and</strong> is a breeding ground forfish.Adjacent to Dhir, there is another Lake- Diplai. These twin lakes attract a lot migratory birds inwinter including Near Threatened Ferruginous Duck <strong>and</strong> the Vulnerable Baer’s Pochard Aythyabaeri. Swamp Francolin Francolinus gularis (Lahkar 2003) was common in the area till the lateeighties, but due to destruction <strong>of</strong> habitat in the form <strong>of</strong> agriculture, settlements,<strong>and</strong> over hunting ithas been wiped out graduallyUnregulated fishing <strong>and</strong> poaching are the major threats.One can observe the shallowness <strong>and</strong> drying status <strong>of</strong> the lake even in post monsoon. Aquaticweed like water hyacinth is not observed. However, encroachment for agriculture is observed.Plate 7: Dhir Beel134
Plate 8: Wetl<strong>and</strong> map - 5 km buffer area <strong>of</strong> Dhir Beel135
136
Plate 9: IRS LISS III FCC - 5 km buffer area <strong>of</strong> Dhir Beel137
9.3 Sareswar BeelNameLocationAreaWetl<strong>and</strong> TypeDescriptionVegetationFaunaSareswar Beel26° 9’ 14” N, 89° 55’ 26”EDistrict : DhubriOwnership : State (Fisheries Department)558 haLakes/pondsSareswar beel is a shallow, freshwater lake on the floodplain to the north <strong>of</strong> the Brahmaputra Riverin lower <strong>Assam</strong>. The western edge <strong>of</strong> the wetl<strong>and</strong> borders on the Rupshi <strong>and</strong> Bamunijoia Reserved<strong>Forests</strong>. The total area <strong>of</strong> the beel is about 1700 ha. At maximum flooding, the beel is about fourmetres deep; during the dry winter season, the depth falls to about one metre. Rice cultivation isobserved on the exposed area during dry seasonThe lake has abundant aquatic vegetation. The principal aquatic plants are Vallisneria spiralis,Hydrilla verticillata, Monochoria hastata, Trapa bispinosa, Sagittaria, sagittifolia <strong>and</strong> Pistia stratiotes.Eichhornia crassipes is the major weed.A great diversity <strong>of</strong> resident <strong>and</strong> migratory waterfowl are found in the lake. , <strong>and</strong> is particularlyimportant in winter. Both the lesser adjutant (Leptoptilos javanicus) <strong>and</strong> greater adjutant (L. dubius)are regular in the winter months.The lake supports a large variety <strong>of</strong> fish fauna.The Lake <strong>and</strong> Reserve <strong>Forests</strong> to the west are State-owned; other adjacent areas are privatelyowned.Plate 10: Sareswar Beel138
Plate 11: Wetl<strong>and</strong> map - 5 km buffer area <strong>of</strong> Sareswar Beel139
140
Plate 12: IRS LISS III FCC - 5 km buffer area <strong>of</strong> Sareswar Beel141
9.4 Sone LakeNameLocationAreaAltitudeWetl<strong>and</strong> TypeClimateDescriptionSocio-EconomicValueThreats <strong>and</strong>ConservationIssues :Sone Lake24° 40' 00" N, 92° 26' 10" EDistrict : Karimganj, Ownership : State / Private2914 ha40mLakes/pondsRainfall : >3,000 mmTemperature : 7 °C to 36 °CSone beel is the largest wetl<strong>and</strong> in <strong>Assam</strong>. It is in Karimganj district <strong>of</strong> southern <strong>Assam</strong>. Son beel isaccessible from Hailak<strong>and</strong>i <strong>and</strong> Karimganj towns. The lake is 12.5 km long <strong>and</strong> 3.9 km wide, with a35.4 km shoreline. The catchments <strong>of</strong> the lake has ravines, slopes <strong>and</strong> hilly terrains, with loamy,s<strong>and</strong>y or gravelly soil in the plains <strong>and</strong> fine-grained s<strong>and</strong>stones in the hilly region. It is flanked byhills on its west <strong>and</strong> east. In winter, the extent is becomes fragmented <strong>and</strong> totaling as low as 500 ha<strong>of</strong> area.The Shingla River, originating in Mizoram, is the only major inlet as well as outlet <strong>of</strong> Son beelwetl<strong>and</strong>. Further downstream, there is another large lake known as Rata beel, beyond which theShingla river bifurcates into two rivers Kochua <strong>and</strong> Kakra which drain the lake water into theKushiyara River. Barringtonia acutangula is the main tree that grows in the beel besides reeds suchas Arundo donax <strong>and</strong> various aquatic plants. Son Beel, is a reservoir <strong>of</strong> 70 species <strong>of</strong> fish belongingto 49 genera under 24 families have been recorded. Mostly made up <strong>of</strong> Puntius chola followed byLabeo rohita, Wallago attu. It is also home to a large number <strong>of</strong> resident bird species such as thebareheaded goose, adjutant stork, lesser whistling teal, white-breasted water hen, spotted dove <strong>and</strong>purple heron. More than 150 species <strong>of</strong> birds have been recorded, although the actual diversitymust be much more. The lake attracts thous<strong>and</strong>s <strong>of</strong> waterfowl. Not information is there onmammals, reptiles <strong>and</strong> amphibians <strong>of</strong> this important wetl<strong>and</strong>. However, only two species <strong>of</strong> otters(Lutra lutra <strong>and</strong> Lutrogale perspicillata) are found. There are unconfirmed reports <strong>of</strong> Fishing CatPrionailurus viverrina. Hog Deer Axis porcinus is also reported but its number is much reduced dueto poaching <strong>and</strong> disturbance.The wetl<strong>and</strong> supports a locally important fishery <strong>and</strong> reed harvesting industry, <strong>and</strong> providesexcellent opportunities for sport hunting <strong>and</strong> scientific research. As a water way more than 50country Boats are plying every day on regular Transport Service. About 300 families fully depend onincome from Boat Services for six months. Similar number <strong>of</strong> families are engaging in Boat makingfactory in a form <strong>of</strong> rural Artisans. Inl<strong>and</strong> transport services can be promoted to link up 4 AP withDist. Head Quarters. Sone beel touches 9 numbers <strong>of</strong> G.Ps. directly <strong>and</strong> double <strong>of</strong> the numberalong the inlet <strong>and</strong> towards the outlet <strong>and</strong> acts as source <strong>of</strong> drinking water for these areas. The beelis a traditional fishing ground for ages. More than 35,000 families are directly dependent on theBeel for traditional fishing. Extensive fertile <strong>and</strong> flat l<strong>and</strong> around <strong>and</strong> along the water body haspotentially to higher yield from agricultural crop.Reclamation <strong>and</strong> paddy cultivation, Siltation, Excessive fishing <strong>and</strong> Poaching <strong>of</strong> birds are majorthreats to this wetl<strong>and</strong>.The entire area has been silted up <strong>and</strong> reclaimed to a great extent. Winter paddy is widely grown,<strong>and</strong> that again has threatened the beel by accelerating reclamation <strong>and</strong> siltation. Excessive fishingactivities disturb the wetl<strong>and</strong> biodiversity. However, there is proposal by Government <strong>of</strong> <strong>Assam</strong> todeclare this wetl<strong>and</strong> as a Ramsar Site.Plate 13: Sone Lake142
Plate 14: Wetl<strong>and</strong> map - 5 km buffer area <strong>of</strong> Sone Lake143
144
Plate 15: IRS LISS III FCC - 5 km buffer area <strong>of</strong> Sone Beel145
9.5 Tamaranga BeelNameLocationAreaWetl<strong>and</strong> TypeClimateDescriptionTamaranga BeelCoordinates : 26° 19' 8" N, 90° 34' 19" EDistrict : BongaigaonOwnership : State627 haInl<strong>and</strong> – Natural - Lakes/pondsRainfall : >3,000 mmTemperature : 7 °C to 36 °CTamaranga beel is actually a complex <strong>of</strong> wetl<strong>and</strong>s known as Tamaranga -Dalani-Bhairab Complexwhich includes the wetl<strong>and</strong>s <strong>of</strong> Tamaranga, Konora, Paropota <strong>and</strong> Dalani in western <strong>Assam</strong>. TheTamaranga beel wetl<strong>and</strong> is situated only 30 km south from Bongaigaon town, the districtheadquarters <strong>of</strong> Bongaigaon district <strong>of</strong> <strong>Assam</strong>. This is an important freshwater lake (beel) <strong>and</strong> hasbeen listed as a Site <strong>of</strong> Global Importance in the Directory <strong>of</strong> Asian Wetl<strong>and</strong>s as it plays hosts to alarge number <strong>of</strong> avifauna. The nearby Bhairab Reserve Forest is rocky hillock, part <strong>of</strong> an Archaeanplateau, covered with degraded Tropical Moist Deciduous Forest dominated by Sal Shorea robusta<strong>and</strong> Bamboo brakes.Bio-diversityThe beel attracts many migratory birds <strong>and</strong> is a good breeding ground for resident water birds.More than 150 bird species are known to occur in this Complex. More than 20,000 waterfowl arereported regularly in winter. The nearby Bhairab Pahar harbours an important population <strong>of</strong> theGolden Langur <strong>and</strong> Gaur. The adjacent area is used for agriculture.Water Hyacinth Eichhorniacrassipes is the major weed. Wherever this pernicious weed is not found,submerged <strong>and</strong> emergent plants are observed. The wetl<strong>and</strong> is being overexploited for fishing. Thespread <strong>of</strong> Water Hyacinth also is the major problems for birds.IRS LISS-III Post monsoon data (October 27, 2006) IRS LISS-III Pre-monsoon data (March 20, 2007)Plate 16: Tamaranga Beel146
Plate 17: Wetl<strong>and</strong> map - 5 km buffer area <strong>of</strong> Tamaranga Beel147
148
Plate 18: IRS LISS III FCC - 5 km buffer area <strong>of</strong> Tamaragna Beel149
9.6 Sonai Beel (N<strong>and</strong>ini/Mer/Sonai/Raumari/Dobarani/Patiab<strong>and</strong>ha beel)NameLocationAreaWetl<strong>and</strong> TypeClimateDescriptionBio-diversitySonai Beel (N<strong>and</strong>ini/Mer/Sonai/Raumari/Dobarani/Patiab<strong>and</strong>ha beel)Coordinates : 26° 19' 41" N, 92° 14' 9" EDistrict : MarigaonOwnership : State1936 haLakes/pondsHumid tropical monsoon climate, typical <strong>of</strong> the Brahmaputra Valley.Rainfall : 2750 mmTemperature : 7 °C to 35 °CSonai beel is a cluster <strong>of</strong> natural lakes namely N<strong>and</strong>ini, Mer, Sonai, Raumari, Dobarani, <strong>and</strong>Patiab<strong>and</strong>ha beel in Marigaon district <strong>of</strong> <strong>Assam</strong>. The wetl<strong>and</strong>s are situated in the Brahmaputra valleybetween Gauhati <strong>and</strong> Tezpur, <strong>Assam</strong>. Three small wildlife sanctuaries (Laokhawa Sanctuary, OrangSanctuary <strong>and</strong> Sonai Rupai Sanctuary) on the flood plain <strong>of</strong> the Brahmaputra River, with areas <strong>of</strong>riverine swamp <strong>and</strong> seasonally flooded grassl<strong>and</strong> interspersed amongst tropical deciduous <strong>and</strong>semievergreen forests. The area <strong>of</strong> wetl<strong>and</strong>s is 1936 haThe wetl<strong>and</strong>s are important for a wide variety <strong>of</strong> resident <strong>and</strong> migratory waterfowl, The Bengal FloricanHoubaropsis bengalensis occurs in the wetl<strong>and</strong> site.IRS LISS-III Post monsoon data (November 30, 2006)IRS LISS-III Pre-monsoon data (March 30, 2007)Plate 19: Sonai Beel (N<strong>and</strong>ini/Mer/Sonai/Raumari/Dobarani/Patiab<strong>and</strong>ha beel)150
Plate 20: Wetl<strong>and</strong> map - 5 km buffer area <strong>of</strong> Sonai Beel (N<strong>and</strong>ini/Mer/Sonai/Raumari/Dobarani/Patiab<strong>and</strong>ha beel)151
152
Plate 21: IRS LISS III FCC - 5 km buffer area <strong>of</strong> Sonai Beel (N<strong>and</strong>ini/Mer/Sonai/Raumari/Dobarani/Patiab<strong>and</strong>ha beel)153
154
SOI MAP-SHEET WISE WETLAND MAPS(Selected)155
156
.157
158
159
160
161
162
163
164
165
166
167
168
REFERENCES1. Anon. 2005, NNRMS St<strong>and</strong>ards. A National St<strong>and</strong>ards for EO images, thematic & cartographicmaps, GIS databases <strong>and</strong> spatial outputs. ISRO:NNRMS: TR:112:2005. A Committee Report:National Natural Resources Management System, Bangalore2. Anon. 1993. Directory <strong>of</strong> Indian Wetl<strong>and</strong>s, 1993. WWF India, New Delhi <strong>and</strong> AWB Kuala Limpur,xvi+264pp., 32 maps.3. Clark, John R. (1977). Coastal Ecosystem Management, A Wiley Interscience Publication, JohnWiley & Sons, New York,.4. Cowardin, L.M., Carter, V., Golet, E.C. <strong>and</strong> La Roe (1979). Classification <strong>of</strong> wetl<strong>and</strong>s <strong>and</strong> deep waterhabitats. USFWS/085-79/31, Office <strong>of</strong> the Biological Services, U.S. Fish <strong>and</strong> Wildlife Service,Washington, D.C.5. Encyclopaedic Directory <strong>of</strong> <strong>Environment</strong> (1988). (Ed. By G.R. Chatwal, D.K. P<strong>and</strong>ey, <strong>and</strong> K.K.N<strong>and</strong>a). Vol. I-IV, Anmol Publications, New Delhi.6. Garg, J.K., Singh, T.S. <strong>and</strong> Murthy, T.V.R. (1998). Wetl<strong>and</strong>s <strong>of</strong> India. Project Report:RSAM/sac/resa/pr/01/98, June 1998, 240 p. Space Applications Centre, Ahmedabad,7. Garg J.K. <strong>and</strong> Patel J. G., 2007. National Wetl<strong>and</strong> Inventory <strong>and</strong> Assessment, Technical Guidelines<strong>and</strong> Procedure Manual, Technical Report, SAC/EOAM/AFEG/NWIA/TR/01/2007, June 2007, SpaceApplications Centre, Ahmedabad,8. Glossary <strong>of</strong> Geology (1974). (Ed. By Margarate G., Robbert, M. Jr. <strong>and</strong> Wolf, C.L), AmericanGeological Institute, Washington, D.C..9. Jensen, J.R. (1986). Introductory Digital Image Processing: A Remote Sensing Perspective, PrenticeHall, Englewoods Cliff, NJ.10. Lacaux, J.P., Tourre, Y.M., Vignolles, C., Ndione, J.A. <strong>and</strong> Lafaye, M. 2007. Classification <strong>of</strong> pondsfrom high-spatial resolution remote sensing: Application to Rift valley fever epidemics in Senegal.Remote Sensing <strong>of</strong> <strong>Environment</strong>, 106, pp. 66-7411. Lilles<strong>and</strong>, T.M. <strong>and</strong> Keifer, R.W. 1987. Remote Sensing <strong>and</strong> Image Interpretation. John Wliey <strong>and</strong>Sons, New York.12. Manorama Yearbook 200713. McGraw - Hill Encyclopaedia <strong>of</strong> <strong>Environment</strong>al Science (1974). (Ed. Sybil P. Parkar), McGraw-HillBook Company, New York.14. McFeeters, S.K. 1996. The use <strong>of</strong> Normalised Difference Water Index (NDWI) in the delineation <strong>of</strong>open water features. International Journal <strong>of</strong> remote Sensing, 7, pp. 1425-1432.15. Millennium Ecosystem Assessment. 2005, Ecosystems <strong>and</strong> Human Well-being: A Framework forAssessment, http://www.MAweb.org16. Mitsch, William J. <strong>and</strong> Gosselink, James G. (1986). Wetl<strong>and</strong>s, Van Nostr<strong>and</strong> Reinhold Company,New York.17. Navalgund, R.R., Nayak, S.R., Sudarshana, R., Nagaraja, R. <strong>and</strong> Ravindran, S. 2002. Proceedings<strong>of</strong> the ISPRS Commission VII. Symposium on Resource <strong>and</strong> <strong>Environment</strong>al Monitoring, IAPRS &SIS, Vol.35, Part-7, NRSA, Hyderabad.18. Patel J.G., Singh T.S., Garg J.K. et al, Wetl<strong>and</strong> Information System, West Bengal,SAC/RSAM/RESA/FLPG/WIS/01/2003, A Technical report: Space Applications Centre, Ahmedabad19. Ramsar Convention (2007). www.ramsar.org20. Reid, George K <strong>and</strong> Wood, Richard D. (1976). Ecology <strong>of</strong> Inl<strong>and</strong> Waters <strong>and</strong> Estuaries. D. VanNostr<strong>and</strong> Company, New York.21. SACON, 2004, Inl<strong>and</strong> Wetl<strong>and</strong>s <strong>of</strong> India : Conservation Atlas. Coimbatore, Salim Ali Centre forOrnithology <strong>and</strong> Natural History, 2004, ISBN 81-902136-1-X. ,Vedams eBooks (P) Ltd. VardhamanCharve Plaza IV, Building # 9, K.P Block, Pitampura,22. Singh T.S., Patel J.G., Garg J.K. et al. Loktak Lake Resources Information System (LRIS),SAC/RSAM/RESIPA/FLPG/WIS/02/2003, A Technical report: Space Applications Centre,Ahmedabad23. Townshend, J.R., <strong>and</strong> Justice, C.O. 1986. Analysis <strong>of</strong> dynamics <strong>of</strong> African vegetation using theNormalised difference Vegetation Index. International Journal <strong>of</strong> Remote Sensing, 7, pp. 1435-1445.24. Tucker, C.J. <strong>and</strong> Sellers, P.J. 1986. Satellite remote sensing <strong>of</strong> primary productivity. InternationalJournal <strong>of</strong> Remote Sensing, 7, pp. 1395-1416.25. Xu Hanqiu, 2006. Modification <strong>of</strong> normalised difference water index (NDWI) to enhance open waterfeatures in remotely sensed imagery. International Journal <strong>of</strong> Remote Sensing, 7, pp. 3025-3033.169
170
Annexure IDefinitions <strong>of</strong> wetl<strong>and</strong> categories used in the projectFor ease <strong>of</strong> underst<strong>and</strong>ing, definitions <strong>of</strong> wetl<strong>and</strong> categories <strong>and</strong> their typical appearance on satellite imagery is givenbelow:Wetl<strong>and</strong>Definition <strong>and</strong> descriptiontype code1000 Inl<strong>and</strong> Wetl<strong>and</strong>s1100 Natural1101 Lakes: Larger bodies <strong>of</strong> st<strong>and</strong>ing water occupying distinct basins (Reid et al, 1976). These wetl<strong>and</strong>soccur in natural depressions <strong>and</strong> normally fed by streams/rivers. On satellite images lakes appear indifferent hues <strong>of</strong> blue interspersed with pink (aquatic vegetation), isl<strong>and</strong>s (white if unvegetated, red incase <strong>of</strong> terrestrial vegetation). Vegetation if scattered make texture rough.1102 Ox-bow lakes/ Cut <strong>of</strong>f me<strong>and</strong>ers: A me<strong>and</strong>ering stream may erode the outside shores <strong>of</strong> its broadbends, <strong>and</strong> in time the loops may become cut-<strong>of</strong>f, leaving basins. The resulting shallow crescentshapedlakes are called oxbow lakes (Reid et al, 1976). On the satellite image Ox-bow lakes occurnear the rivers in plain areas. Some part <strong>of</strong> the lake normally has aquatic vegetation (red/pink incolour) during pre-monsoon season.1103 High Altitude lakes: These lakes occur in the Himalayan region. L<strong>and</strong>scapes around high lakes arecharacterized by hilly topography. Otherwise they resemble lakes in the plain areas. For keepinguniformity in the delineation <strong>of</strong> these lakes contour line <strong>of</strong> 3000 m above msl will be taken asreference <strong>and</strong> all lakes above this contour line will be classified as high altitude lakes.1104 Riverine Wetl<strong>and</strong>s: Along the major rivers, especially in plains water accumulates leading t<strong>of</strong>ormation <strong>of</strong> marshes <strong>and</strong> swamp. Swamps are ‘Wetl<strong>and</strong> dominated by trees or shrubs’ (U.S.Definition). In Europe, a forested fen (a peat accumulating wetl<strong>and</strong> that has no significant inflows oroutflows <strong>and</strong> supports acidophilic mosses, particularly Sphagnum) could be called a swamp. In someareas reed grass - dominated wetl<strong>and</strong>s are also called swamps). (Mitsch <strong>and</strong> Gosselink, 1986).Marsh: A frequently or continually inundated wetl<strong>and</strong> characterised by emergent herbaceousvegetation adapted to saturated soil conditions. In European terminology a marsh has a mineral soilsubstrate <strong>and</strong> does not accumulate peat (Mitsch <strong>and</strong> Gosselink, 1986). Tone is grey blue <strong>and</strong> textureis smooth.Comment: Using satellite data it is difficult to differentiate between swamp <strong>and</strong> marsh. Hence, bothhave been clubbed together.1105 Waterlogged: Said <strong>of</strong> an area in which water st<strong>and</strong>s near, at, or above the l<strong>and</strong> surface, so that theroots <strong>of</strong> all plants except hydrophytes are drowned <strong>and</strong> the plants die (Margarate et al, 1974). Floodsor unlined canal seepage <strong>and</strong> other irrigation network may cause waterlogging. Spectrally, during theperiod when surface water exists, waterlogged areas appear more or less similar to lakes/ponds.However, during dry season large or all parts <strong>of</strong> such areas dry up <strong>and</strong> give the appearance <strong>of</strong>mud/salt flats (grey bluish).1106 River/stream: Rivers are linear water features <strong>of</strong> the l<strong>and</strong>scape. Rivers that are wider than themapping unit will be mapped as polygons. Its importance arises from the fact that many stretches <strong>of</strong>the rivers in Indo-Gangetic Plains <strong>and</strong> peninsular India are declared important national <strong>and</strong>international wetl<strong>and</strong>s (Ex. The river Ganga between Brajghat <strong>and</strong> Garh Mukteshwar, is a Ramsar site,Ranganthattu on the Cavery river is a bird sanctuary etc.). Wherever, rivers are wide <strong>and</strong> features likes<strong>and</strong> bars etc. are visible, they will be mapped.1200 Man-made1201Reservoir: A pond or lake built for the storage <strong>of</strong> water, usually by the construction <strong>of</strong> a dam across ariver (Margarate et al, 1974). On RS images, reservoirs have irregular boundary behind a prominentdyke. Wetl<strong>and</strong> boundary in case <strong>of</strong> reservoir incorporates water, aquatic vegetation <strong>and</strong> footprint <strong>of</strong>water as well. In the accompanying images aquatic vegetation in the reservoir is seen in bright pinktone. Tone is dark blue in deep reservoirs while it is ink blue in case <strong>of</strong> shallow reservoirs or reservoirswith high silt load. These will be annotated as Reservoirs/Dam.Barrage: Dykes are constructed in the plain areas over rivers for creating Irrigation/water facilities.Such water storage areas develop into wetl<strong>and</strong>s (Harike Barrage on Satluj – a Ramsar site, Okhlabarrage on the Yamuna etc. – a bird sanctuary). Water appears in dark blue tone with a smoothtexture. Aquatic vegetation appears in pink colour, which is scattered, or contiguous depending on thedensity. Reservoirs formed by barrages will be annotated as reservoir/barrage.171
1202 Tanks/Ponds: A term used in Ceylon <strong>and</strong> the drier parts <strong>of</strong> Peninsular India for an artificial pond, poolor lake formed by building a mud wall across the valley <strong>of</strong> a small stream to retain the monsoon(Margarate et al, 1974). Ponds Generally, suggest a small, quiet body <strong>of</strong> st<strong>and</strong>ing water, usuallyshallow enough to permit the growth <strong>of</strong> rooted plants from one shore to another (Reid et al, 1976).Tanks appear in light blue colour showing bottom reflectance.In this category Industrial ponds/mining pools mainly comprising Ab<strong>and</strong>oned Quarries are alsoincluded (Quarry is defined as "An open or surface working or excavation for the extraction <strong>of</strong> stone,ore, coal, gravel or minerals." In such pits water accumulate (McGraw Hill Encyclopaedia <strong>of</strong><strong>Environment</strong>al Sciences, 1974), Ash pond/Cooling pond (The water body created for dischargingeffluents in industry, especially in thermal power plants (Encyclopaedic Directory <strong>of</strong> <strong>Environment</strong>,1988) <strong>and</strong> Cooling pond: An artificial lake used for the natural cooling <strong>of</strong> condenser-cooling waterserving a conventional power station (Encyclopaedic Directory <strong>of</strong> <strong>Environment</strong>, 1988). These pondscan be <strong>of</strong> any shape <strong>and</strong> size. Texture is rough <strong>and</strong> tonal appearance light (quarry) to blue shade(cooling pond).1203 Waterlogged : Man-made activities like canals cause waterlogging in adjacent areas due to seepageespecially when canals are unlined. Such areas can be identified on the images along canal network.Tonal appearance is in various hues <strong>of</strong> blue. Sometimes, such waterlogged areas dry up <strong>and</strong> leavewhite scars on the l<strong>and</strong>. Texture is smooth.1204 Salt pans: Inl<strong>and</strong> salt pans in India occur in Rajasthan (Sambhar lake). These are shallow rectangularman-made depressions in which saline water is accumulated for drying in the sun for making salt.2000 Coastal Wetl<strong>and</strong>s2100 Natural2101 Lagoons/Backwaters: Such coastal bodies <strong>of</strong> water, partly separated from the sea by barrierbeaches or bass <strong>of</strong> marine origin, are more properly termed lagoons. As a rule, lagoons are elongate<strong>and</strong> lie parallel to the shoreline. They are usually characteristic <strong>of</strong>, but not restricted to, shores <strong>of</strong>emergence. Lagoons are generally shallower <strong>and</strong> more saline than typical estuaries (Reid et al, 1976).Backwater: A creek, arm <strong>of</strong> the sea or series <strong>of</strong> connected lagoons, usually parallel to the coast,separated from the sea by a narrow strip <strong>of</strong> l<strong>and</strong> but communicating with it through barred outlets(Margarate et al, 1974).2102 Creek: A notable physiographic feature <strong>of</strong> salt marshes, especially low marshes. These creeksdevelop as do rivers "with minor irregularities sooner or later causing the water to be deflected intodefinite channels" (Mitsch <strong>and</strong> Gosselink, 1986). Creeks will be delineated, however, their area willnot be estimated.2103 S<strong>and</strong>/Beach: Beach is an unvegetated part <strong>of</strong> the shoreline formed <strong>of</strong> loose material, usually s<strong>and</strong>that extends from the upper berm (a ridge or ridges on the backshore <strong>of</strong> the beach, formed by thedeposit <strong>of</strong> material by wave action, that marks the upper limit <strong>of</strong> ordinary high tides <strong>and</strong> wave wash tolow water mark(Clark,1977).Beach comprising rocky material is called rocky beach.2104 Intertidal mudflats: Most unvegetated areas that are alternately exposed <strong>and</strong> inundated by thefalling <strong>and</strong> rising <strong>of</strong> the tide. They may be mudflats or s<strong>and</strong> flats depending on the coarseness <strong>of</strong> thematerial <strong>of</strong> which they are made (Clark, 1977).2105 Salt Marsh: Natural or semi-natural halophytic grassl<strong>and</strong> <strong>and</strong> dwarf brushwood on the alluvialsediments bordering saline water bodies whose water level fluctuates either tidally or non- tidally(Mitsch <strong>and</strong> Gosselink, 1986). Salt marshes look in grey blue shade when wet.2106 Mangroves: The mangrove swamp is an association <strong>of</strong> halophytic trees, shrubs, <strong>and</strong> other plantsgrowing in brackish to saline tidal waters <strong>of</strong> tropical <strong>and</strong> sub-tropical coastlines (Mitsch <strong>and</strong> Gosselink,1986). On the satellite images mangroves occur in red colour if in contiguous patch. When mangroveassociations are scattered or are degraded then instead <strong>of</strong> red colour, brick red colour may be seen.2107 Coral reefs: Consolidated living colonies <strong>of</strong> microscopic organisms found in warm tropical waters. Theterm coral reef, or organic reef is applied to the rock- like reefs built-up <strong>of</strong> living things, principallycorals. They consist <strong>of</strong> accumulations <strong>of</strong> calcareous deposits <strong>of</strong> corals <strong>and</strong> corraline algae with theintervening space connected with s<strong>and</strong>, which consists largely <strong>of</strong> shells <strong>of</strong> foraminefera. Present reefsare living associations growing on this accumulation <strong>of</strong> past (Clark, 1977). Reefs appear in light blueshade.2200 Man-made2201 Salt pans: An undrained usually small <strong>and</strong> shallow rectangular, man-made depression or hollow inwhich saline water accumulates <strong>and</strong> evaporates leaving a salt deposit (Margarate et al, 1974). Saltpans are square or rectangular in shape. When water is there appearance is blue while salt is formedtone is white.2202 Aquaculture ponds: Aquaculture is defined as "The breeding <strong>and</strong> rearing <strong>of</strong> fresh-water or marinefish in captivity. Fish farming or ranching". The water bodies used for the above are called aquacultureponds (Encyclopaedic Directory <strong>of</strong> <strong>Environment</strong>, 1988). Aquaculture ponds are geometrical in shapeusually square or rectangular. Tone is blue.172
Annexure – IIDetails <strong>of</strong> District information followed in the atlasSource : Survey <strong>of</strong> India (Surveyed in 2004 <strong>and</strong> published in 2005)173
174
Space Applications Centre (SAC) is one <strong>of</strong> the majorcentres <strong>of</strong> the Indian Space Research Organisation(ISRO). It is a unique centre dealing with a wide variety <strong>of</strong>disciplines comprising design <strong>and</strong> development <strong>of</strong>payloads, societal applications, capacity building <strong>and</strong>space sciences, thereby creating a synergy <strong>of</strong>technology, science <strong>and</strong> applications. The Centre isresponsible for the development, realisation <strong>and</strong>qualification <strong>of</strong> communication, navigation, earth &planetary observation, meteorological payloads <strong>and</strong>related data processing <strong>and</strong> ground systems. Severalnational level application programmes in the area <strong>of</strong>natural resources, weather <strong>and</strong> environmental studies,disaster monitoring/mitigation, etc are also carried out. Itis playing an important role in harnessing spacetechnology for a wide variety <strong>of</strong> applications for societalbenefits.SAC is a host institution for the training programmesrelated to Satellite Communication, Satellite Meteorology<strong>and</strong> global change under the Centre for Space Science &Technology Education in Asia <strong>and</strong> the Pacific (CSSTEAP)affiliated to the United Nations (UN).http://www.isro.org
Space Applications centreIndian Space Research OrganisationAhmedabad – 380 015