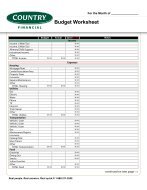
Prospectus - COUNTRY Financial
Prospectus - COUNTRY Financial
Prospectus - COUNTRY Financial
- No tags were found...

You also want an ePaper? Increase the reach of your titles
YUMPU automatically turns print PDFs into web optimized ePapers that Google loves.
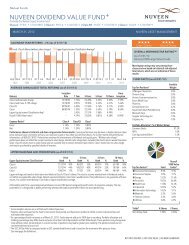
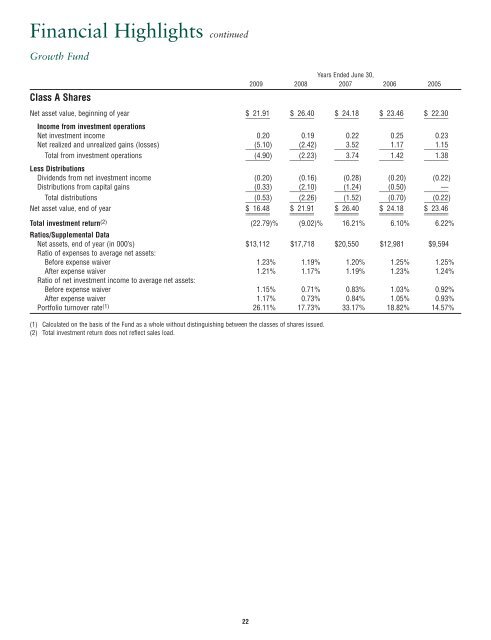
<strong>Financial</strong> Highlights continuedGrowth FundClass A SharesYears Ended June 30,2009 2008 2007 2006 2005Net asset value, beginning of year _______ $ 21.91 _______ $ 26.40 _______ $ 24.18 _______ $ 23.46 _______ $ 22.30Income from investment operationsNet investment income 0.20 0.19 0.22 0.25 0.23Net realized and unrealized gains (losses) _______ (5.10) _______ (2.42) _______ 3.52 _______ 1.17 _______ 1.15Total from investment operations _______ (4.90) _______ (2.23) _______ 3.74 _______ 1.42 _______ 1.38Less DistributionsDividends from net investment income (0.20) (0.16) (0.28) (0.20) (0.22)Distributions from capital gains _______ (0.33) _______ (2.10) _______ (1.24) _______ (0.50) _______ —Total distributions _______ (0.53) _______ (2.26) _______ (1.52) _______ (0.70) _______ (0.22)Net asset value, end of year _______$ 16.48 _______$ 21.91 _______$ 26.40 _______$ 24.18 _______$ 23.46Total investment return (2) (22.79)% (9.02)% 16.21% 6.10% 6.22%Ratios/Supplemental DataNet assets, end of year (in 000’s) $13,112 $17,718 $20,550 $12,981 $9,594Ratio of expenses to average net assets:Before expense waiver 1.23% 1.19% 1.20% 1.25% 1.25%After expense waiver 1.21% 1.17% 1.19% 1.23% 1.24%Ratio of net investment income to average net assets:Before expense waiver 1.15% 0.71% 0.83% 1.03% 0.92%After expense waiver 1.17% 0.73% 0.84% 1.05% 0.93%Portfolio turnover rate (1) 26.11% 17.73% 33.17% 18.82% 14.57%(1) Calculated on the basis of the Fund as a whole without distinguishing between the classes of shares issued.(2) Total investment return does not reflect sales load.22