Prospectus - COUNTRY Financial
Prospectus - COUNTRY Financial
Prospectus - COUNTRY Financial
- No tags were found...

You also want an ePaper? Increase the reach of your titles
YUMPU automatically turns print PDFs into web optimized ePapers that Google loves.
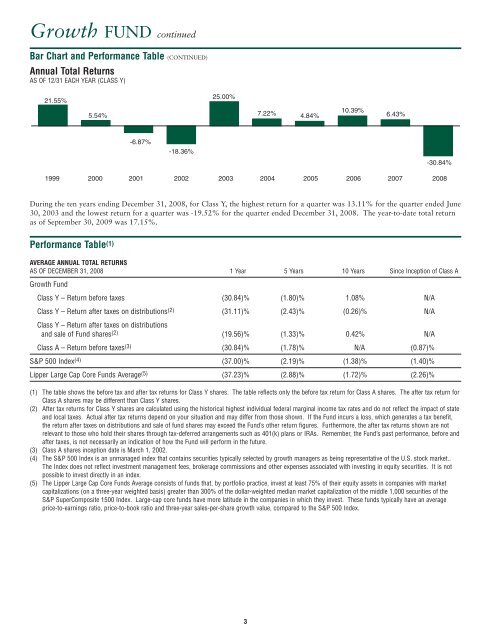
Growth FUND continuedBar Chart and Performance Table (CONTINUED)Annual Total ReturnsAS OF 12/31 EACH YEAR (CLASS Y)21.55%5.54%25.00%7.22% 4.84%10.39%6.43%-6.87%-18.36%-30.84%1999 2000 2001 2002 2003 2004 2005 2006 2007 2008During the ten years ending December 31, 2008, for Class Y, the highest return for a quarter was 13.11% for the quarter ended June30, 2003 and the lowest return for a quarter was -19.52% for the quarter ended December 31, 2008. The year-to-date total returnas of September 30, 2009 was 17.15%.Performance Table (1)AVERAGE ANNUAL TOTAL RETURNSAS OF DECEMBER 31, 2008 1 Year 5 Years 10 Years Since Inception of Class AGrowth FundClass Y – Return before taxes (30.84)% (1.80)% 1.08% N/AClass Y – Return after taxes on distributions (2) (31.11)% (2.43)% (0.26)% N/AClass Y – Return after taxes on distributionsand sale of Fund shares (2) (19.56)% (1.33)% 0.42% N/AClass A – Return before taxes (3) (30.84)% (1.78)% N/A (0.87)%S&P 500 Index (4) (37.00)% (2.19)% (1.38)% (1.40)%Lipper Large Cap Core Funds Average (5) (37.23)% (2.88)% (1.72)% (2.26)%(1) The table shows the before tax and after tax returns for Class Y shares. The table reflects only the before tax return for Class A shares. The after tax return forClass A shares may be different than Class Y shares.(2) After tax returns for Class Y shares are calculated using the historical highest individual federal marginal income tax rates and do not reflect the impact of stateand local taxes. Actual after tax returns depend on your situation and may differ from those shown. If the Fund incurs a loss, which generates a tax benefit,the return after taxes on distributions and sale of fund shares may exceed the Fund’s other return figures. Furthermore, the after tax returns shown are notrelevant to those who hold their shares through tax-deferred arrangements such as 401(k) plans or IRAs. Remember, the Fund’s past performance, before andafter taxes, is not necessarily an indication of how the Fund will perform in the future.(3) Class A shares inception date is March 1, 2002.(4) The S&P 500 Index is an unmanaged index that contains securities typically selected by growth managers as being representative of the U.S. stock market..The Index does not reflect investment management fees, brokerage commissions and other expenses associated with investing in equity securities. It is notpossible to invest directly in an index.(5) The Lipper Large Cap Core Funds Average consists of funds that, by portfolio practice, invest at least 75% of their equity assets in companies with marketcapitalizations (on a three-year weighted basis) greater than 300% of the dollar-weighted median market capitalization of the middle 1,000 securities of theS&P SuperComposite 1500 Index. Large-cap core funds have more latitude in the companies in which they invest. These funds typically have an averageprice-to-earnings ratio, price-to-book ratio and three-year sales-per-share growth value, compared to the S&P 500 Index.3