Tools for More Accurate Inpatient Cost Estimates with HCUP ...
Tools for More Accurate Inpatient Cost Estimates with HCUP ...
Tools for More Accurate Inpatient Cost Estimates with HCUP ...

Create successful ePaper yourself
Turn your PDF publications into a flip-book with our unique Google optimized e-Paper software.
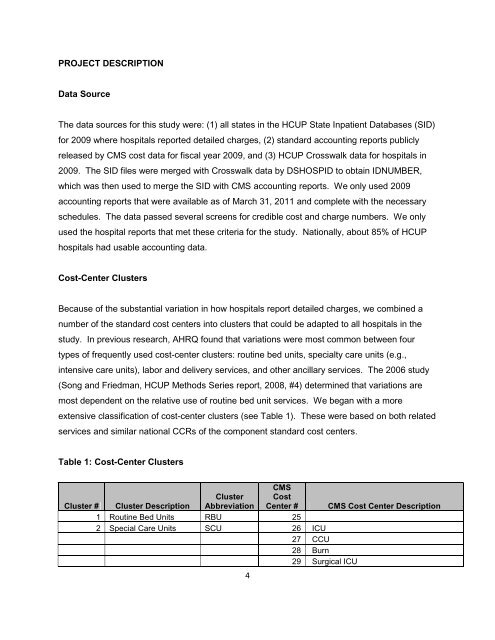
PROJECT DESCRIPTIONData SourceThe data sources <strong>for</strong> this study were: (1) all states in the <strong>HCUP</strong> State <strong>Inpatient</strong> Databases (SID)<strong>for</strong> 2009 where hospitals reported detailed charges, (2) standard accounting reports publiclyreleased by CMS cost data <strong>for</strong> fiscal year 2009, and (3) <strong>HCUP</strong> Crosswalk data <strong>for</strong> hospitals in2009. The SID files were merged <strong>with</strong> Crosswalk data by DSHOSPID to obtain IDNUMBER,which was then used to merge the SID <strong>with</strong> CMS accounting reports. We only used 2009accounting reports that were available as of March 31, 2011 and complete <strong>with</strong> the necessaryschedules. The data passed several screens <strong>for</strong> credible cost and charge numbers. We onlyused the hospital reports that met these criteria <strong>for</strong> the study. Nationally, about 85% of <strong>HCUP</strong>hospitals had usable accounting data.<strong>Cost</strong>-Center ClustersBecause of the substantial variation in how hospitals report detailed charges, we combined anumber of the standard cost centers into clusters that could be adapted to all hospitals in thestudy. In previous research, AHRQ found that variations were most common between fourtypes of frequently used cost-center clusters: routine bed units, specialty care units (e.g.,intensive care units), labor and delivery services, and other ancillary services. The 2006 study(Song and Friedman, <strong>HCUP</strong> Methods Series report, 2008, #4) determined that variations aremost dependent on the relative use of routine bed unit services. We began <strong>with</strong> a moreextensive classification of cost-center clusters (see Table 1). These were based on both relatedservices and similar national CCRs of the component standard cost centers.Table 1: <strong>Cost</strong>-Center ClustersCMSCluster # Cluster DescriptionClusterAbbreviation<strong>Cost</strong>Center # CMS <strong>Cost</strong> Center Description1 Routine Bed Units RBU 252 Special Care Units SCU 26 ICU27 CCU28 Burn29 Surgical ICU4