Friction measurement methods and the correlation between road - VTI
Friction measurement methods and the correlation between road - VTI
Friction measurement methods and the correlation between road - VTI

You also want an ePaper? Increase the reach of your titles
YUMPU automatically turns print PDFs into web optimized ePapers that Google loves.
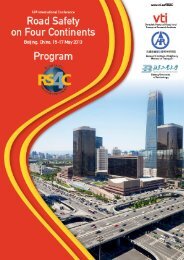
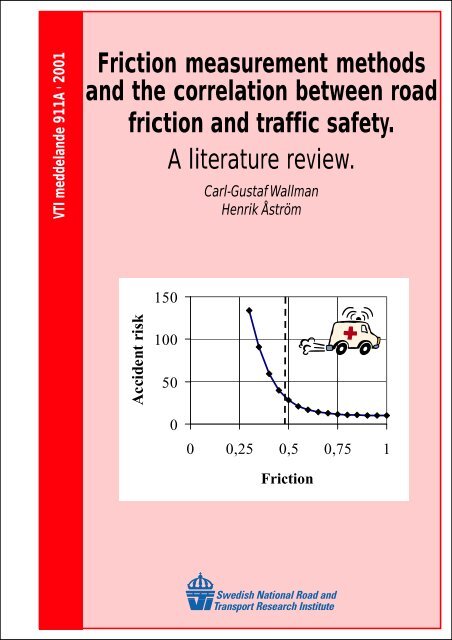
<strong>VTI</strong> meddel<strong>and</strong>e 911A • 2001<strong>Friction</strong> <strong>measurement</strong> <strong>methods</strong><strong>and</strong> <strong>the</strong> <strong>correlation</strong> <strong>between</strong> <strong>road</strong>friction <strong>and</strong> traffic safety.A literature review.Carl-Gustaf WallmanHenrik Åström150Accident risk1005000 0,25 0,5 0,75 1<strong>Friction</strong>
<strong>VTI</strong> meddel<strong>and</strong>e 911A · 2001<strong>Friction</strong> <strong>measurement</strong><strong>methods</strong> <strong>and</strong> <strong>the</strong> <strong>correlation</strong><strong>between</strong> <strong>road</strong> friction <strong>and</strong>traffic safetyA literature reviewCarl-Gustaf WallmanHenrik Åström
Publisher:Publication:<strong>VTI</strong> meddel<strong>and</strong>e 911APublished:2001Project code:80435S-581 95 Linköping Sweden Project:<strong>Friction</strong> <strong>and</strong> traffic safetyAuthor:Carl-Gustaf WallmanHenrik ÅströmSponsor:<strong>VTI</strong> Development ABTitle:<strong>Friction</strong> <strong>measurement</strong> <strong>methods</strong> <strong>and</strong> <strong>the</strong> <strong>correlation</strong> <strong>between</strong> <strong>road</strong> friction <strong>and</strong> traffic safety.A Literature review.AbstractDoubtless, <strong>the</strong>re is a strong <strong>correlation</strong> <strong>between</strong> <strong>road</strong> friction <strong>and</strong> accident risk. The problems arise whenwe dem<strong>and</strong> a more detailed view of that <strong>correlation</strong>. The aim of <strong>the</strong> project behind this report was toga<strong>the</strong>r information about <strong>the</strong> different friction <strong>methods</strong> in use <strong>and</strong> about published quantitative relations<strong>between</strong> <strong>road</strong> friction <strong>and</strong> accident risk.Regarding friction <strong>measurement</strong>s, every country has instruments <strong>and</strong> <strong>methods</strong> of its own, <strong>and</strong> <strong>the</strong> frictionvalues reported from different international investigations are <strong>the</strong>refore not directly comparable. Workon harmonisation of friction <strong>measurement</strong>s is in progress.Road friction is very important for traffic safety, but it is difficult to single out <strong>the</strong> effect of poor frictionon <strong>the</strong> accident risk. Drivers adjust <strong>the</strong>ir driving behaviour depending on many factors, e.g. <strong>the</strong>appearance of <strong>the</strong> <strong>road</strong> environment, <strong>the</strong> wea<strong>the</strong>r, <strong>the</strong> sound from <strong>the</strong> tyres, <strong>and</strong> <strong>the</strong> sliding <strong>and</strong> skiddingmovements of <strong>the</strong> vehicle.For dry or wet bare <strong>road</strong>way, however, <strong>the</strong> conditions are comparably homogeneous, <strong>and</strong> several studiesshow a dramatic increase in accident risk when <strong>the</strong> friction numbers decrease below certain thresholdvalues.For winter circumstances <strong>the</strong>re are few <strong>and</strong> unreliable estimations of <strong>the</strong> <strong>correlation</strong> <strong>between</strong> accidentrisk <strong>and</strong> friction.ISSN: Language: No. of pages:0347-6049 English 47
AcknowledgementsThis report summarises a literature review project made possible through <strong>the</strong> kindfinancial support by <strong>VTI</strong> Development AB to whom <strong>the</strong> authors would like toexpress <strong>the</strong>ir gratitude.The project leader at <strong>VTI</strong> has been Dr Henrik Åström who has contributedmainly to <strong>the</strong> part about friction <strong>measurement</strong>s. Dr Carl-Gustaf Wallman has beenresponsible for <strong>the</strong> accident risk literature <strong>and</strong> consequently also written thoseparts of <strong>the</strong> report.The authors are greatly indebted to Dr Anita Ihs, Mrs Gudrun Öberg <strong>and</strong> MrOlle Nordström for <strong>the</strong>ir valuable comments on this report.Henrik ÅströmProject leader <strong>and</strong> authorCarl-Gustaf WallmanAuthor<strong>VTI</strong> meddel<strong>and</strong>e 911A
ContentsAcknowledgementsSummary 51 Introduction 72 <strong>Friction</strong> vocabulary 83 Road friction <strong>measurement</strong> 93.1 Wet pavement friction 123.1.1 <strong>Friction</strong> <strong>measurement</strong> devices 133.1.2 The use of friction <strong>measurement</strong> in different countries 193.2 Winter <strong>road</strong> friction 203.3 <strong>Friction</strong> of <strong>road</strong> markings 223.4 Harmonisation 234 <strong>Friction</strong> <strong>and</strong> traffic safety 264.1 Introduction 264.2 Dry or wet <strong>road</strong>way 294.3 Winter <strong>road</strong> conditions 344.4 Comment 425 References 43<strong>VTI</strong> meddel<strong>and</strong>e 911A
<strong>Friction</strong> <strong>measurement</strong> <strong>methods</strong> <strong>and</strong> <strong>the</strong> <strong>correlation</strong> <strong>between</strong> <strong>road</strong> friction<strong>and</strong> traffic safety.A literature review.by Carl-Gustaf Wallman & Henrik ÅströmSwedish National Road <strong>and</strong> Transport Research Institute (<strong>VTI</strong>)SE-581 95 Linköping, SwedenSummaryDoubtless, <strong>the</strong>re is a strong <strong>correlation</strong> <strong>between</strong> <strong>road</strong> friction <strong>and</strong> accident risk.The problems arise when we dem<strong>and</strong> a more detailed view of that <strong>correlation</strong>. Anumber of different <strong>methods</strong> exists for evaluating <strong>and</strong> quantifying <strong>the</strong> <strong>road</strong>friction <strong>and</strong> also a number of ways to treat <strong>and</strong> categorise accident data.The aim of <strong>the</strong> project behind this report was to ga<strong>the</strong>r information about <strong>the</strong>different friction <strong>methods</strong> in use <strong>and</strong> about published quantitative relations<strong>between</strong> <strong>road</strong> friction <strong>and</strong> accident risk.Regarding friction <strong>measurement</strong>s, every country has instruments <strong>and</strong> <strong>methods</strong>of its own, <strong>and</strong> <strong>the</strong> friction values reported from different internationalinvestigations are <strong>the</strong>refore not directly comparable. Work on harmonisation offriction <strong>measurement</strong>s is in progress. One suggested solution is to introduce anInternational <strong>Friction</strong> Index, a common device-independent friction scale. Anambitious international calibration scheme is needed to get <strong>the</strong> necessaryconstants for <strong>the</strong> <strong>Friction</strong> Index calculations.Road friction is very important for traffic safety, but it is difficult to single out<strong>the</strong> effect of poor friction on <strong>the</strong> accident risk: drivers adjust <strong>the</strong>ir drivingbehaviour depending on many factors, e.g. <strong>the</strong> appearance of <strong>the</strong> <strong>road</strong>environment, <strong>the</strong> wea<strong>the</strong>r, <strong>the</strong> sound from <strong>the</strong> tyres, <strong>and</strong> <strong>the</strong> sliding <strong>and</strong> skiddingmovements of <strong>the</strong> vehicle.For dry or wet bare <strong>road</strong>way, however, <strong>the</strong> conditions are comparablyhomogeneous, <strong>and</strong> several studies show a dramatic increase in accident risk when<strong>the</strong> friction numbers decrease below certain threshold values.At winter conditions, similar-looking <strong>road</strong>ways may have very differentfriction conditions; on <strong>the</strong> o<strong>the</strong>r h<strong>and</strong>, different-looking <strong>road</strong>ways may have <strong>the</strong>same friction conditions. In both cases, <strong>the</strong> drivers mainly adapt to <strong>the</strong> appearanceof <strong>the</strong> environment <strong>and</strong> not to <strong>the</strong> friction conditions. Consequently, for wintercircumstances <strong>the</strong>re are few <strong>and</strong> unreliable estimations of <strong>the</strong> <strong>correlation</strong> <strong>between</strong>accident risk <strong>and</strong> friction.<strong>VTI</strong> meddel<strong>and</strong>e 911A 5
1 IntroductionRoad friction, its <strong>measurement</strong> <strong>and</strong> relation to traffic accident risks, is a problemthat has engaged thous<strong>and</strong>s of <strong>road</strong> engineers through out <strong>the</strong> world. In manycountries <strong>the</strong>re exist specified <strong>road</strong> friction threshold values that defines <strong>the</strong>lowest acceptable <strong>road</strong> friction. If <strong>the</strong> friction level is below this value <strong>the</strong>n <strong>the</strong>risk of accidents may increase. These threshold values are <strong>the</strong> result of researchinto <strong>the</strong> relation <strong>between</strong> <strong>road</strong> friction <strong>and</strong> accident risks.The aim of this literature review is to ga<strong>the</strong>r information about <strong>the</strong> differentfriction <strong>methods</strong> in use <strong>and</strong> about published quantitative relations <strong>between</strong> <strong>road</strong>friction <strong>and</strong> accident risk.The coupling <strong>between</strong> friction <strong>and</strong> accident risk is partly obvious, if <strong>the</strong> <strong>road</strong> isvery slippery <strong>the</strong>n <strong>the</strong> risk of skidding accidents would of course be high, butfinding <strong>the</strong> threshold values of <strong>the</strong> friction that is supposed to guide <strong>the</strong>maintenance <strong>and</strong> production of <strong>road</strong>s, is not easy. The problem can be split intotwo parts, <strong>the</strong> friction <strong>measurement</strong> <strong>methods</strong> <strong>and</strong> <strong>the</strong> relation <strong>between</strong> friction <strong>and</strong>accident risks. These two subjects are treated separately in this literature review,chapter 3 gives an overview of friction <strong>measurement</strong> devices <strong>and</strong> <strong>methods</strong>, <strong>and</strong>chapter 4 summarises <strong>the</strong> relation <strong>between</strong> friction <strong>and</strong> accident risk.A similar problem exists for <strong>the</strong> airfields. A large amount of references can befound regarding airfield friction <strong>measurement</strong>s but <strong>the</strong> airfield friction problemwas out of <strong>the</strong> scope of this report <strong>and</strong> has consequently not been regarded here.<strong>VTI</strong> meddel<strong>and</strong>e 911A 7
2 <strong>Friction</strong> vocabularyA brief description of <strong>the</strong> friction related terminology used in this report.<strong>Friction</strong>The resistance an object encounters in moving over ano<strong>the</strong>r object. Often <strong>the</strong> forceneeded to move <strong>the</strong> object, <strong>the</strong> frictional force.<strong>Friction</strong> value, friction numberThe numerical value of <strong>the</strong> friction given by a specific measuring device. Forsome devices it corresponds to <strong>the</strong> friction coefficient or <strong>the</strong> friction coefficientmultiplied by 100. Important to notice is that a certain friction value is alwaysconnected with a specific measuring device, a specific measuring tyre <strong>and</strong> specificoperating conditions.<strong>Friction</strong> coefficientNormalised friction. The frictional force divided by <strong>the</strong> normal force (<strong>the</strong> load).SkidSliding on slippery ground. In <strong>road</strong> circumstances skidding is <strong>the</strong> sliding of <strong>the</strong>locked wheel on <strong>the</strong> pavement.Skid resistanceThe resistance to skidding or <strong>the</strong> friction for locked wheel tests. Also used todescribe results from tests using <strong>the</strong> SRT pendulum, se figure 3.11. According toISO 8855 <strong>the</strong> longitudinal friction coefficient obtained on a locked wheel is calledsliding braking force coefficient.Skid numberThe friction value as measured according to ASTM 274 which describes <strong>the</strong>friction <strong>measurement</strong> using a locked, smooth or ribbed st<strong>and</strong>ard test tyre. The skidnumber is <strong>the</strong> measured friction coefficient multiplied by 100. It is designated asSN test speed R for ribbed tyre (ASTM E501) <strong>and</strong> SN test speed S for smooth tyre(ASTM E524), e.g. SN65S = 55. The test speed is normally 65 km/h (40 mph).Slip speedThe relative speed <strong>between</strong> <strong>the</strong> tyre <strong>and</strong> <strong>the</strong> travelled surface at <strong>the</strong> centre of <strong>the</strong>contact area.Longitudinal slip, longitudinal slip ratioThe quotient of <strong>the</strong> slip speed by <strong>the</strong> operating speed.Slip angleThe angle <strong>between</strong> <strong>the</strong> wheel <strong>and</strong> direction of travel of <strong>the</strong> centre of tyre contact.Slip resistanceThe resistance to slip (to lose one’s footing) for pedestrian surfaces. Can be <strong>the</strong>friction coefficient of that surface measured with special slip resistance devices,<strong>the</strong> British pendulum or <strong>the</strong> <strong>VTI</strong> PFT.8 <strong>VTI</strong> meddel<strong>and</strong>e 911A
3 Road friction <strong>measurement</strong><strong>Friction</strong> is an important <strong>road</strong> parameter that unfortunately is very difficult tomeasure. The devices used for friction <strong>measurement</strong> are not very complicated but<strong>the</strong> friction forces <strong>the</strong>y try to measure are very sensitive to a number of parametersthat are difficult to control. Meyer et al. [32] have summarised investigations ofseveral influencing parameters on <strong>the</strong> locked wheel friction value, friction<strong>measurement</strong>s according to <strong>the</strong> ASTM 1 E274. In <strong>the</strong> UK <strong>the</strong> SCRIM (Side forceCoefficient Road Inventory Machine) is used <strong>and</strong> <strong>the</strong> factors influencing <strong>the</strong>SCRIM friction value has been reported in a series of investigations [24-26]. It isnot surprising to have a difference in friction of about 5% <strong>between</strong> twoconsecutive <strong>measurement</strong>s of <strong>the</strong> same <strong>road</strong> surface, using <strong>the</strong> same device. Thatdifference may increase when using ano<strong>the</strong>r friction device or with increasingtime <strong>between</strong> <strong>measurement</strong>s.In a friction <strong>measurement</strong> <strong>the</strong>re are often three bodies involved, <strong>the</strong> measuringtyre, <strong>the</strong> <strong>road</strong> surface <strong>and</strong> some kind of contaminant interacting with both tyre <strong>and</strong><strong>road</strong> like for example water (wet friction), dust or wear particles etc. The frictionvalues measured depend to a great extent on all three bodies, <strong>the</strong>ir materialproperties, <strong>the</strong> local contact pressures, relative velocities etc. A summary of <strong>the</strong>important factors influencing <strong>the</strong> <strong>road</strong> surface friction is given in table 3.1.Table 3.1 Factors influencing <strong>road</strong> surface friction (extracted from Kummer[29] <strong>and</strong> S<strong>and</strong>berg [46]).Road Contaminant (fluid) TyreMacrotexture Chemical structure Tread pattern designMicrotexture Viscosity Rubber compositionUnevenness/Megatexture Density Inflation pressureChemistry of materials Temperature Rubber hardnessTemperature Thermal conductivity LoadThermal conductivity Specific heat Sliding velocitySpecific heat Film thickness TemperatureThermal conductivitySpecific heatOf <strong>the</strong> <strong>road</strong> parameters, <strong>the</strong> texture is <strong>the</strong> most important <strong>and</strong> <strong>the</strong> influence ofmacrotexture has also gained most interest in <strong>road</strong> friction research. A very goodoverview of <strong>road</strong> surface texture <strong>measurement</strong>s can be found in a report byS<strong>and</strong>berg [46]. The differences <strong>between</strong> micro, macro <strong>and</strong> megatexture is definedin table 3.2, from S<strong>and</strong>berg [46] <strong>and</strong> ISO 13473-1.1 American Society for Testing <strong>and</strong> Materials<strong>VTI</strong> meddel<strong>and</strong>e 911A 9
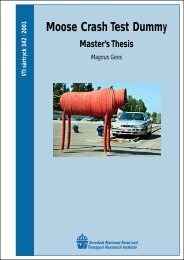
Table 3.2 Different ranges of <strong>road</strong> surface texture (from S<strong>and</strong>berg [46] <strong>and</strong> ISO13473-1).Texturewavelength rangeTypicalpeak-peak amplitudesMicrotexture < 0.5 mm 1 – 500 µmMacrotexture 0.5 – 50 mm 0.1 – 20 mmMegatexture 50 – 500 mm 0.1 – 50 mmUnevenness 0.5 – 50 m -When evaluating <strong>road</strong> friction <strong>the</strong> typical approach is to keep all influencingparameters except <strong>the</strong> <strong>road</strong> surface constant. The surface is normally wetted witha specified amount of water <strong>and</strong> a st<strong>and</strong>ardised measuring tyre is used. A smoothtyre like <strong>the</strong> one specified in ASTM E524 or <strong>the</strong> PIARC 2 smooth test tyre, ribbedtyres like ASTM E501 or <strong>the</strong> patterned tyre in ASTM E1136 are examples ofcommon tyres for <strong>road</strong> surface friction evaluation, figure 3.1. The ASTM E524<strong>and</strong> E501 have an outer diameter of 703 mm, <strong>the</strong> ASTM E1136 has an outerdiameter of 648 mm <strong>and</strong> <strong>the</strong> PIARC smooth <strong>and</strong> ribbed test tyres have an outerdiameter of 646 mm.a) b) c) d)Figure 3.1 Four st<strong>and</strong>ard friction test tyres. a) Patterned ASTM E1136 b) RibbedASTM E501 c) Smooth ASTM E524 d) Patterned T49 (Swedish st<strong>and</strong>ard frictiontest tyre)In Figure 3.1 also <strong>the</strong> Swedish st<strong>and</strong>ard tyre for <strong>road</strong> friction <strong>measurement</strong>s,Trelleborg T49, is shown. With its outer diameter of 420 mm it is smaller than <strong>the</strong>ASTM <strong>and</strong> PIARC test tyres. Ano<strong>the</strong>r st<strong>and</strong>ard test tyre of smaller size is <strong>the</strong>smooth ASTM E1844-96 test tyre for <strong>the</strong> GripTester (described in chapter 3.1.1).This tyre has an outer diameter of 258 mm.2 World Road Association10 <strong>VTI</strong> meddel<strong>and</strong>e 911A
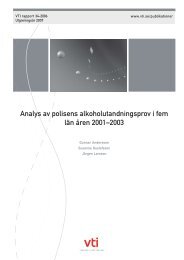
0,70,60,50,40,30,20,10Dense asphalt Surface dressing Porous asphalt197519841998Figure 3.2 <strong>Friction</strong> coefficient measured with three different batches of PIARCtest tyres [10]<strong>Friction</strong> values are very sensitive to <strong>the</strong> tyre used <strong>and</strong> even apparently identicalsamples from two different batches of a st<strong>and</strong>ardised tyre can produce differentfriction results, maybe not large differences but significant. The reasons for thatare for example small differences in <strong>the</strong> tyre rubber composition <strong>and</strong> maybe alsosmall differences in tyre geometry. For most manufacturers <strong>the</strong> market forst<strong>and</strong>ardised test tyres is very small compared to <strong>the</strong>ir o<strong>the</strong>r products <strong>and</strong> <strong>the</strong>reforetest tyres are normally produced in larger batches say every fourth year <strong>and</strong> alsooften by different producers. KOAC, WMD (Dutch Road Research Laboratories)[10] has compared PIARC test tyres from <strong>the</strong> batches 1975, 1984 <strong>and</strong> 1998 <strong>and</strong>found differences in <strong>the</strong> friction values partly explained by differences in <strong>the</strong>compound chemistry, see figure 3.2. In <strong>the</strong> case of <strong>the</strong> 1975 tyres <strong>the</strong> difference isquite large which in <strong>the</strong> Ne<strong>the</strong>rl<strong>and</strong>s also led to <strong>the</strong> introduction of a frictioncorrection formula.According to investigations by Henry [22] <strong>and</strong> Bachmann [12] <strong>the</strong> ribbed <strong>and</strong>smooth st<strong>and</strong>ard test tyres (ASTM <strong>and</strong> PIARC) have a lower friction coefficienton a normal wet <strong>road</strong> than a commercial passenger car tyre. As water depth isincreased, <strong>the</strong> ribbed test tyre increases in performance <strong>and</strong> was found to givehigher friction values than a slightly worn normal passenger car tyre.<strong>Friction</strong> of <strong>the</strong> <strong>road</strong> pavement is usually evaluated in <strong>the</strong> summer period. Thereis a seasonal variation that has to be considered. The wet friction of a specificpavement is normally higher in <strong>the</strong> spring than in <strong>the</strong> autumn [23; 27] due to adepolishing effect from <strong>the</strong> snow removal activities <strong>and</strong> <strong>the</strong> studded tyres.During <strong>the</strong> winter period <strong>the</strong>re is a risk that <strong>the</strong> water spread during <strong>the</strong> wetfriction <strong>measurement</strong> freezes. The pavement can also be covered with snow or ice.<strong>Friction</strong> <strong>measurement</strong>s during winter are <strong>the</strong>refore typically aimed at wintermaintenance evaluation.<strong>VTI</strong> meddel<strong>and</strong>e 911A 11
Number of tyres454035302520151050Optimum frictionSliding friction0,30,40,50,60,70,80,911,1<strong>Friction</strong> coefficientFigure 3.3 Optimum <strong>and</strong> sliding wet friction for 82 different passenger car tyres[39; 47] measured on a normal <strong>road</strong> with asphalt concrete.Using results from an investigation of tyre friction <strong>and</strong> noise [47] <strong>the</strong> difference<strong>between</strong> <strong>the</strong> optimum friction <strong>and</strong> <strong>the</strong> sliding (locked wheel) friction can beillustrated, see figure 3.3.Here also <strong>the</strong> difference <strong>between</strong> tyres of different br<strong>and</strong>s can be seen, in <strong>the</strong>investigation <strong>the</strong> wet grip of about 82 different tyres was measured. All<strong>measurement</strong>s were performed on <strong>the</strong> same asphalt <strong>road</strong> surface. The best tyre hasan optimum wet friction coefficient of about 1.0 <strong>and</strong> <strong>the</strong> worst tyre about 0.7.Nordström <strong>and</strong> Gustavsson [38] found a range for <strong>the</strong> optimum friction coefficient<strong>between</strong> 0.6 <strong>and</strong> 0.85 in a similar investigation using a different measuringprinciple <strong>and</strong> about 250 different passenger car tyres.This clearly indicates <strong>the</strong> importance of <strong>the</strong> tyre when evaluating <strong>road</strong> friction,<strong>and</strong> also clearly show that individual cars can experience different friction levelseven if <strong>the</strong> friction of <strong>the</strong> pavement is constant as evaluated using one st<strong>and</strong>ardtyre.3.1 Wet pavement friction<strong>Friction</strong> values of <strong>the</strong> wetted pavement are used for pavement assessment <strong>and</strong>guideline for repaving <strong>and</strong> pavement production. In Sweden, for example, <strong>the</strong>Swedish National Road Administration (SNRA) stipulates that <strong>the</strong> <strong>road</strong> surfaceshould have a wet friction value of at least 0.5 [5; 9] measured with a BV11 or aSaab <strong>Friction</strong> Tester, see chapter 3.1.1 below. Similar regulations also exist ino<strong>the</strong>r countries, see chapter 3.1.2 below.Wet friction is <strong>the</strong> overall most common friction <strong>measurement</strong>. The reason formeasuring a wet surface instead of a dry surface is that <strong>the</strong> dry surface, with itshigher friction values, is not considered to be a problem. It is when <strong>the</strong> pavementsurface is wet that <strong>the</strong> risk of skidding is large.12 <strong>VTI</strong> meddel<strong>and</strong>e 911A
3.1.1 <strong>Friction</strong> <strong>measurement</strong> devicesWhen a tyre is braked from a free rolling situation to locked wheel <strong>the</strong> frictionforce experienced by <strong>the</strong> wheel hub changes depending on <strong>the</strong> slip (<strong>the</strong> ratio<strong>between</strong> slip speed <strong>and</strong> operating speed). This is illustrated in <strong>the</strong> typical frictionslipcurve shown in figure 3.4. The maximum friction is normally found at a sliprate of about 7–20% <strong>and</strong> can be considerably higher than <strong>the</strong> locked wheel friction(100% slip).Figure 3.4 <strong>Friction</strong>-slip curve of a braking tyre showing <strong>the</strong> friction variationfrom free rolling (0% slip) to locked wheel (100% slip).Road friction can be measured using one out of five different principles: lockedwheel (100% slip), constant slip (normally <strong>between</strong> 10 <strong>and</strong> 20% slip), variableslip (0 to 100% slip), constant slip angle (usually 20 degrees) <strong>and</strong> retardation<strong>measurement</strong> of a normal ABS braked car. The influence of slip angle on <strong>the</strong> sideforce (lateral force) is illustrated in figure 3.5.<strong>VTI</strong> meddel<strong>and</strong>e 911A 13
Figure 3.5 Lateral friction force as a function of slip angle (from Gillespie[17]).Almost every country has its own friction-measuring device. Some devices aremore popular <strong>and</strong> are used by several countries, like <strong>the</strong> SCRIM (Side forceCoefficient Road Inventory Machine) or <strong>the</strong> Griptester. Many countries may haveseveral different devices for example for different purposes, one device for <strong>road</strong>friction screening <strong>measurement</strong>s <strong>and</strong> one smaller device for measuring specialinteresting spots on <strong>the</strong> <strong>road</strong> system.A large number of friction <strong>measurement</strong> devices are listed in a report from1972 by Ohlsson et al. [41], see table 3.3. Since 1972 many things has changed.Today in Sweden, for example, <strong>the</strong> BV11 [40] is used instead of BV5 accordingto table 3.3, but generally <strong>the</strong> situation is <strong>the</strong> same with a variety of differentdevices in different countries <strong>and</strong> SCRIM as <strong>the</strong> most common device in Europe.The Swedish <strong>road</strong> friction devices used today are <strong>the</strong> BV11 [40] <strong>and</strong> <strong>the</strong> SFT(Saab <strong>Friction</strong> tester), see figure 3.6 <strong>and</strong> 3.7. Both are braking friction typedevices with a constant slip of about 17%. The test tyre used is a patternedst<strong>and</strong>ard tyre, size 4.00-8 marked Trelleborg T49.Test wheelReferencewheelReference wheelLoadFigure 3.6 The Swedish skiddometer BV1114 <strong>VTI</strong> meddel<strong>and</strong>e 911A
BV11 is a trailer with <strong>the</strong> water tank placed in <strong>the</strong> car. In <strong>the</strong> SFT <strong>the</strong>measuring equipment is built into a normal passenger car which <strong>the</strong>n also holds<strong>the</strong> water tank. Both BV11 <strong>and</strong> SFT are common friction <strong>measurement</strong> devicesfor airfields, with an alternative test tyre, actually <strong>the</strong>y are much more common onairfields than on normal <strong>road</strong>s. There are a number of different versions of <strong>the</strong>SFT, e.g. <strong>the</strong> passenger car used as a base differs, but a recent comparison<strong>between</strong> two different versions [37] concluded that <strong>the</strong> friction values could becompared on a one to one basis.<strong>VTI</strong> meddel<strong>and</strong>e 911A 15
Table 3.3 Summary of friction <strong>measurement</strong> devices from different countries, from Ohlsson et al. [41]B DK GB FIN F NL I N PL CH E S CZ DMeasured force Side Side Side Braking Braking or Braking Braking Side Braking Braking Braking Braking Braking BrakingsideSlip (%) - - - 100 100 86 100 - 100 13 13 Optimal 100 100Slip angle (deg) 15 12 20 - 15 - - 7.5 - - - - - -Load (kN) 2.5 2.45 2 1.8 2.5 2.0 - 1.0 4.0 4.93 4.93 3.0 - 3.5Tyre type Radial Radial Diagonal Diagonal Radial Diagonal Diagonal Diagonal Diagonal Diagonal Diagonal Diagonal Diagonal DiagonalTread Smooth Smooth Smooth Patterned Smooth Patterned Smooth Smooth Patterned Patterned Patterned PatternedDimension 165-400 165-15 3.00-20 4.00-8 165-400 5.60-13 - 4.00-8 6.70-15 7.50-14 7.50-14 165-15 155-14 6.40-13Name Stradographe Stradograf SCRIM RRL-TrailerStradographeCEBTPRWL-TrailerModelArianoMu-meter SkiddometerBV8SkiddometerBV8SkiddometerBV5<strong>Friction</strong> value 0.50 3 0.50 4 0.55 0.51 0.40 0.35 65 5 40 3 0.26Speed (km/h) 80 60 50 50 60 60 80Type of <strong>road</strong>BrushedconcreteMax 2 yearsoldDifficultplacesAll <strong>road</strong>s All <strong>road</strong>s DifficultplacesVUD-1StuttgarterGerätAll <strong>road</strong>s Difficultplaces<strong>Friction</strong> value 0.45 0.40 2 0.50 60 3 0.33Speed (km/h) 50 1 60 50 60Type of <strong>road</strong> Asphalt O<strong>the</strong>r <strong>road</strong>s Main <strong>road</strong>s Main <strong>road</strong>s Difficultplaces <strong>and</strong>main <strong>road</strong>s<strong>Friction</strong> value 0.40 55 3 0.42Speed (km/h) 50 40Type of <strong>road</strong> O<strong>the</strong>r <strong>road</strong>s O<strong>the</strong>r <strong>road</strong>s Main <strong>road</strong>s<strong>VTI</strong> meddel<strong>and</strong>e 911A3 New <strong>road</strong>s only4 In addition, <strong>the</strong> maximum reduction in friction value when increasing measuring speed with 20 km/h is 0.1.5 Measured with <strong>the</strong> Portable Skid-Resistance Tester (SRT, British Pendulum)
Figure 3.7 The <strong>VTI</strong> Saab <strong>Friction</strong> Tester (SFT). The measuring wheel is situatedin <strong>the</strong> middle of <strong>the</strong> rear axle. The water tank is in <strong>the</strong> back seat, slightly visiblethrough <strong>the</strong> back windowAn ambitious programme for comparing different friction <strong>measurement</strong>devices was performed in 1992, <strong>the</strong> PIARC experiment [54]. There about 19different apparatuses were compared on a large number of different surfaces. Alist of <strong>the</strong> participating instruments can be seen in table 3.4.One of <strong>the</strong> main goals of <strong>the</strong> PIARC experiment was to find ways ofharmonising <strong>the</strong> different friction <strong>measurement</strong> devices, see also chapter 3.4.Some of <strong>the</strong> apparatuses in table 3.4 are widely spread like for example <strong>the</strong>SCRIM [26]. This machine was originally developed by TRRL in UK about 1953<strong>and</strong> is a rebuilt truck with a measuring wheel placed <strong>between</strong> <strong>the</strong> front <strong>and</strong> <strong>the</strong> rearaxle. The measuring wheel is a special motorcycle wheel mounted with a constantside slip angle of 20 degrees. During <strong>measurement</strong> <strong>the</strong> wheel is rotating freely <strong>and</strong><strong>the</strong> <strong>road</strong> surface friction is evaluated as <strong>the</strong> lateral force acting on <strong>the</strong> free rollingwheel divided by <strong>the</strong> load on <strong>the</strong> wheel, <strong>the</strong> Sideway-Force Coefficient (SFC).SCRIM uses <strong>the</strong> sideway-force method of measuring resistance to skiddingbecause it is more suitable for routine <strong>measurement</strong> [26] than e.g. <strong>the</strong> lockedwheel method. In 1976 <strong>the</strong>re were about 18 SCRIMs around <strong>the</strong> world <strong>and</strong> <strong>the</strong>number of devices has increased since <strong>the</strong>n. Tests are normally carried out at 50km/h.Ano<strong>the</strong>r widely spread device is <strong>the</strong> Griptester [30; 54], see figure 3.8, which isa fixed slip trailer developed by Findlay Irvine Ltd in UK 6 . This device is alsoextensively used in <strong>the</strong> UK as a complement to <strong>the</strong> SCRIM routine <strong>road</strong><strong>measurement</strong>s. More than 20 Griptester devices are placed at <strong>the</strong> local <strong>road</strong>administration offices around <strong>the</strong> country.6 Findlay Irvine Ltd, Bog Road, Penicuik, Midlothian, EH26 9BU, Scotl<strong>and</strong>, UK<strong>VTI</strong> meddel<strong>and</strong>e 911A 17
Table 3.4 <strong>Friction</strong> <strong>measurement</strong> devices participating in <strong>the</strong> PIARC experiment[54]Name Tyre Measurement CountryMethodStuttgarter Reibungsmesser Ribbed Fixed slip (20%) <strong>and</strong> CHlocked wheelSkiddometer BV8 Ribbed Fixed slip (20%) CHSkiddometer BV11 Patterned Fixed slip (17%) SNorsemeter Oscar Blank Variable slip NStuttgarter Reibungsmesser Ribbed Fixed slip (20%) <strong>and</strong> Alocked wheelASTM E274 trailer Blank Locked wheel USSRT Pendulum tester “Blank” Slider CHMuMeter Patterned Side force (7.5°) ESkid Resistance Tester Patterned Locked wheel PLSCRIM Blank Side force (20°) BSCRIM Blank Side force (20°) EKomatsu skid tester Blank Variable slip JDWW trailer Blank Fixed slip (86%) NLSCRIM Blank Side force (20°) EStradograf Blank Side force (12°) DKCRR Odoliograph Blank Side force (20°) BSCRIM Blank Side force (20°) DSCRIM Blank Side force (20°) ESCRIM Blank Side force (20°) FSUMMS Blank Side force (20°) ISCRIMTEX Blank Side force (20°) UKLCPC Skid Trailer Adhera Blank Locked wheel FDagmar/Petra Trailer Patterned Variable slip DGriptester Blank Fixed slip (14.5%) UKFigure 3.8 The Griptester device18 <strong>VTI</strong> meddel<strong>and</strong>e 911A
Some devices use a fixed slip, like <strong>the</strong> Griptester or <strong>the</strong> BV11. There are atleast two reasons for that, <strong>the</strong> slip is chosen so that it will represent <strong>the</strong> optimumbraking friction <strong>and</strong> <strong>the</strong> wear of <strong>the</strong> tyre is limited compared to tests with lockedwheel. One trailer used in <strong>the</strong> Ne<strong>the</strong>rl<strong>and</strong>s, measures with about 86% longitudinalslip [54]. In that case <strong>the</strong> argument is to reduce <strong>the</strong> wear of <strong>the</strong> tyre, <strong>the</strong> frictionvalues achieved correspond more to <strong>the</strong> locked wheel friction than to <strong>the</strong> optimumfriction.In Norway Norsemeter AS 7 has developed a flexible friction <strong>measurement</strong> unitcalled ROAR [48]. In figure 3.9 it can be seen in <strong>the</strong> form of a friction<strong>measurement</strong> trailer, including <strong>the</strong> water supply for wet friction <strong>measurement</strong>s.The measuring wheel has a smooth tyre with an outer diameter of 410 mm,ASTM E1551. It is placed on a separate unit, which include all mechanical partsnecessary for <strong>the</strong> <strong>measurement</strong> so that this small unit can act alone <strong>and</strong> forexample measure dry friction (e.g. winter maintenance evaluation) placed directlyon a <strong>road</strong> maintenance truck. During one <strong>measurement</strong> cycle (about 1 second)ROAR measures <strong>the</strong> complete friction-slip curve, from pure rolling to lockedwheel. The device can operate at speeds <strong>between</strong> 20 <strong>and</strong> 130 km/h.Figure 3.9 Norsemeter Roar friction <strong>measurement</strong> trailer.3.1.2 The use of friction <strong>measurement</strong> in different countriesIt is safe to say that <strong>the</strong> friction of <strong>the</strong> pavement is one of <strong>the</strong> most importantproperties of <strong>the</strong> <strong>road</strong>. Almost every country has some kind of device thatmeasures <strong>road</strong> friction <strong>and</strong> many countries have regulations or guidelinesconcerning acceptable <strong>road</strong> friction levels. The major argument being <strong>the</strong>connection <strong>between</strong> pavement friction <strong>and</strong> accident risks.According to <strong>the</strong> Swedish National Road Administration <strong>the</strong> wet friction of <strong>the</strong>pavement is not a problem in Sweden <strong>and</strong> friction <strong>measurement</strong>s is very seldomdone, even on <strong>the</strong> major <strong>road</strong> network. There exists only very few (about three)7 Norsemeter AS, P.O.Box 42, N-1351 Rud, Norway<strong>VTI</strong> meddel<strong>and</strong>e 911A 19
working devices for <strong>road</strong> friction <strong>measurement</strong> <strong>and</strong> <strong>the</strong>re exists no nationaldatabase for friction <strong>measurement</strong> values. <strong>Friction</strong> is measured when for exampleskid problems has been reported or in some cases after a new <strong>road</strong> has beenconstructed or an old <strong>road</strong> repaved.Polishing of pavements reduces <strong>the</strong> friction to, in some cases dangerous levels[27]. 1996 several accidents were reported in connection with a specific tunnel inStockholm <strong>and</strong> friction <strong>measurement</strong>s using <strong>the</strong> Saab <strong>Friction</strong> Tester (SFT) [28]also showed that local polishing of <strong>the</strong> pavement had reduced <strong>the</strong> friction valuebelow <strong>the</strong> acceptable level of 0.50. The <strong>road</strong> surface had to be milled, increasing<strong>the</strong> friction value to about 0.7. Wet friction can thus be a problem, <strong>and</strong> frictionmonitoring of, at least <strong>the</strong> major <strong>road</strong>s, could give additional input into a PMS(Pavement Management System). The pavement friction is one indicator of <strong>the</strong>need for pavement measures.In Norway <strong>and</strong> Finl<strong>and</strong> <strong>the</strong> wet friction situation is very similar to <strong>the</strong> situationin Sweden, very few wet friction <strong>measurement</strong>s are done <strong>and</strong> no friction databaseexists. In Finl<strong>and</strong> <strong>the</strong> levels of acceptable friction depend on <strong>the</strong> speed limit. For<strong>road</strong>s where 80 km/h is <strong>the</strong> highest speed <strong>the</strong> acceptable friction value is 0.4measured according to PANK 5201 or TIE 475 (a Finnish st<strong>and</strong>ard). With a speedlimit of 100 km/h, <strong>the</strong> acceptable friction value is 0.5 <strong>and</strong> with a speed limit of120 km/h <strong>the</strong> friction value should be at or above 0.6.In Denmark wet pavement friction is an important parameter in a national <strong>road</strong>database [21], <strong>and</strong> wet pavement friction is regularly measured, ones every thirdyear according to a Nordic inventory made 1996 [13]. This was very useful in <strong>the</strong>TOVE project [21] where Denmark, Finl<strong>and</strong>, Norway <strong>and</strong> Sweden toge<strong>the</strong>rinvestigated <strong>the</strong> connection <strong>between</strong> traffic safety <strong>and</strong> <strong>the</strong> properties of <strong>the</strong> <strong>road</strong>surface. The Danish friction database was used for evaluation of <strong>the</strong> connection<strong>between</strong> friction <strong>and</strong> accident risks, see also chapter 4.2.One of <strong>the</strong> leading countries regarding <strong>road</strong> friction monitoring is <strong>the</strong> UnitedKingdom. There a fleet of SCRIM devices has been measuring <strong>the</strong> <strong>road</strong> networkfor many years. The devices are compared <strong>and</strong> calibrated every year <strong>and</strong> frictiondata are stored, a common, national database is under construction. In <strong>the</strong> UK <strong>the</strong>level of acceptable friction varies with type of <strong>road</strong> <strong>and</strong> traffic situation [3]. Ahigher level of friction, e.g. friction values about 0.55 measured with SCRIM, isindicated for crossings <strong>and</strong> at approach to roundabouts. <strong>Friction</strong> levels are calledinvestigatory levels, which means that if friction is at or below this level aninvestigation has to be made <strong>and</strong>, if necessary, <strong>the</strong> surface has to be treated. O<strong>the</strong>rcountries also use a similar friction differentiation, <strong>the</strong> situation in 1972 is shownin table 3.3.In <strong>the</strong> Ne<strong>the</strong>rl<strong>and</strong>s friction of <strong>the</strong> major <strong>road</strong> network is monitored, about eightfriction trailers are in use, <strong>and</strong> each section on <strong>the</strong> major <strong>road</strong>s are measured everysecond year. The devices are calibrated each year.3.2 Winter <strong>road</strong> friction<strong>Friction</strong> <strong>measurement</strong> during winter is a way of assessing <strong>the</strong> winter maintenancemore than <strong>the</strong> pavement quality. The <strong>measurement</strong> has, because of <strong>the</strong> wintertemperatures, to be done dry <strong>and</strong> it is thus <strong>the</strong> presence of ice, snow or slush on<strong>the</strong> <strong>road</strong> surface that governs <strong>the</strong> friction value. In this report <strong>the</strong> winter friction<strong>measurement</strong> <strong>methods</strong> of <strong>the</strong> Nordic countries (Sweden, Norway <strong>and</strong> Finl<strong>and</strong>) arein focus.20 <strong>VTI</strong> meddel<strong>and</strong>e 911A
In Sweden mainly three friction <strong>measurement</strong> devices are used, BV11 <strong>and</strong>SFT, in this case without water, <strong>and</strong> BV14. BV14, shown in figure 3.10, is a twinfriction tester especially developed for winter maintenance evaluation [35; 36].BV14 is directly attached to <strong>the</strong> measuring vehicle, measures <strong>the</strong> dry frictionsimultaneously in both wheel paths <strong>and</strong> uses <strong>the</strong> same measuring wheel <strong>and</strong>measuring technique as <strong>the</strong> BV11.Figure 3.10 The <strong>VTI</strong> BV14 twin friction tester, here mounted on <strong>the</strong> Swedishwinter <strong>road</strong> condition monitoring vehicle.Up to now BV14 has mainly been used in research projects. One BV14 is e.g.mounted on <strong>the</strong> Swedish winter <strong>road</strong> condition monitoring vehicle [8; 33],developed for research purposes.In Finl<strong>and</strong> a friction <strong>measurement</strong> truck (TIE 475) is used also for wintermaintenance evaluation <strong>and</strong> in Norway mainly <strong>the</strong> ROAR friction <strong>measurement</strong>device is used, without water.The majority of friction <strong>measurement</strong>s during winter carried out in Sweden,Norway <strong>and</strong> Finl<strong>and</strong> are done with normal passenger cars with ABS <strong>and</strong>instrumentation to measure deceleration during braking. By applying <strong>the</strong> brakeshard, <strong>the</strong> evaluated deceleration of <strong>the</strong> car is a measure of <strong>the</strong> available <strong>road</strong>friction. The advantage with this method is that it is simple <strong>and</strong> relativelyinexpensive, <strong>the</strong> <strong>road</strong> engineer can also use his own normal car. The maindisadvantage is that <strong>the</strong> precision of <strong>the</strong> method is low. The friction value deriveddepends for example to a great extent on <strong>the</strong> tyres of <strong>the</strong> car which are normalcommercial passenger car tyres whose br<strong>and</strong> <strong>and</strong> type differ <strong>between</strong> differentfriction evaluation vehicles. It is a practical approach <strong>and</strong> it apparently works wellfor judging <strong>the</strong> level of friction on a winter <strong>road</strong>.In Sweden <strong>the</strong> <strong>road</strong> administration requires that <strong>the</strong> friction evaluation car(with ABS <strong>and</strong> deceleration <strong>measurement</strong> equipment) should be regularlycalibrated against a BV11, a Saab <strong>Friction</strong> tester or a BV14 [6] on several typicalwinter <strong>road</strong> surfaces like ice <strong>and</strong> compacted snow.<strong>VTI</strong> meddel<strong>and</strong>e 911A 21
3.3 <strong>Friction</strong> of <strong>road</strong> markingsRoad markings reduce <strong>the</strong> accident risk [2] because <strong>the</strong>y provide <strong>the</strong> driver withimportant information regarding his position on <strong>the</strong> <strong>road</strong>, especially when drivingin darkness. The <strong>road</strong> marking materials have, however, normally a lower frictionvalue than <strong>the</strong> pavement surface. If marking material covers a larger area of <strong>the</strong><strong>road</strong> surface <strong>the</strong>re is a risk for driving on a split friction surface, <strong>the</strong> brakingdistance could increase as could <strong>the</strong> accident risk [23]. Additionally <strong>the</strong>re is a riskfor pedestrian skidding accidents at <strong>road</strong> crossings if <strong>the</strong> crossing markingmaterial has a too low friction.The Swedish <strong>road</strong> administration, as well as <strong>road</strong> authorities in o<strong>the</strong>r countries,has decided upon a lowest acceptable friction level for <strong>the</strong> <strong>road</strong> marking material.A European st<strong>and</strong>ard for <strong>road</strong> marking material performance also exists, EN 1436.Consequently friction of <strong>road</strong> marking materials has to be measured. In Sweden<strong>the</strong> friction of a <strong>road</strong> marking material can be measured with two devices [4], <strong>the</strong>Portable Skid Resistance Tester (British Pendulum, SRT), illustrated in figure3.11, <strong>and</strong> <strong>the</strong> <strong>VTI</strong> PFT, shown in figure 3.12. According to Swedish <strong>and</strong>Norwegian regulations [9; 13] <strong>and</strong> <strong>the</strong> European st<strong>and</strong>ard EN 1436 <strong>the</strong> SRT valueshould be higher than 45, which correspond to a <strong>VTI</strong> PFT value of 0.60 [57]. InFinl<strong>and</strong> friction of <strong>road</strong> markings is not measured. In Denmark <strong>the</strong> friction shouldbe above 50 SRT units [13] or at least 0.40 measured with <strong>the</strong> Stardograph.Figure 3.11 The Portable Skid Resistance Tester (SRT). A pendulum with arubber shoe that slides over <strong>the</strong> test surface.Internationally <strong>the</strong> Portable Skid Resistance Tester (SRT) is <strong>the</strong> instrumentused for measuring <strong>road</strong> marking material friction. The instrument has a longhistory <strong>and</strong> is widely spread, descriptions of <strong>the</strong> instrument can be found in e.g.[1; 16; 23; 57]. The SRT has some disadvantages, though. It is complicated to use<strong>and</strong> it is not possible to measure friction on many of <strong>the</strong> profiled <strong>road</strong> markingsthat are often used on <strong>road</strong>s today.22 <strong>VTI</strong> meddel<strong>and</strong>e 911A
10 cmFigure 3.12<strong>VTI</strong> Portable <strong>Friction</strong> Tester (PFT)At <strong>VTI</strong> a portable friction tester called PFT has been developed <strong>and</strong> used formeasuring <strong>road</strong>-marking friction. It has been shown to compare well with <strong>the</strong> SRTinstrument [15; 31; 57]. It is easier to use, <strong>the</strong> operator can measure in uprightposition, measured data can be saved in a computer, <strong>and</strong> <strong>the</strong> PFT can measure alsomost of <strong>the</strong> profiled <strong>road</strong> markings. Unfortunately <strong>the</strong> PFT instrument so far onlyexists in very few numbers.3.4 HarmonisationThe most ambitious attempt to harmonise <strong>the</strong> different <strong>road</strong> friction devices usedtoday is <strong>the</strong> PIARC experiment [54]. In many situations, e.g. in joint European orinternational research projects, <strong>the</strong>re is a need for comparing friction valuesmeasured in different countries using <strong>the</strong>ir specific devices. It is well known that<strong>the</strong> friction value depend on <strong>the</strong> device with which it is measured. Measuringtyres, load, slip speed, measuring speed etc all can differ <strong>between</strong> <strong>the</strong> devices. Theaim of <strong>the</strong> PIARC experiment was to make it possible to calculate an internationalfriction index from a friction <strong>measurement</strong> using any device <strong>and</strong> a <strong>measurement</strong>of <strong>the</strong> <strong>road</strong> surface macrotexture (e.g. <strong>the</strong> Mean Profile Depth, MPD, value). Thisfriction index should be independent of <strong>the</strong> device used. The macrotexture isneeded because <strong>the</strong> influence of slip speed on <strong>the</strong> friction value differs <strong>between</strong>different pavements, with different macrotexture. The friction index equationyields [54]:FI=A + B * F * e⎛ S 60 ⎞⎜−⎟⎜ S p⎟⎝ ⎠+ C * TxS p= a + b * Tx<strong>VTI</strong> meddel<strong>and</strong>e 911A 23
Where FI is <strong>the</strong> friction index (at 60 km/h slip speed), A, B <strong>and</strong> C are devicespecific constants, F is <strong>the</strong> measured friction value with <strong>the</strong> specific device usingslip speed S in km/h. S p is <strong>the</strong> predicted so called golden value speed number, Txis a measure of <strong>the</strong> macrotexture (for example MPD in mm), a <strong>and</strong> b are constantsdepending on <strong>the</strong> macrotexture <strong>measurement</strong> device. For smooth tyres <strong>the</strong>constant C is equal to zero [54].Using one friction <strong>measurement</strong> at one slip speed <strong>and</strong> a measure of <strong>the</strong> surfacetexture <strong>the</strong> friction at any slip speed, for that device, can be estimated. Thisrelation <strong>between</strong> friction <strong>and</strong> slip speed is illustrated in figure 3.13 where also <strong>the</strong>method of friction index calculation is shown.<strong>Friction</strong>FR60⎛⎜⎜⎜⎜⎝S−60S= ⋅pFRSe⎞⎠IFI = A+B*FR60BV11Reference (golden curve)12{17%}60{86%}Slip speed (km/h){slip rate at 70 km/h}Figure 3.13 Demonstration of <strong>the</strong> calculation of <strong>the</strong> International <strong>Friction</strong>IndexIn <strong>the</strong> report from <strong>the</strong> PIARC experiment [54] <strong>the</strong> friction index was calculatedat a slip speed of 60 km/h, also demonstrated in figure 3.13. This slip speed wasby some researchers considered to be too high <strong>and</strong> a revised version waspresented, also found in <strong>the</strong> draft to an European st<strong>and</strong>ard (prEN13036), using areference slip speed of 30 km/h:FI=A + B * F * e⎛ ⎞⎜S −30⎟⎜ ⎟⎝ S p ⎠S p= 57 + 56* MPDWhere FI is <strong>the</strong> friction index (now at 30 km/h slip speed), A <strong>and</strong> B are devicespecific constants, F is <strong>the</strong> measured friction value with <strong>the</strong> specific device usingslip speed S in km/h. S p is <strong>the</strong> predicted so called golden value speed numbercalculated from <strong>the</strong> macrotexture given as <strong>the</strong> MPD (Mean Profile Depth) value.24 <strong>VTI</strong> meddel<strong>and</strong>e 911A
The concept of international friction index has been applied in several o<strong>the</strong>rinvestigations, for example in one by Lund [30]. He compared <strong>the</strong> DanishStradograf, <strong>the</strong> Griptester <strong>and</strong> ROAR <strong>and</strong> used <strong>the</strong> FI concept (with 60 km/h slipspeed) to correlate <strong>the</strong> results from <strong>the</strong> instruments. After calibration <strong>and</strong>adjustment of <strong>the</strong> device specific constants, with <strong>the</strong> Stradograf as referencedevice, <strong>the</strong> calculated FI values for <strong>the</strong> different devices fit well toge<strong>the</strong>r. In <strong>the</strong>conclusions it is recommended to include also <strong>the</strong> vehicle speed in <strong>the</strong> FIcalculation, not only slip speed.Three Nordic friction <strong>measurement</strong> devices, one Finnish <strong>measurement</strong> truck,<strong>the</strong> Danish Stradograf <strong>and</strong> <strong>the</strong> Swedish BV11 were compared by Arnberg <strong>and</strong>Sjögren [11]. They found a ra<strong>the</strong>r poor <strong>correlation</strong> <strong>between</strong> <strong>the</strong> different devices.Good <strong>correlation</strong> was found <strong>between</strong> ROAR <strong>and</strong> <strong>the</strong> Danish Stradograf in aninvestigation by Schmidt [48] <strong>and</strong> he recommended ROAR as a <strong>road</strong> friction<strong>measurement</strong> device for Denmark.Using <strong>the</strong> FI calculated according to <strong>the</strong> draft norm PrEN 13036, a <strong>the</strong>oreticalcomparison <strong>between</strong> for example <strong>the</strong> SCRIM <strong>and</strong> BV11 can be done. The devicespecific constants are collected from <strong>the</strong> draft norm <strong>and</strong> <strong>the</strong> SCRIM is representedas an average over four different SCRIM devices (UK, F, E, D). Assumingst<strong>and</strong>ard measuring speeds (70 km/h for <strong>the</strong> BV11 <strong>and</strong> 50 km/h for <strong>the</strong> SCRIM)<strong>and</strong> an MPD value of <strong>the</strong> <strong>road</strong> of 1 mm, <strong>the</strong> friction value for <strong>the</strong> SCRIM devicesare about 10% lower than <strong>the</strong> friction value given by BV11. If we could find aSwedish <strong>road</strong> with a friction level on <strong>the</strong> limit according to Swedish st<strong>and</strong>ards,that is a friction value of 0.50 measured with BV11, <strong>the</strong>n a SCRIM device wouldmeasure about 0.45.This exemplifies <strong>the</strong> difficulty with setting a level of acceptable friction for <strong>the</strong><strong>road</strong>. Instead of using friction values from a specific device <strong>the</strong> level of acceptablefriction should be given in <strong>the</strong> International <strong>Friction</strong> Index scale.There is a need for a continued harmonisation work regarding <strong>road</strong>friction <strong>measurement</strong> in order to achieve better specifications of acceptable<strong>road</strong> surface friction <strong>and</strong> to facilitate <strong>the</strong> comparisons of friction <strong>and</strong>accident rate data <strong>between</strong> different countries.<strong>VTI</strong> meddel<strong>and</strong>e 911A 25
4 <strong>Friction</strong> <strong>and</strong> traffic safety4.1 IntroductionOne of <strong>the</strong> main factors influencing traffic safety is <strong>the</strong> friction <strong>between</strong> <strong>the</strong>vehicles’ tyres <strong>and</strong> <strong>the</strong> <strong>road</strong> surface. Maintaining a certain safety level dem<strong>and</strong>sthat driver adapt <strong>the</strong>ir behaviour to changing friction conditions, mainly byadjusting <strong>the</strong>ir speed.Driving a car is a complex task placing high dem<strong>and</strong>s on <strong>the</strong> driver’sperceptual <strong>and</strong> cognitive processes. To operate <strong>the</strong> vehicle, <strong>the</strong> driver uses visual,auditory, <strong>and</strong> kines<strong>the</strong>tic information (cues), for example how <strong>the</strong> <strong>road</strong> <strong>and</strong> itsenvironment appears, <strong>the</strong> sound from <strong>the</strong> tyres, <strong>and</strong> <strong>the</strong> longitudinal <strong>and</strong> lateralmotion of <strong>the</strong> vehicle. This information is utilised by <strong>the</strong> driver to judge <strong>the</strong>friction level. Social Judgement Theory, Hammond et al. [19], may be used todescribe this kind of relationship <strong>between</strong> drivers <strong>and</strong> <strong>the</strong> <strong>road</strong> environment,Figure 4.1.WhiteRoadEcological sideSubjective sideLow<strong>Friction</strong>SkiddingCarDriverSloshingSoundAchievementFigure 4.1 Model for a driver's experience of low friction.However, <strong>the</strong> relation <strong>between</strong> each cue <strong>and</strong> friction is not perfect, what ismore, drivers are inconsistent or do not fully utilise <strong>the</strong> cues. The drivers'estimations of <strong>the</strong> friction conditions are generally very poor.Several studies support this view: by speed <strong>measurement</strong>s at different <strong>road</strong>wayconditions, by driver interviews at slippery <strong>road</strong> conditions, <strong>and</strong> by drivingsimulator experiments. The underlying assumption for <strong>the</strong> studies is that if <strong>the</strong>stopping distance at dry, bare <strong>road</strong>way conditions is considered as an indicator ofsafe speed, <strong>the</strong>n a correct speed adaptation to poorer friction should result in <strong>the</strong>same stopping distance. In reality, <strong>the</strong> speed is usually far from reduced to <strong>the</strong>necessary level.26 <strong>VTI</strong> meddel<strong>and</strong>e 911A
Öberg [60] has compiled <strong>measurement</strong>s of car speeds under different <strong>road</strong>conditions. For <strong>road</strong>s 7 metres wide with a typical posted speed of 90 km/h,average speeds are 85 to 95 km/h on dry, bare <strong>road</strong>s. Speeds are reduced in winterconditions with ice or hard-packed snow on <strong>the</strong> <strong>road</strong> surface, typically by 6 to 10km/h. If <strong>the</strong> driver reaction time is assumed to be 1 second <strong>and</strong> <strong>the</strong> frictioncoefficients 0.8 <strong>and</strong> 0.25, respectively, <strong>the</strong>n <strong>the</strong> stopping distance is almostdoubled, from 65 to 129 metres. To maintain <strong>the</strong> distance, <strong>the</strong> required speedshould have been about 56 km/h.The poor speed adaptation is also illustrated in Figure 4.2, from Öberg [59].Median stopping distances (calculated from measured speeds) are plotted againstactual median friction coefficients on five rural <strong>road</strong>s.Stopping distance (m)Figure 4.2 Actual stopping distance at different friction coefficients.Passenger cars with unstudded tyres.<strong>VTI</strong> meddel<strong>and</strong>e 911A 27
Ruud [43] measured mean speeds on <strong>road</strong> E18 in Norway. The speeds were 81,76 <strong>and</strong> 74 km/h when <strong>the</strong> friction numbers were 0.65, 0.40 <strong>and</strong> 0.25, respectively.This implies stopping distances of 62, 78 <strong>and</strong> 107 metres, respectively. On twonational <strong>road</strong>s <strong>the</strong> speeds were recorded to be 76, 71 <strong>and</strong> 69 km/h, when <strong>the</strong>friction numbers were 0.70, 0.39 <strong>and</strong> 0.26, leading to <strong>the</strong> stopping distances 54,71 <strong>and</strong> 91 metres.Three reports from <strong>the</strong> Finnish National Road Administration contain veryrelevant results for <strong>the</strong> issue. Heinijoki [20] examined <strong>the</strong> extent to which driverstake slipperiness into consideration in winter through driver interviews <strong>and</strong><strong>measurement</strong>s of car speeds. Roadway slipperiness was measured <strong>and</strong> dividedinto four categories of friction coefficients: good grip (f > 0.45), fairly good grip(0.35 < f ≤ 0.45), fairly slippery (0.25 < f ≤ 0.35), <strong>and</strong> slippery (f ≤ 0,25). Thedrivers were asked to evaluate <strong>the</strong> slipperiness on <strong>the</strong> same scale. Generally, <strong>the</strong>drivers were poor at evaluating <strong>the</strong> actual <strong>road</strong> conditions. Less than 30% of <strong>the</strong>evaluations coincided with <strong>the</strong> measured values, <strong>and</strong> more than 27% differed by2-3 categories. The more slippery conditions were, <strong>the</strong> more evaluations differedfrom reality, <strong>and</strong> consequently <strong>the</strong> slipperiness did not have any appreciable effecton driving speed.Saastamoinen [44] found that driving speed declined mostly as a function ofwintry wea<strong>the</strong>r or reduced speed limits. Road conditions were significant, <strong>the</strong>n,only in <strong>the</strong> case of snowy wea<strong>the</strong>r. Compared with good driving conditions, speeddecreased by 0–3 km/h when <strong>the</strong> grip was only fairly good (see above), 3-6 km/hunder fairly slippery conditions, <strong>and</strong> 4-7 km/h under slippery conditions. Thespeed did not change to any appreciable extent when <strong>the</strong> conditions changed fromfairly slippery to slippery.Roine [42] examined driving speed in sharp curves. The average speed wasabout 6 km/h less in sharp curves under slippery compared with dry or wet <strong>road</strong>conditions.Wallman [51] performed a controlled experiment in <strong>the</strong> <strong>VTI</strong> driving simulator,where subjects drove on a <strong>road</strong> under summer conditions with a frictioncoefficient of 0.8. Then <strong>the</strong> subjects drove <strong>the</strong> same <strong>road</strong> in a winter environment,<strong>and</strong> with friction coefficients 0.8, 0.4 <strong>and</strong> 0.25. Two test designs were envisaged,with different friction distributions along <strong>the</strong> <strong>road</strong> in <strong>the</strong> winter scenarios. Themean speed difference <strong>between</strong> summer <strong>and</strong> winter scenarios were 11-12 km/h<strong>and</strong> 16-17 km/h for <strong>the</strong> first <strong>and</strong> <strong>the</strong> second design, respectively. The differences<strong>between</strong> <strong>the</strong> winter scenarios were only about 1 km/h, independent of <strong>the</strong> frictionnumbers (even for <strong>the</strong> winter <strong>road</strong> with good friction). The conclusion was thatactual friction has little to do with <strong>the</strong> driver’s choice of speed; <strong>the</strong> visualinformation is much more relevant.This conclusion has also been drawn by Öberg [58], where <strong>the</strong> increase inspeed after a <strong>road</strong> had been s<strong>and</strong>ed did not correspond to <strong>the</strong> provided friction butra<strong>the</strong>r to an expected, good friction.According to <strong>the</strong> studies mentioned above, where <strong>the</strong> poor speed adaptation isestablished, we should expect a greater accident rate at low friction conditions.There are often, however, considerable difficulties in attaching accidents tospecific friction numbers, especially under winter conditions. There are alsofundamental differences <strong>between</strong> a bare <strong>road</strong>way <strong>and</strong> an icy or snowy <strong>road</strong>way,for example <strong>the</strong> perceptual <strong>and</strong> driving conditions as well as <strong>the</strong> stability <strong>and</strong>28 <strong>VTI</strong> meddel<strong>and</strong>e 911A
homogeneity of <strong>the</strong> surface conditions. Therefore, <strong>the</strong> literature review isseparated into two sections: accident rate at dry or wet <strong>road</strong> surface, <strong>and</strong> accidentrate at icy or snowy <strong>road</strong> surface.4.2 Dry or wet <strong>road</strong>wayIn <strong>the</strong> previously mentioned report from Road Research Laboratory [16], <strong>the</strong><strong>correlation</strong> <strong>between</strong> skid numbers <strong>and</strong> skidding accidents was investigated. Theskid-resistance was measured with <strong>the</strong> SRT pendulum, see figure 3.11, at siteswhere frequent skidding accidents had been reported in wet wea<strong>the</strong>r. Forcomparison, <strong>measurement</strong>s were also made on a sample of sites chosen at r<strong>and</strong>om.The distributions of <strong>the</strong> <strong>measurement</strong>s at <strong>the</strong> skidding accident sites <strong>and</strong> at <strong>the</strong>r<strong>and</strong>om sample of <strong>road</strong>s are shown in Figure 4.3; for <strong>the</strong> accident sites <strong>the</strong> meanskid-resistance was 45, <strong>and</strong> for <strong>the</strong> r<strong>and</strong>om sample it was 60. From <strong>the</strong>se<strong>measurement</strong>s, <strong>the</strong> relative likelihood of a surface being a skidding-accident sitecan be derived. This is shown in Figure 4.4, in which <strong>the</strong> curve was obtained bytaking <strong>the</strong> ratio of <strong>the</strong> percentage of results from <strong>the</strong> skidding-accident sites ineach range of values of skid-resistance to <strong>the</strong> corresponding figure from <strong>the</strong>r<strong>and</strong>om sample sites <strong>and</strong> plotting it against skid-resistance.3025Percentage201510500 5 10 15 20 25 30 35 40 45 50 55 60 65 70 75 80 85 90 95Skid-resistanceAccident sitesR<strong>and</strong>om sitesFigure 4.3 Distributions of skid-resistance measured at skidding-accident sites<strong>and</strong> samples of sites selected at r<strong>and</strong>om.<strong>VTI</strong> meddel<strong>and</strong>e 911A 29
Relative risk16141210864200 5 10 15 20 25 30 35 40 45 50 55 60 65 70 75 80 85 90 95Skid-resistanceRelative riskFigure 4.4 Relative rate of a surface being a skidding-accident site for differentvalues of skid-resistance.The rate becomes measurable below 65 <strong>and</strong> increases sharply below values of50 to 55. The form of <strong>the</strong> curve suggests that values below 55 are likely to beaccepted only on <strong>road</strong>s with easy traffic conditions, <strong>and</strong> values below 45 probablyindicate potentially slippery conditions whatever <strong>the</strong> <strong>road</strong> layout <strong>and</strong> trafficconditions.Schulze, Gerbaldi <strong>and</strong> Chavet [49] account for analyses from <strong>the</strong> Ne<strong>the</strong>rl<strong>and</strong>s,<strong>the</strong> Federal Republic of Germany, <strong>and</strong> France. In <strong>the</strong> Ne<strong>the</strong>rl<strong>and</strong>s all accidents onstate <strong>road</strong>s during two years, 1965 <strong>and</strong> 1966, have been used in a regressionanalysis. The accident rate was derived from <strong>the</strong> number of accidents during acertain period on a selected section of <strong>road</strong> <strong>and</strong> <strong>the</strong> total vehicle-kilometres over<strong>the</strong> same period <strong>and</strong> section. <strong>Friction</strong> numbers for each <strong>road</strong> section weremeasured by <strong>the</strong> Dutch st<strong>and</strong>ard test method (86% slip). Wet friction numberswere used for all accidents that occurred in wet wea<strong>the</strong>r, <strong>and</strong> dry friction numbersfor those accidents that occurred in dry conditions. Figure 4.5 shows <strong>the</strong>relationship <strong>between</strong> friction level <strong>and</strong> accident rate.30 <strong>VTI</strong> meddel<strong>and</strong>e 911A
Figure 4.5 Accident rate (mean <strong>and</strong> st<strong>and</strong>ard deviation) against friction level.In <strong>the</strong> Federal Republic of Germany [49] a regression analysis <strong>between</strong> frictionnumbers <strong>and</strong> accidents was based on <strong>the</strong> proportion of accidents that occurredunder wet conditions. In general, on most <strong>road</strong> sections <strong>the</strong> proportion ofaccidents in <strong>the</strong> wet, i.e.P w = (A w /A t ) × 100 (%)A w : Number of accidents in wet conditionsA t : Total number of accidents (in wet <strong>and</strong> dry conditions)varies <strong>between</strong> zero per cent <strong>and</strong> approximately 50 per cent <strong>and</strong> averages about 33per cent for <strong>the</strong> <strong>road</strong> network with slightly different figures from year to year. Ifon any particular section of <strong>road</strong> <strong>the</strong> proportion of wet-<strong>road</strong> accidents significantlyexceeds this range of percentages, <strong>the</strong>n this can be taken as an indication ofreduced traffic safety under wet conditions. The skid numbers (locked wheelbraking force coefficients) were measured at a speed of 80 km/h. Although <strong>the</strong>re<strong>VTI</strong> meddel<strong>and</strong>e 911A 31
is a large scatter in <strong>the</strong> percentage of wet-<strong>road</strong> accidents for each friction level, <strong>the</strong>general trend of <strong>the</strong> increasing percentage of wet-<strong>road</strong> accidents with <strong>the</strong>decreasing friction level is unmistakable, (Figure 4.6).Figure 4.6 Percentage of wet-<strong>road</strong> accidents against friction number.In France [49], skid-prone sites were compared with a r<strong>and</strong>om sample of sites,Figure 4.7. When <strong>the</strong> friction coefficient decreases, <strong>the</strong> relative proportion ofaccidents at skid-prone sites increases sharply. The braking force was measuredwith locked wheel.32 <strong>VTI</strong> meddel<strong>and</strong>e 911A
Figure 4.7 Histograms of locked wheel braking force coefficients on accidentsites <strong>and</strong> on r<strong>and</strong>omly selected sites.Griffin [18] accounts for a study of wet wea<strong>the</strong>r accidents. Several variableswere used as surrogates for vehicle dem<strong>and</strong> for friction in a multiple linearregressionmodel:ADT: average daily trafficACC: access (a st<strong>and</strong>ardised subjective scale of <strong>road</strong>way congestion)SN: skid number at 40 mphTW: proportion of time wetVM: mean traffic speedV: st<strong>and</strong>ard deviation of <strong>the</strong> speed distributionLN: lanes of traffic.<strong>VTI</strong> meddel<strong>and</strong>e 911A 33
Approximately 58 percent of <strong>the</strong> variance in wet accident rate (WAR) on highspeed<strong>road</strong>s (55 mph) could be accounted for by <strong>the</strong> following equation:WAR = -21.7 + 0.0009×ADT + 2.34×ACC - 0.40×SN + 286×TW + 1.32×LNApproximately 46 percent of <strong>the</strong> variance in WAR on low-speed <strong>road</strong>s couldbe accounted for by <strong>the</strong> following equation:WAR = -0.75 + 0.0001×ADT - 0.053×VM + 0.54×V + 0.69×ACC - 0.025×SN.(Note that <strong>the</strong> units of WAR are wet pavement accidents per mile per year.)No more relevant information about <strong>the</strong> equations was provided in <strong>the</strong>reference.In <strong>the</strong> Nordic TOVE project [21] – Traffic safety <strong>and</strong> <strong>the</strong> <strong>road</strong> surfaceproperties – <strong>the</strong> effects of <strong>the</strong> <strong>road</strong> surface friction on <strong>the</strong> accident rates werestudied. <strong>Friction</strong> data was, however, only obtained from Denmark, <strong>the</strong> frictionwas probably measured by <strong>the</strong> Stradograf. The tendency is that accident ratedecreases with increasing friction see Figure 4.8. The tendency is valid foraccidents with personal injuries as well as for accidents with only propertydamage. Figure 4.8 show <strong>the</strong> result for a two-lane, asphalt-paved <strong>road</strong>. However,deviations from this tendency were obtained for certain types of <strong>road</strong>s.987,8Accidents per 10 million vehicle km76543216,25,54,94,2400,4-0,49 0,50-0,59 0,60-0,69 0,70-0,79 0,80-0,89 0,90-1,00<strong>Friction</strong> numberFigure 4.8 Accident rates as a function of friction number. Police reportedaccidents.4.3 Winter <strong>road</strong> conditionsAssessing <strong>the</strong> accident rate for different icy or snowy <strong>road</strong>way conditions is avery complex task. There are often swift changes <strong>and</strong> short duration, so <strong>the</strong>friction may vary to a great extent with time as well as spatially – longitudinally<strong>and</strong> laterally on <strong>the</strong> <strong>road</strong>. The accident rate is to a high degree depending on <strong>the</strong>adaptation of <strong>the</strong> driver behaviour. Figure 4.9 is an attempt to explain <strong>the</strong> causalrelations in a b<strong>road</strong> outline.34 <strong>VTI</strong> meddel<strong>and</strong>e 911A
RoadwayappearanceDriverbehaviourAccident risk<strong>Friction</strong>perceivedactualFigure 4.9 Surface conditions, driver behaviour <strong>and</strong> accident rate.The friction perceived by <strong>the</strong> driver influence on his/her behaviour, but usuallyfar from <strong>the</strong> necessary extent, so <strong>the</strong> actual friction will have a strong influence on<strong>the</strong> resulting accident rate.A comprehensive survey by Öberg [59] comprised <strong>measurement</strong>s of frictionwith <strong>the</strong> SFT at specified states of <strong>the</strong> <strong>road</strong>. The results are displayed in Figures4.10 <strong>and</strong> 4.11. The friction span is usually very large within each specificcondition, often larger than variations <strong>between</strong> <strong>the</strong> mean values for differentconditions. A critical issue is if <strong>the</strong> tyres have contact with <strong>the</strong> pavement surface.If that is <strong>the</strong> case <strong>the</strong>n <strong>the</strong> friction number will be comparably high. Consequently,a coarser texture of <strong>the</strong> <strong>road</strong> surface often implies higher friction than smoo<strong>the</strong>rsurface. A striking example is illustrated in Figure 4.12, from Björketun et al.[14]. The <strong>road</strong>way condition is about 1 cm wet snow along <strong>the</strong> whole stretch. On<strong>the</strong> coarse double surface dressing <strong>the</strong>re is "bare-ground friction", while on <strong>the</strong>smooth asphalt concrete <strong>the</strong>re is "ice/snow friction".<strong>Friction</strong> <strong>and</strong> texture are closely related factors, but a literature review oftexture-related surveys is beyond <strong>the</strong> scope of this study. Instead, see for exampleWretling [56].Figure 4.10 Results of friction <strong>measurement</strong>s in wheel-paths for different <strong>road</strong>conditions. The mean <strong>and</strong> <strong>the</strong> confidence limits (95%) are illustrated as bars for<strong>the</strong> 15- <strong>and</strong> 50-percentiles (f 15 <strong>and</strong> f 50 ) of <strong>the</strong> distribution of friction values along<strong>the</strong> <strong>road</strong>. The arrows indicate maximum <strong>and</strong> minimum values.<strong>VTI</strong> meddel<strong>and</strong>e 911A 35
Figure 4.11 Results of friction <strong>measurement</strong>s <strong>between</strong> wheel-paths for different<strong>road</strong> conditions. The mean <strong>and</strong> <strong>the</strong> confidence limits (95%) are illustrated as barsfor <strong>the</strong> 15- <strong>and</strong> 50-percentiles (f 15 <strong>and</strong> f 50 ) of <strong>the</strong> distribution of friction valuesalong <strong>the</strong> <strong>road</strong>. The arrows indicate maximum <strong>and</strong> minimum values.Figure 4.12 <strong>Friction</strong> <strong>measurement</strong>s on two types of surfaces. 1 cm wet snow, airtemperature +2 o C. Mean friction values over <strong>the</strong> last 300 m passed are displayedat <strong>the</strong> top of <strong>the</strong> strip.36 <strong>VTI</strong> meddel<strong>and</strong>e 911A
A number of surveys of friction numbers for different <strong>road</strong> conditions, mainly<strong>the</strong> one mentioned above, <strong>and</strong> Öberg <strong>and</strong> Gregersen [61], can be summarised asfollows:Dry bare surface 0.8–1.0Wet, bare surface 0.7–0.8Packed snow 0.20–0.30Loose snow/slushBlack ice 0.15–0.30Loose snow on black ice 0.15–0.25Wet black ice 0.05–0.100.20–0.50 (<strong>the</strong> higher value when <strong>the</strong>tyres are in contact with <strong>the</strong> pavement)The friction numbers were obtained by skiddometer <strong>measurement</strong>s with 17%slip (BV11 <strong>and</strong> SFT).There are few surveys where <strong>the</strong> accident rates at winter conditions areestimated as a function of <strong>the</strong> friction number. The reasons are quite obvious:<strong>the</strong>re is never any information of <strong>the</strong> prevailing friction at <strong>the</strong> accident, or eveninformation of <strong>the</strong> distribution of friction numbers on different <strong>road</strong>s during <strong>the</strong>winter season. This would call for continuous measuring resources that are notavailable. Instead, visual observations of <strong>the</strong> <strong>road</strong>way condition are used.A sound hypo<strong>the</strong>sis is that prevailing friction is a major factor influencing on<strong>the</strong> risk level. Then, if <strong>the</strong> accident rate is assessed on <strong>the</strong> basis of visualobservations of <strong>the</strong> <strong>road</strong>way condition, consequently large risk variations withineach specified condition should be expected.Ano<strong>the</strong>r matter is <strong>the</strong> durability <strong>and</strong> frequency of winter <strong>road</strong> conditions thatare very important for <strong>the</strong> adaptation of driver behaviour. In <strong>the</strong> MINSALTproject, Öberg et al. [62], an unsalted test area (Gotl<strong>and</strong>) was compared with asalted control area (Västervik). In Figure 4.13 <strong>the</strong> number of accidents <strong>and</strong> injuresper accident are plotted against <strong>the</strong> number of days with different wea<strong>the</strong>r/<strong>road</strong>conditions. States of short durability, such as wet <strong>road</strong>s that freeze or frost(especially in <strong>the</strong> autumn) are very risky, but can be effectively controlled by salt.<strong>VTI</strong> meddel<strong>and</strong>e 911A 37
No. of accidentsper dayNo. of personsinjured peraccidentNo. of days in different wea<strong>the</strong>r/<strong>road</strong> conditionsNo. of accidentsper dayNo. of personsinjured peraccidentNo. of days in different wea<strong>the</strong>r/<strong>road</strong> conditionsO = bare groundW = bare ground, snowfall < 2 mm in melted formQ = bare ground, wet snowfallR = bare ground, snowfall > 2 mm in melted formX = ice/snow, snowfall < 2mm in melted formN = ice/snow, wet snowfallK = ice/snow, snowfall > 2 mm in melted formS = ice/snow, dry, coldF = wet <strong>road</strong> that freezesB = frost in autumnT = frost in winterFigure 4.13 Accidents reported to <strong>the</strong> police on Gotl<strong>and</strong> (unsalted <strong>road</strong>s) <strong>and</strong>its control area Västervik during <strong>the</strong> winters of 1986/87 to 1988/89, distributedaccording to <strong>the</strong> categories "worst wea<strong>the</strong>r/<strong>road</strong> conditions" during one day.The <strong>road</strong>way conditions are very different in Sweden <strong>between</strong> <strong>the</strong> nor<strong>the</strong>rn <strong>and</strong>sou<strong>the</strong>rn areas, which can be noticed in <strong>the</strong> accident rates. In this context, ano<strong>the</strong>rmatter should be mentioned. The ice surface temperature affect <strong>the</strong> friction to ahigh extent: <strong>the</strong> higher <strong>the</strong> temperature, <strong>the</strong> more slippery <strong>road</strong>, e.g. at black iceconditions. In Nor<strong>the</strong>rn Sweden, black ice conditions may prevail for weeks atlow temperature, while <strong>the</strong> friction number is comparatively high. Whitehurst <strong>and</strong>Ivey [55] state a relation <strong>between</strong> locked-wheel stopping distance <strong>and</strong> ice surfacetemperature. The relation is shown in Figure 4.14, as a multiplier for stoppingdistance with reference to <strong>the</strong> stopping distance at 25 o F (-4 °C).38 <strong>VTI</strong> meddel<strong>and</strong>e 911A
Figure 4.14 Multiplier for locked-wheel stopping distance (referencetemperature is 25 o F = -4 °C, 0 °F = -18 °C).Accidents reported to <strong>the</strong> police, traffic <strong>measurement</strong>s, <strong>and</strong> observations of<strong>road</strong> conditions were used for assessing <strong>the</strong> accident rate at different conditions.Table 4.1 shows accident rates, from Wallman et al. [53], <strong>the</strong> assessments werebased on data from Nilsson [34].Table 4.1 Accident rates at different conditions (accidents per million axle-pairkilometres).Bare <strong>road</strong>,all yearBare <strong>road</strong>,summerOctober - AprilBare <strong>road</strong>Ice/snowNor<strong>the</strong>rnSwedenCentralSwedenSou<strong>the</strong>rnSwedenDaylight 0.37 0.41 0.28 1.07Darkness 0.83 1.38 0.60 1.43Daylight 0.46 0.51 0.39 2.67Darkness 1.01 1.69 0.76 3.30Daylight 0.55 0.59 0.49 5.29Darkness 1.06 1.48 0.91 7.93The accident rates in Table 4.1 are averages over <strong>the</strong> year or over <strong>the</strong> winterseason, so it is not possible to associate <strong>the</strong>m with any friction numbers. However,<strong>the</strong> geographical differences are clearly visualised.Data on winter <strong>road</strong> maintenance measures, accidents reported to <strong>the</strong> police,<strong>and</strong> vehicle mileage was used by Sävenhed [50] to estimate <strong>the</strong> accident ratebefore <strong>and</strong> after maintenance measures. Figure 4.15 shows a comparison <strong>between</strong>de-icing <strong>and</strong> anti-icing (precautionary) actions with salt. De-icing actions areundertaken when <strong>the</strong> friction has decreased, while precautionary actions shouldpreserve good friction. The increased risk for <strong>the</strong> de-icing actions is probablyentirely related to impaired friction. Precautionary actions imply much lessvariations in <strong>the</strong> accident rate.<strong>VTI</strong> meddel<strong>and</strong>e 911A 39
Figure 4.15 Accident rate (accidents per million axle-pair kilometres) during <strong>the</strong>hours before <strong>and</strong> after salting.Nation-wide observations of <strong>road</strong>way conditions were done during <strong>the</strong> winterseasons 1993/94 to 1996/97. This data was used toge<strong>the</strong>r with accidents reportedto <strong>the</strong> police <strong>and</strong> <strong>the</strong> mileage on different <strong>road</strong> categories to assess <strong>the</strong> accidentrates at <strong>the</strong> same <strong>road</strong>way conditions as were used by <strong>the</strong> police, Wallman [52].The risk was assessed for each <strong>road</strong> maintenance class in four climate regions.Table 4.2 shows <strong>the</strong> result across Sweden for <strong>the</strong> six different <strong>road</strong>way conditions.The maintenance classes are grouped into A1-A4, which are <strong>road</strong>s treated withsalt, normally <strong>the</strong>y shall be free from ice <strong>and</strong> snow, <strong>and</strong> into B1-B2, which are<strong>road</strong>s where s<strong>and</strong>ing or gritting is <strong>the</strong> normal skid-prevention treatment. Theaccident rate is estimated for all accidents (except wildlife), <strong>and</strong> accidents withkilled or seriously wounded, respectively.40 <strong>VTI</strong> meddel<strong>and</strong>e 911A
Table 4.2 Accident rates at different <strong>road</strong> conditions across Sweden.Roadway All <strong>road</strong>s A1 – A4 B1 – B2condition All D+SI All D+SI All D+SIDry, bare<strong>road</strong>0.25 0.02 0.25 0.02 0.20 0.03Wet/moist<strong>road</strong>0.30 0.03 0.30 0.03 0.30 0.03Loosesnow/slush1.40 0.14 1.60 0.15 0.90 0.12Thick ice/packed snow0.70 0.07 1.90 0.13 0.55 0.05Black ice/hoarfrost1.30 0.13 2.80 0.26 0.55 0.07In <strong>the</strong> Norwegian Veg-grepsprosjektet [7] – <strong>the</strong> Road-Grip Project – data froma survey by Sakshaug <strong>and</strong> Vaa [45] was used. Comprehensive friction<strong>measurement</strong>s were done, <strong>and</strong> also <strong>road</strong>way observations. Accident rates fordifferent <strong>road</strong>way conditions as well as for different friction intervals wasassessed which are displayed in Table 4.3 <strong>and</strong> 4.4. The risk unit is accidents withpersonal injuries per million vehicle kilometres. Even in this comprehensivestudy, <strong>the</strong> friction intervals are ra<strong>the</strong>r large.Table 4.3 Accident rates (personal injuries per million vehicle kilometres) atdifferent <strong>road</strong>way conditions.Roadway conditionAccident rateDry bare <strong>road</strong>way, winter 0.12Wet bare <strong>road</strong>way, winter 0.16Slush 0.18 *Loose snow 0.30Ice 0.53Hoarfrost 0.53Packed snow 0.31Bare ruts 0.12 *Black ice in ruts 0.30 *Dry bare <strong>road</strong>way, summer 0.14Wet bare <strong>road</strong>way, summer 0.18* Unreliable figure<strong>VTI</strong> meddel<strong>and</strong>e 911A 41
Table 4.4 Accident rates (personal injuries per million vehicle kilometres) atdifferent friction intervals.<strong>Friction</strong> intervalAccident rate< 0.15 0.800.15 – 0.24 0.550.25 – 0.34 0.250.35 – 0.44 0.204.4 CommentThe relation <strong>between</strong> friction <strong>and</strong> accident rate is certainly no easy problem toexplain. Many different factors pertaining to <strong>the</strong> <strong>road</strong> environment – in addition to<strong>the</strong> friction – affect <strong>the</strong> driver behaviour, as was indicated in chapter 4.1. Thedriver behaviour variability is of great importance for <strong>the</strong> accident rate.The complexity of <strong>the</strong> problem is especially pronounced at winter conditions,as has been found in this review, similar-looking <strong>road</strong>way conditions may havevery different friction numbers. Also, <strong>the</strong> friction may vary both across <strong>and</strong> along<strong>the</strong> <strong>road</strong>. <strong>Friction</strong> conditions are much more stable at dry or wet bare <strong>road</strong> surface.Surveys of winter accident rates thus imply very varying results, but alwayswith much larger risks than at bare <strong>road</strong> conditions. Future studies must havemuch closer control of factors as <strong>road</strong>way conditions, friction coefficients, <strong>and</strong>exposure etc. to make a more detailed assessment of accident rates possible. Thisinvolves frequent observations of <strong>the</strong> <strong>road</strong>way condition <strong>and</strong> extensive friction<strong>measurement</strong>s, as well as a much more detailed description of each accident(crash investigations).42 <strong>VTI</strong> meddel<strong>and</strong>e 911A
5 References1. Instructions for using <strong>the</strong> portable skid-resistance tester. Road note 27.Road Research Laboratory. Harmondsworth. 1969.2. Underlag för driftplaneringen. 3. Effekter. Service ochunderhållsåtgärder. P017. Statens Vägverk. Borlänge. 1983.3. Skidding resistance of In-Service Trunk Roads. Departmental St<strong>and</strong>ardHD 15/87. Department of Transport. London. 1987.4. VV Metodbeskrivning 82:1983 Termoplastisk vägmarkeringsmassa.Bestämning av friktion. Dokument 1987:143. Vägverket. Borlänge. 1987.5. VV metodbeskrivning 104:1990. Bestämning av friktion på belagdvägyta. Publikation 1990:17. Vägverket. Borlänge. 1990.6. Metodbeskrivning 110:1996. Bestämning av friktion på vinterväglagmed retardationsmätare. Publikation 1996:15. Vägverket. Borlänge. 1996.7. Veg-grepsprosjektet, samlerapport. Intern rapport nr. 1994. Statensvegvesen Vegdirektoratet. Oslo. 1997.8. Projekt vintermätbil för FoU-ändamål. Publ 1998:89. Vägverket.Borlänge. 1998.9. Allmän teknisk beskrivning för vägkonstruktion, ATB VÄG.Publikation 2000:111. Vägverket, Vägavdelningen. Borlänge. 2000.10. Investigation of PIARC testtyres 1998. Instituut voor Materiaal- enWegbouwkundig Onderzoek, KOAC-WMD. Apeldoorn. 2000.11. Arnberg P W & Sjögren L: Nordiska friktionsmätare. <strong>VTI</strong> Meddel<strong>and</strong>e333. Statens Väg- och Trafikinstitut. Linköping. 1983.12. Bachmann T: Wechselwirkungen im Prozeß der Reibung zwischenReifen und Fahrbahn. Fortschritt-Berichte VDI Reihe 12 360. FachbegietFahrzeugtechnik. Darmstadt. 1998.13. Bergstr<strong>and</strong> B, Eggren E, Jakobsen P, Penttinen O, Stigberg B & Öberg G:Tillståndsmätning drift och underhåll. Rapport 8/1996. NordiskaVägtekniska Förbundet. Utskott 41: Drift och Underhåll. Borlänge. 1996.14. Björketun U, Karlsson J-Å & Öberg G: Försök med osaltade vägarvintern 1982/83. Inverkan på väglaget och konsekvenser för trafikantenoch väghållaren. <strong>VTI</strong> meddel<strong>and</strong>e 363. Väg- ochtransportforskningsinstitutet. Linköping. 1984.<strong>VTI</strong> meddel<strong>and</strong>e 911A 43
15. Centrell P: Friktion på vägmarkering. En jämförelse mellan SRTpendelnoch <strong>VTI</strong>s PFT. <strong>VTI</strong> Notat Nr 57-95. Väg- ochtransportforskningsinstitutet. 1995.16. Giles C G, Sabey B E & Cardew K H F: Development <strong>and</strong> Performanceof <strong>the</strong> Portable Skid-Resistance Tester. Road Research Technical PaperNo. 66. Road Research Laboratory. London. 1964.17. Gillespie T D: Fundamentals of Vehicle Dynamics. Society of AutomotiveEngineers. Warrendale. 1992.18. Griffin L: Accident Data Relationships. The Influence of RoadwaySurface Discontinuities on Safety. A State-of-<strong>the</strong>-Art Report.Transportation Research Board. Washington, D.C. 1984.19. Hammond K R, Stewart T R, Brehmer B & Steinmann D O: SocialJudgement Theory. Judgement <strong>and</strong> Decision Making. CambridgeUniversity Press. Cambridge. 1986.20. Heinijoki H: Kelin kokemisen, rengaskunnon ja rengustyypin vaikutusnopenskäyttäytymiseen.(Influence of <strong>the</strong> Type <strong>and</strong> Condition of Tyres<strong>and</strong> Drivers' Perceptions of Road conditions on Driving Speed.).FinnRA reports 19/1994. Finnish Road Administration. Helsinki. 1994.21. Hemdorff S, Leden L, Sakshaug K, Salusjärvi M & Sch<strong>and</strong>ersson R:Trafiksäkerhet och vägytans egenskaper (TOVE). Slutrapport.Tiedotteita 1075. VTT. 1989.22. Henry J J: Comparison of <strong>the</strong> <strong>Friction</strong> Performance of a Passenger CarTire <strong>and</strong> <strong>the</strong> ASTM St<strong>and</strong>ard test Tires. <strong>Friction</strong>al Interaction of Tire <strong>and</strong>Pavement. Akrin-Fairlawn, Ohio. 1981.23. Henry J J, Anderson D A & Hayhoe G F: Skid resistance of pavementmarking materials, volume I. FHWA/RD-80/199. The PennsylvaniaTransportation Institute. 1981.24. Hosking J R & Tubey L W: Measurement of skiding resistance. Part V.The precision of SCRIM <strong>measurement</strong>s. TRRL Supplementary Report642. Transport <strong>and</strong> Road Research Laboratory. Crowthorne. 1981.25. Hosking J R & Woodford G C: Measurement of skid resistance. Part III.Factors affecting SCRIM <strong>measurement</strong>s. TRRL Laboratory Report 739.Transport <strong>and</strong> Road Research Laboratory. Crowthorne. 1976.26. Hosking J R & Woodford G C: Measurement of skidding resistance: PartI. Guide to <strong>the</strong> use of SCRIM. TRRL Report LR 737. Transport <strong>and</strong> RoadResearch Laboratory. Crowthorne. 1976.27. Höbeda P: En State-of.<strong>the</strong>-art-rapport med avseende på svenskaförhåll<strong>and</strong>en: Polering och nötning av stenmaterialet i44 <strong>VTI</strong> meddel<strong>and</strong>e 911A
slitlagerbeläggning - inverkan på friktionen hos vägbeläggning. <strong>VTI</strong>notat 18-1997. Väg- och Transportforskningsinstitutet. Linköping. 1997.28. Jacobsen T & Höbeda P: Polering av asfaltbeläggning -friktionsmätningar hösten 1996. <strong>VTI</strong> notat 11-1997. Väg- ochTransportforskningsinstitutet. Linköping. 1997.29. Kummer H W: Unified Theory of Rubber <strong>and</strong> Tire <strong>Friction</strong>. EngineeringResearch Bulletin B-94. The Pennsylvania State University, Department ofMechanical Engineering. Pennsylvania. 1966.30. Lund B: <strong>Friction</strong> test. Comparative testing with 3 different equipmentscarried out during <strong>the</strong> summer 1996. Report 82. Road Directorate, DanishRoad Institute. 1997.31. Lundkvist S-O & Lindén S-Å: Road marking friction - a comparison<strong>between</strong> <strong>the</strong> SRT pendulum <strong>and</strong> <strong>the</strong> <strong>VTI</strong> Portable <strong>Friction</strong> Tester. <strong>VTI</strong>Notat Nr 65A-1994. Väg- och transportforskningsinstitutet. Linköping.1994.32. Meyer W E, Hegmon R R & Gillespie T D: Locked-Wheel Pavement SkidTester - Correlation <strong>and</strong> Calibration Techniques. National CooperativeHighway Research Program Report 151. Transportation Research Board.Washington, D.C. 1974.33. Möller S, Espell J, Lindström L, Nordström O, S<strong>and</strong>ell P, Ulegård C-H &Wretling P: Projekt Vintermätbil för FoU-ändamål 1998-1999. <strong>VTI</strong>meddel<strong>and</strong>e 877-1999. Väg- och transportforskningsinstitutet. Linköping.1999.34. Nilsson G: Olyckskvot som trafiksäkerhetsmått. Olyckskvotensvariation under olika väglags- och ljusförhåll<strong>and</strong>en. <strong>VTI</strong> rapport 73.Statens väg- och trafikinstitut. Linköping. 1976.35. Nordström O: Friktionsmätutrustning "Twin <strong>Friction</strong> Tester" BV14.KFB & <strong>VTI</strong> forskning/research 18:1. Väg- och transportforskningsinstitutet.Linköping. 1996.36. Nordström O: Development <strong>and</strong> validation of BV14, a new twin trackfixed slip friction tester for winter <strong>road</strong> maintenance monitoring inSweden. Xth PIARC International Winter Road Congress. Luleå, Sweden.1998.37. Nordström O: Correlation test <strong>between</strong> SARSYS Saab 9-5 WagonSurface <strong>Friction</strong> Tester <strong>and</strong> <strong>VTI</strong> Safegate Saab 9000 SFT. Test ReportDnr 605/99-8. Swedish Road <strong>and</strong> Transport Research Institute. Linköping.1999.<strong>VTI</strong> meddel<strong>and</strong>e 911A 45
38. Nordström O & Gustavsson L-E: Personbilsdäcks bromsfriktion på våtasfaltbeläggning. <strong>VTI</strong> notat 61-1996. Väg- ochtransportforskningsinstitutet. Linköping. 1996.39. Nordström O & Åström H: Upgrading of <strong>VTI</strong> friction test vehicle BV12for combined braking <strong>and</strong> steering tests under aquaplaning <strong>and</strong> winterconditions. International Colloquium on Vehicle Tyre Road Interaction.Florence. 2001.40. Ohlsson E: Friktionsmätvagn BV11: H<strong>and</strong>bok. <strong>VTI</strong> Meddel<strong>and</strong>e 157.Statens väg- och transportforskningsinstitut. Linköping. 1979.41. Ohlsson E, Formgren C & Nordström O: Friktion i Vägsammanhang -Teorier och praktiska frågor. Internrapport 94. Statens Väg- ochTrafikinstitut. 1972.42. Roine M: Kuljettaja käyttäytyminen kaarreja jonoajossa. (DriverBehaviour in Sharp Curves <strong>and</strong> Queues on Main Roads.). FinnRAreports 87/1993. Finnish Road Administration. Helsinki. 1993.43. Ruud H H: Kjørefart på saltede och usaltede veger: målinger i Akershusog Vestfold 1980 og 1981. Transportøkonomisk Institutt. Oslo. 1981.44. Saastamoinen K: Kelin vaikutus ajokäyttäytymiseen ja liikenne virranominaisuuksin. (Effect of Road Conditions on Driving Behaviour <strong>and</strong>Properties of Traffic Flow.). FinnRA reports 80/1993. Finnish RoadAdministration. Helsinki. 1993.45. Sakshaug K & Vaa T: Salting og trafikksikkerhet. Saltingens effekt påulykker og kjørefart. Statens vegvesen Vegdirektoratet. Oslo. 1995.46. S<strong>and</strong>berg U: Influnece of Road Surface Texture on TrafficCharacteristics Related to Environment, Economy <strong>and</strong> Safety. <strong>VTI</strong>notat 53A-1997. Swedish National Road <strong>and</strong> Transport Research Institute.Linköping. 1997.47. S<strong>and</strong>berg U & Ejsmont J A: Noise emission, friction <strong>and</strong> rollingresistance of car tires - Summary of an experimental study. NationalConference on Noise Control Engineering. California, USA. 2000.48. Schmidt B: Friktionsmålinger. Sammenlignende målinger mellemROAR och Stradograf. Rapport 90. Vejdirektoratet, Vejteknisk Institut.1999.49. Schulze K H, Gerbaldi A & Chavet J: Skidding Accidents, <strong>Friction</strong>Numbers, <strong>and</strong> <strong>the</strong> Legal Aspects Involved. Skidding Accidents.Transportation Research Record 623. Transportation Research Board.Washington, D.C. 1976.46 <strong>VTI</strong> meddel<strong>and</strong>e 911A
50. Sävenhed H: Relation Between Winter Road Maintenance <strong>and</strong> RoadSafety. <strong>VTI</strong> rapport 399A. Statens väg- och transportforskningsinstitut.Linköping. 1995.51. Wallman C-G: Driver Behaviour on Winter Roads, a Driving SimulatorStudy. <strong>VTI</strong> rapport 419A. Statens väg- och transportforskningsinstitut.Linköpin. 1997.52. Wallman C-G: Olycksrisker vid olika väglag vintern 1996/97. <strong>VTI</strong> notat36-1999. Statens väg- och transportforskningsinstitut. Linköping. 1999.53. Wallman C-G, Wretling P & Öberg G: Effects of Winter RoadMaintenance. State-of-<strong>the</strong>-art. <strong>VTI</strong> rapport 423A. Väg- ochtransportforskningsinstitutet. Linköping. 1997.54. Wambold J C, Antle C E, Henry J J & Rado Z: Interantional PIARCexperiment to compare <strong>and</strong> harmonize texture <strong>and</strong> skid resistance<strong>measurement</strong>s. 01.04.T. PIARC. 1995.55. Whitehurst E & Ivey D: Surface Contaminants. The Influence ofRoadway Surface Discontinuities on Safety. A State-of-<strong>the</strong>-Art Report.Transportation Research Board. Washington, D.C. 1984.56. Wretling P: Relationship <strong>between</strong> <strong>the</strong> functional properties of <strong>road</strong>surface <strong>and</strong> traffic safety. A state-of -<strong>the</strong>-art report. <strong>VTI</strong> notat 32A-1996. Väg- och transportforskningsinstitutet. Linköping. 1996.57. Åström H: Utvärdering av PFT som friktionsmätare förvägmarkeringsytor. <strong>VTI</strong> notat 45-2000. Statens väg- ochtransportforskningsinstitut. 2000.58. Öberg G: Effekter av s<strong>and</strong>ning. Trafik och friktionsstudier. <strong>VTI</strong> rapport164. Väg- och transportforskningsinstitutet. Linköping. 1978.59. Öberg G: Friktion och reshastighet på vägar med olikavinterväghållning. <strong>VTI</strong> rapport 218. Statens väg- och trafikinstitut.Linköping. 1981.60. Öberg G: Vädrets och väglagets inverkan på personbilshastigheten. <strong>VTI</strong>notat No 62. Statens väg- och transportforskningsinstitut. Linköping. 1994.61. Öberg G & Gregersen N P: MINSALT. Försök med osaltad väg iVästerbottens län. <strong>VTI</strong> meddel<strong>and</strong>e 636. Statens väg- ochtransportforskningsinstitut. Linköping. 1991.62. Öberg G, Gustafson K & Axelson L: Effektivare halkbekämpning medmindre salt. MINSALT-projektets huvudrapport. <strong>VTI</strong> rapport 369. Vägochtransportforskningsinstitutet. Linköping. 1991.<strong>VTI</strong> meddel<strong>and</strong>e 911A 47